
An In-Hospital Mortality Risk Model for Elderly Patients Undergoing Cardiac Valvular Surgery Based on LASSO-Logistic Regression and Machine Learning
 ,
,
Abstract
:1. Introduction
2. Materials and Methods
2.1. Study Population
2.2. Definitions of Parameters
2.3. Data Collecting
2.4. Statistical Analysis
3. Results
3.1. Perioperative Data
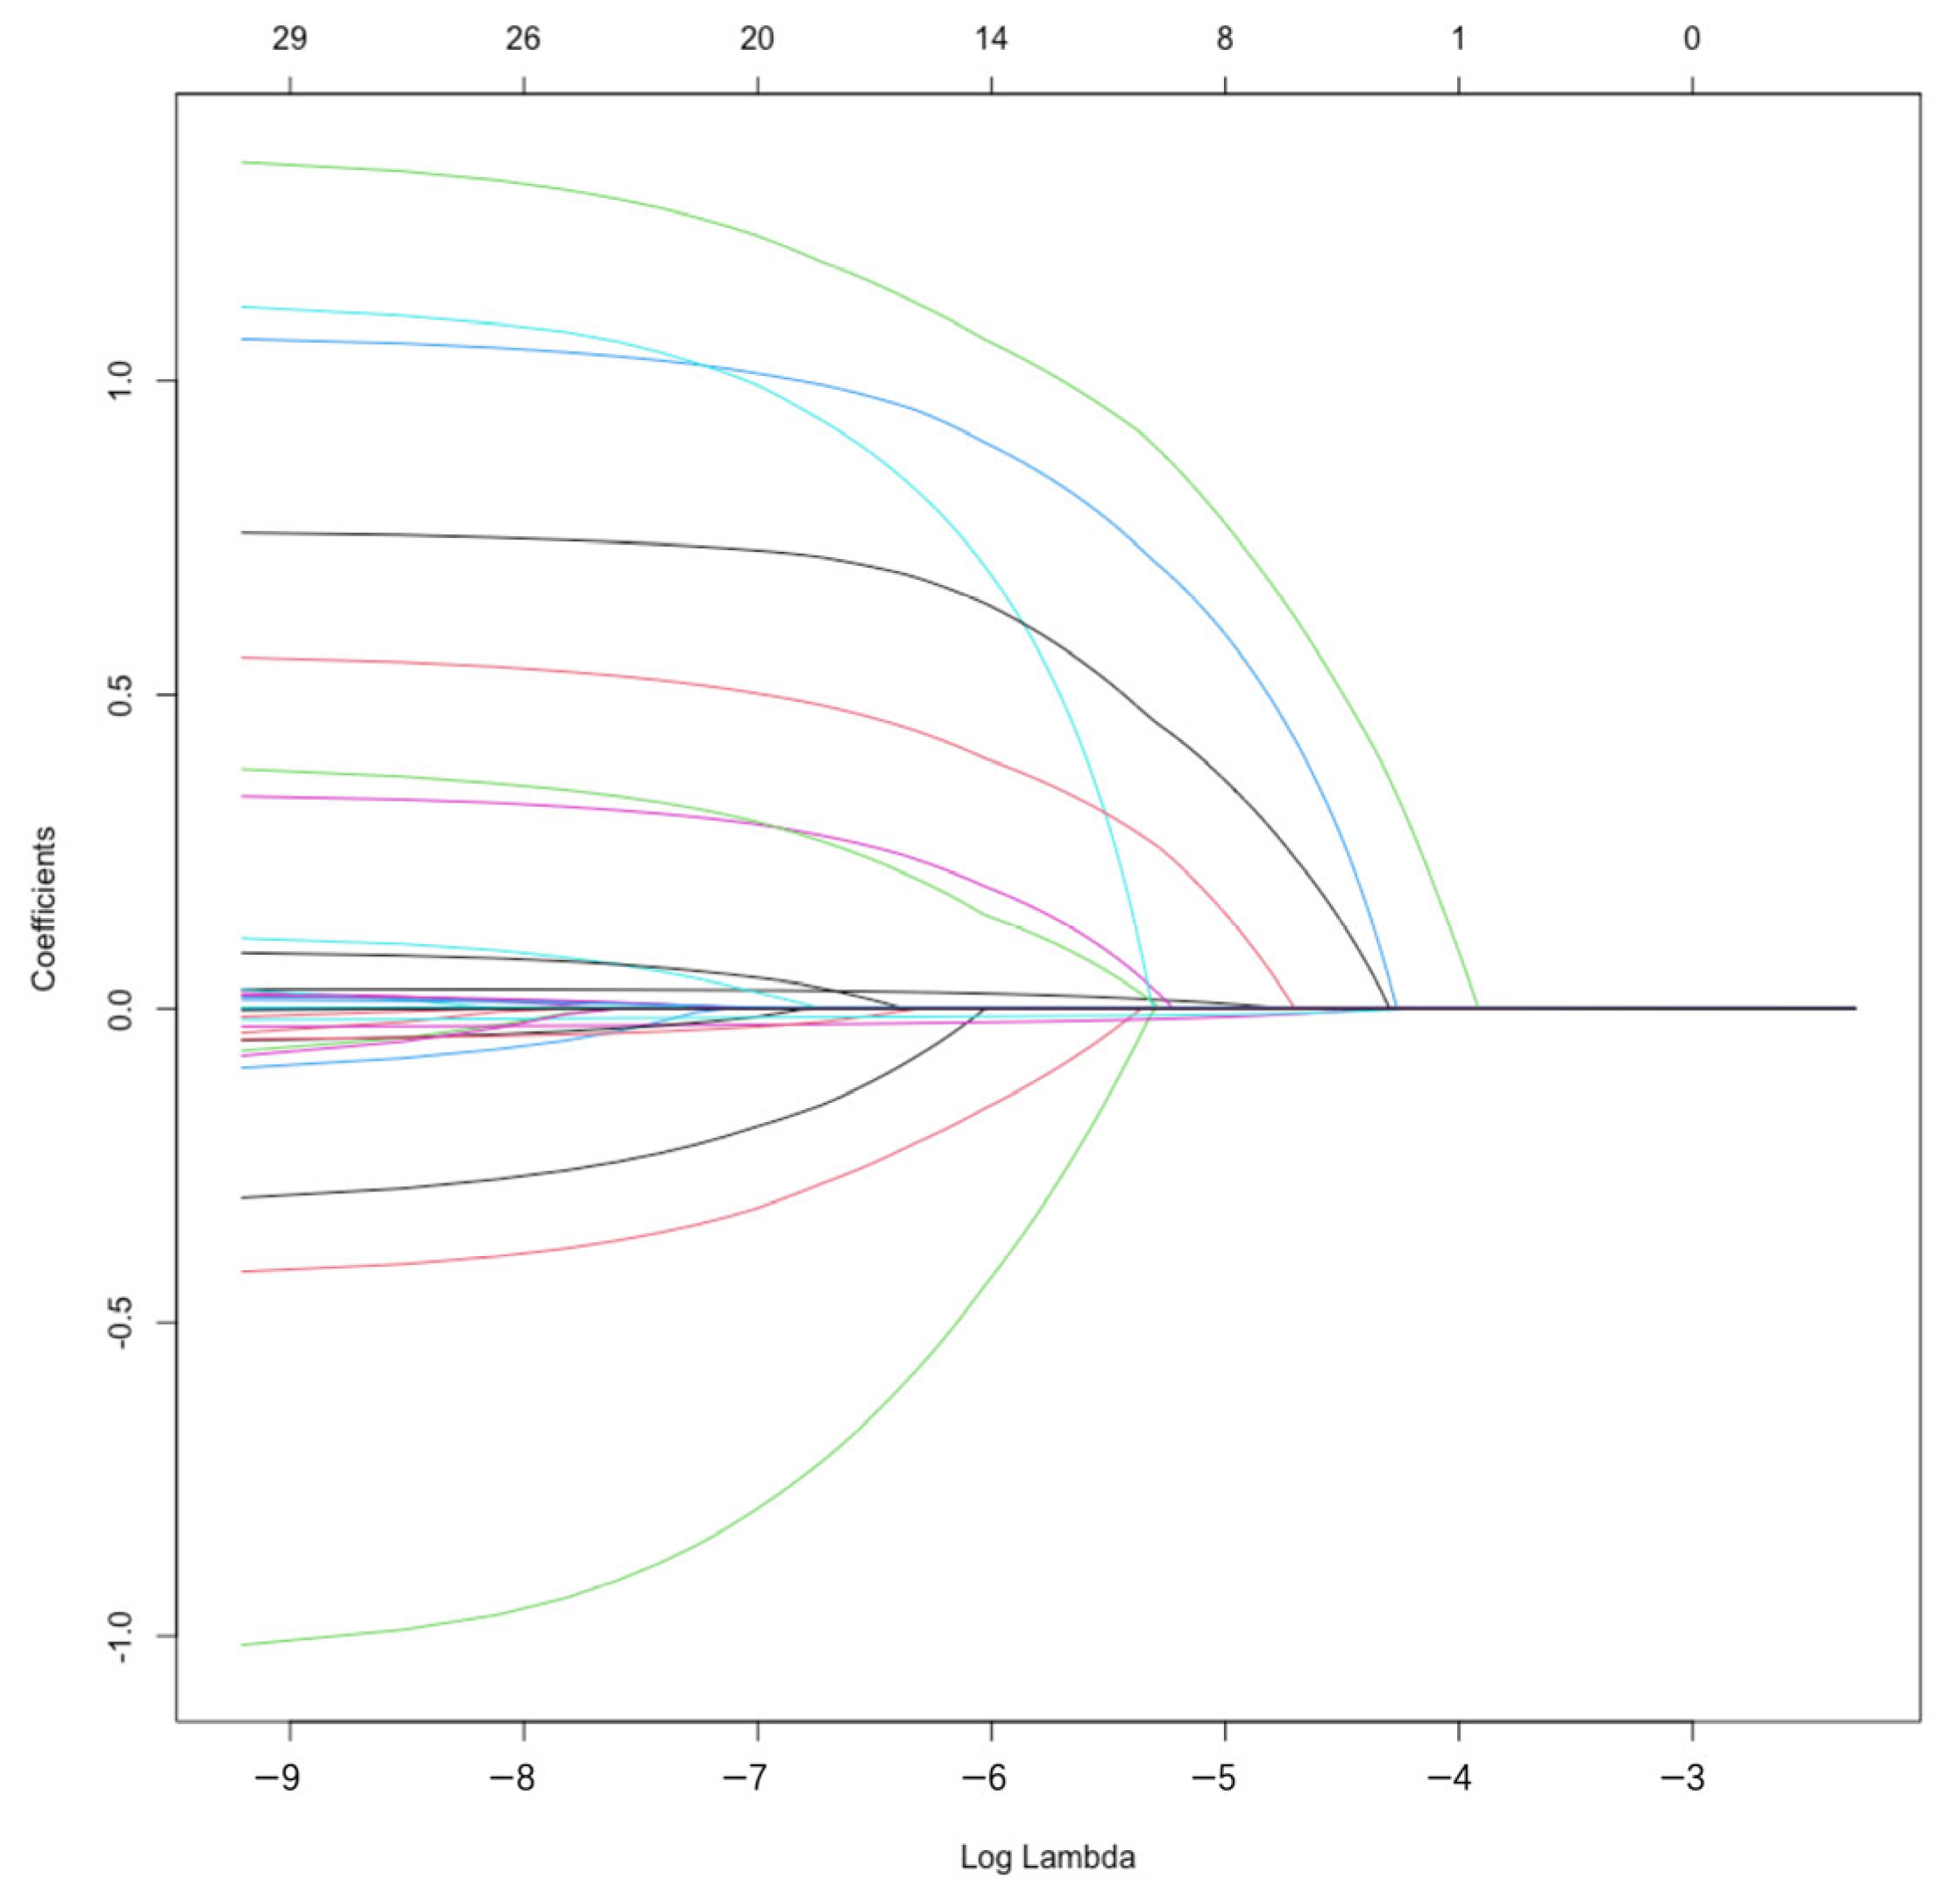
3.2. Screening Results of Variables of the Prediction Models
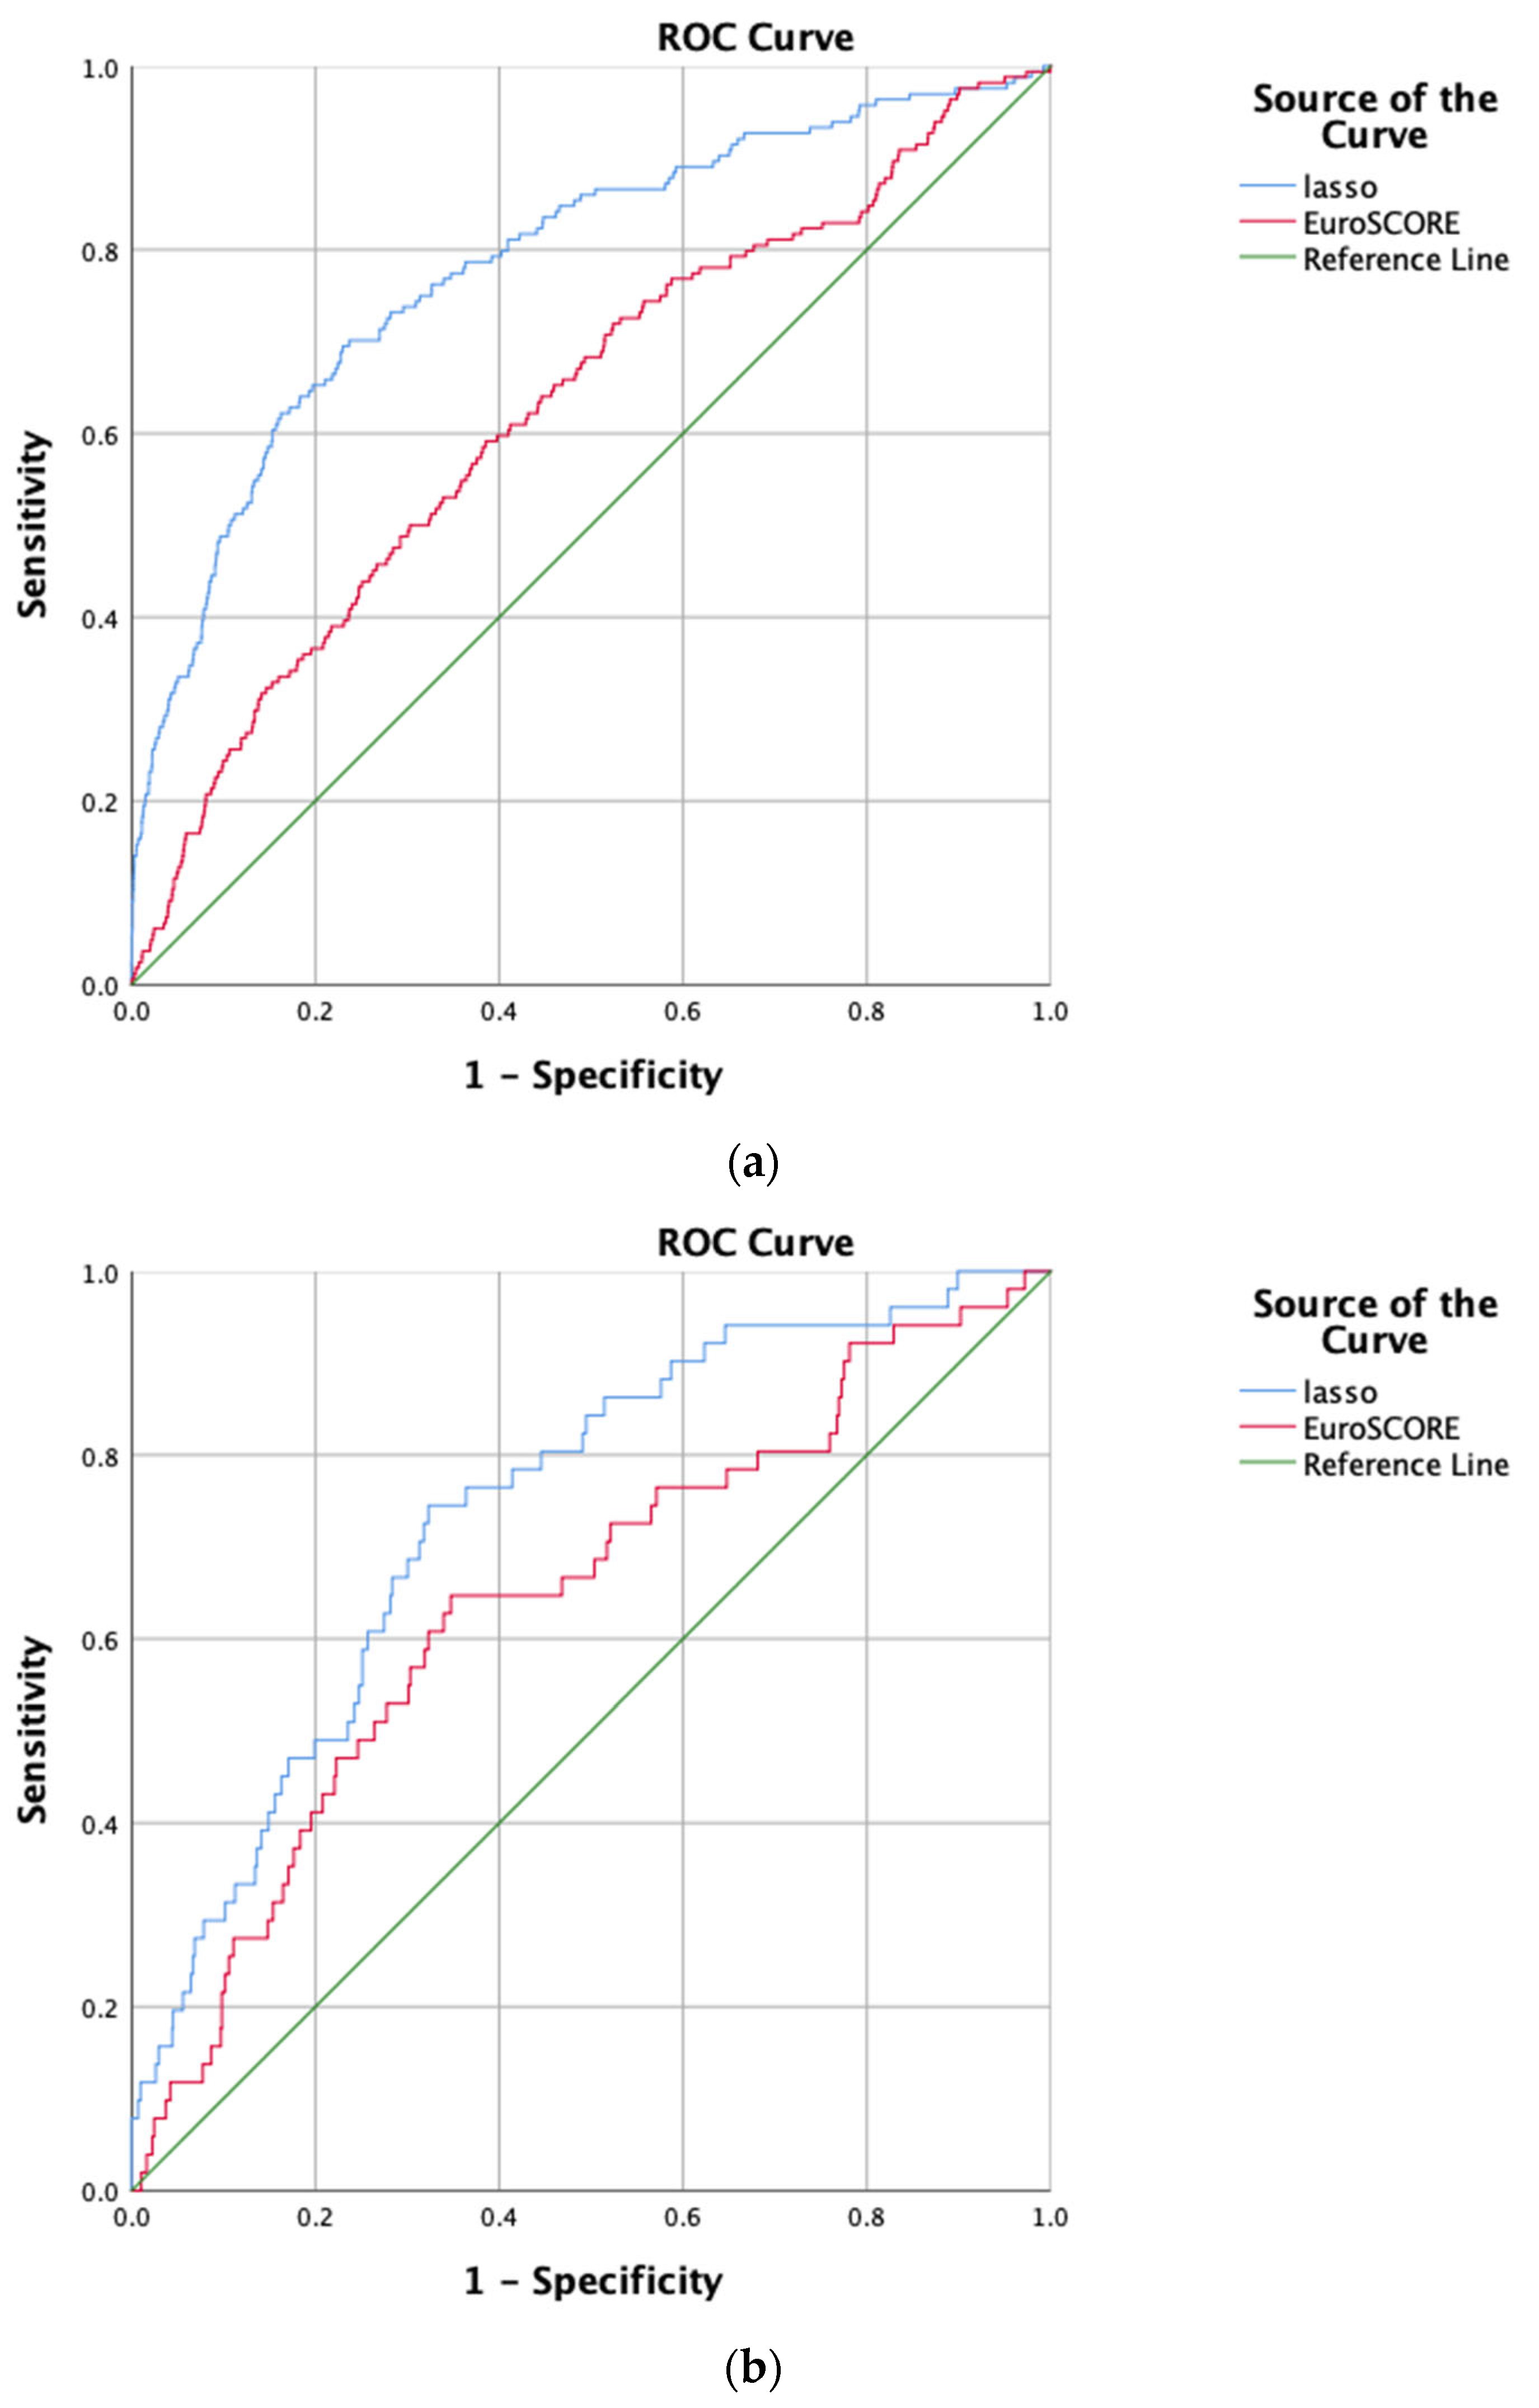
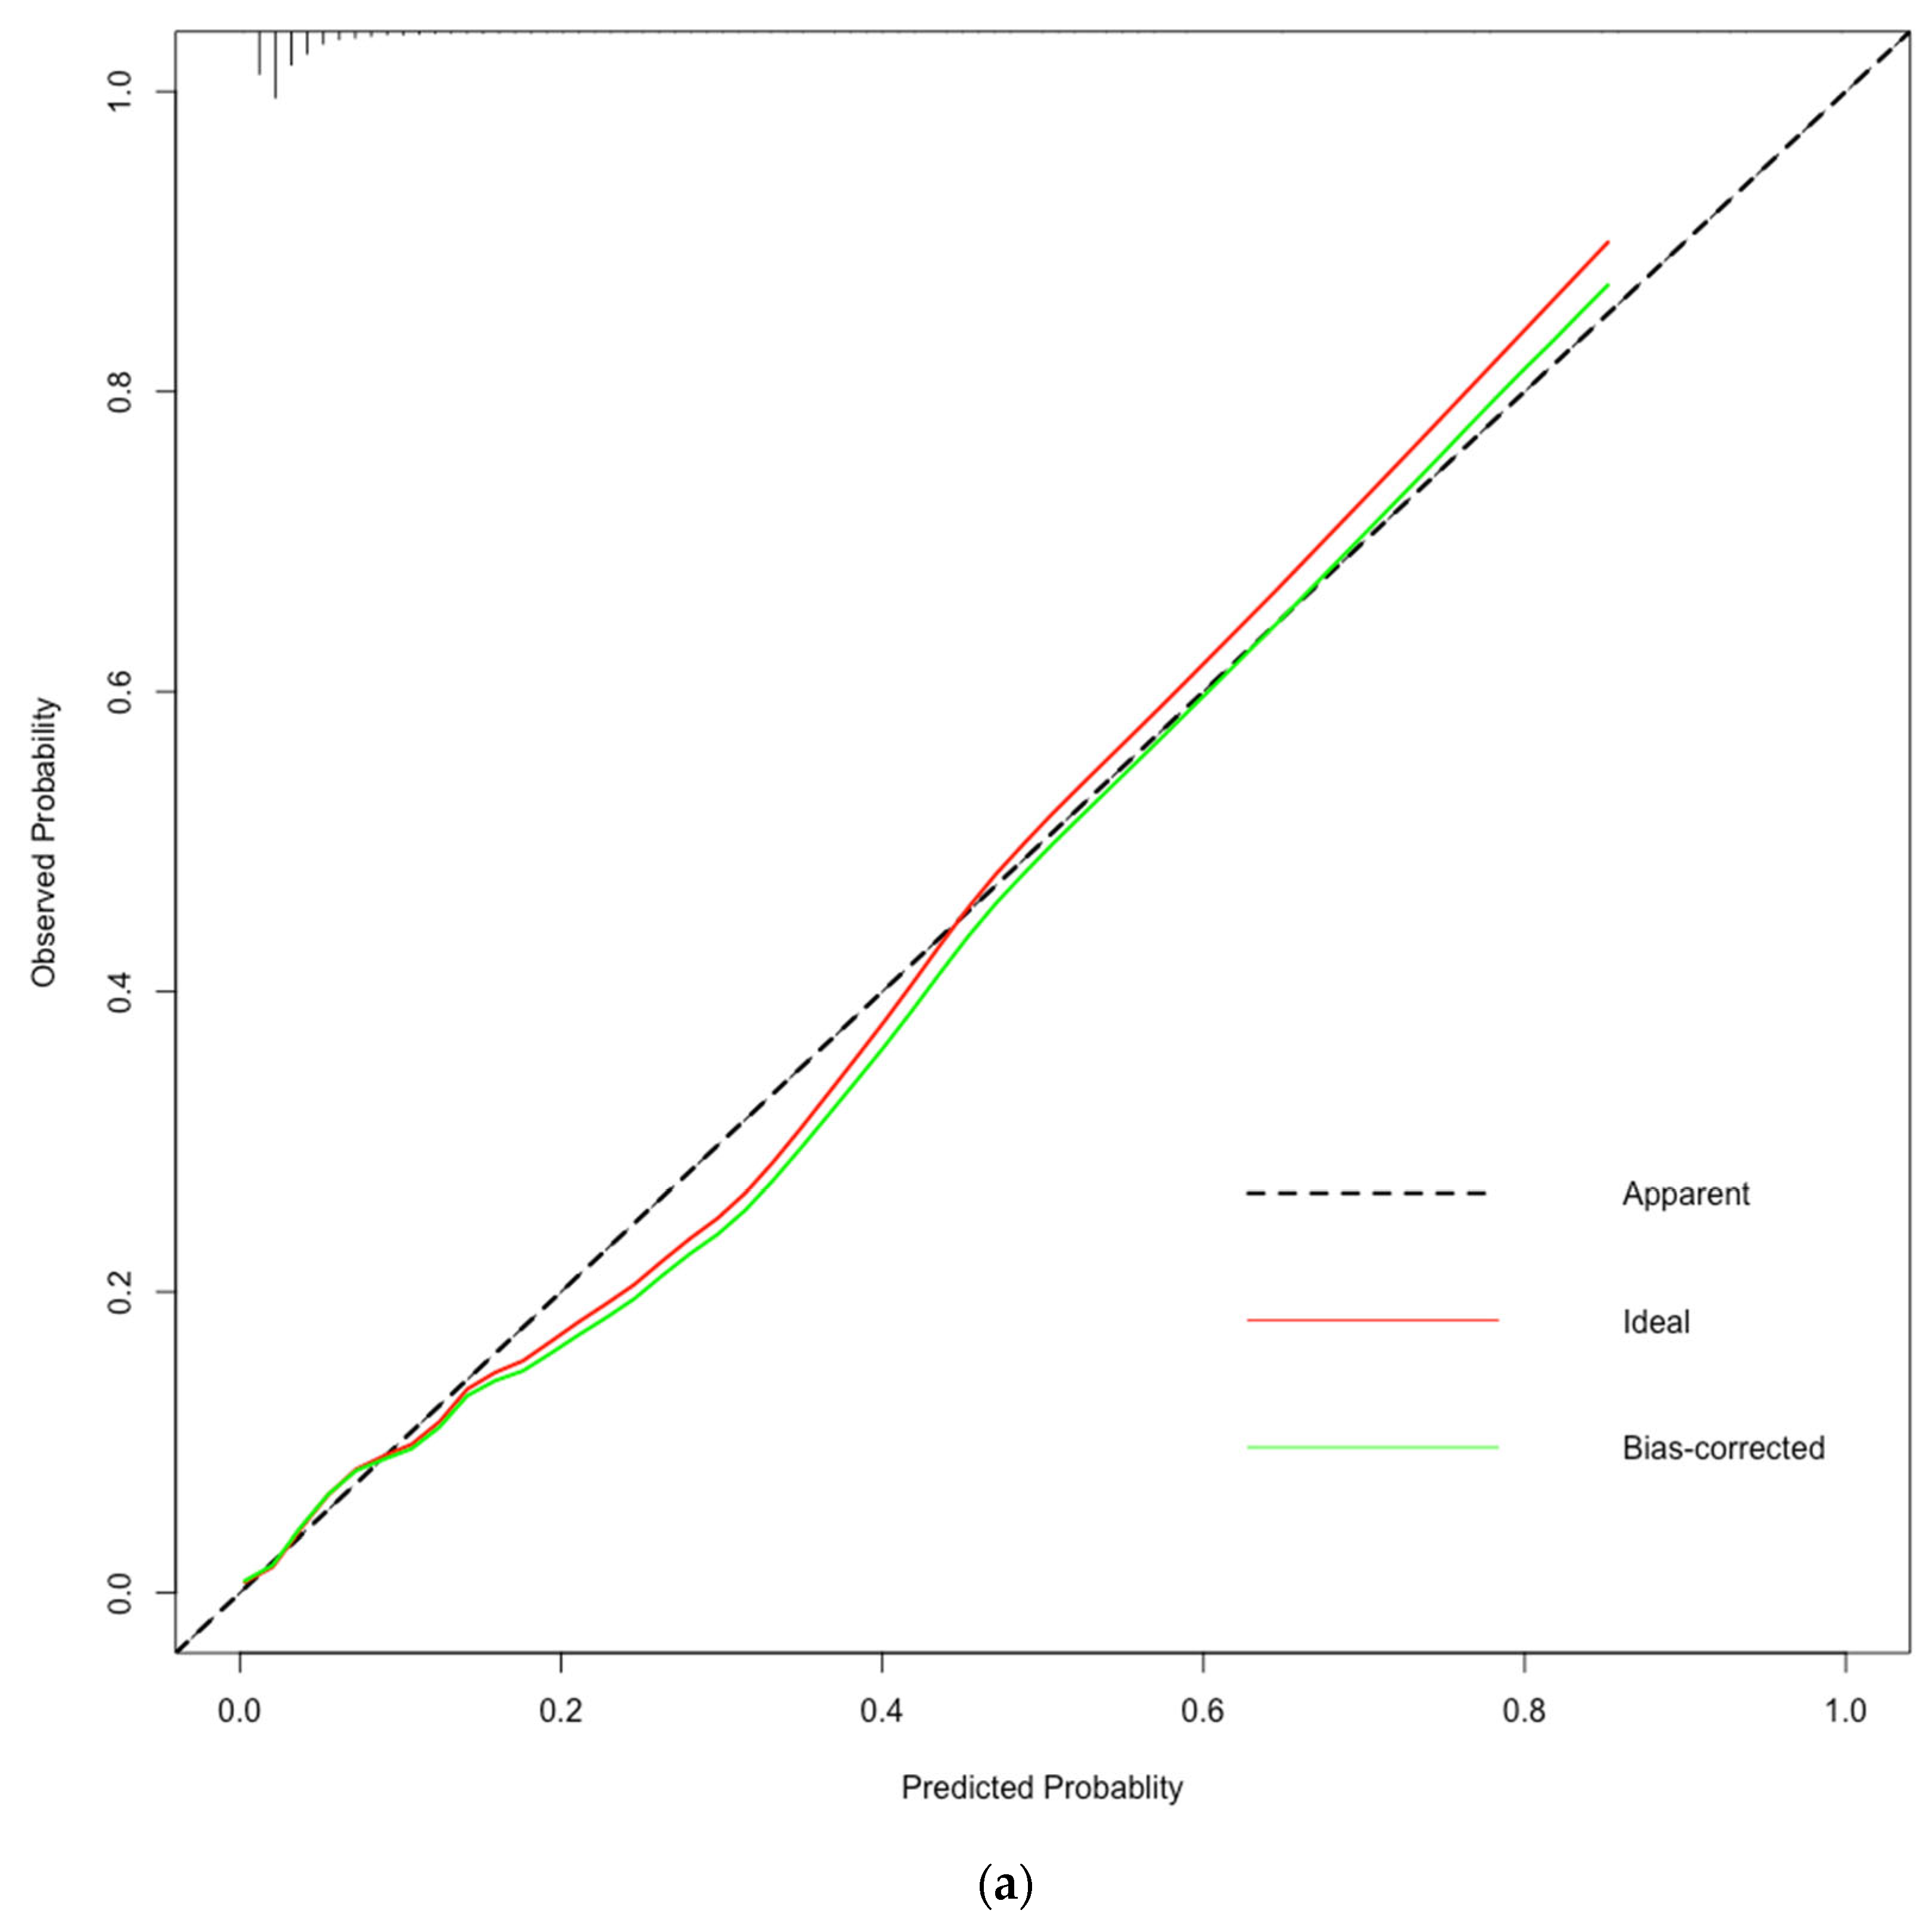
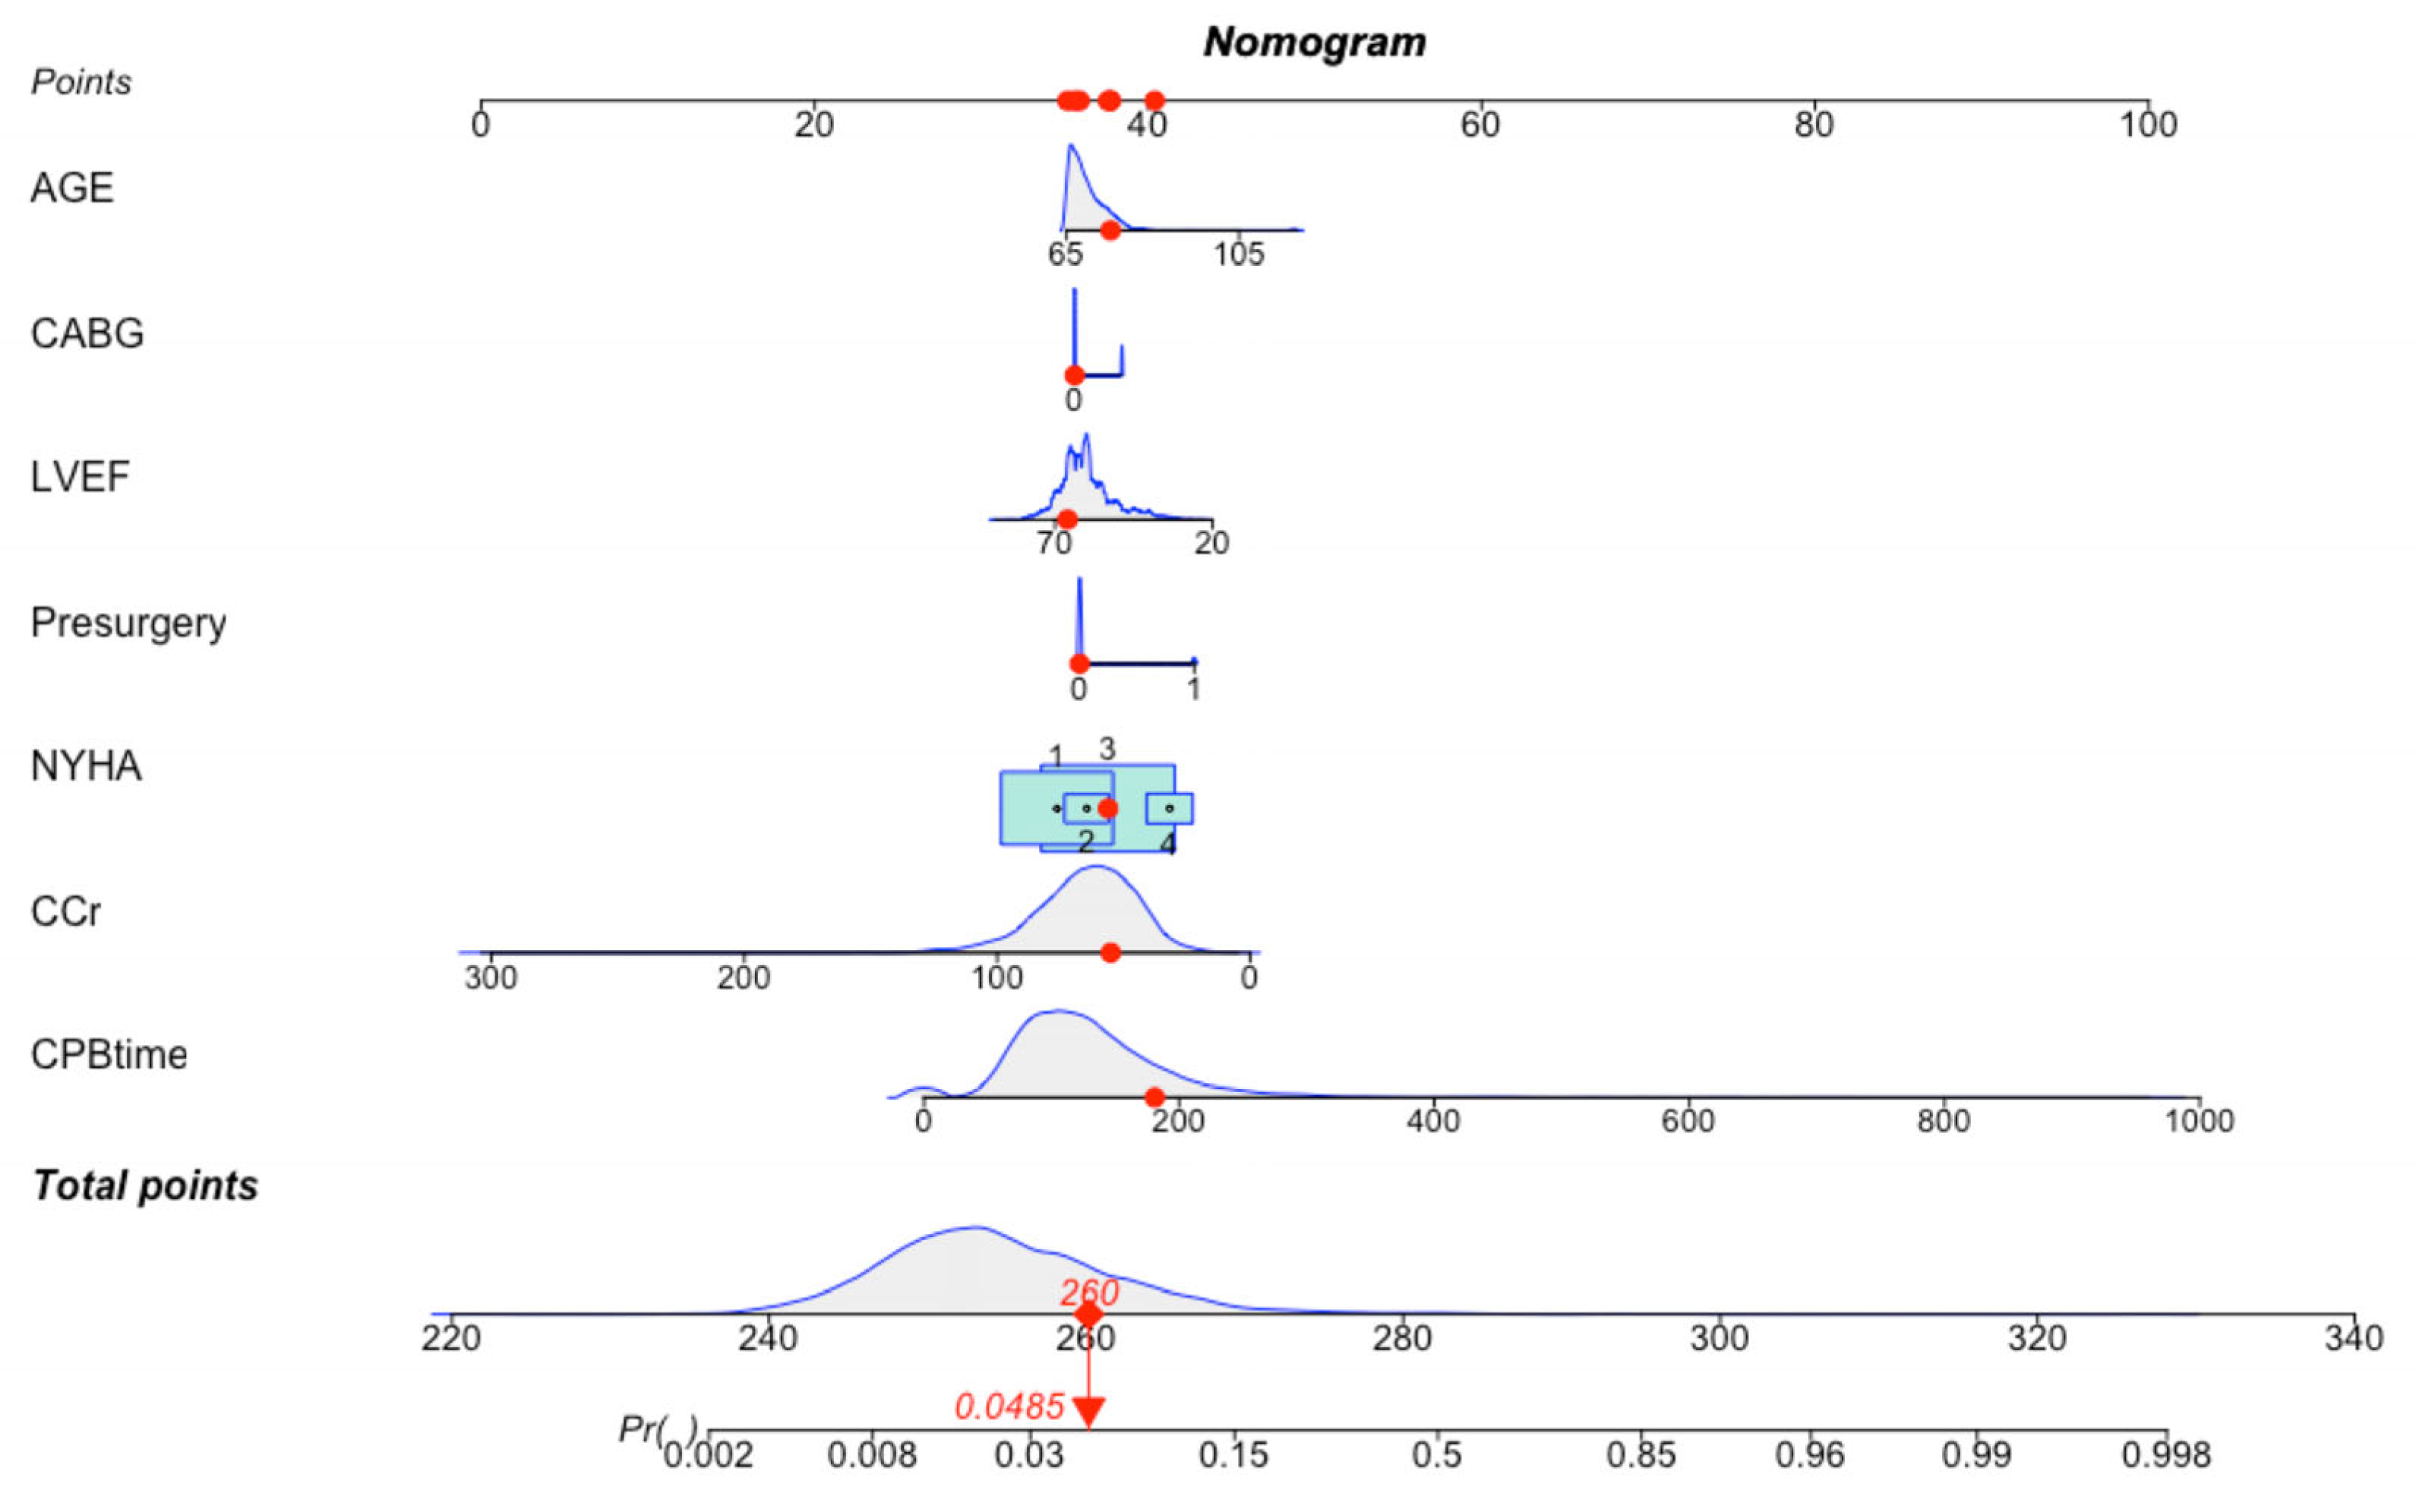
3.3. Establishment of the LASSO-Logistic Regression Prediction Model
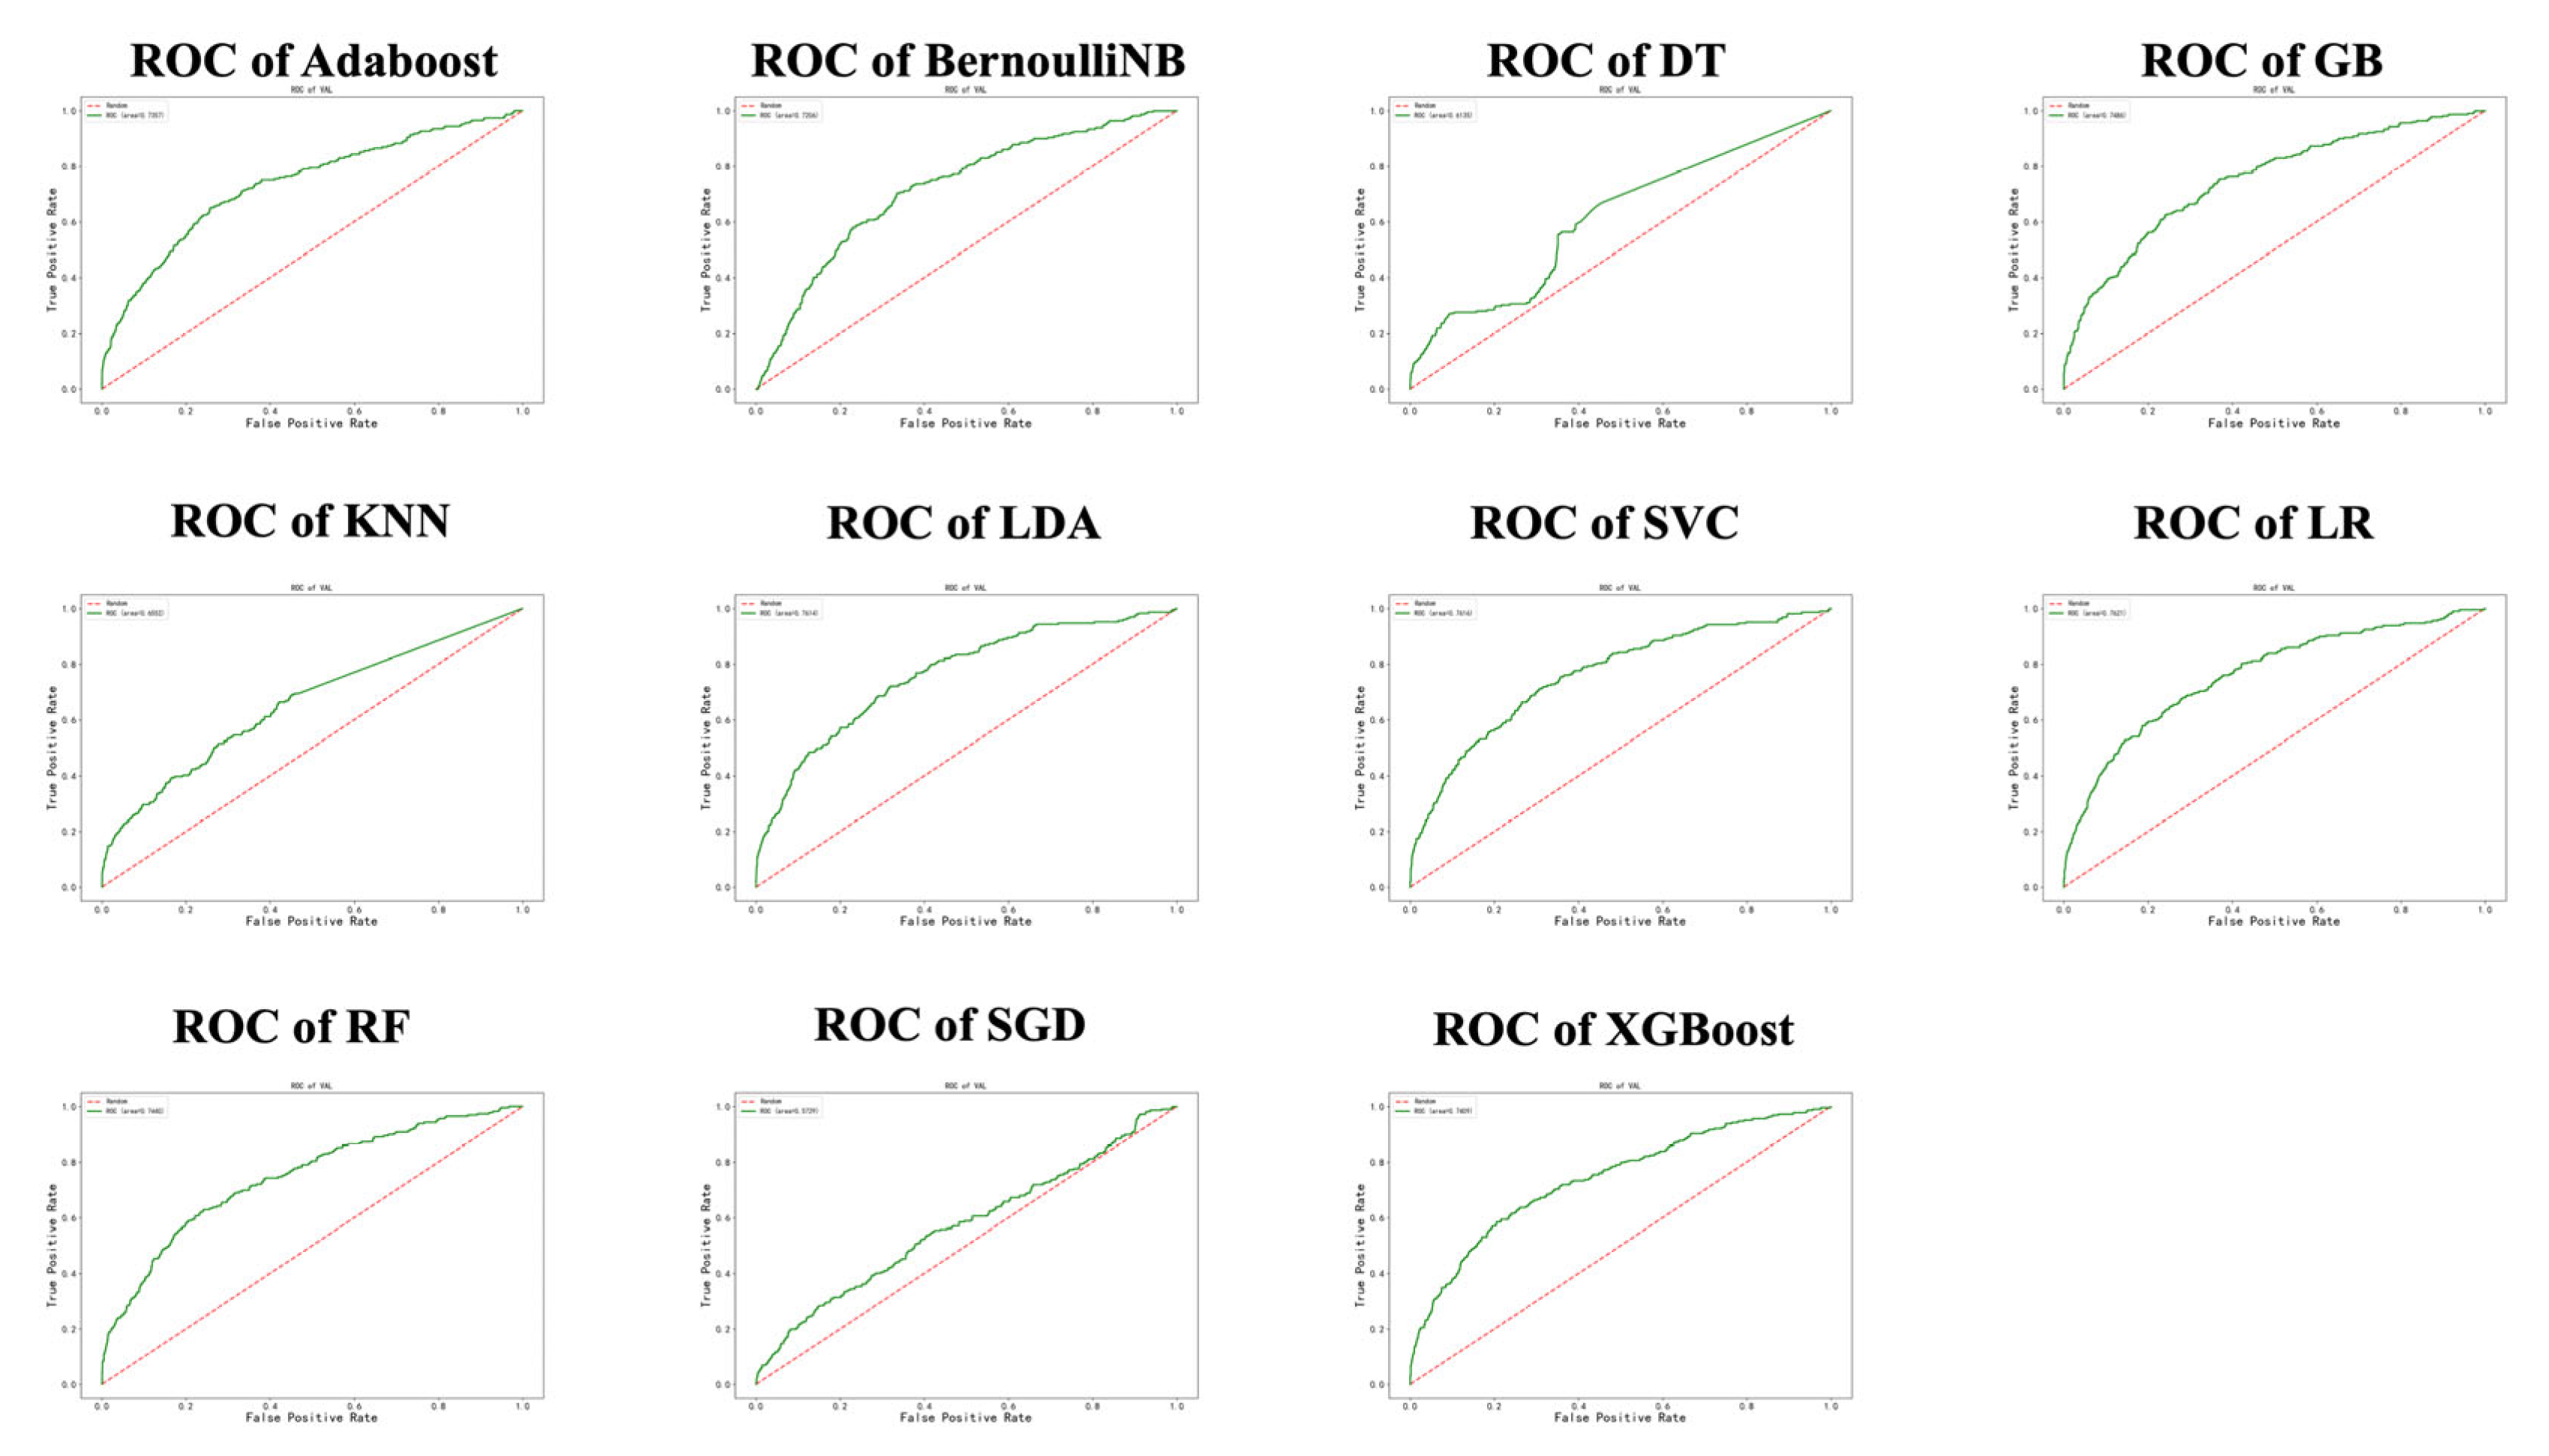
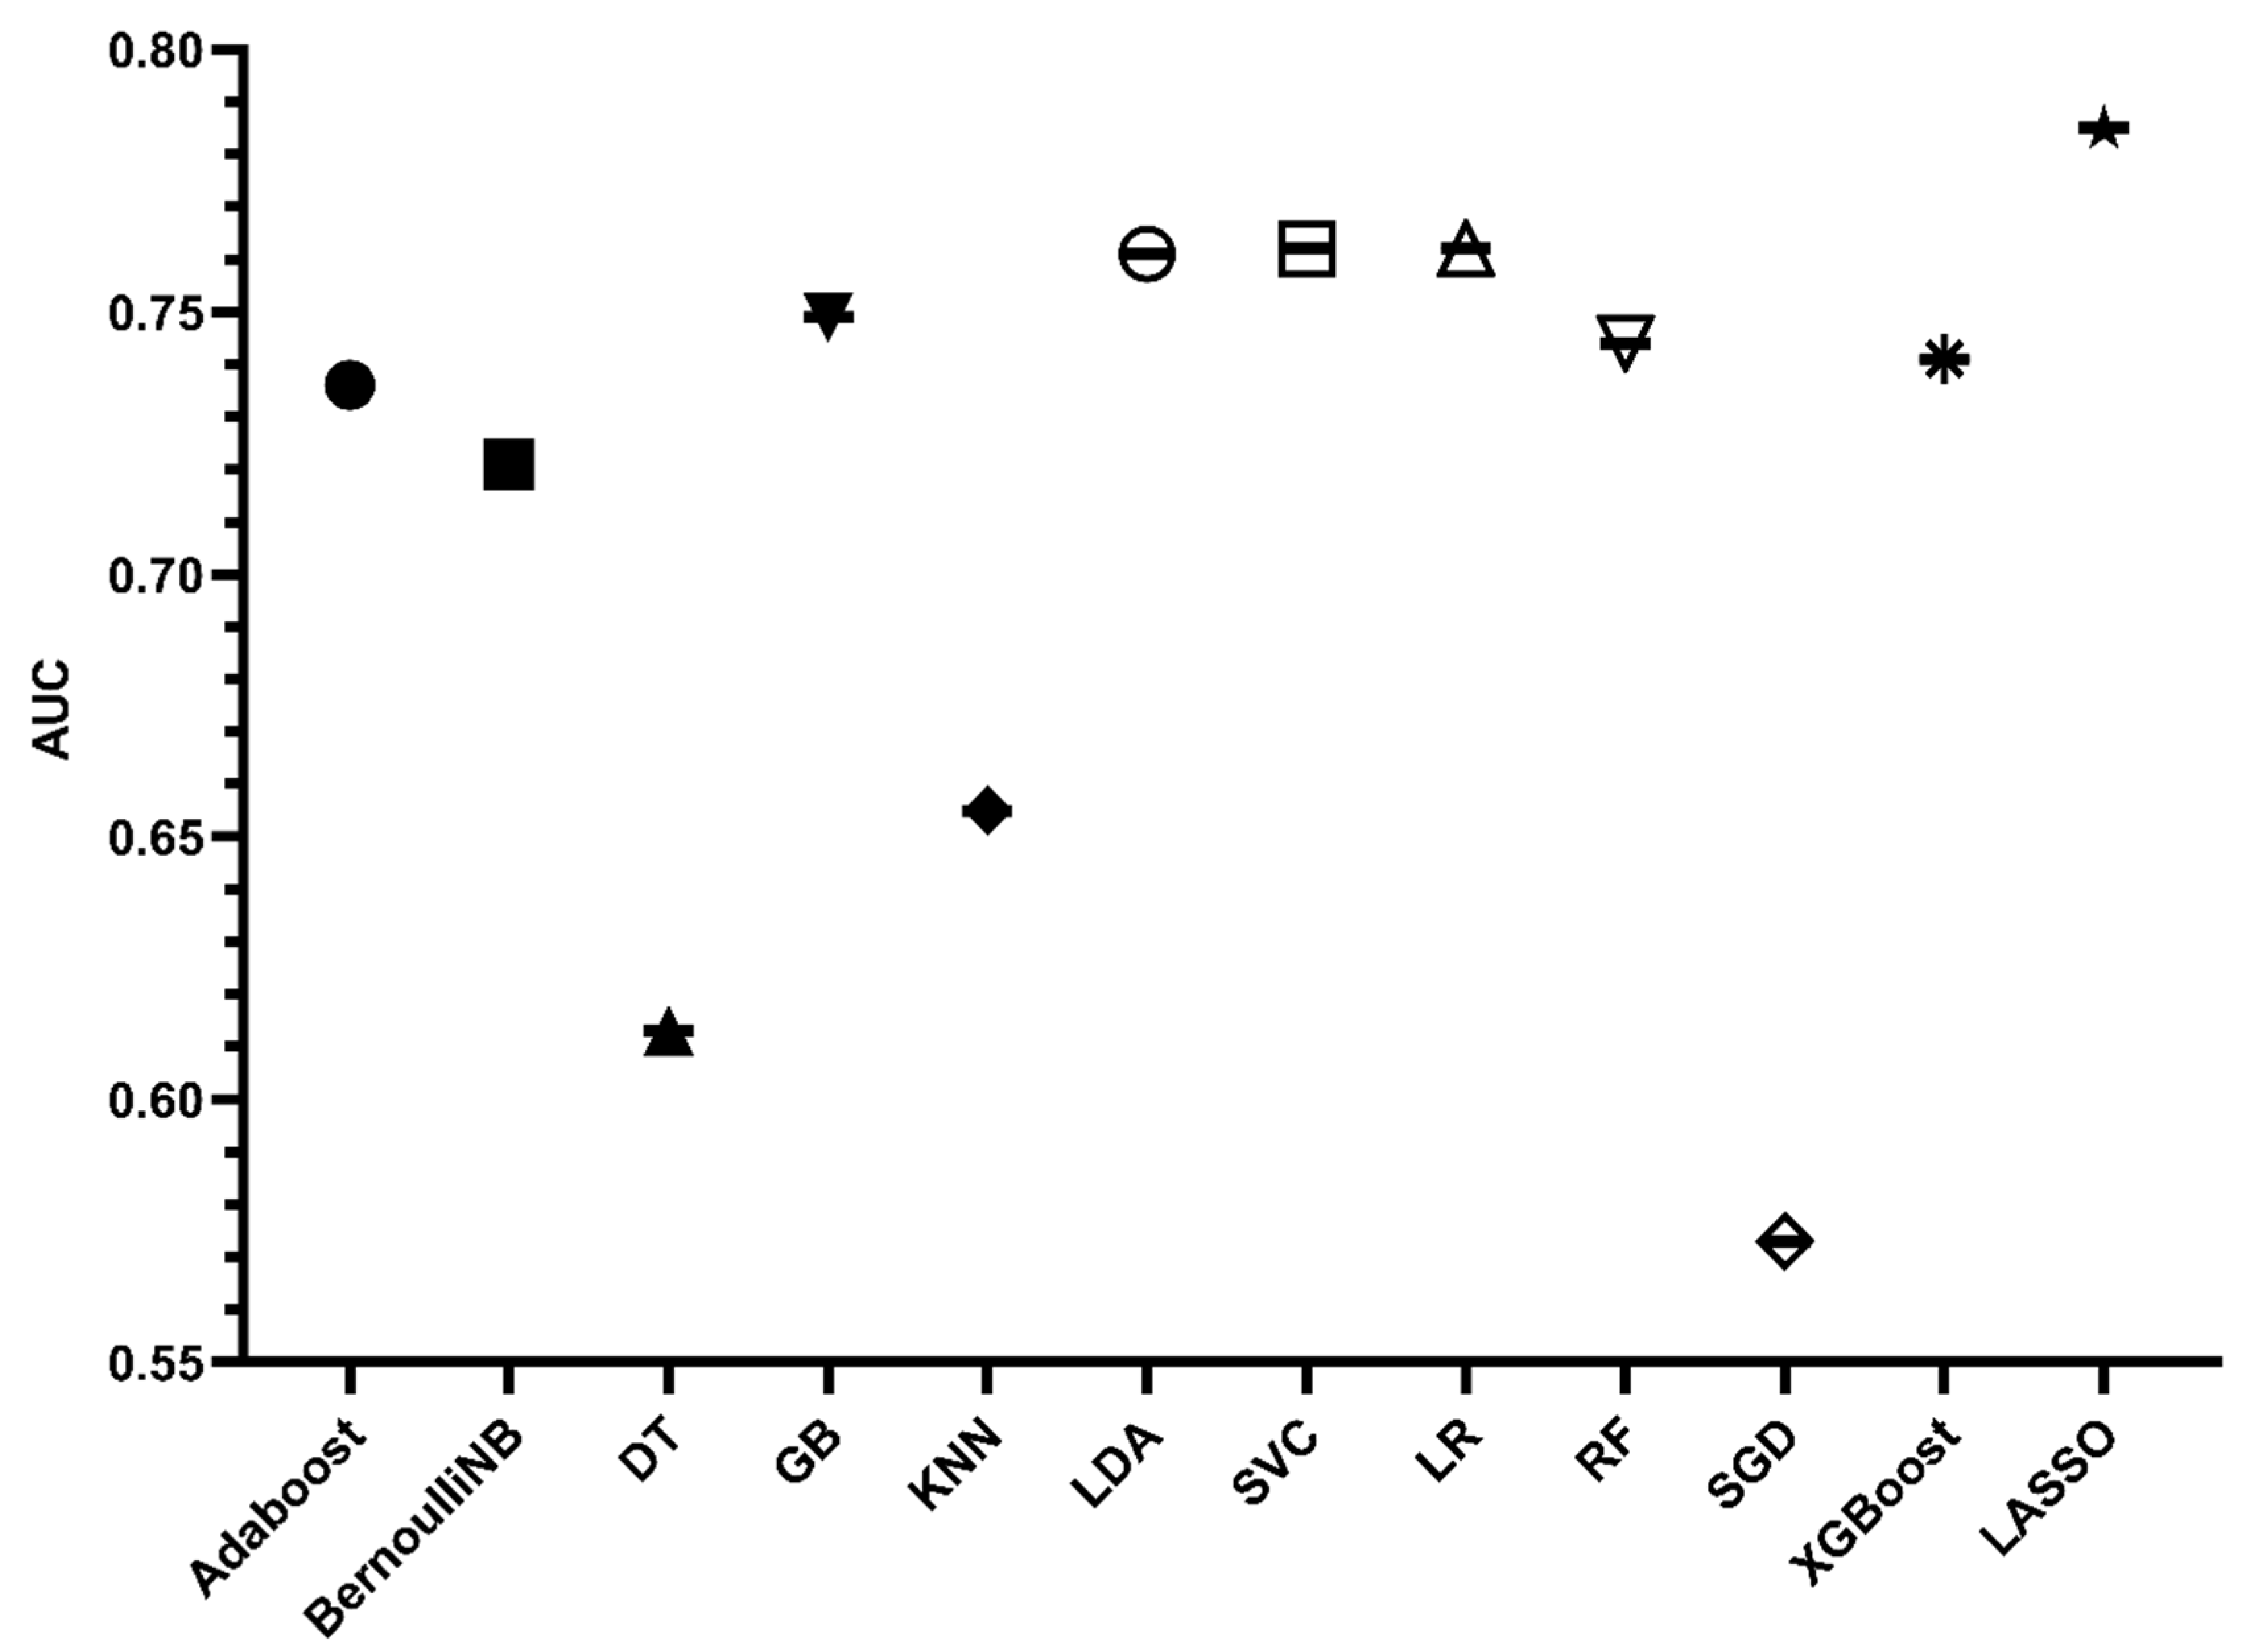
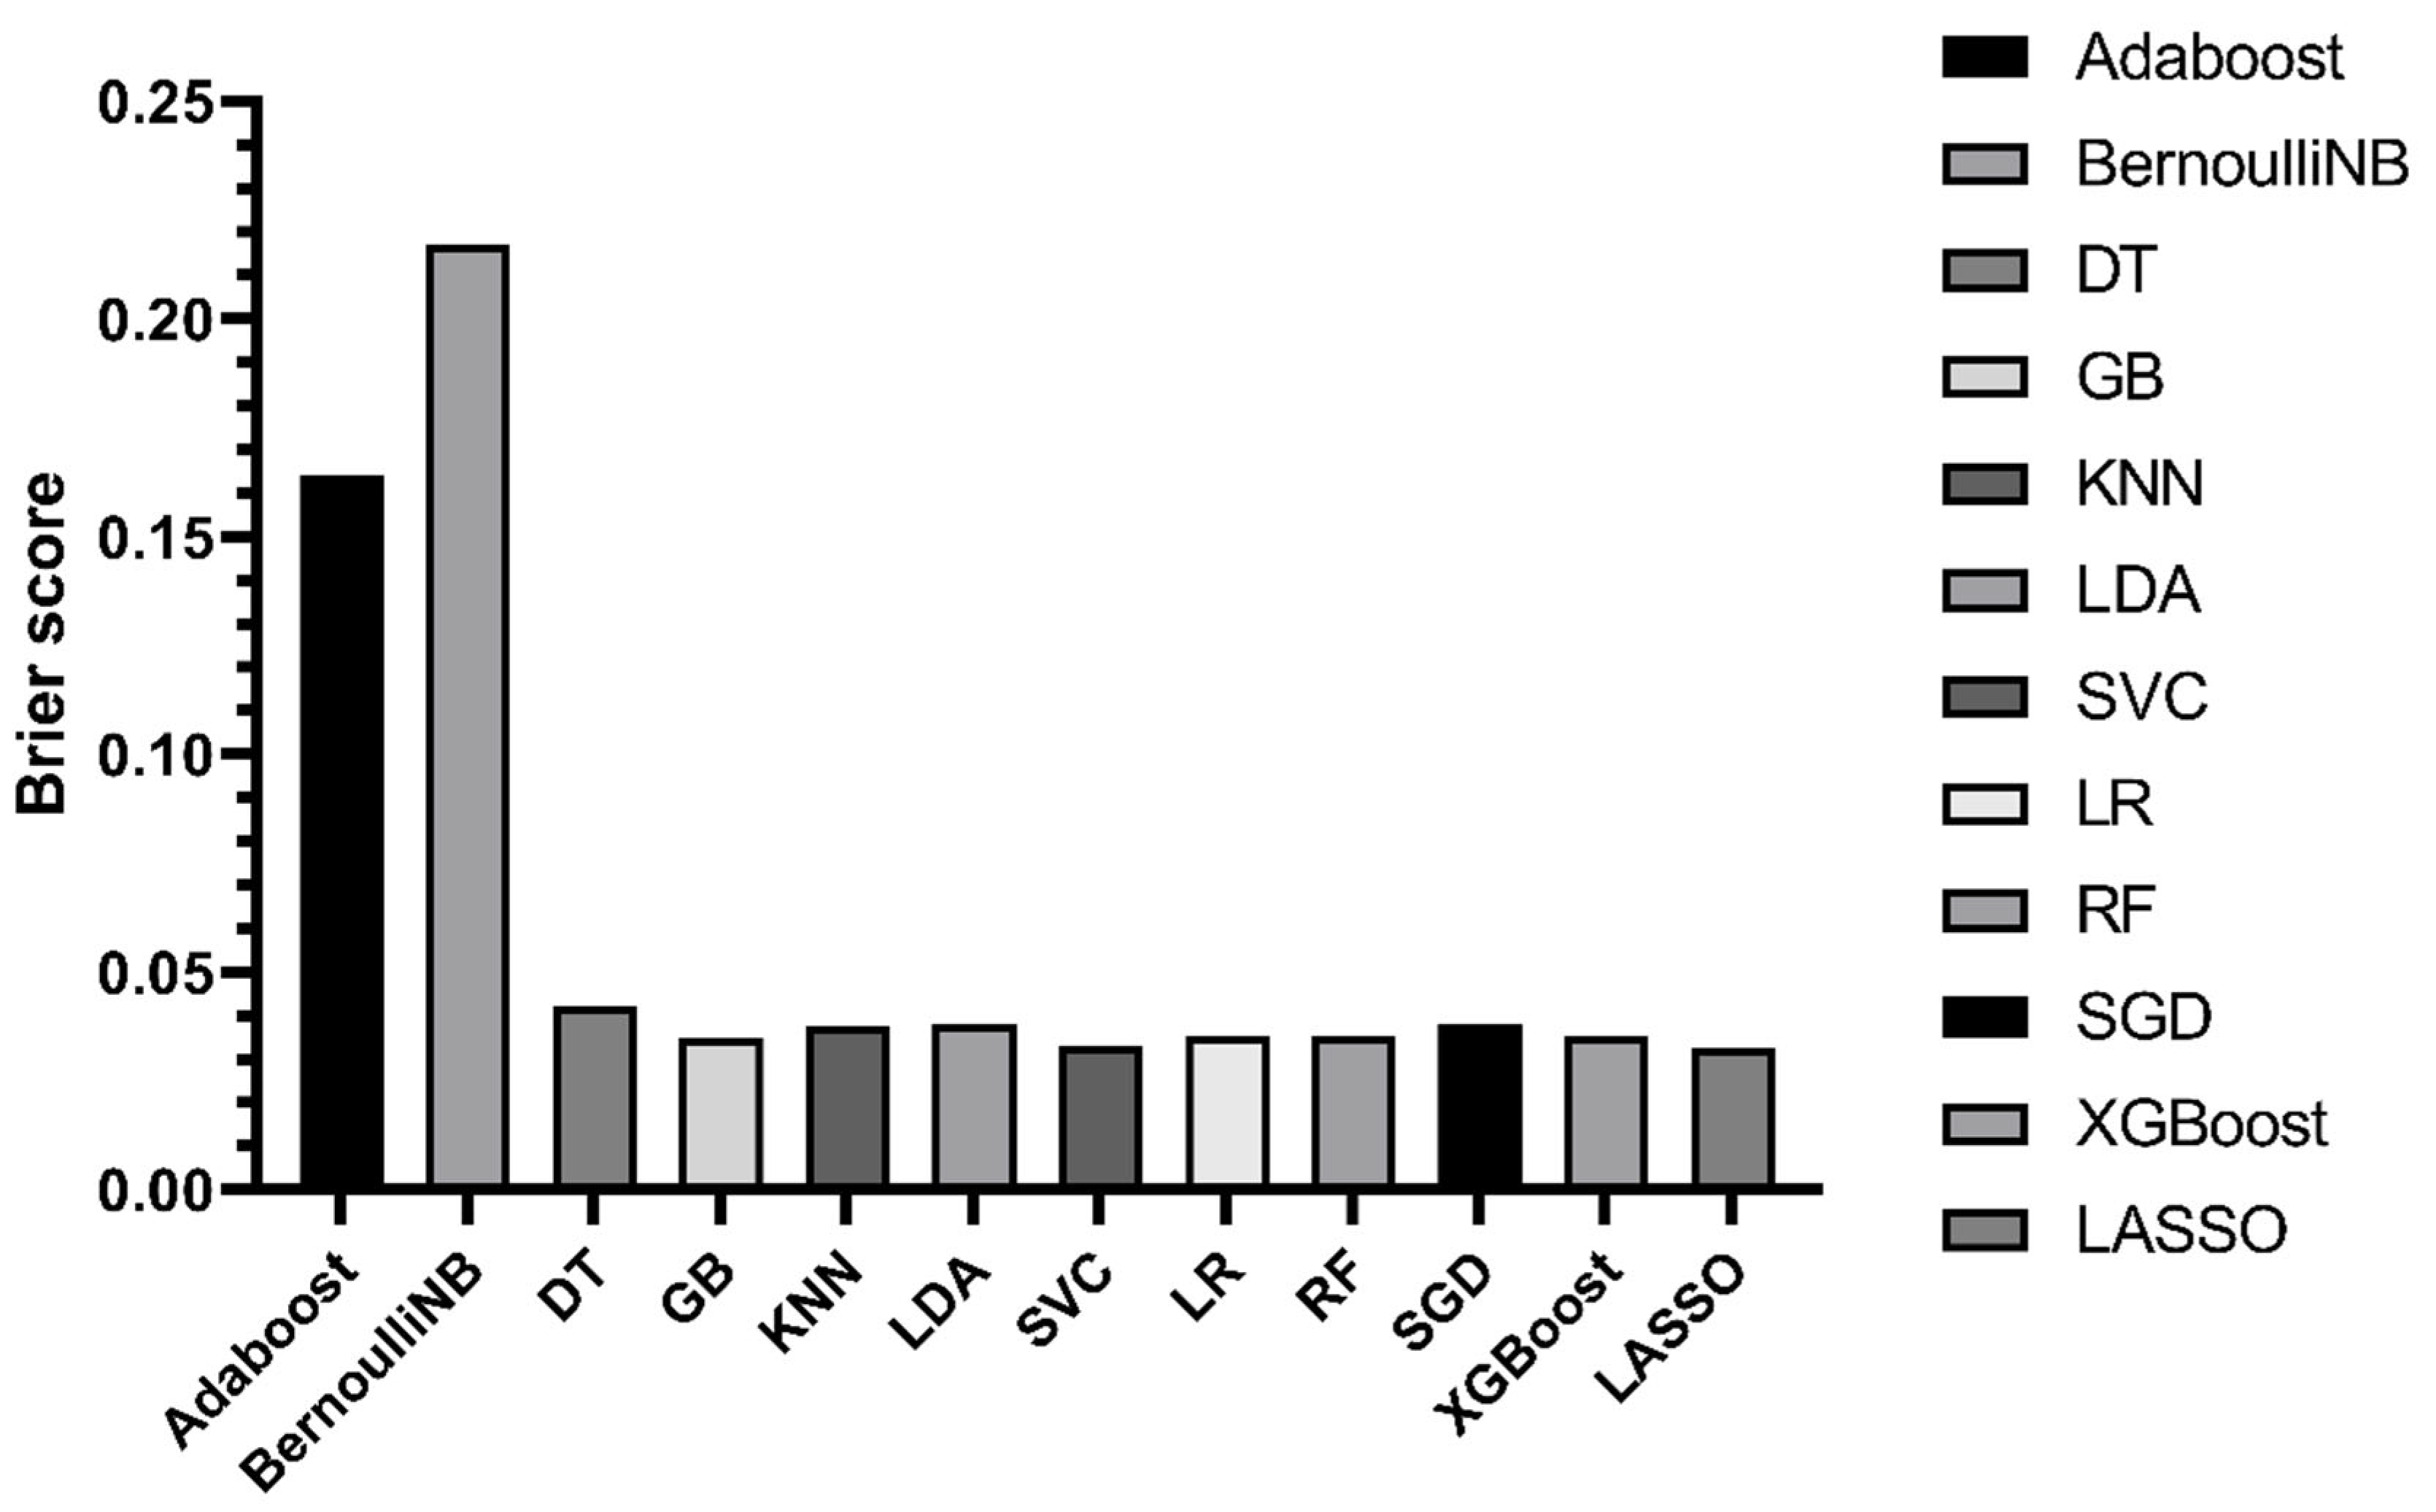
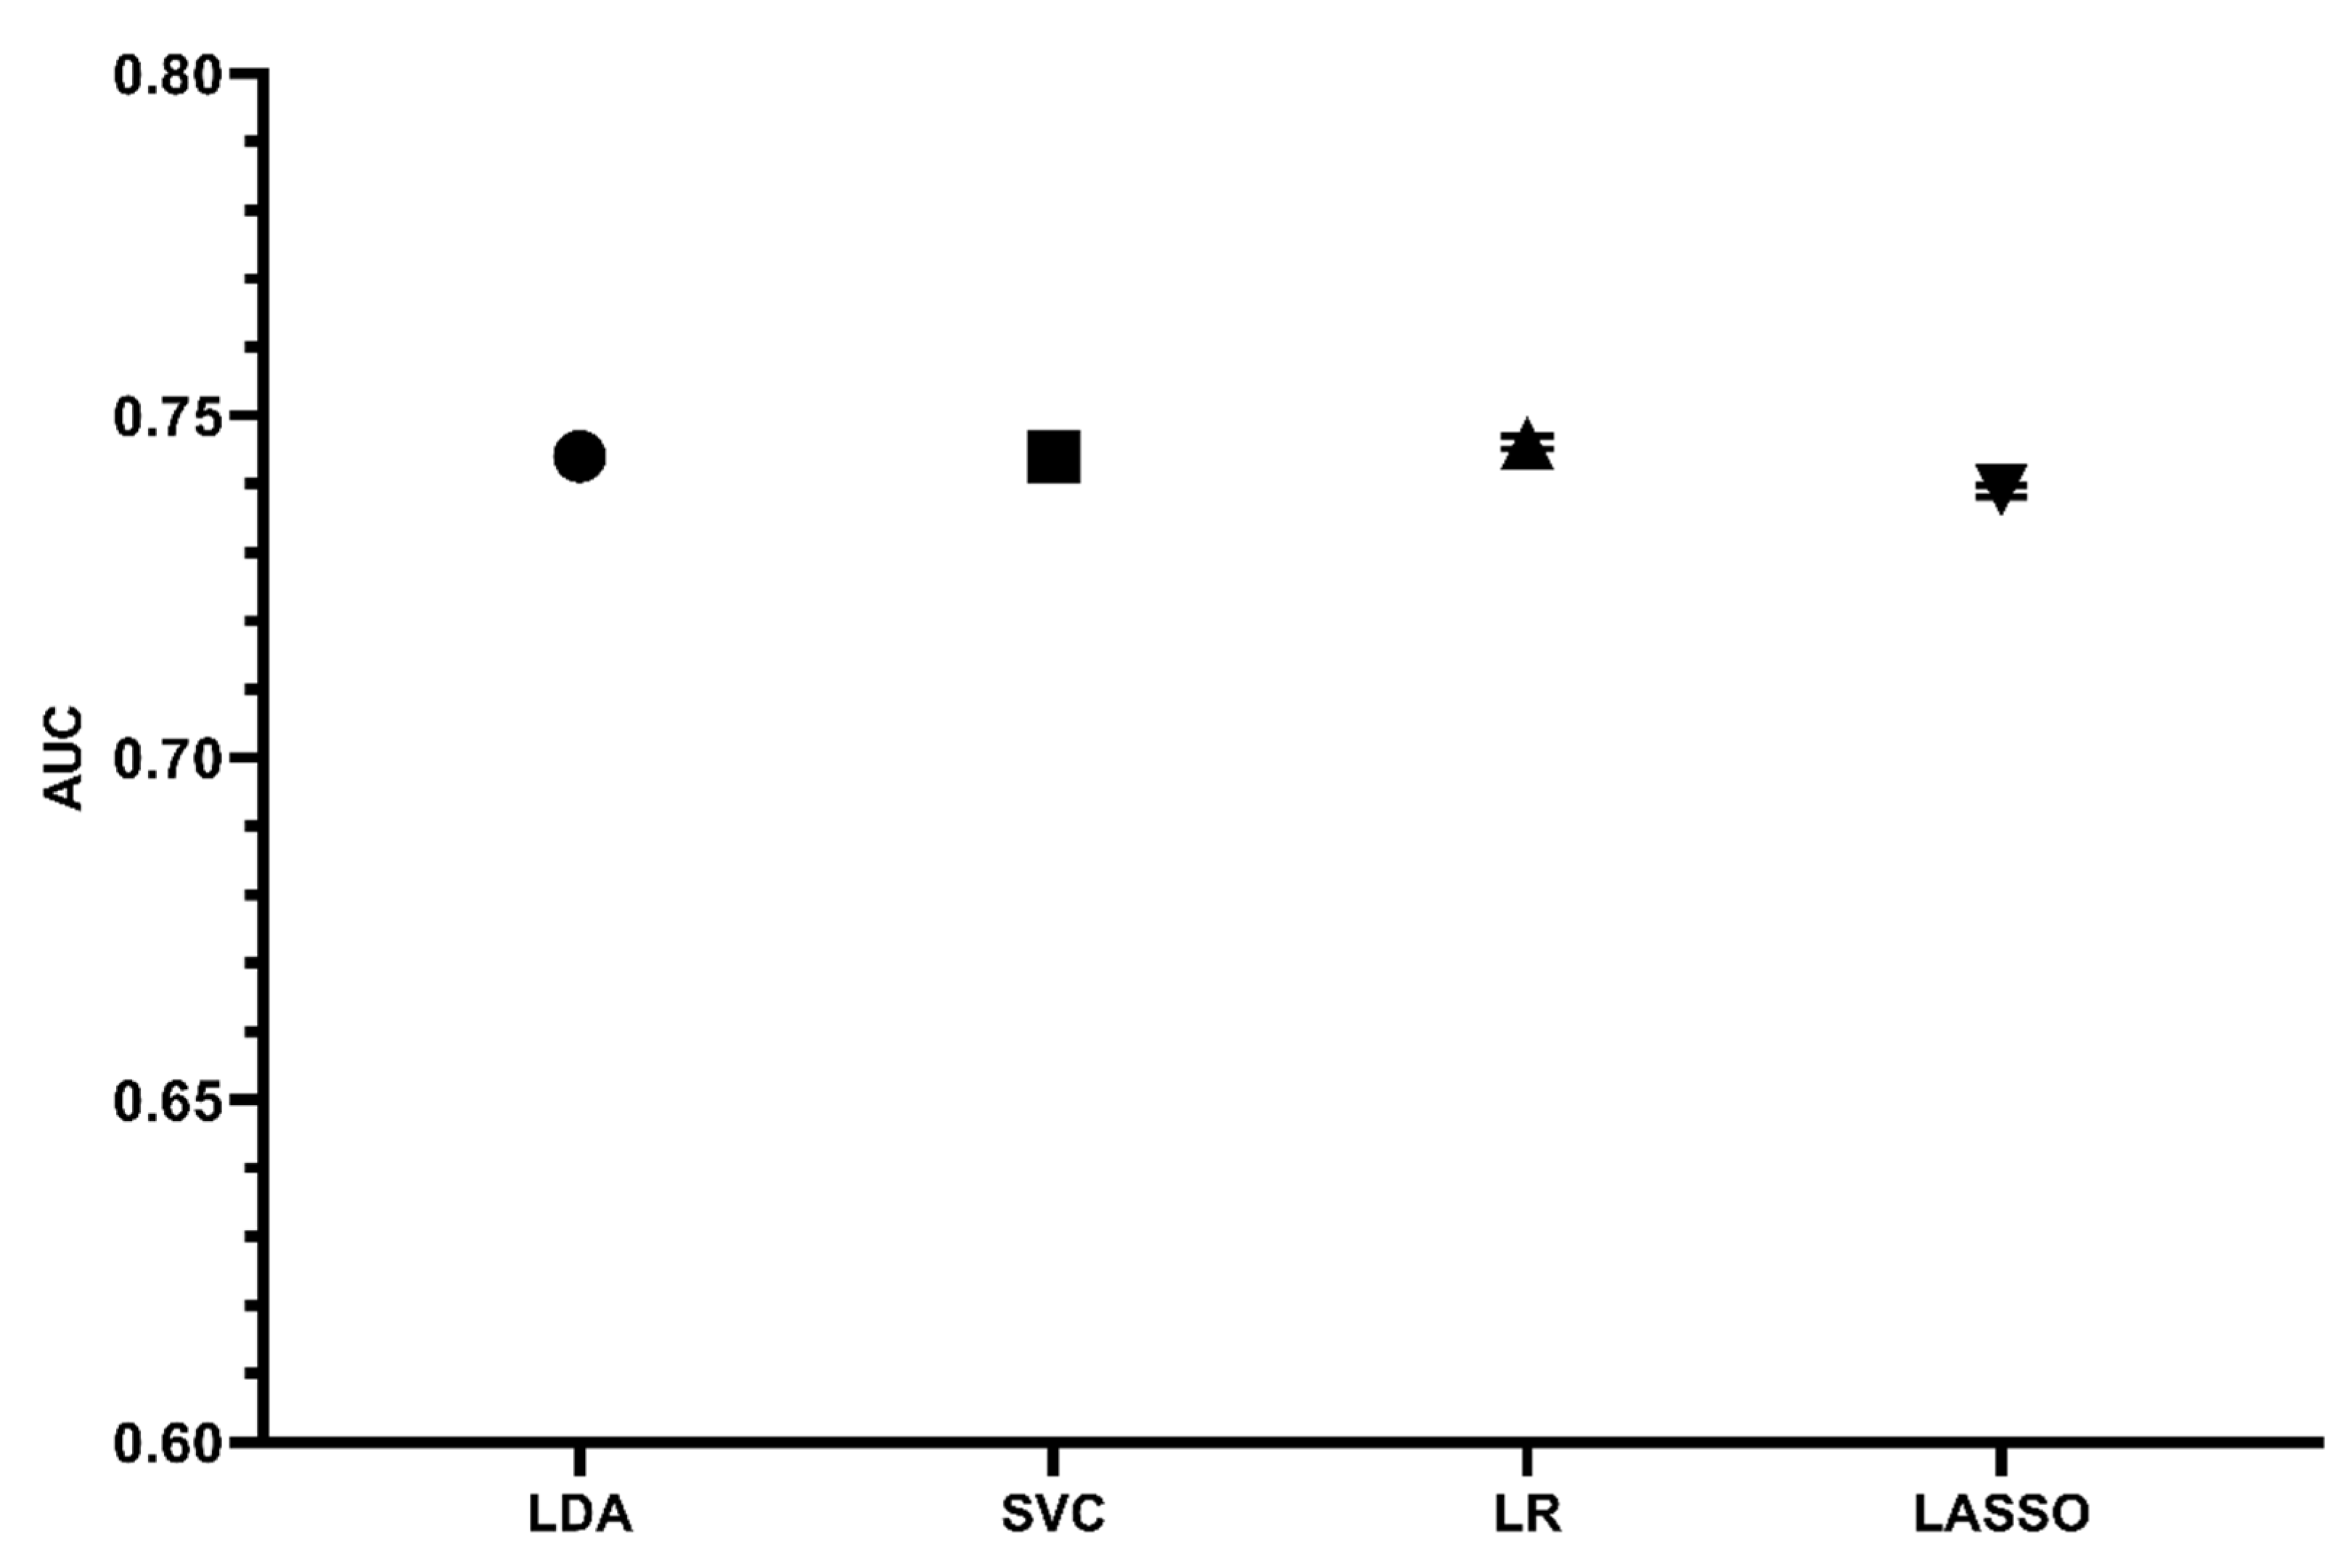
3.4. Establishment of ML Prediction Models
4. Discussion
Limitations
5. Conclusions
Author Contributions
Funding
Institutional Review Board Statement
Informed Consent Statement
Data Availability Statement
Acknowledgments
Conflicts of Interest
References
- Coffey, S.; Roberts-Thomson, R.; Brown, A.; Carapetis, J.; Chen, M.; Enriquez-Sarano, M.; Zühlke, L.; Prendergast, B.D. Global epidemiology of valvular heart disease. Nat. Rev. Cardiol. 2021, 18, 853–864. [Google Scholar] [CrossRef] [PubMed]
- Yadgir, S.; Johnson, C.O.; Aboyans, V.; Adebayo, O.M.; Adedoyin, R.A.; Afarideh, M.; Alahdab, F.; Alashi, A.; Alipour, V.; Arabloo, J.; et al. Global, Regional, and National Burden of Calcific Aortic Valve and Degenerative Mitral Valve Diseases, 1990–2017. Circulation 2020, 141, 1670–1680. [Google Scholar] [PubMed] [Green Version]
- Ambler, G.; Omar, R.Z.; Royston, P.; Kinsman, R.; Keogh, B.E.; Taylor, K.M. Generic, Simple Risk Stratification Model for Heart Valve Surgery. Circulation 2005, 112, 224–231. [Google Scholar] [CrossRef] [PubMed] [Green Version]
- O’Brien, S.M.; Shahian, D.M.; Filardo, G.; Ferraris, V.A.; Haan, C.K.; Rich, J.B.; Normand, S.L.; DeLong, E.R.; Shewan, C.M.; Dokholyan, R.S.; et al. The Society of Thoracic Surgeons 2008 cardiac surgery risk models: Part 2—Isolated valve surgery. Ann. Thorac. Surg. 2009, 88 (Suppl. 1), S23–S42. [Google Scholar] [CrossRef]
- Yang, Y.; Wang, Z.; Chen, Z.; Wang, X.; Zhang, L.; Li, S.; Zheng, C.; Kang, Y.; Jiang, L.; Zhu, Z.; et al. Current status and etiology of valvular heart disease in China: A population-based survey. BMC Cardiovasc. Disord. 2021, 21, 339. [Google Scholar] [CrossRef]
- The Writing Committee of the Report on Cardiovascular Health and Diseases in China. Report on Cardiovascular Health and Diseases in China 2021: An Updated Summary. Biomed. Environ. Sci. 2022, 35, 573–603. [Google Scholar]
- Jamieson, W.R.E.; Edwards, F.H.; Schwartz, M.; Bero, J.W.; Clark, R.E.; Grover, F.L. Risk stratification for cardiac valve replacement. National Cardiac Surgery Database. Ann. Thorac. Surg. 1999, 67, 943–951. [Google Scholar] [CrossRef]
- Nashef, S.A.M.; Roques, F.; Michel, P.; Gauducheau, E.; Lemeshow, S.; Salamon, R.; the Euro Ssg. European system for cardiac operative risk evaluation (EuroSCORE). Eur. J. Cardio-Thorac. Surg. 1999, 16, 9–13. [Google Scholar] [CrossRef]
- Nashef, S.A.M.; Roques, F.; Sharples, L.D.; Nilsson, J.; Smith, C.; Goldstone, A.R.; Lockowandt, U. EuroSCORE II†. Eur. J. Cardio-Thorac. Surg. 2012, 41, 734–745. [Google Scholar] [CrossRef] [Green Version]
- Zheng, Z.; Zhang, L.; Li, X.; Hu, S.; on behalf of the Chinese CRS. SinoSCORE: A logistically derived additive prediction model for post-coronary artery bypass grafting in-hospital mortality in a Chinese population. Front. Med. 2013, 7, 477–485. [Google Scholar] [CrossRef]
- Xu, H.; Liu, Q.; Cao, K.; Ye, Y.; Zhang, B.; Li, Z.; Hao, J.; Qi, X.; Zhao, Q.; Liu, S.; et al. Distribution, Characteristics, and Management of Older Patients With Valvular Heart Disease in China: China-DVD Study. JACC Asia 2022, 2, 354–365. [Google Scholar] [CrossRef] [PubMed]
- Rao, C.; Zhang, H.; Gao, H.; Zhao, Y.; Yuan, X.; Hua, K.; Hu, S.; Zheng, Z. The Chinese Cardiac Surgery Registry: Design and Data Audit. Ann. Thorac. Surg. 2016, 101, 1514–1520. [Google Scholar] [CrossRef] [PubMed] [Green Version]
- Kodali, S.K.; Velagapudi, P.; Hahn, R.T.; Abbott, D.; Leon, M.B. Valvular Heart Disease in Patients ≥ 80 Years of Age. J. Am. Coll. Cardiol. 2018, 71, 2058–2072. [Google Scholar] [PubMed]
- Iung, B.; Vahanian, A. Epidemiology of valvular heart disease in the adult. Nat. Rev. Cardiol. 2011, 8, 162–172. [Google Scholar]
- Yoshida, K.; Yoshikawa, J.; Akasaka, T.; Shakudo, M.; Jyo, Y.; Takao, S.; Shiratori, K.; Koizumi, K.; Okumachi, F.; Kato, H.; et al. Problems in the management of elderly patients with valvular heart disease. Jpn. Circ. J. 1988, 52, 466–470. [Google Scholar] [CrossRef] [Green Version]
- Hu, Z.; Chen, S.; Du, J.; Gu, D.; Wang, Y.; Hu, S.; Zheng, Z. An In-hospital Mortality Risk Model for Patients Undergoing Coronary Artery Bypass Grafting in China. Ann. Thorac. Surg. 2020, 109, 1234–1242. [Google Scholar] [CrossRef]
- Zhuge, R.Q.; Hou, X.P.; Qi, X.L.; Wu, Y.J.; Zhang, M.Z. Clinical features and treatment options for mitral regurgitation in elderly inpatients. J. Geriatr. Cardiol. 2018, 15, 428–433. [Google Scholar]
- Mack, M.J. Risk Scores for Predicting Outcomes in Valvular Heart Disease: How Useful? Curr. Cardiol. Rep. 2011, 13, 107–112. [Google Scholar]
- Nowicki, E.R.; Birkmeyer, N.J.; Weintraub, R.W.; Leavitt, B.J.; Sanders, J.H.; Dacey, L.J.; Clough, R.A.; Quinn, R.D.; Charlesworth, D.C.; Sisto, D.A.; et al. Multivariable prediction of in-hospital mortality associated with aortic and mitral valve surgery in Northern New England. Ann. Thorac. Surg. 2004, 77, 1966–1977. [Google Scholar] [CrossRef]
- Lin, H.; Gong, J.; Wu, Y.; Zheng, Z.; Hou, J. A Comparative Study on Surgical Treatment of Valvular Heart Disease between High-Volume Cardiac Centers in China and STS Data. J. Cardiovasc. Dev. Dis. 2022, 9, 212. [Google Scholar] [CrossRef]
- Salis, S.; Mazzanti, V.V.; Merli, G.; Salvi, L.; Tedesco, C.C.; Veglia, F.; Sisillo, E. Cardiopulmonary bypass duration is an independent predictor of morbidity and mortality after cardiac surgery. J. Cardiothorac. Vasc. Anesth. 2008, 22, 814–822. [Google Scholar] [CrossRef] [PubMed]
- Ascione, R.; Lloyd, C.T.; Underwood, M.J.; Lotto, A.A.; Pitsis, A.A.; Angelini, G.D. Inflammatory response after coronary revascularization with or without cardiopulmonary bypass. Ann. Thorac. Surg. 2000, 69, 1198–1204. [Google Scholar] [CrossRef] [PubMed]
- Sirvinskas, E.; Andrejaitiene, J.; Raliene, L.; Nasvytis, L.; Karbonskiene, A.; Pilvinis, V.; Sakalauskas, J. Cardiopulmonary bypass management and acute renal failure: Risk factors and prognosis. Perfusion 2008, 23, 323–327. [Google Scholar]
- Murphy, G.J.; Angelini, G.D. Side effects of cardiopulmonary bypass: What is the reality? J. Card. Surg. 2004, 19, 481–488. [Google Scholar] [CrossRef]
- Chen, J.H.; Asch, S.M. Machine Learning and Prediction in Medicine—Beyond the Peak of Inflated Expectations. N. Engl. J. Med. 2017, 376, 2507–2509. [Google Scholar] [CrossRef] [PubMed] [Green Version]
- Deo, R.C. Machine Learning in Medicine. Circulation 2015, 132, 1920–1930. [Google Scholar] [CrossRef] [Green Version]
- Rajkomar, A.; Dean, J.; Kohane, I. Machine Learning in Medicine. N. Engl. J. Med. 2019, 380, 2588–2590. [Google Scholar] [CrossRef] [PubMed]
- Nilsson, J.; Ohlsson, M.; Thulin, L.; Höglund, P.; Nashef, S.A.M.; Brandt, J. Risk factor identification and mortality prediction in cardiac surgery using artificial neural networks. J. Thorac. Cardiovasc. Surg. 2006, 132, 12–19. [Google Scholar] [CrossRef] [Green Version]
- LaFaro, R.J.; Pothula, S.; Kubal, K.P.; Inchiosa, M.E.; Pothula, V.M.; Yuan, S.C.; Maerz, D.A.; Montes, L.; Oleszkiewicz, S.M.; Yusupov, A.; et al. Neural Network Prediction of ICU Length of Stay Following Cardiac Surgery Based on Pre-Incision Variables. PLoS ONE 2015, 10, e0145395. [Google Scholar] [CrossRef]
- Thottakkara, P.; Ozrazgat-Baslanti, T.; Hupf, B.B.; Rashidi, P.; Pardalos, P.; Momcilovic, P.; Bihorac, A. Application of Machine Learning Techniques to High-Dimensional Clinical Data to Forecast Postoperative Complications. PLoS ONE 2016, 11, e0155705. [Google Scholar]
- Shameer, K.; Johnson, K.W.; Glicksberg, B.S.; Dudley, J.T.; Sengupta, P.P. Machine learning in cardiovascular medicine: Are we there yet? Heart 2018, 104, 1156–1164. [Google Scholar] [CrossRef] [PubMed]
- Allyn, J.; Allou, N.; Augustin, P.; Philip, I.; Martinet, O.; Belghiti, M.; Provenchere, S.; Montravers, P.; Ferdynus, C. A Comparison of a Machine Learning Model with EuroSCORE II in Predicting Mortality after Elective Cardiac Surgery: A Decision Curve Analysis. PLoS ONE 2017, 12, e0169772. [Google Scholar] [CrossRef] [PubMed] [Green Version]


| Variable | Definition |
|---|---|
| Age | - |
| Gender | - |
| BMI | Body mass index |
| Tobacco use | - |
| Hypertension | Documented past history or SBP > 140 mmHg and/or DBP > 90 mmHg |
| Diabetes mellitus | Documented past history or fulfilled the criteria of WHO 1999 |
| Dyslipidemia | Documented past history, total cholesterol > 5.72 mmol/L or triglyceride > 1.70 mmol/L |
| COPD | Long-term use of bronchodilators or steroids for lung disease |
| Prior vascular surgery | Documented past history |
| Prior cerebrovascular accident | Documented past history |
| Prior HF | Documented past history |
| CCS class | - |
| NYHA class | - |
| Atrial flutter/Atrial fibrillation | Documented past history |
| Prior MI | Documented past history |
| Prior vascular surgery | 1 or more previous major cardiac operations involving opening the pericardium |
| SCr | - |
| CCr | Calculated using the Cockcroft-Gault formula |
| Total cholesterol | - |
| LDL | - |
| FBG | - |
| LVEF | - |
| LVEDD | - |
| CPB time | - |
| ACC time | - |
| Combined CABG | Combined with CABG surgery |
| In-hospital postoperative mortality | All-cause mortality |
| Variables | Overall (N = 7163) | Death (N = 290) | Non-Death (N = 6873) | p Value * |
|---|---|---|---|---|
| Baseline characteristics | ||||
| Age (years) | 69.8 ± 4.5 | 71.0 ± 5.2 | 69.7 ± 4.5 | <0.001 |
| 65–70 | 4470 | 142 (49.0%) | 4328 (63.0%) | 0.368 |
| 70–75 | 1931 | 88 (30.3%) | 1843 (26.8%) | 0.210 |
| ≥75 | 762 | 60 (20.7%) | 702 (10.2%) | 0.422 |
| Male | 3939 (55.0%) | 158 (54.5%) | 3781 (55.0%) | 0.859 |
| BMI (kg/m2) | 23.23 (21.09,25.35) | 22.86 (20.75,25.05) | 23.24 (21.10,25.38) | 0.133 |
| Tobacco use | 2994 (41.8%) | 97 (33.4%) | 2897 (42.2%) | 0.003 |
| Preoperative factors | ||||
| Hypertension | 3165 (44.2%) | 142 (49.0%) | 3023 (44.0%) | 0.094 |
| Diabetes mellitus | 850 (11.9%) | 44 (15.2%) | 806 (11.7%) | 0.076 |
| Dyslipidemia | 1435 (20.0%) | 38 (13.1%) | 1398 (20.3%) | 0.003 |
| CKD | 258 (3.6%) | 13 (4.5%) | 245 (3.6%) | 0.411 |
| COPD | 150 (2.1%) | 8 (2.8%) | 142 (2.1%) | 0.420 |
| PVD | 226 (3.2%) | 14 (4.8%) | 212 (3.1%) | 0.096 |
| Prior cerebrovascular accident | 455 (6.4%) | 34 (11.7%) | 421 (6.1%) | <0.001 |
| Prior HF | 550 (7.7%) | 41 (14.1%) | 509 (7.4%) | <0.001 |
| CCS class | 0.002 | |||
| None | 3960 (55.3%) | 152 (52.4%) | 3808 (55,4%) | |
| CCS I | 1027 (14.3%) | 35 (12.1%) | 992 (14.4%) | |
| CCS II | 1067 (14.9%) | 35 (12.1%) | 1032 (15.0%) | |
| CCS III | 608 (8.5%) | 35 (12.1%) | 573 (8.3%) | |
| CCS IV | 70 (1.0%) | 7 (2.4%) | 63 (0.9%) | |
| NYHA class | <0.001 | |||
| NYHA I | 415 (5.8%) | 18 (6.2%) | 397 (5.8%) | |
| NYHA II | 2662 (37.2%) | 72 (24.8%) | 2590 (37.7%) | |
| NYHA III | 3496 (48.8%) | 154 (53.1%) | 3342 (48.6%) | |
| NYHA IV | 452 (6.3%) | 42 (14.5%) | 410 (6.0%) | |
| Cardiac arrhythmias | 1866 (26.1%) | 91 (31.4%) | 1775 (25.8%) | 0.035 |
| Ventricular tachycardia | 33 (0.5%) | 4 (1.4%) | 29 (0.4%) | 0.005 |
| Ventricular fibrillation | 15 (0.2%) | 0 | 15 (0.2%) | 0.469 |
| Atrial flutter/atrial fibrillation | 1745 (24.4%) | 86 (29.7%) | 1659 (24.1%) | <0.001 |
| Atrioventricular block | 51 (0.7%) | 2 (0.7%) | 49 (0.7%) | 0.824 |
| Prior MI | 240 (3.4%) | 18 (6.2%) | 222 (3.2%) | 0.006 |
| Prior PCI | 214 (3.0%) | 8 (2.8%) | 206 (3.0%) | 0.815 |
| Prior cardiac surgery | 395 (5.5%) | 35 (12.1%) | 360 (5.2%) | <0.001 |
| Prior CABG | 35 (0.5%) | 3 (1.0%) | 32 (0.5%) | 0.039 |
| Prior valvular surgery | 255 (3.6%) | 21 (7.2%) | 234 (3.4%) | <0.001 |
| Prior congenital heart disease surgery | 7 (0.1%) | 1 (0.3%) | 6 (0.1%) | 0.058 |
| Prior vascular surgery | 10 (0.1%) | 2 (0.7%) | 8 (0.1%) | 0.083 |
| Others | 65 (0.9%) | 5 (1.7%) | 60 (0.9%) | 0.017 |
| SCr (umol/L) | 84.6 ± 34.2 | 99.7 ± 49.6 | 84.0 ± 33.2 | <0.001 |
| CCr (ml/min/1.73 m2) | 63.6 ± 19.4 | 54.8 ± 19.4 | 64.0 ± 19.3 | <0.001 |
| TC (mmol/L) | 4.12 (3.45,4.83) | 3.88 (3.28,4.63) | 4.12 (3.47,4.84) | 0.001 |
| LDL (mmol/L) | 2.47 (1.94,3.05) | 2.34 (1.86,2.87) | 2.47 (1.94,3.06) | 0.021 |
| FBG (mmol/L) | 5.6 ± 1.6 | 5.9 ± 2.1 | 5.5 ± 1.6 | 0.001 |
| LVEF (%) | 59.6 ± 8.8 | 56.2 ± 11.0 | 59.7 ± 8.6 | <0.001 |
| LVEDD (mm) | 54.2 ± 10.5 | 53.5 ± 12.4 | 54.2 ± 10.4 | 0.388 |
| LAD (mm) | 47.0 ± 11.0 | 48.5 ± 11.6 | 46.9 ± 10.9 | 0.062 |
| AS | 1912 (26.7%) | 66 (22.8%) | 1846 (26.9%) | 0.122 |
| AI grades | 0.357 | |||
| None | 3195 (44.6%) | 118 (40.7%) | 3077 (44.8%) | |
| Mild | 1649 (23.0%) | 77 (26.6%) | 1572 (22.9%) | |
| Moderate | 1402 (19.6%) | 54 (18.6%) | 1348 (19.6%) | |
| Severe | 917 (12.8%) | 41 (14.1%) | 876 (12.7%) | |
| MS | 1485 (20.7%) | 79 (27.2%) | 1406 (20.5%) | 0.005 |
| MI grades | 0.015 | |||
| None | 2575 (35.9%) | 83 (28.6%) | 2492 (36.3%) | |
| Mild | 1407 (19.6%) | 52 (17.9%) | 1355 (19.7%) | |
| Moderate | 1653 (23.1%) | 81 (27.9%) | 1572 (22.9%) | |
| Severe | 1528 (21.3%) | 74 (25.5%) | 1454 (21.2%) | |
| TS | 18 (0.3%) | 2 (0.7%) | 16 (0.2%) | 0.128 |
| TI grades | 0.004 | |||
| None | 3268 (45.6%) | 110 (37.9%) | 3158 (45.9%) | |
| Mild | 1950 (27.2%) | 79 (27.2%) | 1871 (27.2%)) | |
| Moderate | 1367 (19.1%) | 64 (22.1%) | 1303 (19.0%) | |
| Severe | 578 (8.1%) | 37 (12.8%) | 541 (7.9%) | |
| PS | 11 (0.2%) | 0 | 11 (0.2%) | 0.495 |
| PI grades | 0.929 | |||
| None | 6881 (96.1%) | 277 (95.5%) | 6604 (96.1%) | |
| Mild | 253 (3.5%) | 12 (4.1%) | 241 (3.5%) | |
| Moderate | 26 (0.4%) | 1 (0.3%) | 25 (0.4%) | |
| Severe | 3 (0.0%) | 0 | 3 (0.0%) | |
| Intraoperative factors | ||||
| CPB time (min) | 129.2 ± 62.3 | 196.4 ± 137.4 | 126.4 ± 55.4 | <0.001 |
| ACC time (min) | 87.3 ± 42.0 | 113.1 ± 66.1 | 86.4 ± 40.4 | <0.001 |
| Combined CABG | 1765 (24.6%) | 114 (39.3%) | 1651 (24.0%) | <0.001 |
| Aortic valve surgery | 3757 (52.5%) | 126 (43.4%) | 3631 (52.8%) | 0.007 |
| Mitral valve surgery | 4354 (60.8%) | 203 (70.0%) | 4151 (60.4%) | 0.002 |
| Tricuspid valve surgery | 2623 (36.6%) | 115 (39.7%) | 2508 (36.5%) | 0.461 |
| Pulmonary valve surgery | 88 (0.0%) | 4 (0.0%) | 84 (0.0%) | 0.838 |
| Others | 2175 (30.4%) | 109 (37.6%) | 2066 (30.1%) | 0.006 |
| RBC transfusion (u) | 2 (1.5,4) | 4 (2,8) | 2 (1,4) | <0.001 |
| FFP transfusion (u) | 2 (0,3) | 2.5 (1.5,5) | 2 (0,3) | <0.001 |
| Postoperative factors | ||||
| RBC transfusion (u) | 2 (1,5) | 8 (3,16) | 2 (1,4.5) | <0.001 |
| FFP transfusion (u) | 2 (1,4) | 4.5 (2,12) | 2 (1,4) | <0.001 |
| Mechanical ventilation time (h) | 20 (15,33) | 76 (22,203) | 20 (15,29) | <0.001 |
| Reintubation | 152 (2.5%) | 60 (20.7%) | 92 (1.3%) | <0.001 |
| Initial ICU stays (h) | 66 (42,96) | 120 (45,253) | 66 (42,96) | <0.001 |
| Readmission to the ICU | 176 (2.5%) | 45 (15.5%) | 131 (1.9%) | <0.001 |
| Readmission ICU stays (h) | 83 (31,179) | 75 (18,293) | 84 (38,141) | 0.856 |
| Volume of drainage (ml) | 560 (0.1020) | 1200 (395,2218) | 550 (0.990) | <0.001 |
| Reoperation | 280 (3.9%) | 60 (20.7%) | 220 (3.2%) | <0.001 |
| Cardiac tamponade | 40 (0.6%) | 10 (3.4%) | 30 (0.4%) | <0.001 |
| Postoperative MI | 50 (0.7%) | 5 (1.7%) | 45 (0.7%) | 0.032 |
| New-onset cerebrovascular accident | 27 (0.4%) | 10 (3.4%) | 17 (0.2%) | <0.001 |
| Pulmonary embolism | 2 (0.0%) | 2 (0.7%) | 0 (0.0%) | <0.001 |
| Acute kidney injury | 156 (2.2%) | 88 (30.3%) | 68 (1.0%) | <0.001 |
| Dialysis | 100 (1.4%) | 69 (23.8%) | 31 (0.5%) | <0.001 |
| New-onset atrial fibrillation | 158 (2.2%) | 16 (5.5%) | 142 (2.1%) | <0.001 |
| MODS | 111 (1.5%) | 106 (36.6%) | 5 (0.1%) | <0.001 |
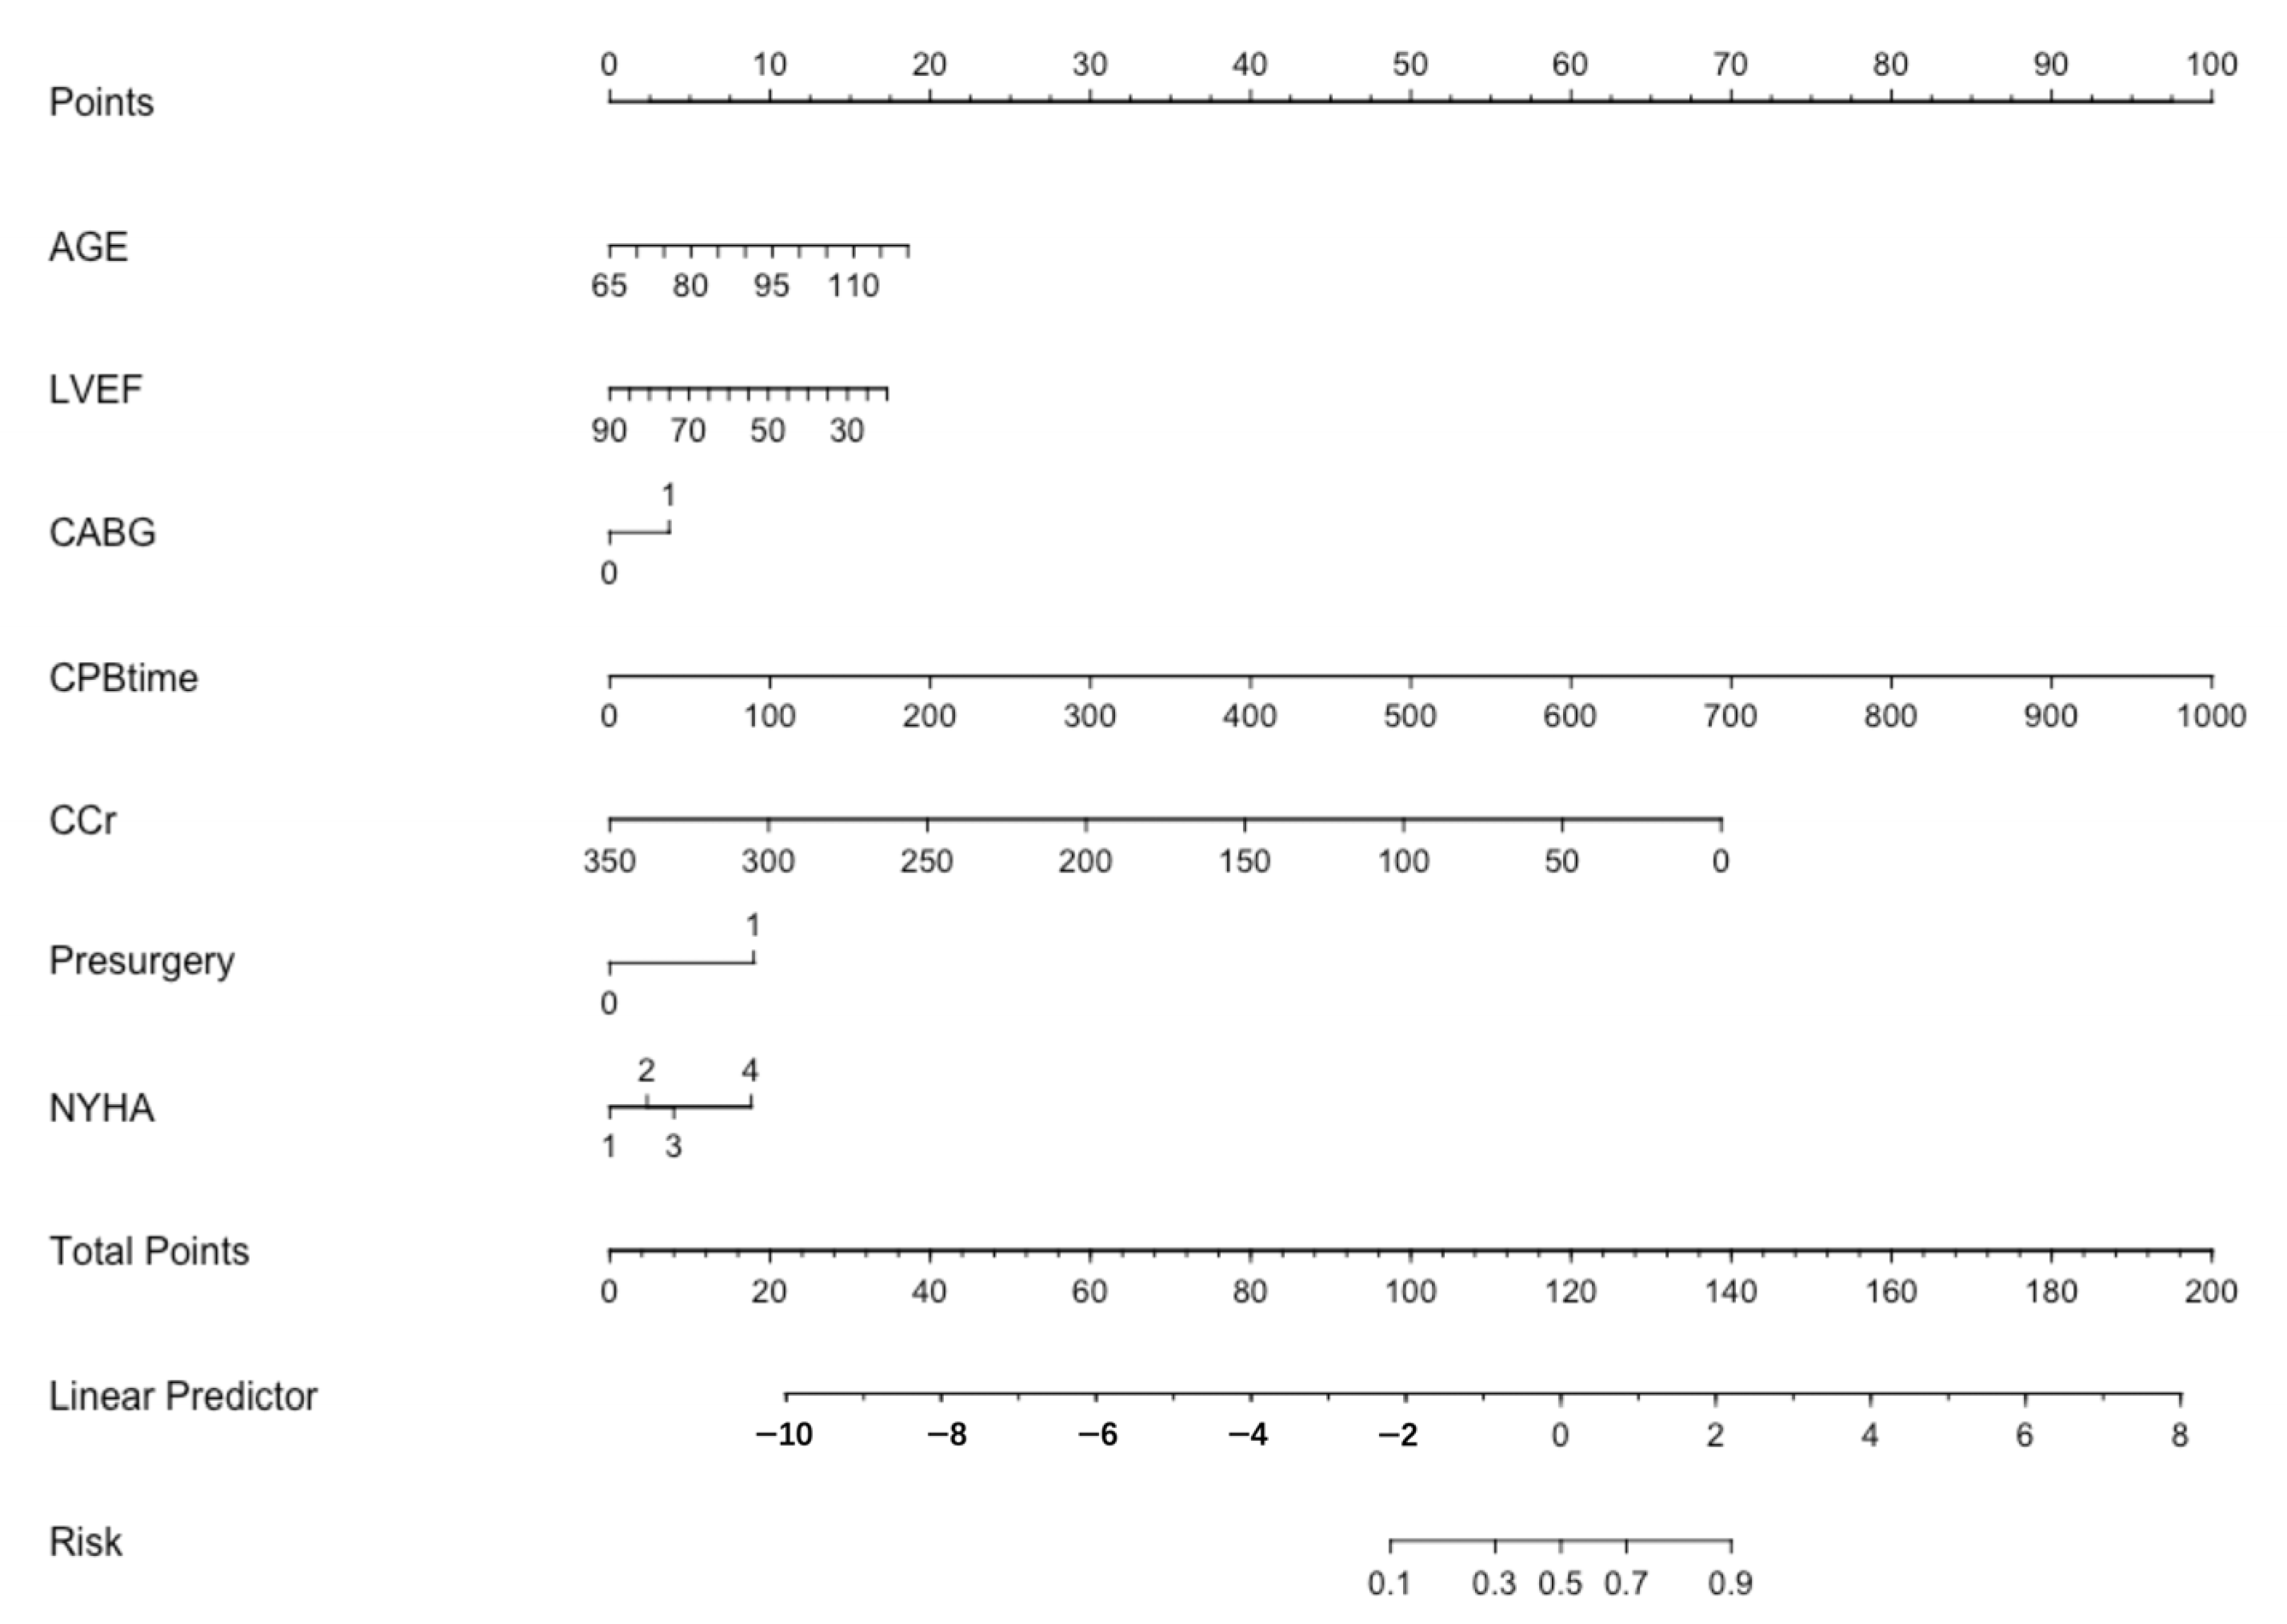
| Risk Factors | Coefficient | Odds Ratio | 95% CI | p Value * | |
|---|---|---|---|---|---|
| LCI | UCI | ||||
| Age | 0.036 | 1.037 | 1.011 | 1.063 | 0.005 |
| Prior cardiac surgery | 0.928 | 2.529 | 1.572 | 4.070 | 0.000 |
| LVEF | −0.026 | 0.974 | 0.957 | 0.991 | 0.003 |
| CCr | −0.021 | 0.979 | 0.970 | 0.989 | 0.000 |
| CPB time | 0.01 | 1.010 | 1.009 | 1.012 | 0.000 |
| Combined CABG | 0.389 | 1.475 | 1.038 | 2.097 | 0.03 |
| NYHA class | 0.328 | 1.389 | 1.090 | 1.769 | 0.000 |
Disclaimer/Publisher’s Note: The statements, opinions and data contained in all publications are solely those of the individual author(s) and contributor(s) and not of MDPI and/or the editor(s). MDPI and/or the editor(s) disclaim responsibility for any injury to people or property resulting from any ideas, methods, instructions or products referred to in the content. |
© 2023 by the authors. Licensee MDPI, Basel, Switzerland. This article is an open access article distributed under the terms and conditions of the Creative Commons Attribution (CC BY) license (https://creativecommons.org/licenses/by/4.0/).
Share and Cite
Zhu, K.; Lin, H.; Yang, X.; Gong, J.; An, K.; Zheng, Z.; Hou, J. An In-Hospital Mortality Risk Model for Elderly Patients Undergoing Cardiac Valvular Surgery Based on LASSO-Logistic Regression and Machine Learning. J. Cardiovasc. Dev. Dis. 2023, 10, 87. https://doi.org/10.3390/jcdd10020087
Zhu K, Lin H, Yang X, Gong J, An K, Zheng Z, Hou J. An In-Hospital Mortality Risk Model for Elderly Patients Undergoing Cardiac Valvular Surgery Based on LASSO-Logistic Regression and Machine Learning. Journal of Cardiovascular Development and Disease. 2023; 10(2):87. https://doi.org/10.3390/jcdd10020087
Chicago/Turabian StyleZhu, Kun, Hongyuan Lin, Xichun Yang, Jiamiao Gong, Kang An, Zhe Zheng, and Jianfeng Hou. 2023. "An In-Hospital Mortality Risk Model for Elderly Patients Undergoing Cardiac Valvular Surgery Based on LASSO-Logistic Regression and Machine Learning" Journal of Cardiovascular Development and Disease 10, no. 2: 87. https://doi.org/10.3390/jcdd10020087