
Association of the Combination of Moderate-to-Vigorous Physical Activity and Sleep Quality with Physical Frailty
 , , , ,
Abstract
:1. Introduction
2. Materials and Methods
2.1. Study Design
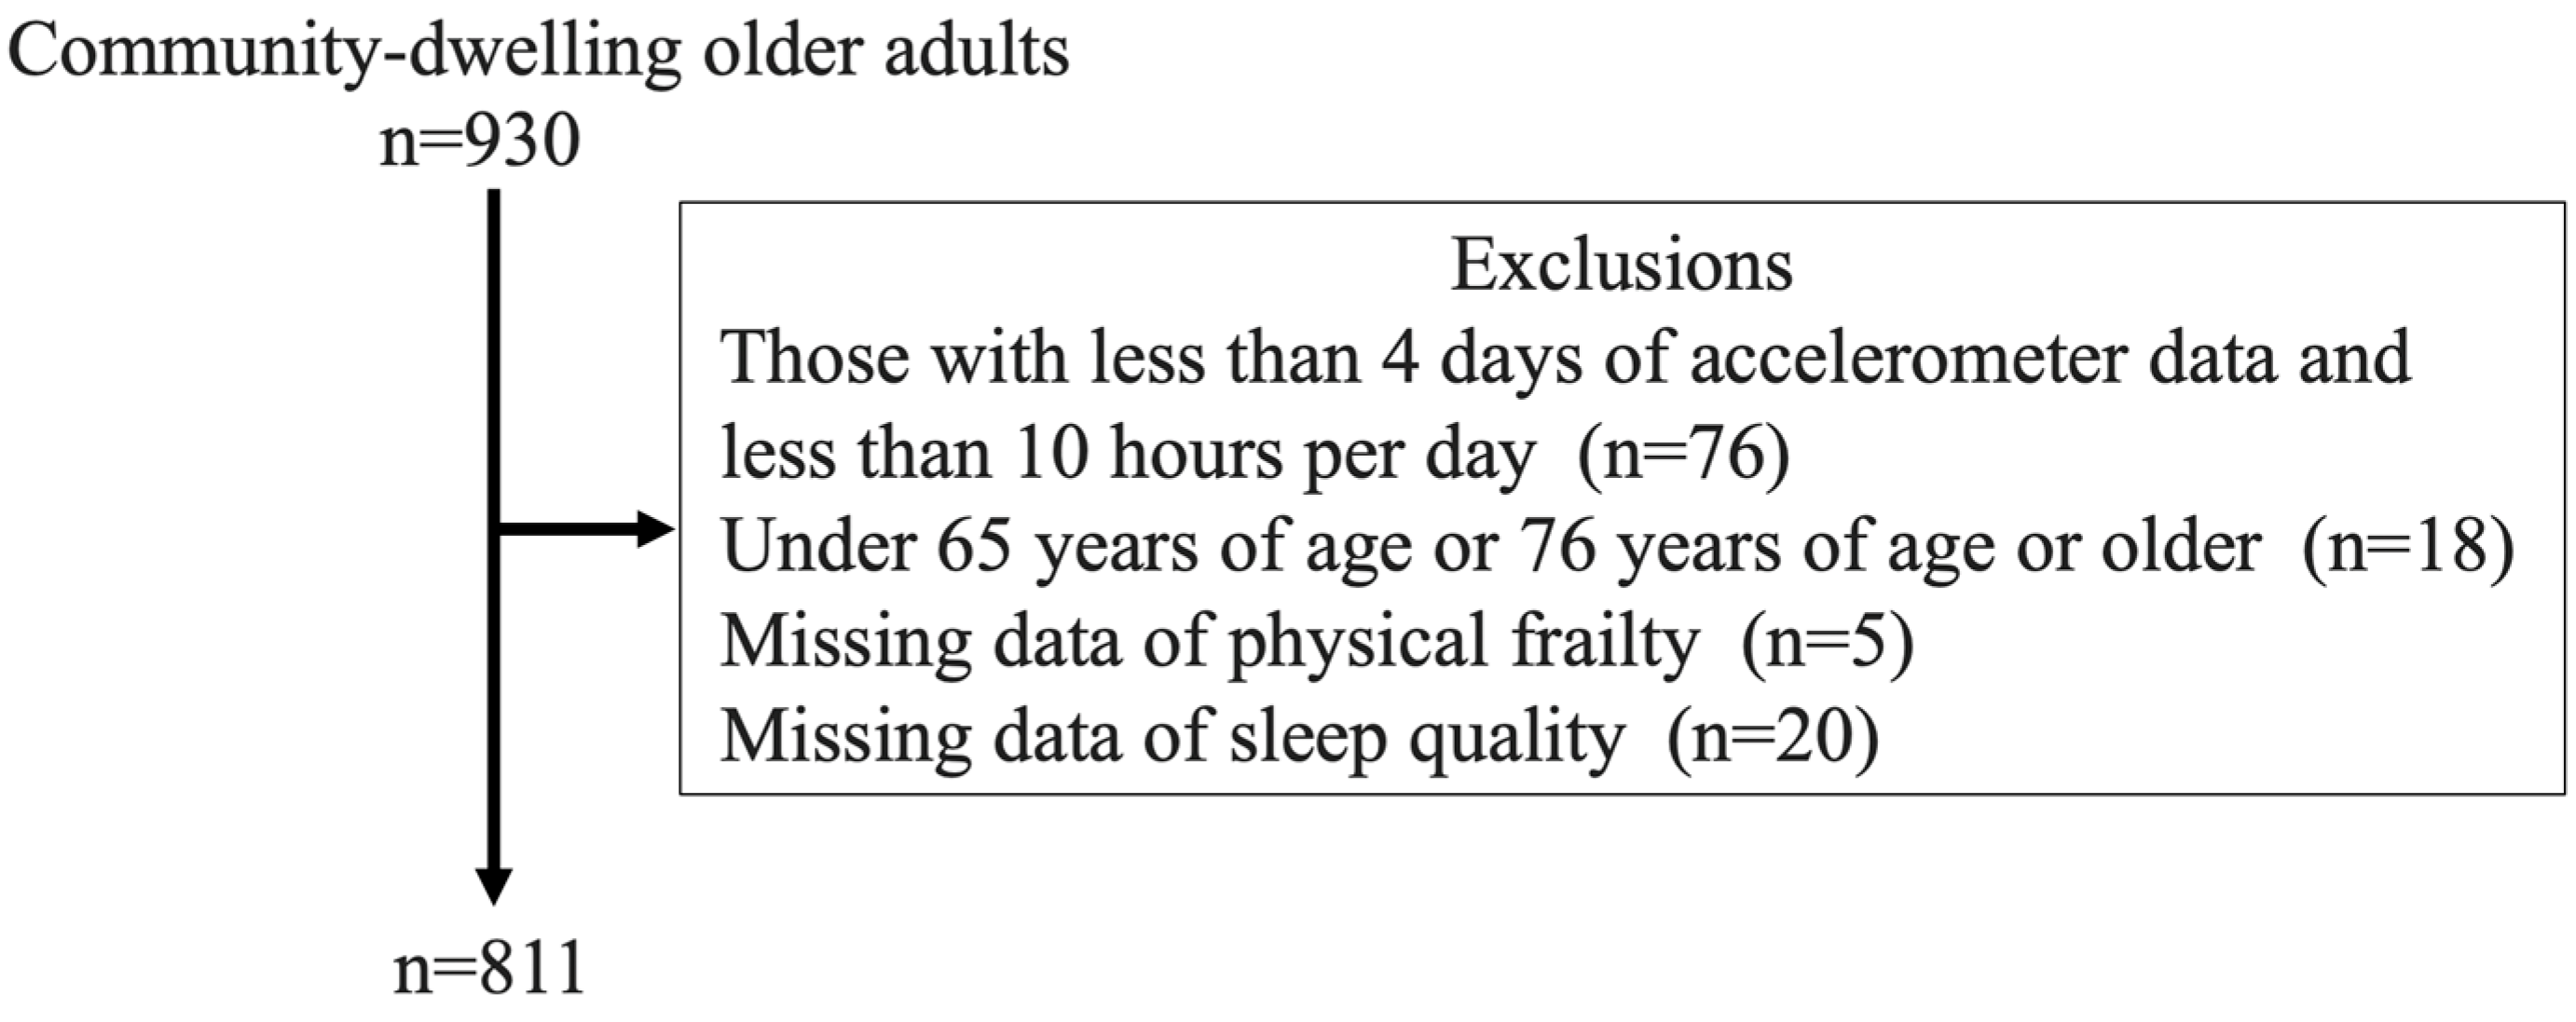
2.2. Participants
2.3. Measurements
2.3.1. Physical Frailty
2.3.2. Physical Activity
2.3.3. Sleep Quality
2.4. Statistical Analyses
3. Results
3.1. Comparison of Characteristics in the Combination of MVPA and Sleep Quality
3.2. Association between the Combination of MVPA and Sleep Quality and Physical Pre-Frailty and Frailty
3.3. Association between the Combination of MVPA and Sleep Quality and Components of Physical Frailty
4. Discussion
5. Conclusions
Author Contributions
Funding
Institutional Review Board Statement
Informed Consent Statement
Data Availability Statement
Acknowledgments
Conflicts of Interest
Abbreviations
| ANOVA | analysis of variance |
| BMI | body mass index |
| CI | confidence interval |
| MET | metabolic equivalent of task |
| MMSE | Mini-Mental State Examination |
| MPA | moderate physical activity |
| MVPA | moderate-to-vigorous physical activity |
| OR | odds ratio |
| PAEE | physical activity energy expenditure |
| PSQI | Pittsburgh Sleep Quality Index |
| ST | sedentary time |
| VPA | vigorous physical activity |
| WHO | World Health Organization |
References
- Fried, L.P.; Tangen, C.M.; Walston, J.; Newman, A.B.; Hirsch, C.; Gottdiener, J.; Seeman, T.; Tracy, R.; Kop, W.J.; Burke, G.; et al. Frailty in older adults: Evidence for a phenotype. J. Gerontol. Ser. A Biol. Sci. Med. Sci. 2001, 56, M146–M156. [Google Scholar] [CrossRef]
- Katsuya, I. Older people and society (including oral frailty). Jpn. Soc. Intern. Med. 2018, 107, 2469–2477. (In Japanese) [Google Scholar] [CrossRef]
- Chen, S.; Honda, T.; Narazaki, K.; Chen, T.; Kishimoto, H.; Kumagai, S. Physical frailty and risk of needing long-term care in community-dwelling older adults: A 6-year prospective study in Japan. J. Nutr. Health Aging 2019, 23, 856–861. [Google Scholar] [CrossRef]
- Lohman, M.C.; Sonnega, A.J.; Resciniti, N.V.; Leggett, A.N. Frailty phenotype and cause-specific mortality in the United States. J. Gerontol. Ser. A Biol. Sci. Med. Sci. 2020, 75, 1935–1942. [Google Scholar] [CrossRef]
- Negm, A.M.; Kennedy, C.C.; Thabane, L.; Veroniki, A.-A.; Adachi, J.D.; Richardson, J.; Cameron, I.D.; Giangregorio, A.; Petropoulou, M.; Alsaad, S.M.; et al. Management of frailty: A systematic review and network meta-analysis of randomized controlled trials. J. Am. Med. Dir. Assoc. 2019, 20, 1190–1198. [Google Scholar] [CrossRef]
- Blodgett, J.; Theou, O.; Kirkland, S.; Andreou, P.; Rockwood, K. The association between sedentary behaviour, moderate–vigorous physical activity and frailty in NHANES cohorts. Maturitas 2015, 80, 187–191. [Google Scholar] [CrossRef]
- Chen, S.; Chen, T.; Kishimoto, H.; Yatsugi, H.; Kumagai, S. Associations of objectively measured patterns of sedentary behavior and physical activity with frailty status screened by The Frail Scale in Japanese community-dwelling older adults. J. Sports Sci. Med. 2020, 19, 166–174. [Google Scholar]
- Yokote, T.; Yatsugi, H.; Chu, T.; Liu, X.; Kishimoto, H. Associations between various perspectives of activity and physical frailty in older Japanese: A cross-sectional study. BMC Geriatr. 2023, 23, 785. [Google Scholar] [CrossRef]
- Ohayon, M.M.; Carskadon, M.A.; Guilleminault, C.; Vitiello, M.V. Meta-analysis of quantitative sleep parameters from childhood to old age in healthy individuals: Developing normative sleep values across the human lifespan. Sleep 2004, 27, 1255–1273. [Google Scholar] [CrossRef]
- Moreno-Tamayo, K.; Manrique-Espinoza, B.; Ortiz-Barrios, L.B.; Cárdenas-Bahena, A.; Ramírez-García, E.; Sánchez-García, S. Insomnia, low sleep quality, and sleeping little are associated with frailty in Mexican women. Maturitas 2020, 136, 7–12. [Google Scholar] [CrossRef]
- Shih, A.-C.; Chen, L.-H.; Tsai, C.-C.; Chen, J.-Y. Correlation between sleep quality and frailty status among middle-aged and older Taiwanese people: A community-based, cross-sectional study. Int. J. Environ. Res. Public Health 2020, 17, 9457. [Google Scholar] [CrossRef]
- Sun, X.-H.; Ma, T.; Yao, S.; Chen, Z.-K.; Xu, W.-D.; Jiang, X.-Y.; Wang, X.-F. Associations of sleep quality and sleep duration with frailty and pre-frailty in an elderly population Rugao longevity and ageing study. BMC Geriatr. 2020, 20, 9. [Google Scholar] [CrossRef]
- Kim, M.; Yoshida, H.; Sasai, H.; Kojima, N.; Kim, H. Association between objectively measured sleep quality and physical function among community-dwelling oldest old Japanese: A cross-sectional study. Geriatr. Gerontol. Int. 2015, 15, 1040–1048. [Google Scholar] [CrossRef]
- Kubala, A.G.; Buysse, D.J.; Brindle, R.C.; Krafty, R.T.; Thayer, J.F.; Hall, M.H.; Kline, C.E. The association between physical activity and a composite measure of sleep health. Sleep Breath. 2020, 24, 1207–1214. [Google Scholar] [CrossRef]
- Chen, S.; Chen, T.; Kishimoto, H.; Susaki, Y.; Kumagai, S. Development of a Fried Frailty Phenotype Questionnaire for Use in Screening Community-Dwelling Older Adults. J. Am. Med. Dir. Assoc. 2020, 21, 272–276.e1. [Google Scholar] [CrossRef]
- Tsutsui, T.; Muramatsu, N. Care-needs certification in the long-term care insurance system of Japan. J. Am. Geriatr. Soc. 2005, 53, 522–527. [Google Scholar] [CrossRef]
- Liu, X.; Chen, T.; Chen, S.; Yatsugi, H.; Chu, T.; Kishimoto, H. The Relationship between psychological distress and physical frailty in Japanese community-dwelling older adults: A cross-sectional study. J. Frailty Aging 2023, 12, 43–48. [Google Scholar] [CrossRef]
- Kessler, R.C.; Andrews, G.; Colpe, L.J.; Hiripi, E.; Mroczek, D.K.; Normand, S.-L.T.; Walters, E.E.; Zaslavsky, A.M. Short screening scales to monitor population prevalences and trends in non-specific psychological distress. Psychol. Med. 2002, 32, 959–976. [Google Scholar] [CrossRef]
- Chen, S.; Honda, T.; Chen, T.; Narazaki, K.; Haeuchi, Y.; Supartini, A.; Kumagai, S. Screening for frailty phenotype with objectively-measured physical activity in a west Japanese suburban community: Evidence from the Sasaguri Genkimon Study. BMC Geriatr. 2015, 15, 36. [Google Scholar] [CrossRef]
- Narazaki, K.; Matsuo, E.; Honda, T.; Nofuji, Y.; Yonemoto, K.; Kumagai, S. Physical fitness measures as potential markers of low cognitive function in Japanese community-dwelling older adults without apparent cognitive problems. J. Sports Sci. Med. 2014, 13, 590–596. [Google Scholar]
- Nagayoshi, S.; Yatsugi, H.; Liu, X.; Saito, T.; Yamatsu, K.; Kishimoto, H. Evaluation of physical activity assessment using a triaxial activity monitor in community-dwelling older Japanese adults with and without lifestyle-related diseases. J. Meas. Phys. Behav. 2023, 6, 264–270. [Google Scholar] [CrossRef]
- Trost, S.G.; Mciver, K.L.; Pate, R.R. Conducting accelerometer-based activity assessments in field-based research. Med. Sci. Sports Exerc. 2005, 37, S531–S543. [Google Scholar] [CrossRef]
- Murphy, S.L. Review of physical activity measurement using accelerometers in older adults: Considerations for research design and conduct. Prev. Med. 2009, 48, 108–114. [Google Scholar] [CrossRef]
- Ohkawara, K.; Oshima, Y.; Hikihara, Y.; Ishikawa-Takata, K.; Tabata, I.; Tanaka, S. Real-time estimation of daily physical activity intensity by a triaxial accelerometer and a gravity-removal classification algorithm. Br. J. Nutr. 2011, 105, 1681–1691. [Google Scholar] [CrossRef]
- Nagayoshi, S.; Oshima, Y.; Ando, T.; Aoyama, T.; Nakae, S.; Usui, C.; Kumagai, S.; Tanaka, S. Validity of estimating physical activity intensity using a triaxial accelerometer in healthy adults and older adults. BMJ Open Sport Exerc. Med. 2019, 5, e000592. [Google Scholar] [CrossRef]
- World Health Organization. WHO Guidelines on Physical Activity and Sedentary Behavior. 2020. Available online: https://www.who.int/publications/i/item/9789240015128 (accessed on 3 June 2023).
- Doi, Y.; Minowa, M.; Uchiyama, M.; Okawa, M.; Kim, K.; Shibui, K.; Kamei, Y. Psychometric assessment of subjective sleep quality using the Japanese version of the Pittsburgh Sleep Quality Index (PSQI-J) in psychiatric disordered and control subjects. Psychiatry Res. 2000, 97, 165–172. [Google Scholar] [CrossRef]
- Collard, R.M.; Boter, H.; Schoevers, R.A.; Voshaar, R.C.O. Prevalence of frailty in community-dwelling older persons: A systematic review. J. Am. Geriatr. Soc. 2012, 60, 1487–1492. [Google Scholar] [CrossRef]
- Katewongsa, P.; Yousomboon, C.; Haemathulin, N.; Rasri, N.; Widyastari, D.A. Prevalence of sufficient MVPA among Thai adults: Pooled panel data analysis from Thailand’s surveillance on physical activity 2012–2019. BMC Public Health 2021, 21, 665. [Google Scholar] [CrossRef]
- Zitser, J.; Zitser, J.; Allen, I.E.; Allen, I.E.; Falgàs, N.; Falgàs, N.; Le, M.M.; Le, M.M.; Neylan, T.C.; Neylan, T.C.; et al. Pittsburgh Sleep Quality Index (PSQI) responses are modulated by total sleep time and wake after sleep onset in healthy older adults. PLoS ONE 2022, 17, e0270095. [Google Scholar] [CrossRef]
- Castaneda-Gameros, D.; Redwood, S.; Thompson, J.L. Physical activity, sedentary time, and frailty in older migrant women from ethnically diverse backgrounds: A mixed-methods study. J. Aging Phys. Act. 2018, 26, 194–203. [Google Scholar] [CrossRef]
- Goldman, S.E.; Ancoli-Israel, S.; Boudreau, R.; Cauley, J.A.; Hall, M.; Stone, K.L.; Rubin, S.M.; Satterfield, S.; Simonsick, E.M.; Newman, A.B. Sleep problems and associated daytime fatigue in community-dwelling older individuals. J. Gerontol. Ser. A Biol. Sci. Med. Sci. 2008, 63, 1069–1075. [Google Scholar] [CrossRef]
- Hita-Contreras, F.; Zagalaz-Anula, N.; Martínez-Amat, A.; Cruz-Díaz, D.; Sánchez-Montesinos, I.; Aibar-Almazán, A.; Lomas-Vega, R. Sleep quality and its association with postural stability and fear of falling among Spanish postmenopausal women. Menopause 2018, 25, 62–69. [Google Scholar] [CrossRef]
- Dattilo, M.; Antunes, H.; Medeiros, A.; Neto, M.M.; Souza, H.; Tufik, S.; de Mello, M. Sleep and muscle recovery: Endocrinological and molecular basis for a new and promising hypothesis. Med. Hypotheses 2011, 77, 220–222. [Google Scholar] [CrossRef]
- Shibuki, T.; Iida, M.; Harada, S.; Kato, S.; Kuwabara, K.; Hirata, A.; Sata, M.; Matsumoto, M.; Osawa, Y.; Okamura, T.; et al. The association between sleep parameters and sarcopenia in Japanese community-dwelling older adults. Arch. Gerontol. Geriatr. 2023, 109, 104948. [Google Scholar] [CrossRef]
- Spartano, N.L.; Lyass, A.; Larson, M.G.; Tran, T.; Andersson, C.; Blease, S.J.; Esliger, D.W.; Vasan, R.S.; Murabito, J.M. Objective physical activity and physical performance in middle-aged and older adults. Exp. Gerontol. 2019, 119, 203–211. [Google Scholar] [CrossRef]
- Ramsey, K.A.; Rojer, A.G.; D’andrea, L.; Otten, R.H.; Heymans, M.W.; Trappenburg, M.C.; Verlaan, S.; Whittaker, A.C.; Meskers, C.G.; Maier, A.B. The association of objectively measured physical activity and sedentary behavior with skeletal muscle strength and muscle power in older adults: A systematic review and meta-analysis. Ageing Res. Rev. 2021, 67, 101266. [Google Scholar] [CrossRef]


| MVA+SLP+ n = 360 | MVA+SLP− n = 105 | MVA−SLP+ n = 301 | MVA−SLP− n = 88 | p-Value | |
|---|---|---|---|---|---|
| Age, yrs | 70 (68–73) | 71 (68–73) | 70 (68–74) | 72 (69–75) * | <0.01 |
| Men | 158 (46.3) | 42 (41.6) | 147 (52.1) | 39 (44.8) | 0.23 |
| BMI, kg/m2 | 22.6 ± 3.1 | 22.5 ± 3.2 | 23.2 ± 3.0 | 23.2 ± 3.6 | 0.08 |
| Presence of disease | 247 (72.4) | 76 (75.3) | 227 (80.5) | 81 (93.1) * | <0.01 |
| No. of pain sites | 1 (0–2) | 2 (1–3) * | 1 (0–2) | 2 (1–3) * | <0.01 |
| Education, yrs | 12.9 ± 2.3 | 12.8 ± 2.5 | 13.2 ± 2.5 | 12.5 ± 2.1 | 0.06 |
| Presence of tobacco smoking habit | 18 (5.3) | 2 (2.0) | 34 (12.1) * | 8 (9.2) | <0.01 |
| Presence of alcohol habit | 181 (53.1) | 52 (51.5) | 140 (49.7) | 37 (42.5) | 0.36 |
| MMSE, score | 29 (26–30] | 28 (26–30) | 28 (26–30) | 28 (26–30) | 0.55 |
| Sedentary time, min/day | 412 ± 104.8 | 417.8 ± 102.7 | 486.9 ± 9.9 * | 477.1 ± 99.6 * | <0.01 |
| Physical pre-frailty | 146 (42.8) | 48 (47.5) | 165 (58.5) * | 57 (65.5) * | <0.01 |
| Physical frailty | 2 (0.6) | 2 (2.0) | 23 (8.2) * | 11 (12.6) * | |
| Low grip strength | 63 (18.5) | 20 (19.8) | 62 (22.0) | 23 (26.4) | 0.38 |
| Slow gait speed | 47 (13.8) | 1 (10.9) | 74 (26.2) * | 27 (31.0) * | <0.01 |
| Psychological stress | 28 (8.2) | 22 (21.8) * | 28 (9.9) | 24 (27.6) * | <0.01 |
| Weight loss | 33 (9.7) | 8 (7.9) | 25 (8.9) | 11 (12.6) | 0.70 |
| Low physical activity | 9 (2.6) | 2 (2.0) | 105 (37.2) * | 35 (40.2) * | <0.01 |
| n (%) | Prevalence, n (%) | Model 1 | Model 2 | |||||
|---|---|---|---|---|---|---|---|---|
| OR | 95%CI | p-Value | OR | 95%CI | p-Value | |||
| MVA+SLP+ | 360 (42.2) | Pre-frailty, 146 (42.8) Frailty, 2 (0.6) | 1.00 | reference | − | 1.00 | reference | − |
| MVA+SLP− | 105 (12.3) | Pre-frailty, 48 (47.5) Frailty, 2 (2.0) | 1.29 | 0.83–2.01 | 0.25 | 1.10 | 0.70–1.74 | 0.68 |
| MVA−SLP+ | 301 (35.3) | Pre-frailty, 165 (58.5) Frailty, 23 (8.2) | 2.86 | 2.07–3.94 | <0.01 | 2.56 | 1.80–3.62 | <0.01 |
| MVA−SLP− | 88 (10.3) | Pre-frailty, 57 (65.5) Frailty, 11 (12.6) | 5.24 | 3.17–8.69 | <0.01 | 3.97 | 2.33–6.74 | <0.01 |
| Group | n (%) | No. of Participants Applicable to Each Component (The Rate of That Number in Each Group) | Model 1 | Model 2 | ||||
|---|---|---|---|---|---|---|---|---|
| OR | 95%CI | p-Value | OR | 95%CI | p-Value | |||
| Low grip strength | ||||||||
| MVA+SLP+ | 360 (42.2) | 63 (18.5) | 1.00 | reference | − | 1.00 | reference | − |
| MVA+SLP− | 105 (12.3) | 20 (19.8) | 1.09 | 0.62–1.91 | 0.76 | 1.02 | 0.58–1.82 | 0.94 |
| MVA−SLP+ | 301 (35.3) | 62 (22.0) | 1.24 | 0.84–1.84 | 0.28 | 1.29 | 0.84–1.99 | 0.25 |
| MVA−SLP− | 88 (10.3) | 23 (26.4) | 1.59 | 0.92–2.75 | 0.10 | 1.40 | 0.77–2.54 | 0.27 |
| Slow gait speed | ||||||||
| MVA+SLP+ | 360 (42.2) | 47 (13.8) | 1.00 | reference | − | 1.00 | reference | − |
| MVA+SLP− | 105 (12.3) | 1 (10.9) | 0.77 | 0.38–1.54 | 0.45 | 0.66 | 0.32–1.34 | 0.25 |
| MVA−SLP+ | 301 (35.3) | 74 (26.2) | 2.23 | 11.48–3.34 | <0.01 | 1.91 | 1.22–2.99 | <0.01 |
| MVA−SLP− | 88 (10.3) | 27 (31.0) | 2.82 | 1.63–4.87 | <0.01 | 1.98 | 1.08–3.61 | 0.03 |
| Psychological stress | ||||||||
| MVA+SLP+ | 360 (42.2) | 28 (8.2) | 1.00 | reference | − | 1.00 | reference | − |
| MVA+SLP− | 105 (12.3) | 22 (21.8) | 3.11 | 1.69–5.73 | <0.01 | 2.66 | 1.42–4.96 | <0.01 |
| MVA−SLP+ | 301 (35.3) | 28 (9.9) | 1.23 | 0.71–2.13 | 0.46 | 1.26 | 0.70–2.27 | 0.43 |
| MVA−SLP− | 88 (10.3) | 24 (27.6) | 4.26 | 2.32–7.83 | <0.01 | 3.85 | 1.98–7.47 | <0.01 |
| Weight loss | ||||||||
| MVA+SLP+ | 360 (42.2) | 33 (9.7) | 1.00 | reference | − | 1.00 | reference | − |
| MVA+SLP− | 105 (12.3) | 8 (7.9) | 0.80 | 0.36–1.80 | 0.59 | 0.75 | 0.72–3.45 | 0.48 |
| MVA−SLP+ | 301 (35.3) | 25 (8.9) | 0.91 | 0.53–1.57 | 0.73 | 1.05 | 0.33–1.70 | 0.87 |
| MVA−SLP− | 88 (10.3) | 11 (12.6) | 1.35 | 0.65–2.80 | 0.42 | 1.57 | 0.58–1.89 | 0.26 |
| Low physical activity | ||||||||
| MVA+SLP+ | 360 (42.2) | 9 (2.6) | 1.00 | reference | − | 1.00 | reference | − |
| MVA+SLP− | 105 (12.3) | 2 (2.0) | 0.75 | 0.16–3.51 | 0.71 | 0.60 | 0.12–2.93 | 0.53 |
| MVA−SLP+ | 301 (35.3) | 105 (37.2) | 21.9 | 10.82–44.28 | <0.01 | 16.1 | 7.55–34.23 | <0.01 |
| MVA−SLP− | 88 (10.3) | 35 (40.2) | 24.8 | 11.28–54.64 | <0.01 | 18.0 | 7.54–43.08 | <0.01 |
Disclaimer/Publisher’s Note: The statements, opinions and data contained in all publications are solely those of the individual author(s) and contributor(s) and not of MDPI and/or the editor(s). MDPI and/or the editor(s) disclaim responsibility for any injury to people or property resulting from any ideas, methods, instructions or products referred to in the content. |
© 2024 by the authors. Licensee MDPI, Basel, Switzerland. This article is an open access article distributed under the terms and conditions of the Creative Commons Attribution (CC BY) license (https://creativecommons.org/licenses/by/4.0/).
Share and Cite
Yokote, T.; Yatsugi, H.; Chu, T.; Liu, X.; Wang, L.; Kishimoto, H. Association of the Combination of Moderate-to-Vigorous Physical Activity and Sleep Quality with Physical Frailty. Geriatrics 2024, 9, 31. https://doi.org/10.3390/geriatrics9020031
Yokote T, Yatsugi H, Chu T, Liu X, Wang L, Kishimoto H. Association of the Combination of Moderate-to-Vigorous Physical Activity and Sleep Quality with Physical Frailty. Geriatrics. 2024; 9(2):31. https://doi.org/10.3390/geriatrics9020031
Chicago/Turabian StyleYokote, Tsubasa, Harukaze Yatsugi, Tianshu Chu, Xin Liu, Lefei Wang, and Hiro Kishimoto. 2024. "Association of the Combination of Moderate-to-Vigorous Physical Activity and Sleep Quality with Physical Frailty" Geriatrics 9, no. 2: 31. https://doi.org/10.3390/geriatrics9020031