
Relationships among Physical Activity, Physical Function, and Food Intake in Older Japanese Adults Living in Urban Areas: A Cross-Sectional Study

Abstract
:1. Introduction
2. Materials and Methods
2.1. Participants
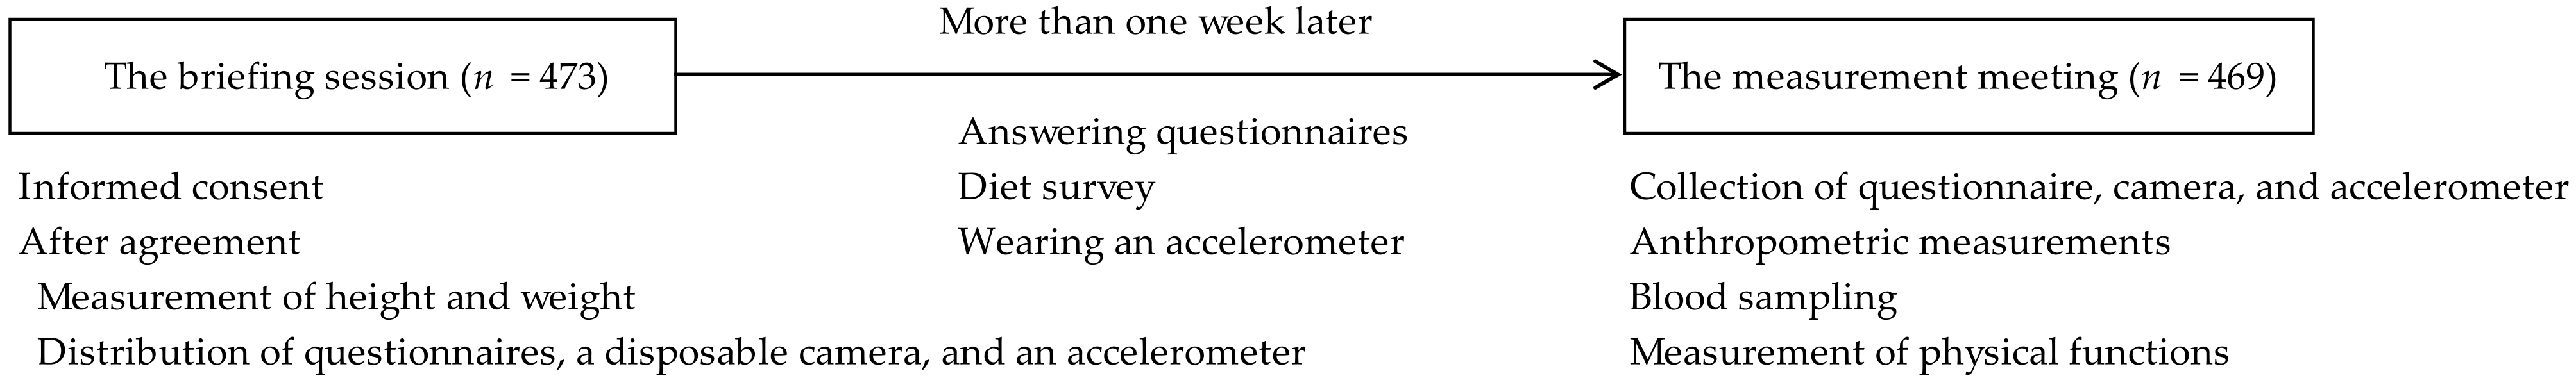
2.2. Schedule
2.3. Questionnaire Survey
2.4. Dietary Survey
2.5. Anthropometric Measurements
2.6. Physical Activity
2.7. Physical Functions
2.7.1. Muscle Strength
2.7.2. Movement Function
2.7.3. Agility Function
2.7.4. Balance Function
2.7.5. Walking Function
2.8. Blood Analysis
2.9. Statistical Analysis
3. Results
4. Discussion
Author Contributions
Funding
Institutional Review Board Statement
Informed Consent Statement
Data Availability Statement
Conflicts of Interest
References
- Cabinet Office; Government of Japan. Annual Report on the Ageing Society [Summary] FY2020. Available online: https://www8.cao.go.jp/kourei/english/annualreport/2020/pdf/2020.pdf (accessed on 15 February 2023).
- Yokoyama, T. National health promotion measures in Japan: Health Japan 21 (the second term). J. Natl. Inst. Public Health 2020, 69, 14–24. [Google Scholar] [CrossRef]
- Wajchenberg, B.L. Subcutaneous and visceral adipose tissue: Their relation to the metabolic syndrome. Endocr. Rev. 2000, 21, 697–738. [Google Scholar] [CrossRef] [PubMed]
- Hiuge-Shimizu, A.; Kishida, K.; Funahashi, T.; Ishizaka, Y.; Oka, R.; Okada, M.; Suzuki, S.; Takaya, N.; Nakagawa, T.; Fukui, T.; et al. Absolute value of visceral fat area measured on computed tomography scans and obesity-related cardiovascular risk factors in large-scale Japanese general population (the VACATION-J study). Ann. Med. 2012, 44, 82–92. [Google Scholar] [CrossRef] [PubMed]
- Takase, H.; Sakane, N.; Morimoto, T.; Uchida, T.; Mori, K.; Katashima, M.; Katsuragi, Y. Development of a dietary factor assessment tool for evaluating associations between visceral fat accumulation and major nutrients in Japanese adults. J. Obes. 2019, 2019, 9497861. [Google Scholar] [CrossRef] [PubMed] [Green Version]
- Sakane, N.; Osaki, N.; Takase, H.; Suzuki, J.; Suzukamo, C.; Nirengi, S.; Suganuma, A.; Shimotoyodome, A. The study of metabolic improvement by nutritional intervention controlling endogenous GIP (Mini Egg study): A randomized, cross-over study. Nutr. J. 2019, 18, 52. [Google Scholar] [CrossRef] [PubMed] [Green Version]
- Stenholm, S.; Head, J.; Kivimaki, M.; Kawachi, I.; Aalto, V.; Zins, M.; Goldberg, M.; Zaninotto, P.; Hanson, L.M.; Westerlund, H.; et al. Smoking, physical inactivity and obesity as predictors of healthy and disease-free life expectancy between ages 50 and 75: A multicohort study. Int. J. Epidemiol. 2016, 45, 1260–1270. [Google Scholar] [CrossRef] [Green Version]
- Monma, T.; Takeda, F.; Noguchi, H.; Takahashi, H.; Watanabe, T.; Tamiya, N. Exercise or sports in midlife and healthy life expectancy: An ecological study in all prefectures in Japan. BMC Public Health 2019, 19, 1238. [Google Scholar] [CrossRef] [Green Version]
- Leskinen, T.; Stenholm, S.; Aalto, V.; Head, J.; Kivimäki, M.; Vahtera, J. Physical activity level as a predictor of healthy and chronic disease-free life expectancy between ages 50 and 75. Age Ageing 2018, 47, 423–429. [Google Scholar] [CrossRef] [Green Version]
- Garatachea, N.; Molinero, O.; Martínez-García, R.; Jime´nez-Jiménez, R.; González-Gallego, J.; Márquez, S. Feelings of well being in elderly people: Relationship to physical activity and physical function. Arch. Gerontol. Geriatr. 2009, 48, 306–312. [Google Scholar] [CrossRef]
- Pereira, C.; Baptista, F.; Cruz-Ferreira, A. Role of physical activity, physical fitness, and chronic health conditions on the physical independence of community-dwelling older adults over a 5-year period. Arch. Gerontol. Geriatr. 2016, 65, 45–53. [Google Scholar] [CrossRef]
- Ramsey, K.A.; Rojer, A.G.M.; D’Andrea, L.; Otten, R.H.J.; Heymans, M.W.; Trappenburg, M.C.; Verlaan, S.; Whittaker, A.C.; Meskers, C.G.M.; Maier, A.B. The association of objectively measured physical activity and sedentary behavior with skeletal muscle strength and muscle power in older adults: A systematic review and meta-analysis. Ageing Res. Rev. 2021, 67, 101266. [Google Scholar] [CrossRef] [PubMed]
- Izquierdo, M.; Duque, G.; Morley, J.E. Physical activity guidelines for older people: Knowledge gaps and future directions. Lancet Healthy Longev. 2021, 2, e380–e383. [Google Scholar] [CrossRef]
- Kumagai, S.; Watanabe, S.; Shibata, H.; Amano, H.; Fujiwara, Y.; Shinkai, S.; Yoshida, H.; Suzuki, T.; Yukawa, H.; Yasumura, S.; et al. Effects of dietary variety on declines in high-level functional capacity in elderly people living in a community. [Nihon Koshu Eisei Zasshi] Jpn. J. Public. Health 2003, 50, 1117–1124, (Only abstract in English). [Google Scholar]
- Kobayashi, S.; Asakura, K.; Suga, H.; Sasaki, S.; Three-generation Study of Women on Diets and Health Study Group. High protein intake is associated with low prevalence of frailty among old Japanese women: A multicenter cross-sectional study. Nutr. J. 2013, 12, 164. [Google Scholar] [CrossRef] [PubMed] [Green Version]
- Tomata, Y.; Watanabe, T.; Sugawara, Y.; Chou, W.T.; Kakizaki, M.; Tsuji, I. Dietary patterns and incident functional disability in elderly Japanese: The Ohsaki Cohort 2006 Study. J. Gerontol. A Biol. Sci. Med. Sci. 2014, 69, 843–851. [Google Scholar] [CrossRef] [Green Version]
- Suzuki, A.; Watanabe, T.; Watanabe, R.; Nakaji, K.; Mitsuda, H.; Inoue, S.; Yamaoka, C.; Nishimuta, M.; Miyazaki, H. Actual food group and nutrient intake by independent-living elderly individuals as assessed via meal weighing method—General components, minerals, vitamins, fatty acids, amino acids and carbohydrates. J. Integr. Study Diet. Habits 2015, 4, 259–269, (Only abstract in English). [Google Scholar] [CrossRef] [Green Version]
- Yokoyama, Y.; Kitamura, A.; Seino, S.; Kim, H.; Obuchi, S.; Kawai, H.; Hirano, H.; Watanabe, Y.; Motokawa, K.; Narita, M.; et al. Association of nutrient-derived dietary patterns with sarcopenia and its components in community-dwelling older Japanese: A cross-sectional study. Nutr. J. 2021, 20, 7. [Google Scholar] [CrossRef]
- Granic, A.; Sayer, A.A.; Robinson, S.M. Dietary patterns, skeletal muscle health, and sarcopenia in older adults. Nutrients 2019, 11, 745. [Google Scholar] [CrossRef] [PubMed] [Green Version]
- Coates, J.; Colaiezzi, B.; Fiedler, J.L.; Wirth, J.; Lividini, K.; Rogers, B. A program needs-driven approach to selecting dietary assessment methods for decision-making in food fortification programs. Food Nutr. Bull. 2012, 33 (Suppl. 3), S146–S156. [Google Scholar] [CrossRef] [Green Version]
- Peduzzi, P.; Concato, J.; Feinstein, A.R.; Holford, T.R. Importance of events per independent variable in proportional hazards regression analysis. II. Accuracy and precision of regression estimates. J. Clin. Epidemiol. 1995, 48, 1503–1510. [Google Scholar] [CrossRef]
- Willett, W.; Stampfer, M.J. Total energy intake: Implications for epidemiologic analyses. Am. J. Epidemiol. 1986, 124, 17–27. [Google Scholar] [CrossRef]
- Kidokoro, T.; Tanaka, H.; Naoi, K.; Ueno, K.; Yanaoka, T.; Kashiwabara, K.; Miyashita, M. Factors associated with achieving physical activity guideline in Japanese adolescents. Jpn. J. Phys. Fit. Sports Med. 2016, 65, 383–392, (Only abstract in English). [Google Scholar] [CrossRef] [Green Version]
- Mâsse, L.C.; Fuemmeler, B.F.; Anderson, C.B.; Matthews, C.E.; Trost, S.G.; Catellier, D.J.; Treuth, M. Accelerometer data reduction: A comparison of four reduction algorithms on select outcome variables. Med. Sci. Sports Exerc. 2005, 37, S544–S554. [Google Scholar] [CrossRef] [PubMed]
- Troiano, R.P.; Berrigan, D.; Dodd, K.W.; Mâsse, L.C.; Tilert, T.; McDowell, M. Physical activity in the United States measured by accelerometer. Med. Sci. Sports Exerc. 2008, 40, 181–188. [Google Scholar] [CrossRef]
- Kumahara, H.; Schutz, Y.; Ayabe, M.; Yoshioka, M.; Yoshitake, Y.; Shindo, M.; Ishii, K.; Tanaka, H. The use of uniaxial accelerometry for the assessment of physical-activity-related energy expenditure: A validation study against whole-body indirect calorimetry. Br. J. Nutr. 2004, 91, 235–243. [Google Scholar] [CrossRef]
- Seichi, A.; Hoshino, Y.; Doi, T.; Akai, M.; Tobimatsu, Y.; Iwaya, T. Development of a screening tool for risk of locomotive syndrome in the elderly: The 25-question Geriatric Locomotive Function Scale. J. Orthop. Sci. 2012, 17, 163–172. [Google Scholar] [CrossRef]
- Muranaga, S.; Hirano, K. Development of a convenient way to predict ability to walk, using a two-step test. J. Showa Med. Assoc. 2003, 63, 301–308, (Only abstract in English). [Google Scholar]
- Muranaga, S. Evaluation of the muscular strength of the lower extremities using the standing movement and clinical application. J. Showa Med. Assoc. 2001, 61, 362–367, (Only abstract in English). [Google Scholar]
- Kobayashi, K.; Hiiragi, Y.; Maruyama, H. Development of the “10-second open-close stepping test” (OCS-10) and fundamental study of its measurement values through a comparison of healthy young people and community-dwelling elderly. J. Phys. Ther. Sci. 2012, 24, 747–749. [Google Scholar] [CrossRef]
- Ministry of Education, Culture, Sports, Science and Technology. New Physical Fitness Tests. Available online: https://www.mext.go.jp/component/a_menu/sports/detail/__icsFiles/afieldfile/2010/07/30/1295079_04.pdf (accessed on 15 February 2023). (In Japanese)
- Duncan, P.W.; Weiner, D.K.; Chandler, J.; Studenski, S. Functional reach: A new clinical measure of balance. J. Gerontol. 1990, 45, M192–M197. [Google Scholar] [CrossRef] [PubMed]
- Podsiadlo, D.; Richardson, S. The timed “UP & Go”: A test of basic functional mobility for frail elderly persons. J. Am. Geriatr. Soc. 1991, 39, 142–148. [Google Scholar] [CrossRef]
- Boulgarides, L.K.; McGinty, S.M.; Willett, J.A.; Barnes, C.W. Use of clinical and impairment-based tests to predict falls by community-dwelling older adults. Phys. Ther. 2003, 83, 328–339. [Google Scholar] [CrossRef] [PubMed] [Green Version]
- Ministry of Health Labour and Welfare. National Health and Nutrition Survey 2017. Available online: https://www.mhlw.go.jp/content/000451760.pdf (accessed on 15 February 2023). (In Japanese)
- Ihara, M.; Takamiya, T.; Ohya, Y.; Odagiri, Y.; Fukushima, N.; Hayashi, T.; Kikuchi, H.; Sato, H.; Shimomitsu, T.; Inoue, S. A cross-sectional study of the association between city scale and daily steps inJapan: Data from the National Health and Nutrition Survey Japan (NHNS-J) 2006-2010. [Nihon Koshu Eisei Zasshi] Jap. J. Public Health 2016, 63, 549–559, (Only abstract in English). [Google Scholar]
- Fan, J.X.; Wen, M.; Kowaleski-Jones, L. Rural-urban differences in objective and subjective measures of physical activity: Findings from the National Health and Nutrition Examination Survey (NHANES) 2003–2006. Prev. Chronic. Dis. 2014, 11, E141. [Google Scholar] [CrossRef] [PubMed] [Green Version]
- Arai, H.; Yamamoto, A.; Matsuzawa, Y.; Saito, Y.; Yamada, N.; Oikawa, S.; Mabuchi, H.; Teramoto, T.; Sasaki, J.; Nakaya, N.; et al. Prevalence of metabolic syndrome in the general Japanese population in 2000. J. Atheroscler. Thromb. 2006, 13, 202–208. [Google Scholar] [CrossRef] [Green Version]
- Morie, M.; Reid, K.F.; Miciek, R.; Lajevardi, N.; Choong, K.; Krasnoff, J.B.; Storer, T.W.; Fielding, R.A.; Bhasin, S.; Lebrasseur, N.K. Habitual physical activity levels are associated with performance in measures of physical function and mobility in older men. J. Am. Geriatr. Soc. 2010, 58, 1727–1733. [Google Scholar] [CrossRef] [Green Version]
- Ramsey, K.A.; Meskers, C.G.M.; Maier, A.B. Every step counts: Synthesising reviews associating objectively measured physical activity and sedentary behaviour with clinical outcomes in community-dwelling older adults. Lancet Healthy Longev. 2021, 2, e764–e772. [Google Scholar] [CrossRef]
- Van Dronkelaar, C.; van Velzen, A.; Abdelrazek, M.; van der Steen, A.; Weijs, P.J.M.; Tieland, M. Minerals and sarcopenia; the role of calcium, iron, magnesium, phosphorus, potassium, selenium, sodium, and zinc on muscle mass, muscle strength, and physical performance in older adults: A systematic review. J. Am. Med. Dir. Assoc. 2018, 19, 6–11. [Google Scholar] [CrossRef]
- Bohl, C.H.; Volpe, S.L. Magnesium and exercise. Crit. Rev. Food Sci. Nutr. 2002, 42, 533–563. [Google Scholar] [CrossRef]
- Veronese, N.; Berton, L.; Carraro, S.; Bolzetta, F.; De Rui, M.D.; Perissinotto, E.; Toffanello, E.D.; Bano, G.; Pizzato, S.; Miotto, F.; et al. Effect of oral magnesium supplementation on physical performance in healthy elderly women involved in a weekly exercise program: A randomized controlled trial. Am. J. Clin. Nutr. 2014, 100, 974–981. [Google Scholar] [CrossRef] [Green Version]
- Struijk, E.A.; Lana, A.; Guallar-Castillón, P.; Rodríguez-Artalejo, F.; Lopez-Garcia, E. Intake of B vitamins and impairment in physical function in older adults. Clin. Nutr. 2018, 37, 1271–1278. [Google Scholar] [CrossRef]
- Mendonça, N.; Hill, T.R.; Granic, A.; Davies, K.; Collerton, J.; Mathers, J.C.; Siervo, M.; Wrieden, W.L.; Seal, C.J.; Kirkwood, T.B.L.; et al. Micronutrient intake and food sources in the very old: Analysis of the Newcastle 85+ Study. Br. J. Nutr. 2016, 116, 751–761. [Google Scholar] [CrossRef] [PubMed] [Green Version]
- Dukas, L.; Willett, W.C.; Giovannucci, E.L. Association between physical activity, fiber intake, and other lifestyle variables and constipation in a study of women. Am. J. Gastroenterol. 2003, 98, 1790–1796. [Google Scholar] [CrossRef] [PubMed]
- van den Berg, H.; van der Garg, M.; Hendriks, H. Influence of lifestyle on vitamin bioavailability. Int. J. Vitam. Nutr. Res. 2002, 72, 53–59. [Google Scholar] [CrossRef]
- Adams, S.; Sello, C.T.; Qin, G.X.; Che, D.; Han, R. Does dietary fiber affect the levels of nutritional components after feed formulation? Fibers 2018, 6, 29. [Google Scholar] [CrossRef] [Green Version]
- Lyman, K.S.; Athinarayanan, S.J.; McKenzie, A.L.; Pearson, C.L.; Adams, R.N.; Hallberg, S.J.; McCarter, J.P.; Volek, J.S.; Phinney, S.D.; Andrawis, J.P. Continuous care intervention with carbohydrate restriction improves physical function of the knees among patients with type 2 diabetes: A non-randomized study. BMC Musculoskelet. Disord. 2022, 23, 297. [Google Scholar] [CrossRef] [PubMed]


| Total | Men | Women | |
|---|---|---|---|
| Number | 469 | 166 | 303 |
| Age (years) | 69.8 ± 2.9 | 70.2 ± 3.0 | 69.5 ± 2.9 |
| Body mass index (kg/m2) | 22.7 ± 3.8 | 23.5 ± 4.8 | 22.2 ± 2.9 |
| Visceral fat area (cm2) | 75.5 ± 38.2 | 94.8 ± 43.4 | 64.9 ± 30.2 |
| Systolic blood pressure (mmHg) | 141 ± 21 | 142 ± 22 | 140 ± 20 |
| Diastolic blood pressure (mmHg) | 81 ± 12 | 83 ± 12 | 80 ± 11 |
| Fasting blood glucose (mmol/L) | 5.58 ± 0.90 | 5.78 ± 0.91 | 5.48 ± 1.03 |
| Triacylglycerol (mmol/L) | 1.15 ± 0.75 | 1.27 ± 0.90 | 1.09 ± 0.64 |
| LDL-cholesterol (mmol/L) | 3.38 ± 0.79 | 3.16 ± 0.76 | 3.50 ± 0.88 |
| HDL-cholesterol (mmol/L) | 1.76 ± 0.43 | 1.61 ± 0.41 | 1.85 ± 0.47 |
| Physical Function | Sex | Age (Years) | n | Mean SD | National Average † |
|---|---|---|---|---|---|
| Number of steps | Men | 65–75 | 166 | 9027 ± 3422 | 6311 |
| Women | 65–75 | 303 | 8484 ± 2873 | 5438 | |
| Grip strength (kg) | Men | 65–69 | 71 | 34.6 ± 8.4 | 40.2 |
| 70–75 | 93 | 33.4 ± 6.9 | 38.1 | ||
| Women | 65–69 | 161 | 24.0 ± 5.5 | 25.3 | |
| 70–75 | 139 | 23.3 ± 5.5 | 23.9 | ||
| OLS test (sec) | Men | 65–69 | 70 | 78.6 ± 45.9 | 85.8 |
| 70–75 | 94 | 62.7 ± 45.9 | 74.6 | ||
| Women | 65–69 | 164 | 76.1 ± 43.2 | 89.0 | |
| 70–75 | 141 | 61.3 ± 42.6 | 74.3 |
| (a) | |||||||||||||||||||||
|---|---|---|---|---|---|---|---|---|---|---|---|---|---|---|---|---|---|---|---|---|---|
| Physical Functions/Physical Activities | Number of Steps | Micro Exercise | Low Intensity Exercise | Medium Intensity Exercise | High Intensity Exercise | ||||||||||||||||
| Variable | B | SE | β | p-value | B | SE | β | p-value | B | SE | β | p-Value | B | SE | β | p-Value | B | SE | β | p-Value | |
| Muscle strength | Grip strength | 7.29 | 22.7 | 0.019 | 0.748 | 0.000 | 0.000 | −0.014 | 0.807 | 0.000 | 0.000 | 0.055 | 0.336 | 0.000 | 0.000 | −0.043 | 0.456 | 0.000 | 0.000 | −0.009 | 0.874 |
| Knee extension muscle strength | 830.1 | 1099 | 0.036 | 0.450 | 0.012 | 0.015 | 0.035 | 0.447 | −0.006 | 0.011 | −0.025 | 0.588 | −0.006 | 0.009 | −0.032 | 0.492 | 0.000 | 0.001 | 0.004 | 0.941 | |
| Movement function | Two step test | 4511 | 885 | 0.232 | 0.000 * | −0.038 | 0.013 | −0.134 | 0.003 * | 0.016 | 0.009 | 0.082 | 0.071 | 0.020 | 0.007 | 0.127 | 0.006 * | 0.002 | 0.001 | 0.072 | 0.125 |
| Agility function | Open-close stepping test | 35.8 | 27.5 | 0.061 | 0.193 | 0.000 | 0.000 | 0.021 | 0.647 | 0.000 | 0.000 | −0.019 | 0.679 | 0.000 | 0.000 | −0.016 | 0.727 | 0.000 | 0.000 | 0.016 | 0.737 |
| Balance function | OLS test (sedentary balance) | 12.44 | 3.16 | 0.180 | 0.000 * | 0.000 | 0.000 | −0.093 | 0.038 * | 0.000 | 0.000 | 0.080 | 0.077 | 0.000 | 0.000 | 0.045 | 0.328 | 0.000 | 0.000 | 0.145 | 0.002 * |
| Functional reach test (movement balance) | 18.9 | 21.1 | 0.042 | 0.371 | 0.000 | 0.000 | −0.008 | 0.863 | 0.000 | 0.000 | 0.012 | 0.790 | 0.000 | 0.000 | −0.014 | 0.757 | 0.000 | 0.000 | 0.079 | 0.090 | |
| Walking function | TUG test | −493 | 159 | −0.143 | 0.002 * | 0.002 | 0.002 | 0.033 | 0.469 | −0.001 | 0.002 | −0.035 | 0.434 | 0.000 | 0.001 | −0.013 | 0.776 | 0.000 | 0.000 | −0.007 | 0.879 |
| (b) | |||||||||||||||||||||
| Physical Functions/Physical Activities | Number of Steps | Micro Exercise | Low Intensity Exercise | Medium Intensity Exercise | High Intensity Exercise | ||||||||||||||||
| Variable | B | SE | β | p-Value | B | SE | β | p-Value | B | SE | β | p-Value | B | SE | β | p-Value | B | SE | β | p-Value | |
| Muscle strength | Grip strength | −2.40 | 22.6 | −0.006 | 0.915 | 0.000 | 0.000 | 0.011 | 0.840 | 0.000 | 0.000 | 0.029 | 0.607 | 0.000 | 0.000 | −0.053 | 0.358 | 0.000 | 0.000 | −0.026 | 0.662 |
| Knee extension muscle strength | 438.9 | 1089 | 0.019 | 0.687 | 0.018 | 0.015 | 0.053 | 0.249 | −0.010 | 0.011 | −0.043 | 0.348 | −0.007 | 0.009 | −0.040 | 0.402 | 0.000 | 0.001 | −0.007 | 0.881 | |
| Movement function | Two step test | 4052 | 888 | 0.209 | 0.000 * | −0.030 | 0.013 | −0.108 | 0.016 * | 0.011 | 0.009 | 0.054 | 0.237 | 0.018 | 0.007 | 0.119 | 0.011 * | 0.001 | 0.001 | 0.056 | 0.241 |
| Agility function | Open-close stepping test | 20.6 | 27.4 | 0.035 | 0.453 | 0.000 | 0.000 | 0.048 | 0.283 | 0.000 | 0.000 | −0.048 | 0.294 | 0.000 | 0.000 | −0.027 | 0.559 | 0.000 | 0.000 | −0.001 | 0.985 |
| Balance function | OLS test (sedentary balance) | 10.49 | 3.20 | 0.152 | 0.001 * | 0.000 | 0.000 | −0.062 | 0.171 | 0.000 | 0.000 | 0.046 | 0.308 | 0.000 | 0.000 | 0.032 | 0.485 | 0.000 | 0.000 | 0.129 | 0.006 * |
| Functional reach test (movement balance) | 12.1 | 20.9 | 0.027 | 0.564 | 0.000 | 0.000 | 0.008 | 0.866 | 0.000 | 0.000 | −0.004 | 0.933 | 0.000 | 0.000 | −0.020 | 0.658 | 0.000 | 0.000 | 0.070 | 0.132 | |
| Walking function | TUG test | −413 | 159 | −0.119 | 0.010 * | 0.000 | 0.002 | 0.007 | 0.867 | 0.000 | 0.002 | −0.010 | 0.819 | 0.000 | 0.001 | −0.002 | 0.967 | 0.000 | 0.000 | 0.009 | 0.855 |
| (c) | |||||||||||||||||||||
| Physical Functions/Physical Activities | Number of Steps | Micro Exercise | Low Intensity Exercise | Medium Intensity Exercise | High Intensity Exercise | ||||||||||||||||
| Variable | B | SE | β | p-Value | B | SE | β | p-Value | B | SE | β | p-Value | B | SE | β | p-Value | B | SE | β | p-Value | |
| Muscle strength | Grip strength | 1.68 | 22.4 | 0.004 | 0.940 | 0.000 | 0.000 | 0.004 | 0.942 | 0.000 | 0.000 | 0.032 | 0.578 | 0.000 | 0.000 | −0.044 | 0.444 | 0.000 | 0.000 | −0.019 | 0.746 |
| Knee extension muscle strength | 10.2 | 1091 | 0.000 | 0.993 | 0.022 | 0.015 | 0.067 | 0.146 | −0.011 | 0.011 | −0.049 | 0.300 | −0.010 | 0.009 | −0.057 | 0.230 | −0.001 | 0.001 | −0.020 | 0.687 | |
| Movement function | Two step test | 3789 | 892 | 0.195 | 0.000 * | −0.028 | 0.013 | −0.098 | 0.031 * | 0.010 | 0.009 | 0.051 | 0.267 | 0.016 | 0.007 | 0.105 | 0.024 * | 0.001 | 0.001 | 0.045 | 0.342 |
| Agility function | Open-close stepping test | 18.3 | 27.2 | 0.031 | 0.502 | 0.000 | 0.000 | 0.051 | 0.255 | 0.000 | 0.000 | −0.048 | 0.286 | 0.000 | 0.000 | −0.031 | 0.507 | 0.000 | 0.000 | −0.003 | 0.941 |
| Balance function | OLS test (sedentary balance) | 9.42 | 3.21 | 0.136 | 0.003 * | 0.000 | 0.000 | −0.050 | 0.271 | 0.000 | 0.000 | 0.043 | 0.355 | 0.000 | 0.000 | 0.017 | 0.709 | 0.000 | 0.000 | 0.120 | 0.012 * |
| Functional reach test (movement balance) | 10.1 | 20.8 | 0.022 | 0.627 | 0.000 | 0.000 | 0.011 | 0.812 | 0.000 | 0.000 | −0.005 | 0.917 | 0.000 | 0.000 | −0.024 | 0.597 | 0.000 | 0.000 | 0.067 | 0.147 | |
| Walking function | TUG test | −380 | 158 | −0.110 | 0.017 * | 0.000 | 0.002 | 0.000 | 0.992 | 0.000 | 0.002 | −0.008 | 0.860 | 0.000 | 0.001 | 0.007 | 0.880 | 0.000 | 0.000 | 0.015 | 0.751 |
| (a) | |||||||||||||
|---|---|---|---|---|---|---|---|---|---|---|---|---|---|
| Foods and Nutrients/Physical Functions | Two-Step Test | OLS Test | TUG Test | ||||||||||
| Variable | B | SE | β | p-Value | B | SE | β | p-Value | B | SE | β | p-Value | |
| Foods | Vegetables | 0.000 | 0.000 | 0.103 | 0.023 * | 0.038 | 0.018 | 0.095 | 0.039 * | −0.001 | 0.000 | −0.141 | 0.002 * |
| Fruits | 0.000 | 0.000 | 0.112 | 0.015 * | - # | - | - | - | - | - | - | - | |
| Seeds | 0.003 | 0.001 | 0.108 | 0.017 * | - | - | - | - | - | - | - | - | |
| Milk | - | - | - | - | - | - | - | - | −0.001 | 0.000 | −0.100 | 0.034 * | |
| Beverages | 0.000 | 0.000 | 0.116 | 0.010 * | - | - | - | - | - | - | - | - | |
| Cereals | - | - | - | - | −0.064 | 0.023 | −0.131 | 0.006 * | 0.001 | 0.000 | 0.105 | 0.026 * | |
| Egg | −0.001 | 0.000 | −0.106 | 0.018 * | - | - | - | - | - | - | - | - | |
| Meat | - | - | - | - | −0.175 | 0.059 | −0.137 | 0.003 * | - | - | - | - | |
| Nutrients | K | - | - | - | - | - | - | - | - | 0.000 | 0.000 | −0.268 | 0.000 * |
| Mg | - | - | - | - | 0.136 | 0.034 | 0.194 | 0.000 * | - | - | - | - | |
| Vit B6 | 0.117 | 0.029 | 0.233 | 0.000 * | - | - | - | - | - | - | - | - | |
| Nutritional composition | Fib/C | 0.98 | 0.475 | 0.096 | 0.040 * | 368 | 134 | 0.129 | 0.006 * | −7.54 | 2.65 | −0.134 | 0.005 * |
| (b) | |||||||||||||
| Foods and Nutrients/Physical Functions | Two-Step Test | OLS Test | TUG Test | ||||||||||
| Variable | B | SE | β | p-Value | B | SE | β | p-Value | B | SE | β | p-Value | |
| Foods | Vegetables | 0.000 | 0.000 | 0.115 | 0.010 * | 0.045 | 0.018 | 0.111 | 0.015 * | −0.001 | 0.000 | −0.155 | 0.001 * |
| Fruits | 0.000 | 0.000 | 0.128 | 0.005 * | - # | - | - | - | - | - | - | - | |
| Seeds | 0.003 | 0.001 | 0.102 | 0.023 * | - | - | - | - | - | - | - | - | |
| Milk | - | - | - | - | - | - | - | - | −0.001 | 0.000 | −0.108 | 0.020 * | |
| Beverages | 0.000 | 0.000 | 0.097 | 0.031 * | - | - | - | - | - | - | - | - | |
| Cereals | - | - | - | - | −0.054 | 0.022 | −0.110 | 0.016 * | 0.001 | 0.000 | 0.098 | 0.036 * | |
| Egg | −0.001 | 0.000 | −0.111 | 0.013 * | - | - | - | - | - | - | - | - | |
| Meat | - | - | - | - | −0.158 | 0.058 | −0.124 | 0.006 * | - | - | - | - | |
| Nutrients | K | - | - | - | - | - | - | - | - | 0.000 | 0.000 | −0.281 | 0.000 * |
| Mg | - | - | - | - | 0.145 | 0.033 | 0.207 | 0.000 * | - | - | - | - | |
| Vit B6 | 0.109 | 0.023 | 0.216 | 0.000 * | - | - | - | - | - | - | - | - | |
| Nutritional composition | Fib/C | 1.15 | 0.470 | 0.112 | 0.015 * | 430 | 132 | 0.150 | 0.001 * | −8.39 | 2.63 | −0.149 | 0.001 * |
| (c) | |||||||||||||
| Foods and Nutrients/Physical Functions | Two-Step Test | OLS Test | TUG Test | ||||||||||
| Variable | B | SE | β | p-Value | B | SE | β | p-Value | B | SE | β | p-Value | |
| Foods | Vegetables | 0.000 | 0.000 | 0.105 | 0.019 * | 0.040 | 0.018 | 0.099 | 0.028 * | −0.001 | 0.000 | −0.150 | 0.001 * |
| Fruits | 0.000 | 0.000 | 0.130 | 0.004 * | - # | - | - | - | - | - | - | - | |
| Seeds | 0.003 | 0.001 | 0.098 | 0.028 * | - | - | - | - | - | - | - | - | |
| Milk | - | - | - | - | - | - | - | - | −0.001 | 0.000 | −0.101 | 0.033 * | |
| Beverages | 0.000 | 0.000 | 0.092 | 0.040 * | - | - | - | - | - | - | - | - | |
| Cereals | - | - | - | - | −0.056 | 0.022 | −0.114 | 0.012 * | 0.001 | 0.000 | 0.101 | 0.031 * | |
| Egg | −0.001 | 0.000 | −0.103 | 0.020 * | - | - | - | - | - | - | - | - | |
| Meat | - | - | - | - | −0.150 | 0.057 | −0.117 | 0.009 * | - | - | - | - | |
| Nutrients | K | - | - | - | - | - | - | - | - | 0.000 | 0.000 | −0.165 | 0.000 * |
| Mg | - | - | - | - | 0.113 | 0.032 | 0.161 | 0.000 * | - | - | - | - | |
| Vit B6 | 0.098 | 0.022 | 0.194 | 0.000 * | - | - | - | - | - | - | - | - | |
| Nutritional composition | Fib/C | 1.07 | 0.468 | 0.105 | 0.023 * | 407 | 131 | 0.142 | 0.002 * | −8.17 | 2.63 | −0.145 | 0.002 * |
| (a) | ||||
|---|---|---|---|---|
| Serum Mg Concentration | ||||
| B | SE | β | p-Value | |
| Mg intake (mg/d) | - # | - | - | - |
| Total fiber intake (g/d) | - | - | - | - |
| Fib/C | 1.286 | 0.486 | 0.123 | 0.008 * |
| (b) | ||||
| Serum Mg Concentration | ||||
| B | SE | β | p-Value | |
| Mg intake (mg/d) | - # | - | - | - |
| Total fiber intake (g/d) | - | - | - | - |
| Fib/C | 1.365 | 0.487 | 0.130 | 0.005 * |
| (c) | ||||
| Serum Mg Concentration | ||||
| B | SE | β | p-Value | |
| Mg intake (mg/d) | - # | - | - | - |
| Total fiber intake (g/d) | - | - | - | - |
| Fib/C | 1.341 | 0.488 | 0.128 | 0.006 * |
Disclaimer/Publisher’s Note: The statements, opinions and data contained in all publications are solely those of the individual author(s) and contributor(s) and not of MDPI and/or the editor(s). MDPI and/or the editor(s) disclaim responsibility for any injury to people or property resulting from any ideas, methods, instructions or products referred to in the content. |
© 2023 by the authors. Licensee MDPI, Basel, Switzerland. This article is an open access article distributed under the terms and conditions of the Creative Commons Attribution (CC BY) license (https://creativecommons.org/licenses/by/4.0/).
Share and Cite
Fushimi, T.; Fujihira, K.; Takase, H.; Miyashita, M. Relationships among Physical Activity, Physical Function, and Food Intake in Older Japanese Adults Living in Urban Areas: A Cross-Sectional Study. Geriatrics 2023, 8, 41. https://doi.org/10.3390/geriatrics8020041
Fushimi T, Fujihira K, Takase H, Miyashita M. Relationships among Physical Activity, Physical Function, and Food Intake in Older Japanese Adults Living in Urban Areas: A Cross-Sectional Study. Geriatrics. 2023; 8(2):41. https://doi.org/10.3390/geriatrics8020041
Chicago/Turabian StyleFushimi, Takashi, Kyoko Fujihira, Hideto Takase, and Masashi Miyashita. 2023. "Relationships among Physical Activity, Physical Function, and Food Intake in Older Japanese Adults Living in Urban Areas: A Cross-Sectional Study" Geriatrics 8, no. 2: 41. https://doi.org/10.3390/geriatrics8020041