
Flow Cytometric Features of B- and T-Lmphocytes in Reactive Lymph Nodes Compared to Their Neoplastic Counterparts in Dogs

 , and
, and
Abstract
:Simple Summary
Abstract
1. Introduction
2. Materials and Methods
3. Results
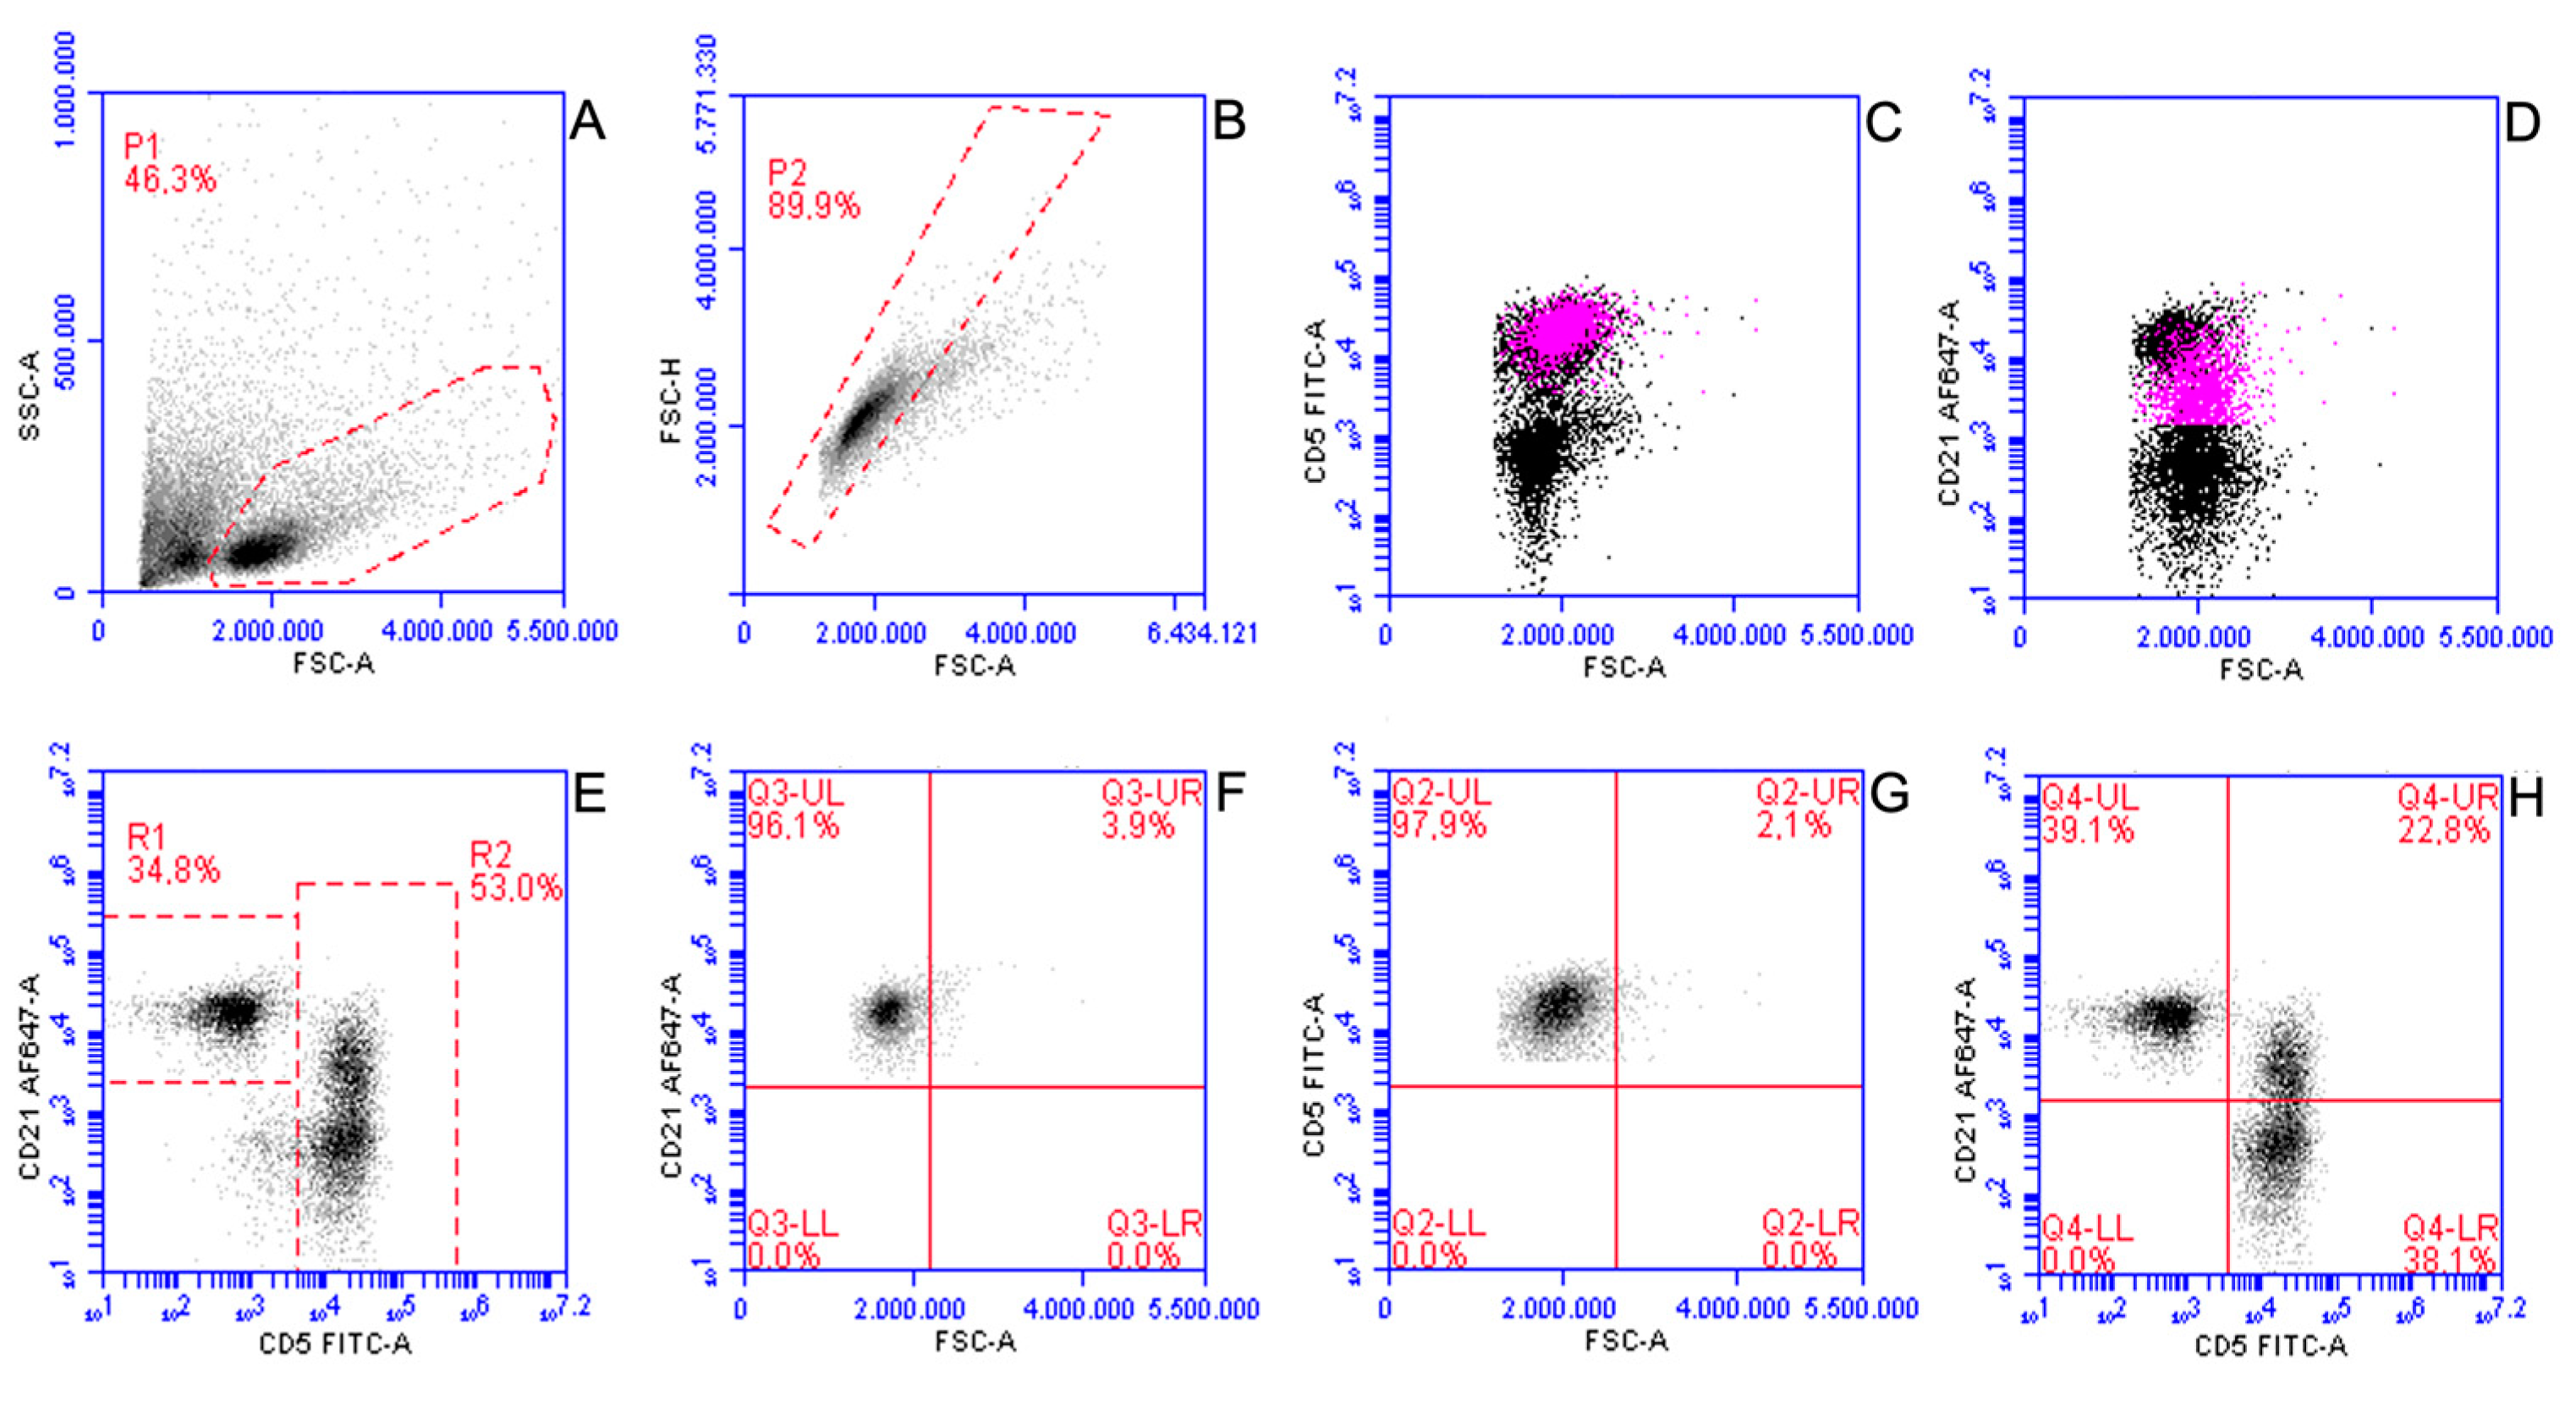
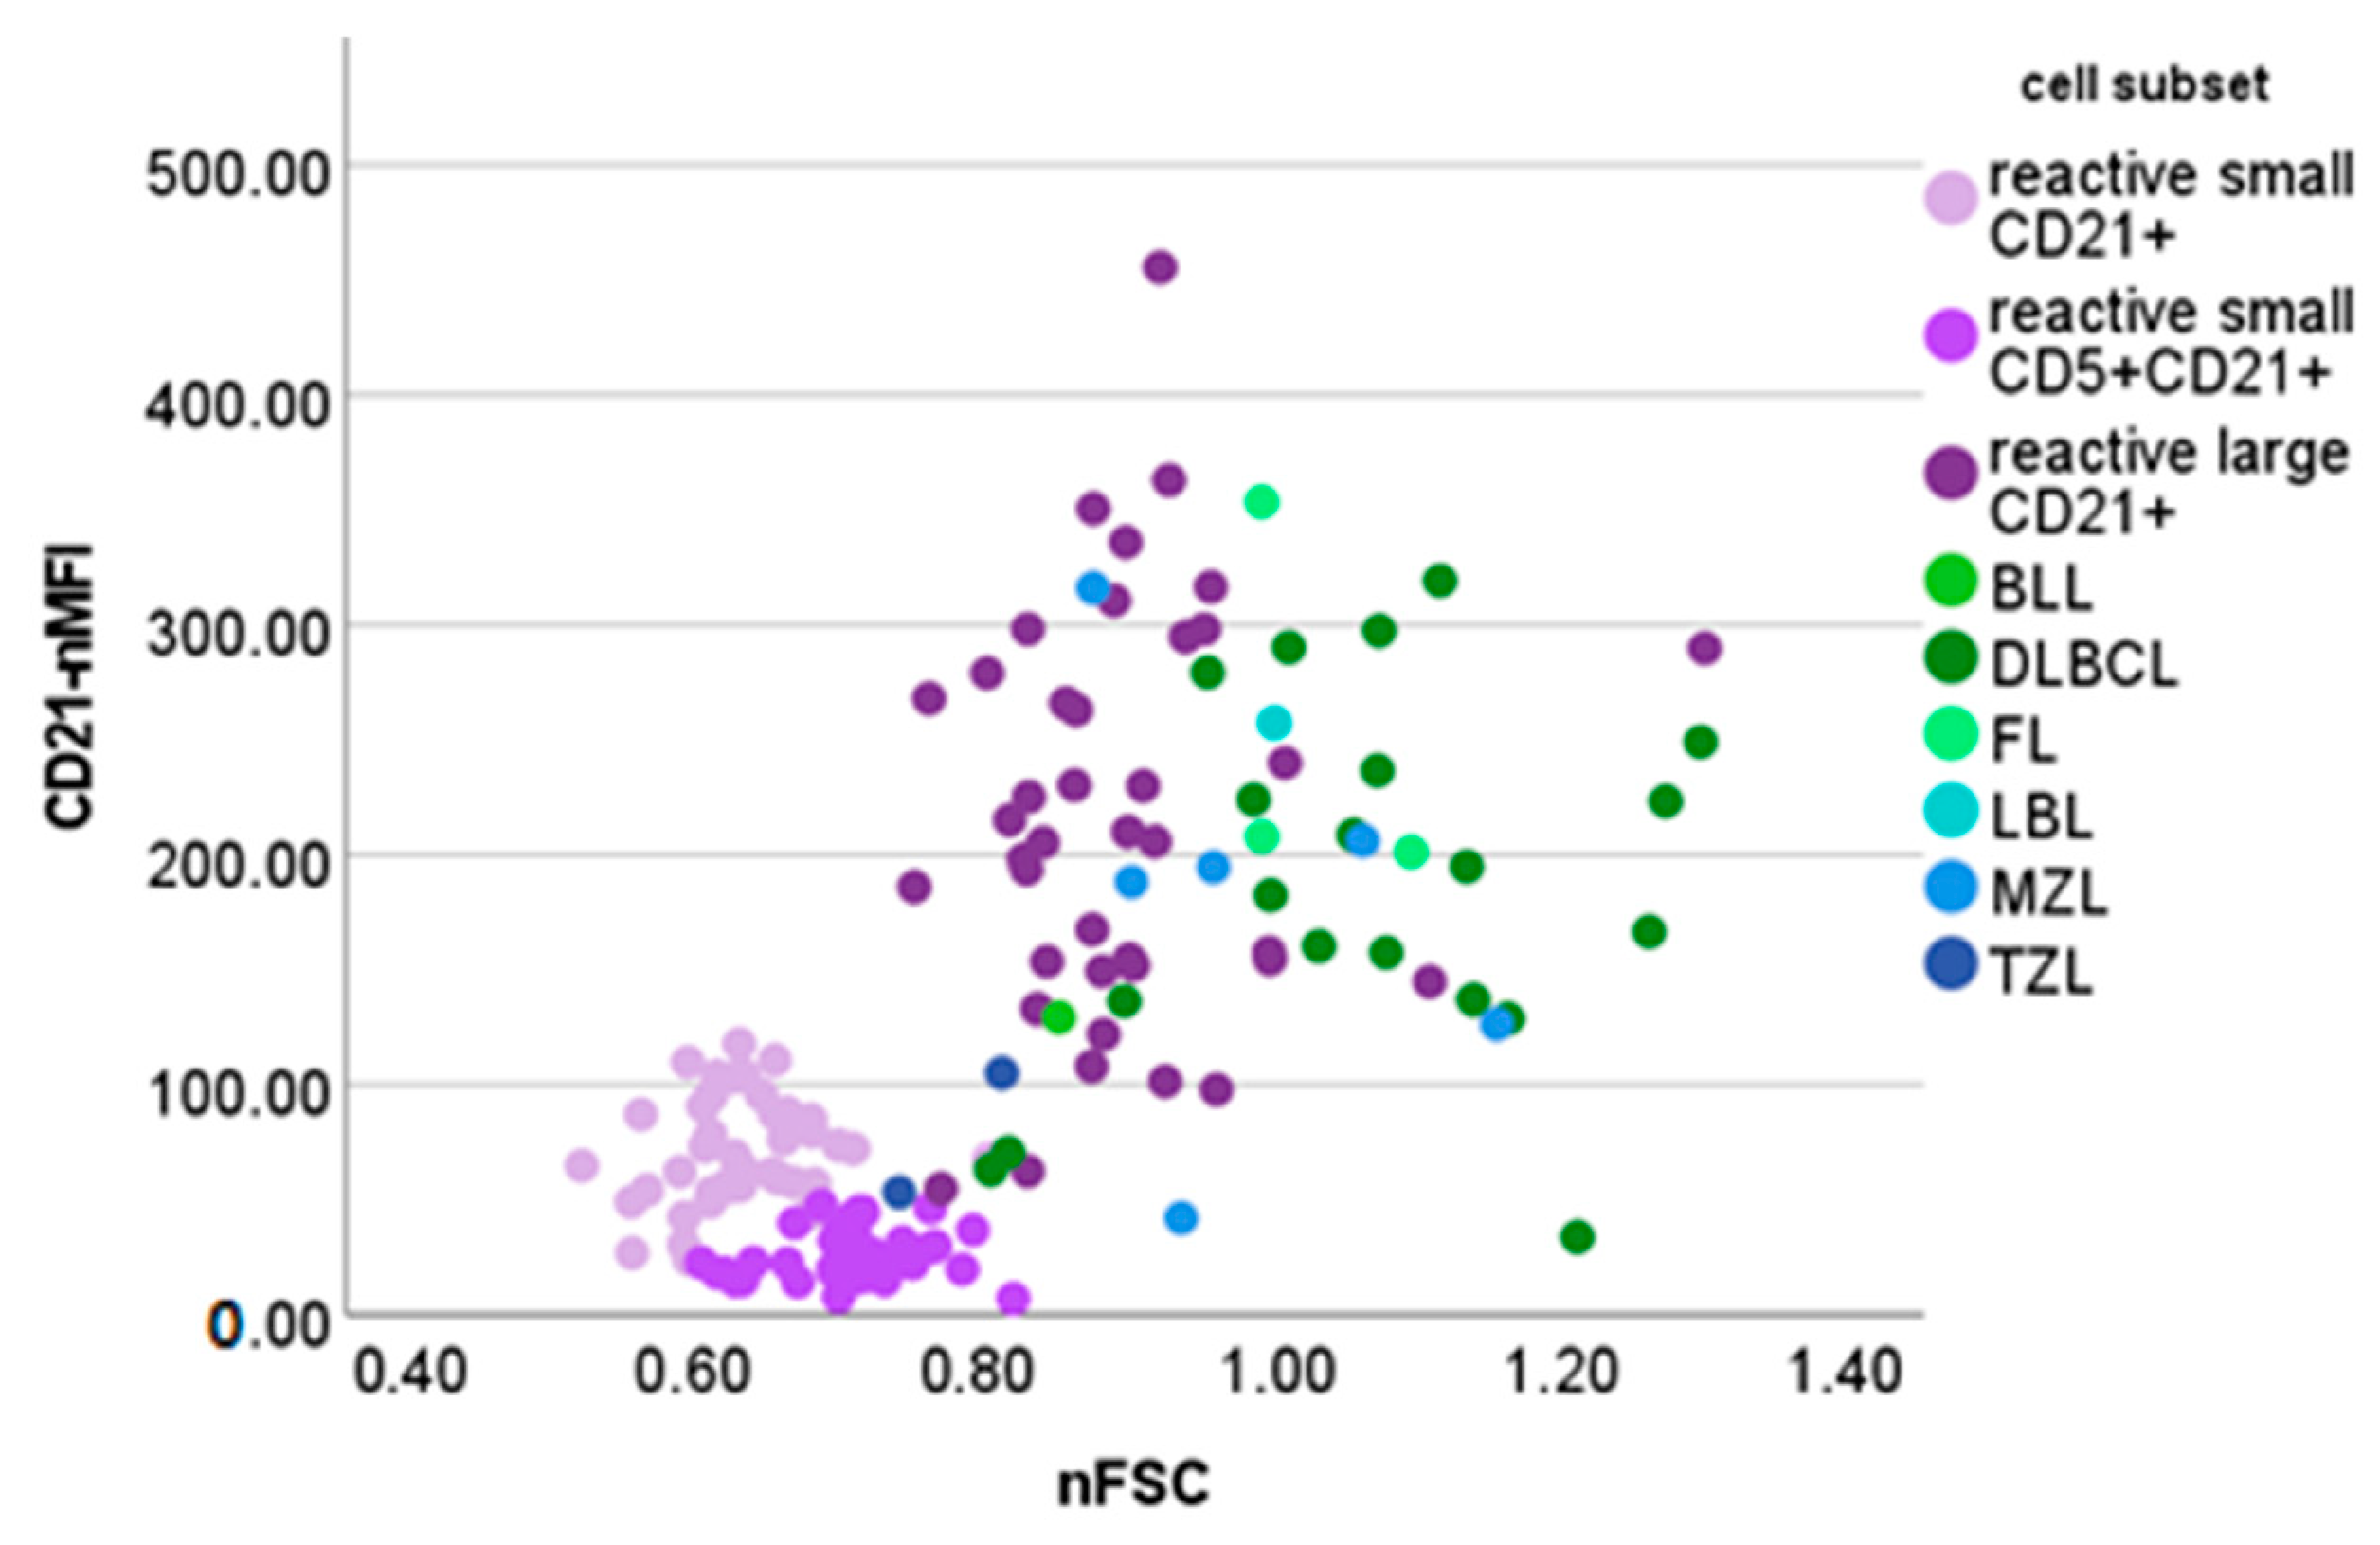
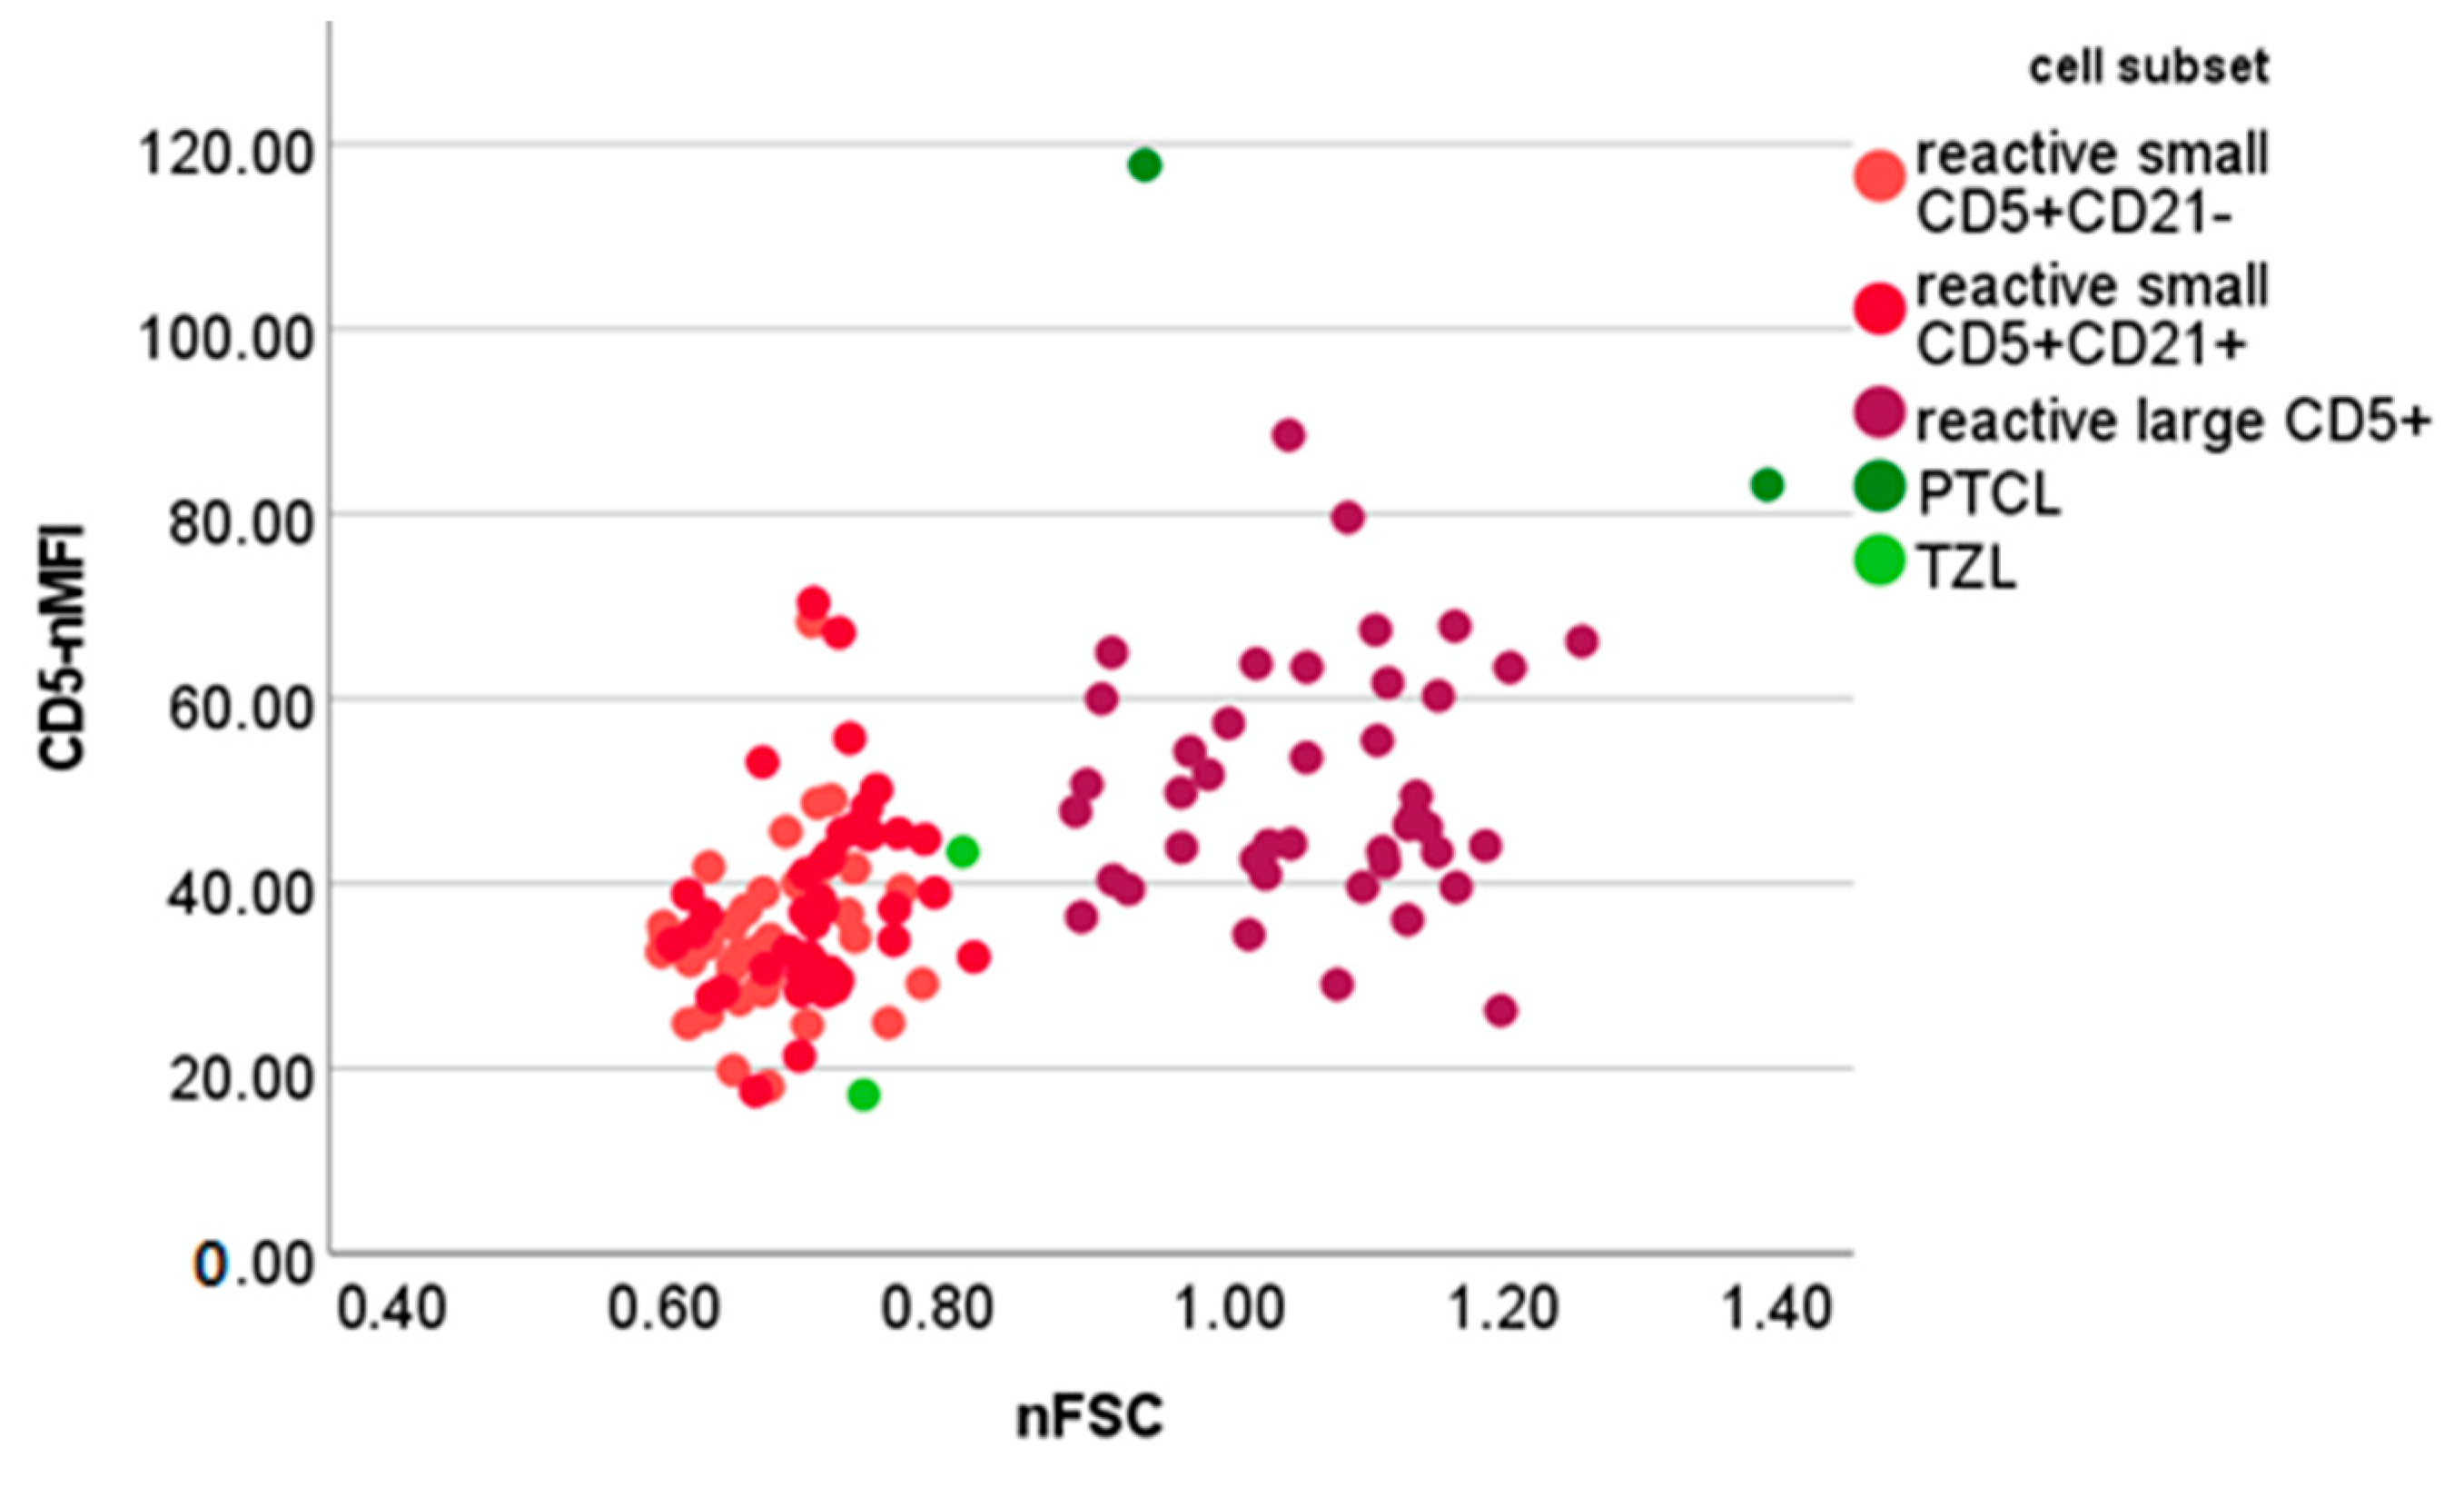
3.1. Reactive Lymph Nodes
3.2. Lymphomas
4. Discussion
5. Conclusions
Supplementary Materials
Author Contributions
Funding
Institutional Review Board Statement
Informed Consent Statement
Data Availability Statement
Acknowledgments
Conflicts of Interest
References
- Meichner, K.; Stokol, T.; Tarigo, J.; Avery, A.; Burkhard, M.J.; Comazzi, S.; Fogle, J.; Stowe, D.M.; Rütgen, B.; Seelig, D.; et al. Multicenter flow cytometry proficiency testing of canine blood and lymph node samples. Vet. Clin. Pathol. 2020, 49, 249–257. [Google Scholar] [CrossRef] [PubMed]
- Evans, S.J. Flow Cytometry in Veterinary Practice. Vet. Clin. N. Am. Small Anim. Pract. 2023, 53, 89–100. [Google Scholar] [CrossRef] [PubMed]
- Wilkerson, M.; Dolce, K.; Koopman, T.; Shuman, W.; Chun, R.; Garrett, L.; Barber, L.; Avery, A. Lineage differentiation of canine lymphoma/leukemias and aberrant expression of CD molecules. Vet. Immunol. Immunopathol. 2005, 106, 179–196. [Google Scholar] [CrossRef]
- Marconato, L.; Martini, V.; Aresu, L.; Sampaolo, M.; Valentini, F.; Rinaldi, V.; Comazzi, S. Assessment of bone marrow infiltration diagnosed by flow cytometry in canine large B cell lymphoma: Prognostic significance and proposal of a cut-off value. Vet. J. 2013, 197, 776–781. [Google Scholar] [CrossRef]
- Deravi, N.; Berke, O.; Woods, J.P.; Bienzle, D. Specific immunotypes of canine T cell lymphoma are associated with different outcomes. Vet. Immunol. Immunopathol. 2017, 191, 5–13. [Google Scholar] [CrossRef] [PubMed]
- Harris, L.J.; Rout, E.D.; Labadie, J.D.; Avery, P.R.; Fernandez, M.; Yoshimoto, J.; Avery, A.C. Clinical features of canine nodal T-cell lymphomas classified as CD8+ or CD4-CD8- by flow cytometry. Vet. Comp. Oncol. 2020, 18, 416–427. [Google Scholar] [CrossRef]
- Rütgen, B.C.; König, R.; Hammer, S.E.; Groiss, S.; Saalmüller, A.; Schwendenwein, I. Composition of lymphocyte subpopulations in normal canine lymph nodes. Vet. Clin. Pathol. 2014, 44, 58–69. [Google Scholar] [CrossRef]
- Ruetgen, B.C.; Baumgartner, D.; Fuchs-Baumgartinger, A.; Rigillo, A.; Skor, O.; Hammer, S.E.; Saalmuller, A.; Schwendenwein, I. Flow cytometric assessment of Ki-67 expression in lymphocytes from physiologic lymph nodes, lymphoma cell populations and remnant normal cells populations from lymphomatous lymph nodes. Front. Vet. Sci. 2021, 29, 663656. [Google Scholar] [CrossRef]
- Gelain, M.; Mazzilli, M.; Riondato, F.; Marconato, L.; Comazzi, S. Aberrant phenotypes and quantitative antigen expression in different subtypes of canine lymphoma by flow cytometry. Vet. Immunol. Immunopathol. 2008, 121, 179–188. [Google Scholar] [CrossRef]
- Mylonakis, M.E.; Borjesson, D.L.; Leontides, L.; Siarkou, V.I.; Theodorou, K.; Koutinas, A.F. Cytologic patterns of lymphadenopathy in canine monocytic ehrlichiosis. Vet. Clin. Pathol. 2011, 40, 78–83. [Google Scholar] [CrossRef] [PubMed]
- Cowell, R.L.; Dorsey, K.E.; Meinkoth, J.H. Lymph node cytology. Vet. Clin. N. Am. Small Anim. Pract. 2003, 33, 47–67. [Google Scholar] [CrossRef] [PubMed]
- Poggi, A.; Miniscalco, B.; Morello, E.; Comazzi, S.; Gelain, M.E.; Aresu, L.; Riondato, F. Flow cytometric evaluation of ki67 for the determination of malignancy grade in canine lymphoma. Vet. Comp. Oncol. 2015, 13, 475–480. [Google Scholar] [CrossRef] [PubMed]
- Bromberek, J.; Rout, E.; Agnew, M.; Yoshimoto, J.; Morley, P.; Avery, A.C. Breed Distribution and Clinical Characteristics of B Cell Chronic Lymphocytic Leukemia in Dogs. J. Vet. Intern. Med. 2016, 30, 215–222. [Google Scholar] [CrossRef] [PubMed]
- Rout, E.D.; Burnett, R.C.; Labadie, J.D.; Yoshimoto, J.A.; Avery, A.C. Preferential use of unmutated immunoglobulin heavy variable region genes in Boxer dogs with chronic lymphocytic leukemia. PLoS ONE 2018, 13, e0191205. [Google Scholar] [CrossRef]
- Rout, E.D.; Labadie, J.D.; Yoshimoto, J.A.; Avery, P.R.; Curran, K.M.; Avery, A.C. Clinical outcome and prognostic factors in dogs with B-cell chronic lymphocytic leukemia: A retrospective study. J. Vet. Intern. Med. 2021, 35, 1918–1928. [Google Scholar] [CrossRef]
- Williams, M.; Avery, A.; Lana, S.; Hillers, K.; Bachand, A.; Avery, P. Canine Lymphoproliferative Disease Characterized by Lymphocytosis: Immunophenotypic Markers of Prognosis. J. Vet. Intern. Med. 2008, 22, 596–601. [Google Scholar] [CrossRef]
- Sheng, R.; Clarke, D.; Laver, T.; Meichner, K.; Northrup, N.; Tarigo, J. Prognostic significance of CD25 expression in dogs with a noninvasive diagnosis of B-cell lymphoma treated with CHOP chemotherapy. Vet. Comp. Oncol. 2023, 21, 28–35. [Google Scholar] [CrossRef]
- Ortolani, C. Flow Cytometry Today, 1st ed.; Springer Nature: Cham, Switzerland, 2023; pp. 11–21. [Google Scholar]
- Fedr, R.; Kahounová, Z.; Remšík, J.; Reiterová, M.; Kalina, T.; Souček, K. Variability of fluorescence intensity distribution measured by flow cytometry is influenced by cell size and cell cycle progression. Sci. Rep. 2023, 13, 4889. [Google Scholar] [CrossRef]
- Martini, V.; Poggi, A.; Riondato, F.; Gelain, M.E.; Aresu, L.; Comazzi, S. Flow-cytometric detection of phenotypic aberrancies in canine small clear cell lymphoma. Vet. Comp. Oncol. 2013, 13, 281–287. [Google Scholar] [CrossRef]
- Celant, E.; Marconato, L.; Stefanello, D.; Moretti, P.; Aresu, L.; Comazzi, S.; Martini, V. Clinical and Clinical Pathological Presentation of 310 Dogs Affected by Lymphoma with Aberrant Antigen Expression Identified via Flow Cytometry. Vet. Sci. 2022, 9, 184. [Google Scholar] [CrossRef]
- Seelig, D.M.; Avery, P.; Webb, T.; Yoshimoto, J.; Bromberek, J.; Ehrhart, E.J.; Avery, A.C. Canine T-zone lymphoma: Unique immunophenotypic features, outcome, and population characteristics. J. Vet. Intern. Med. 2014, 28, 878–886. [Google Scholar] [CrossRef] [PubMed]
- Rigillo, A.; Fuchs-Baumgartinger, A.; Sabattini, S.; Škor, O.; Agnoli, C.; Schwendenwein, I.; Bettini, G.; Rütgen, B.C. Ki-67 assessment—Agreeability between immunohistochemistry and flow cytometry in canine lymphoma. Vet. Comp. Oncol. 2021, 19, 551–566. [Google Scholar] [CrossRef] [PubMed]


| Cellular Population | Mean ± Standard Deviation | Median | Min | Max |
|---|---|---|---|---|
| Percentage | ||||
| Small CD21+ | 31.7 ± 15.1 | 29.2 | 3.9 | 68.9 |
| Small CD5+ | 53.1 ± 15.8 | 54.1 | 5.4 | 85.0 |
| Small CD5+CD21- | 42.8 ± 15.1 | 44.2 | 4.7 | 79.4 |
| Small CD5+CD21+ | 10.2 ± 9.3 | 8.7 | 0.3 | 55.0 |
| Large CD21+ | 5.7 ± 4.0 | 5.0 | 0.5 | 19.3 |
| Large CD5+ | 1.6 ± 1.0 | 1.3 | 0.3 | 4.0 |
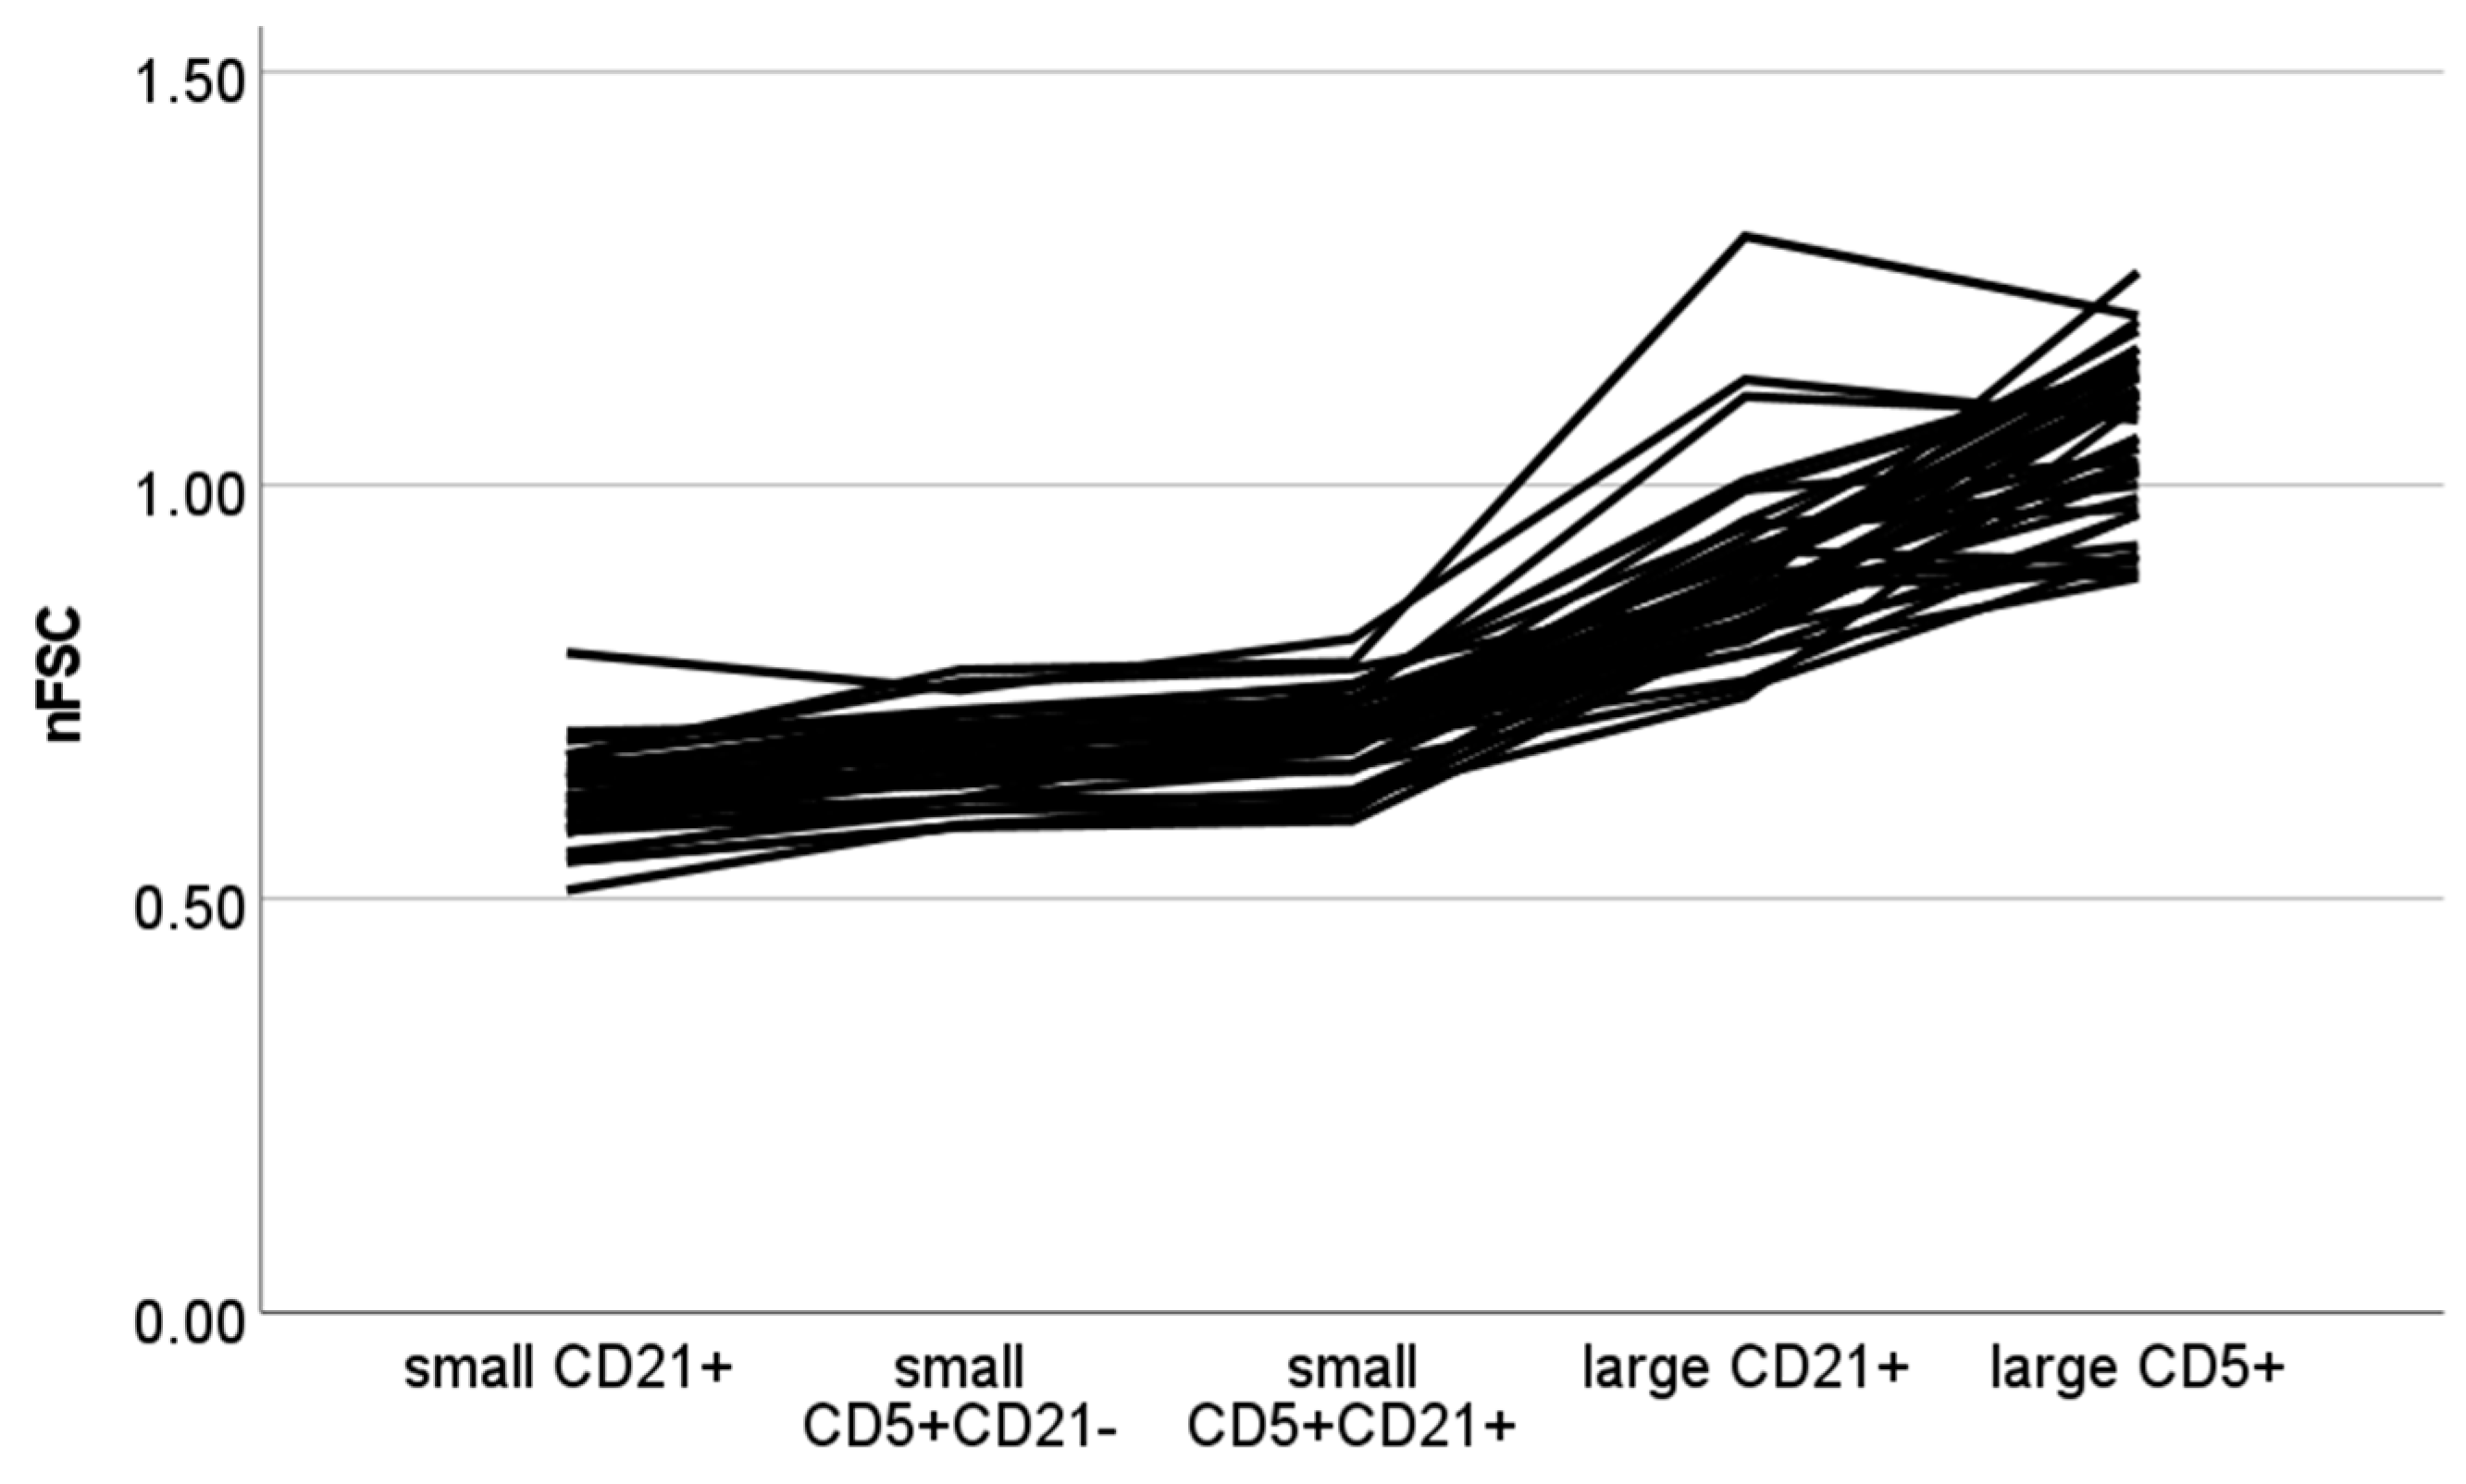
| nFSC | ||||
| Small CD21+ | 0.62 ± 0.05 | 0.62 | 0.51 | 0.80 |
| Small CD5+CD21- | 0.67 ± 0.05 | 0.67 | 0.59 | 0.78 |
| Small CD5+CD21+ | 0.70 ± 0.05 | 0.70 | 0.59 | 0.81 |
| Large CD21+ | 0.90 ± 0.10 | 0.88 | 0.74 | 1.30 |
| Large CD5+ | 1.06 ± 0.10 | 1.07 | 0.89 | 1.26 |
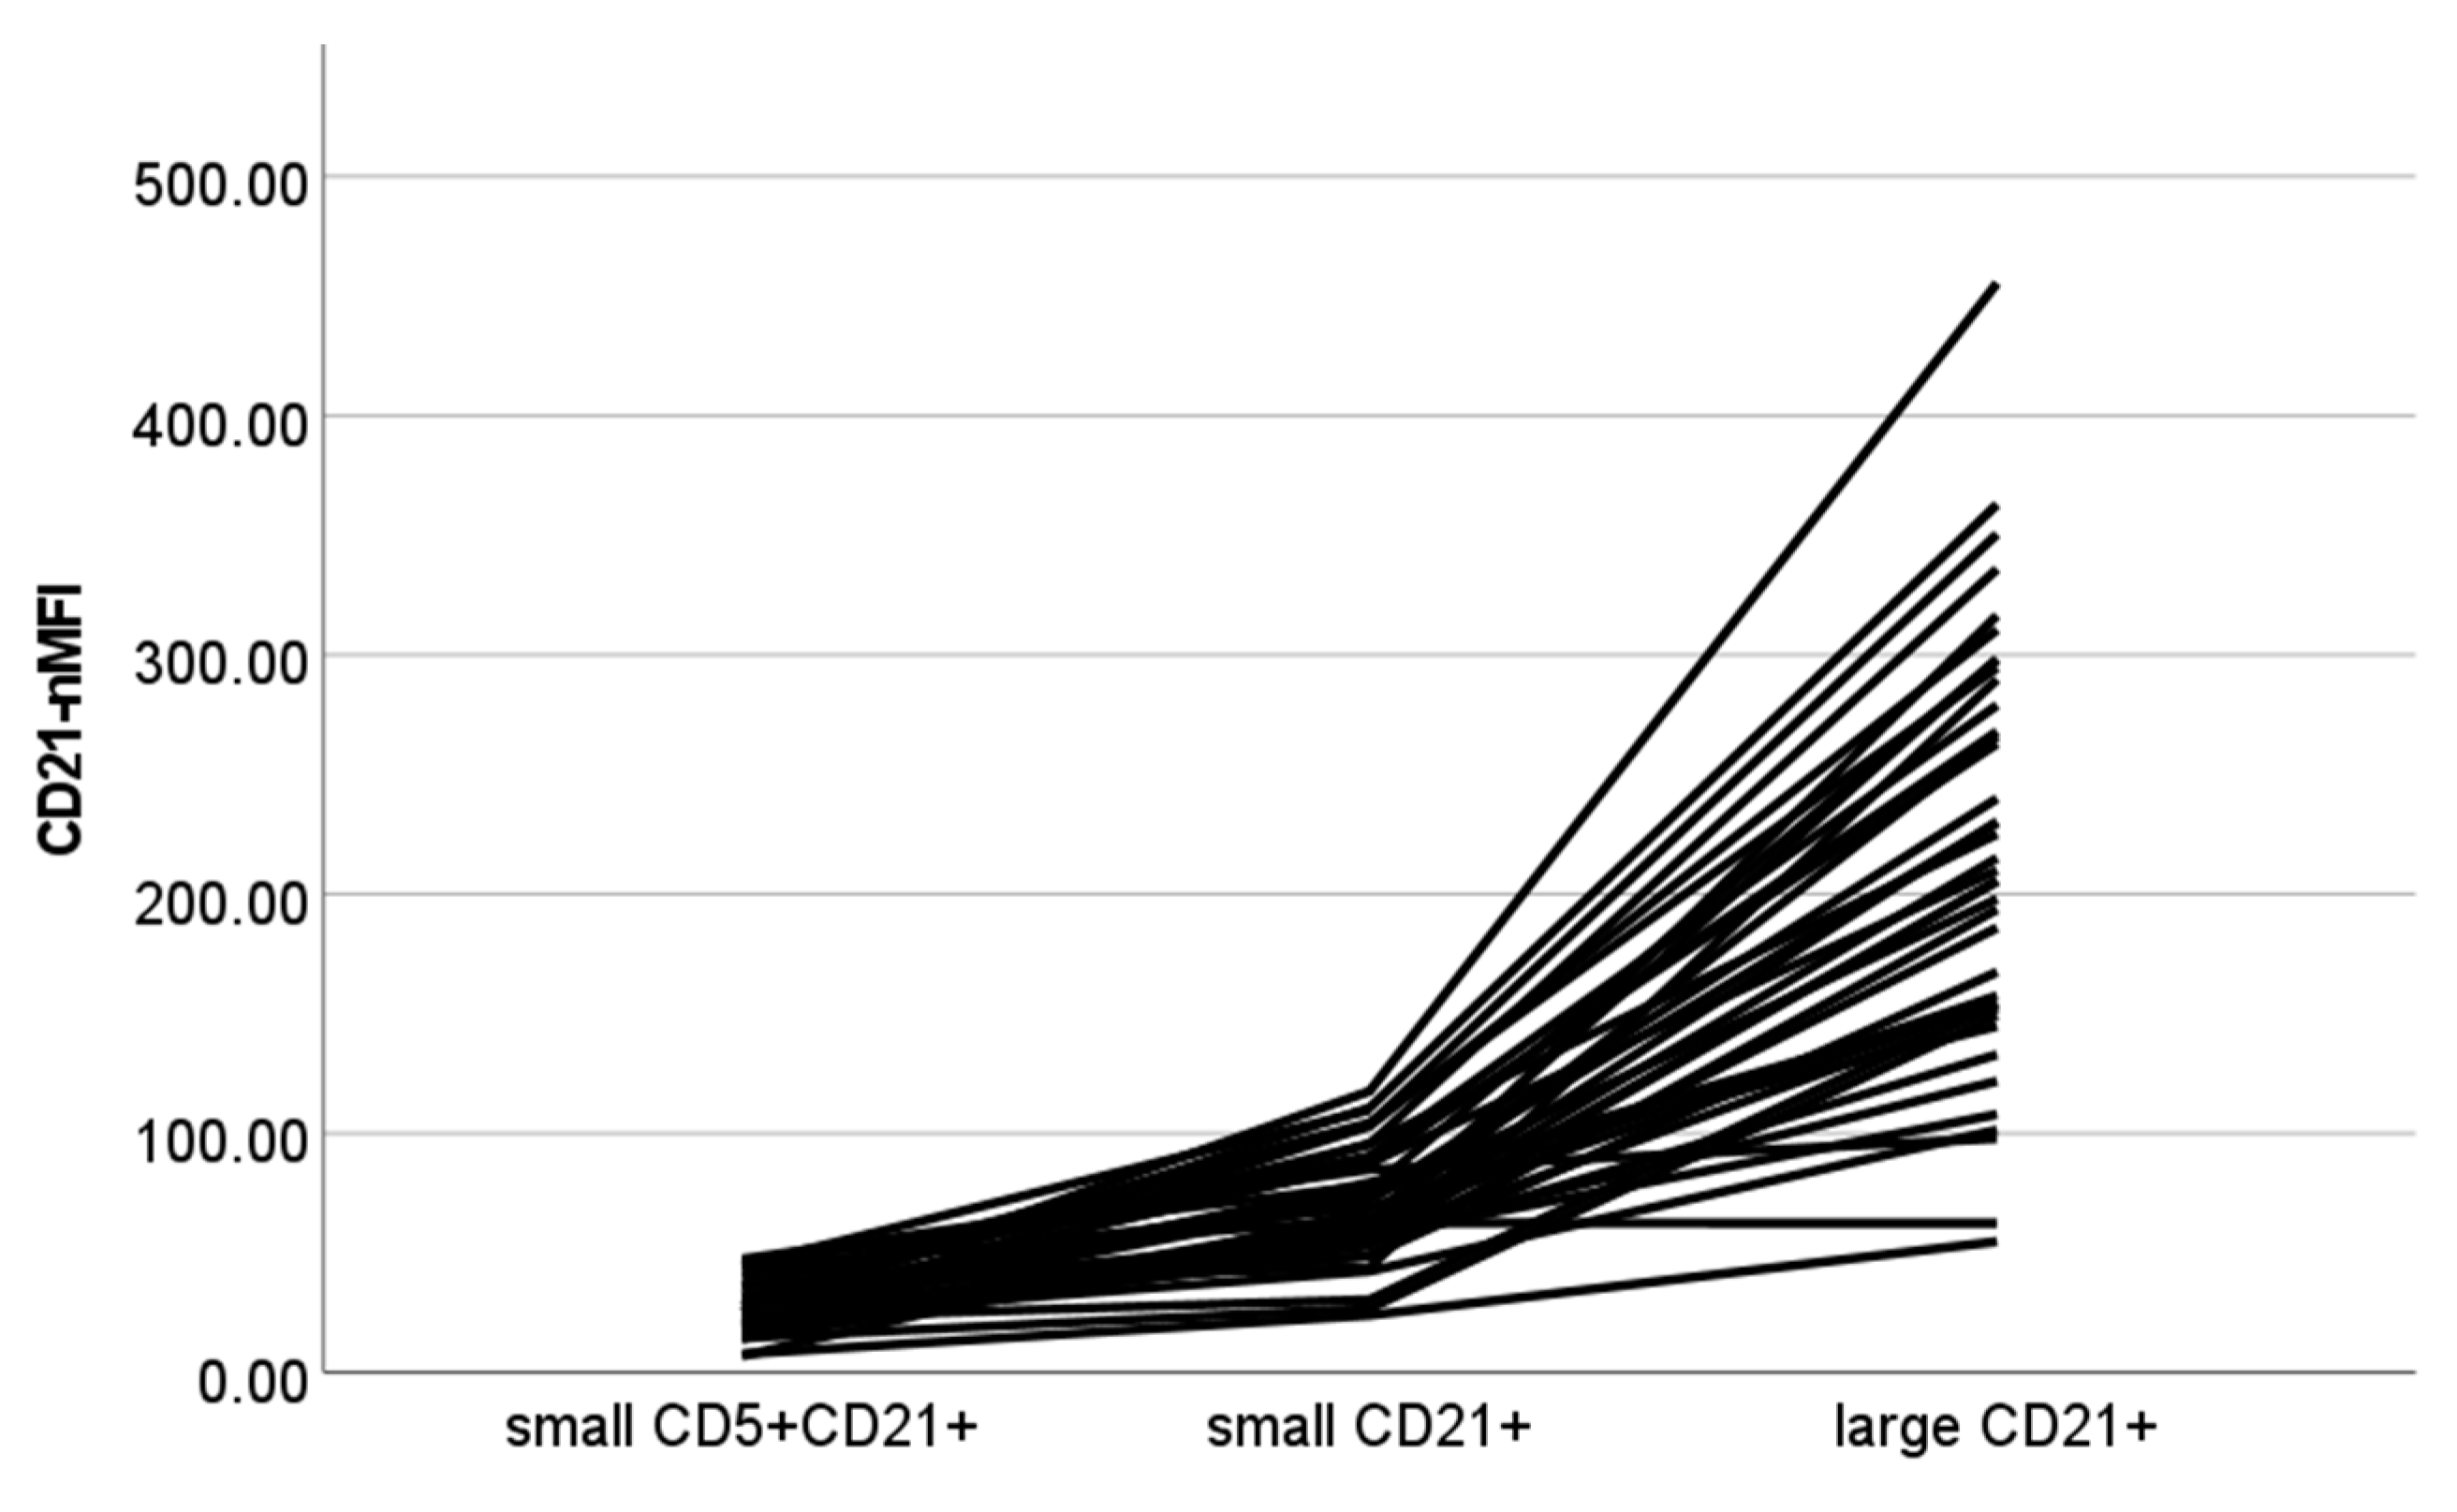
| CD21-nMFI | ||||
| Small CD21+ | 70.48 ± 23.07 | 66.39 | 24.07 | 117.70 |
| Large CD21+ | 216.07 ± 88.42 | 207.94 | 54.85 | 455.48 |
| Small CD5+CD21+ | 25.55 ± 10.35 | 22.70 | 7.01 | 47.51 |
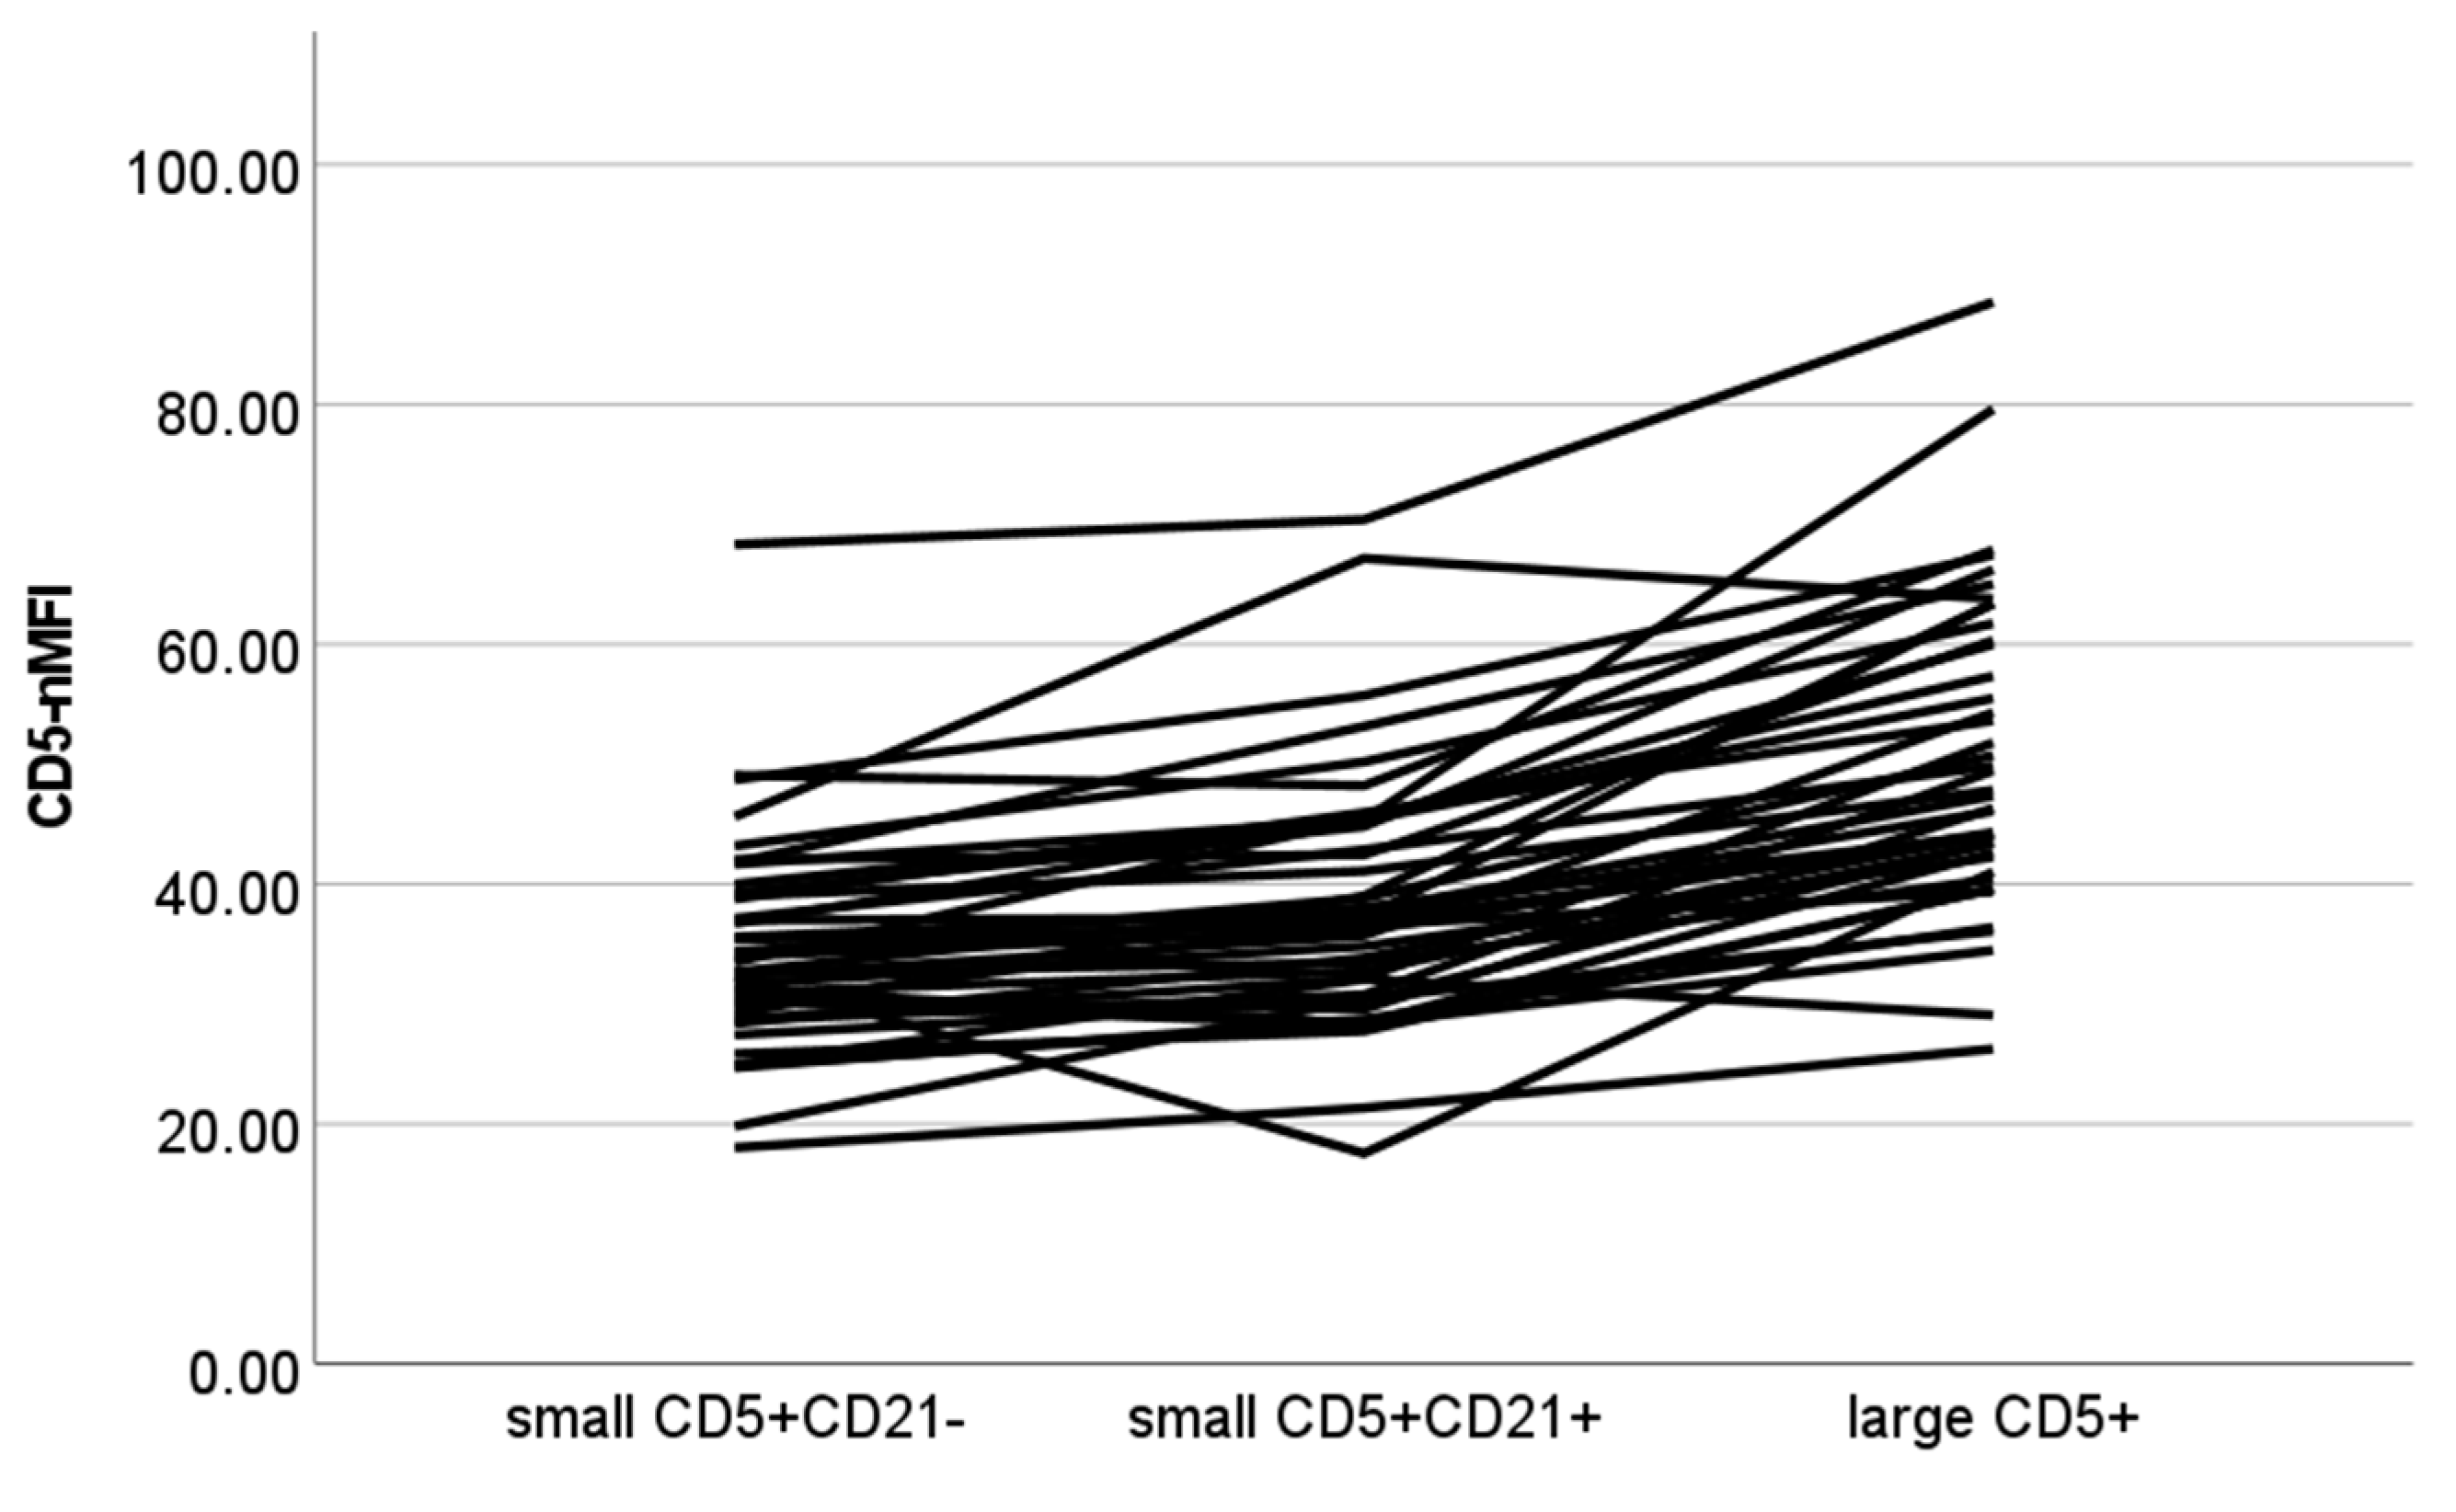
| CD5-nMFI | ||||
| Small CD5+CD21- | 34.54 ± 8.78 | 33.10 | 18.05 | 68.34 |
| Small CD5+CD21+ | 38.53 ± 10.63 | 37.05 | 17.57 | 70.40 |
| Large CD5+ | 50.68 ± 13.04 | 47.60 | 26.27 | 88.53 |
| B-Cell Lymphoma | Mean ± Standard Deviation | Median | Min | Max |
|---|---|---|---|---|
| Percentage | ||||
| DLBCL (n = 20) | 76.9 ± 19.9 | 85.6 | 24.0 | 95.5 |
| MZL (n = 6) | 85.1 ± 9.3 | 87.1 | 67.0 | 93.0 |
| FL (n = 3) | -- | (60.0) | (59.0) | (89.4) |
| LBL (n = 1) | -- | (22) | -- | -- |
| BLL (n = 1) | -- | (91.4) | -- | -- |
| nFSC | ||||
| DLBCL (n = 20) | 1.07 ± 0.14 | 1.07 | 0.80 | 1.30 |
| MZL (n = 6) | 0.98 ± 0.11 | 1.94 | 0.87 | 1.15 |
| FL (n = 3) | 1.02 ± 0.06 | 0.99 | 0.99 | 1.09 |
| LBL (n = 1) | -- | (1.00) | -- | -- |
| BLL (n = 1) | -- | (0.85) | -- | -- |
| CD21-nMFI | ||||
| DLBCL (n = 20) | 187.98 ± 79.89 | 188.67 | 33.82 | 319.25 |
| MZL (n = 6) | 178.93 ± 90.96 | 191.42 | 42.06 | 316.6 |
| FL (n = 3) | 254.22 ± 86.06 | 207.90 | 201.24 | 353.52 |
| LBL (n = 1) | -- | (257.40) | -- | -- |
| BLL (n = 1) | -- | (129.31) | -- | -- |
Disclaimer/Publisher’s Note: The statements, opinions and data contained in all publications are solely those of the individual author(s) and contributor(s) and not of MDPI and/or the editor(s). MDPI and/or the editor(s) disclaim responsibility for any injury to people or property resulting from any ideas, methods, instructions or products referred to in the content. |
© 2023 by the authors. Licensee MDPI, Basel, Switzerland. This article is an open access article distributed under the terms and conditions of the Creative Commons Attribution (CC BY) license (https://creativecommons.org/licenses/by/4.0/).
Share and Cite
Riondato, F.; Poggi, A.; Miniscalco, B.; Sini, F.; Marconato, L.; Martini, V. Flow Cytometric Features of B- and T-Lmphocytes in Reactive Lymph Nodes Compared to Their Neoplastic Counterparts in Dogs. Vet. Sci. 2023, 10, 374. https://doi.org/10.3390/vetsci10060374
Riondato F, Poggi A, Miniscalco B, Sini F, Marconato L, Martini V. Flow Cytometric Features of B- and T-Lmphocytes in Reactive Lymph Nodes Compared to Their Neoplastic Counterparts in Dogs. Veterinary Sciences. 2023; 10(6):374. https://doi.org/10.3390/vetsci10060374
Chicago/Turabian StyleRiondato, Fulvio, Alessia Poggi, Barbara Miniscalco, Federica Sini, Laura Marconato, and Valeria Martini. 2023. "Flow Cytometric Features of B- and T-Lmphocytes in Reactive Lymph Nodes Compared to Their Neoplastic Counterparts in Dogs" Veterinary Sciences 10, no. 6: 374. https://doi.org/10.3390/vetsci10060374