Article

Digital Twin Application and Bibliometric Analysis for Digitization and Intelligence Studies in Geology and Deep Underground Research Areas

Future Geo-Strategy Research Center, Korea Institute of Geoscience and Mineral Resources (KIGAM), 124 Gwahang-no, Yuseong-gu, Daejeon 34132, Republic of Korea
*
Author to whom correspondence should be addressed.
Submission received: 17 February 2023 / Revised: 17 March 2023 / Accepted: 13 April 2023 / Published: 20 April 2023

Abstract

:
As deep underground digital twins have not yet been established worldwide, this study extracted keywords from national or city-led digital twin practices and elements of digital twins and through these keywords selected research papers and topics that could contribute to the establishment of deep underground digital twins in the future. We applied the concept of digital twins in geology and underground research to collect 1702 papers from the Web of Science and conducted semantic network analysis and topic modeling. The keywords digital, three dimensions, and real time were placed in the middle and have many links in the word network. Artificial intelligence, deep learning, and neural networks all showed a low degree of centrality. As a result of topic modeling using Latent Dirichlet allocation (LDA), topics related to topography, geological structure, and rock distribution, which are the basic data for building a deep underground digital twin, were noted, and topics related to earthquakes/vibrations, landslides, groundwater, and volcanoes were identified. Energy resources and space utilization have emerged as the main themes.

1. Introduction

National or city-led digital twins have been established in many countries, such as the UK National Digital Twin and Virtual Singapore, and digitized in the interiors of buildings and facilities [1,2]. In each of the social overhead facilities, such as bridges, the digital twin is being studied as a tool for collection, analysis, prediction, and decision-making with the latest technology for the target facility [3,4]. National or city-led digital twins have been built within a depth of 100 m, which can provide information on the underground facilities but cannot provide information related to geo-environmental disasters deep underground. Earthquakes can occur up to depths of 15 km and not only cause damage to facilities and residents, but also cause secondary disasters such as fires, sinkholes, and landslides beyond city levels by progressing in faults. In addition to earthquakes, local geological characteristics, natural phenomena such as drought/flood, the development of nearby buildings and public facilities may cause geo-environmental hazards such as radon and other hazardous mineral resource leakage, groundwater level drops, underground cavitation, underground waste and seawater infiltration, and vibration. Our research began with the specific research themes of public institutes that conduct research on digitization and intelligence of geology and underground that can contribute to the establishment of deep underground digital twins. Our research goals can be summarized in a short list of questions:
  • What are the elements of digital twins, such as digitization and artificial intelligence, and how centrally is research on elements of the digital twin conducted in the public geology and underground field?
  • Has research on elements of digital twins been conducted in public geology and underground research institutes? Are digital twins in geology and underground area researched with subjects such as (1) geophysical disasters such as earthquakes, landslides, and underground cavitation, (2) geochemical disasters such as groundwater/soil/air pollution with hazardous mineral resources, underground wastes, or seawater, and (3) other national or regional-led research topics?
This study conducts semantic network analysis and topic modeling to find out the research themes of public institutes that can contribute to the establishment of deep underground digital twins. As a deep underground digital twin have not yet been established worldwide, this study collects papers regardless of the existence of the digital twin keyword. Using keywords like concepts and development stage of digital twins, we collected papers that can contribute to the establishment of deep underground digital twins and analyze research topics in geology and deep underground area.

2. Related Literature

2.1. Public Digital Twin

Center for Digital Built Britain (CDBB), the leading organization for the UK National Digital Twin, regards the Building Information Modeling (BIM) Strategy Paper of 2011 as a starting point for the UK digital twin [1]. Other related policies were presented, such as the Government Construction Strategy in 2011, the Digital Built Britain Strategy in 2015, and the Government Construction Strategy 2016–2020 [1]. The UK digital twin hub was launched in 2020 [1]. The CDBB defines a digital twin as a combination of digital forms of data describing a physical entity and presents the UK National Digital Twin as an ecosystem of connected digital twins that enables system optimization and planning rather than a single large model [1]. The CDBB created principles for the UK National Digital Twin in 2018, including guidance to policymakers on how to gather information and support the public for solutions to social challenges such as climate change, resilience, future mobility and social inequality [1]. The benefits of national digital twins in society are summarized as follows: (1) providing a climate change model that enables the creation and coordination of contingency plans, (2) reducing the environmental impact of the construction and manufacturing industries, and (3) improving decision-making aid for the effective operation of infrastructure in national crises [1]. Through an analysis of digital twin papers, Semeraro et al. suggested urban management as a subcategory of the digital twin context and application [5]. A digital twin can model smart buildings, road traffic, air quality, infrastructure, urban circular economies, and simulate people’s movement and emergency evacuation to improve the urban environment and quality of life [5]. Digital twins can support efficient preventive maintenance and city operations, and improve urban safety, security, and national services [5].
A digital twin is built by combining big data generated by sensors (Internet of Things) and a Building Information Model (BIM) in smart cities [6]. In terms of urban planning, digital twins have been presented as an accurate three-dimensional (3D) model of a city; for example, Virtual Singapore has been presented as a digital twin of the city [6]. According to the Singapore Land Authority, Virtual Singapore was released in 3D Singapore in 2014 [2] and recently released OneMap 3.0 in 2020. A digital twin for a smart city consists of six layers: terrain, buildings, infrastructure, mobility, digital layer/smart city, and virtual layer/digital twins [6]. The terrain layer, which is the first base, is a terrain information in the area where the city is constructed, but White et al. has suggested a limit by presenting the terrain layer as just a soil map [6]. As suggested in the Introduction, information on deeper underground environments and hazards, besides soil, is required for public digital twins. Based on the above studies, a national or city-led digital twin is based on a 3D model and is regarded as a complex network with more ecosystems than the aircraft and factory levels of individual institutions.

2.2. Digital Twin Concept and Bibliometric Analysis

Grieves first presented the basic concept of a digital twin in a conceptual model of Product Lifecycle Management (PLM) in 2002 [7]. The basic elements of the digital twin were first presented in the PLM as (1) real space, (2) virtual space, (3) a connection that flows data from real space to virtual space, and (4) a connection that transfers information from virtual space to real and sub virtual space [7]. Grieves viewed a digital twin as a physically manufactured product from the atom to macroscale, and as a dynamic model that changes during its product lifecycle [7]. Gartner and Chang and Jang classified a digital twin by its degree of implementation: a digital object that reflects the basic properties of a real object as level 1, a digital object that can be monitored and controlled in connection with the real world as level 2, and a digital object that can perform advanced analysis and simulation by applying artificial intelligence as level 3 [8,9]. Chang and Jang also detailed the stages of the digital twin. A digital twin at level 1 is a digital object that can be pre-simulated using only 3D visualization or changing properties [9]. A level 2 digital twin is a digital object that receives real-time sensing data and matches and monitors the data one-to-one [9]. A digital twin at level 3 is described as a digital object capable of predicting, analyzing, simulating, and even controlling real objects [9]. The level 1 digital twin of Chang and Jang is the level at which the virtual space of Grieves is built, and level 2 can be seen as the stage in which data connections flow from the real space to the virtual space of Grieves. Level 3 of Chang and Jang is different; it allows not only information, but also the control of real objects from virtual space to real space.
Semeraro et al. collected data from digital twin papers published in 2002–2020 and conducted text mining analysis of hierarchical clustering algorithm (HCA), Latent Dirichlet allocation (LDA), topic modeling, and Formal Concept Analysis (FCA) [5]. Consequently, digital twin research topics were divided into (1) context and application (life cycle), (2) functions, (3) architecture (layers), and (4) components (technologies) [5]. Semeraro et al. divided the architecture category into physical, network, and computing layers, which can be considered as a simplification of the basic elements of the digital twin suggested by Grieves [5,7]. Tao et al. suggested five elements of a digital twin by adding data and services to Semeraro et al.’s three layers [5,10]. The keywords for the components of a digital twin can be physical, network, computing, data, and service. However, because these are general words often used for other purposes, they were not used in this study.
Warke et al. collected data on digital twins and smart manufacturing from 1985 to 2021 and then analyzed the semantic network for papers from 2016 to 2021 [11]. As a result of paper collection from 1985 to 2021, the keywords of digital twin paper were suggested as digital twins, Industry 4.0, supply chain, predictive maintenance, artificial intelligence, smart factory/manufacturing, process optimization, etc. [11]. In their literature review, the evolution process of digital twins was divided into four stages: the digital twin concept was introduced and focus was directed on R&D in the first stage (Information Monitoring Model, 1985–2002), connected to a web browser and applied to multinational companies in the second stage (Digital Simulation, 2003–2014), connected to devices for effective virtual-physical data transmission in the third stage (IoT Implementation, 2014–2016), and real-time simulation, optimization, and defect detection using artificial intelligence and machine learning in the fourth stage (Decision-Making Tools, 2017–present) [11]. Kukushkin et al. collected digital twin papers from 1993 to 2022 and analyzed LDA, machine learning-based topic modeling, and Bidirectional Encoder Representations from Transformers (BERTopic) [12]. Consequently, the digital twin papers’ keywords were Industry 4.0, Internet of things, machine learning, simulation, cyber-physical systems, modeling, digitalization, deep learning, optimization, etc. [12].
Lasi et al. suggested cyber-physical systems as the basic concept of Industry 4.0 [13]. Lasi et al. cited Geisberger and Broy to define a cyber-physical system as a digital object that reflects the actual state of the system by digitally recording factory-related variables (stress, production time, etc.) [13,14]. Lasi et al. presented the fourth industrial revolution (Industry 4.0) as a fundamental paradigm shift and classified the first industrial revolution as the beginning of mechanization, the second industrial revolution as based on electricity, and the third industrial revolution as the spread of digitalization [13]. In this study, papers related to digitization before the appearance of digital twins were included as analysis targets and papers were collected with digital keywords.
We selected keywords through literature reviews on digital twins. We conducted a bibliometric analysis on papers that included “digital”, “three dimensions”, “real time”, and “artificial intelligence”, which are digital twin keywords for geology and deep underground research institutes of the public sector. Monitoring, simulation, and sensors were not applied to our search because they are general-purpose words used in geology and deep underground research. The Internet of Things (IoT) is a word that is used widely as a digital twin and is closely related to sensors in geology and deep underground research. “Internet” keyword is also used for general purpose and data can be obtained using keywords other than Internet, such as radio frequency and mobile phone frequencies in geological and underground areas. We searched for papers that included the immediate connection of data and information between physical objects (deep underground) and digital objects (computing) with real time keywords. In addition to artificial intelligence, machine learning and deep learning can also be used as search keywords. However, we used a more comprehensive keyword, artificial intelligence, as a search term. In addition to “digital”, digitize and digitization can also be keywords, but we considered all three words as synonyms in the later morphological analysis, so we used the comprehensive word “digital” as a keyword. Studies with digital twins were also collected when the “digital” keyword was used. The cyber-physical system was also not used as a keyword because it is a general word and is included as a synonym for digital twins in morphological analyses. We analyzed word frequency, word clouds, and semantic networks through a morphological analysis of the abstracts of the papers. Morphological analysis is a method of extracting and analyzing morphemes, which are the smallest units with meaning, from text data, whereas semantic network analysis is a method of analyzing adjacent relationships between words extracted through morphological analysis. In this study, semantic network analysis and topic modeling were conducted using the word co-occurrence frequencies. The topic modeling method extracted subtopics inherent in the text using the machine learning algorithm of the LDA.

3. Materials and Methods

3.1. Materials

We shortlisted papers in the Web of Science (WoS) through “digital”, “three dimensions”, “real time”, or “artificial intelligence” keywords with geology keywords for titles, abstracts, author-designated keywords, or WoS-designated keywords, and 12,683 papers were selected on 1 December 2022. We started the literature investigation in June 2022. Based on the above results, we analyzed 1702 papers from the top 15 public research institutes, excluding government agencies, research management, and universities (Table 1). Among the top 15 public research institutes, the top five are the US Geological Survey (USGS), British Geological Survey (BGS), Istituto Nazionale di Geofisica e Vulcanologia (INGV), National Institute for Earth Sciences Astronomy (INSU), and Deutsche GeoForschungsZentrum (GFZ). In Italy, the Institute of Geosciences and Earth Resources (IGG) is a geological and deep underground research institute but it was not included in the 15 top institutions conducting digitalized and intelligent research. The INGV in Italy focuses on research on earthquakes, volcanoes, and soil in the geology and deep underground research fields. The National Geophysical Research Institute of India (NGRI) is a research institute for earthquakes, volcanoes, and natural resources. In the United States, in addition to the USGS, the National Aeronautics and Space Administration (NASA) appeared as the top seven institutions for research papers on digitalized and intelligent geological research. In France, the INSU, a research institution of earth science, astronomy, and astrophysics, is one of the 15 top institutions of our selected research institutes, and the Bureau de Recherches Géologiques et Minières (BRGM) and the IFP Energies Nouvelles, which are geological research institutions, are the 10th and 11th institutions, respectively. The Commonwealth Scientific and Industrial Research Organization (CSIRO) in Australia, one of the 15 top research institutes, conducts comprehensive research on natural resources and the environment, space and communication, manufacturing and materials, animals and plants, and disasters. Geoscience Australia (GA) did not appear as one of the 15 top digitalized and intelligent geology and deep underground research institutions. Public research institutes that conduct digitalized and intelligent geology and deep underground research can be divided into three groups. The first group includes geological survey organizations such as the USGS, BGS, GFZ, Geological Survey of Canada (GSC), China Geological Survey (CGS), BRGM, IFP, Korea Institute of Geoscience and Mineral Resources (KIGAM), Geological Survey of Denmark Greenland (GEUS), and Geological Survey of Norway (GNU). The second group is the INGV and NGRI, which are specialized research institutes in natural disasters in the fields of geology and deep underground research. The third group is the INSU, NASA, and CSIRO, which include the aerospace and space utilization research fields.
Papers from the top 15 public geology and deep underground research institutes were searched starting from 1984 (Table 2). Because the total number of papers from 1984 to 2000 was 152, which is a small number, papers from that period with missing summaries were filled in after checking the original text. Semeraro et al. analyzed digital twin papers from 2002 to 2020, and Kukushkin et al. analyzed digital twin papers from 1993 to 2022 [5,12]. However, this study includes the period of the third industrial revolution, the spread of digitalization that contributed to the establishment of digital twins. The oldest paper searched for in this study was titled Digital Image Processing of Integrated Geochemical and Geological Information by Green, an author of BGS, published in the Journal of the Geological Society in 1984 [15]. This paper described an image analysis computing system for the remote sensing of digital image data. Green presented a method for generating geochemical digital images and geological sub images in the fields of geochemistry, mineral exploration, geothermal production, pharmaceuticals, and agricultural geology using computer-based image processing and analysis methods [15]. In the References section of this paper, the basic concept of computerized digital image processing for geologists by Condit and Chavez in USGS journals can be found, but this study was limited to WoS search results [15,16].
The second oldest paper was titled Digital Processing of Orbital Radar Data to Enhance Geologic Structure by Masuoka et al., which included NASA authors [17]. This study compared simple linear contrast, average or median filter, and edge enhancement techniques to emphasize geological structures with the digital imaging technology of Synthetic Aperture Radar (SAR) [17]. Two of the three papers published in 1989 included authors from the USGS and were based on the development of standards for 3D geological models, digital seabed mapping, and digital data dissemination. The other paper was titled An Artificial Intelligence Approach for the Cross-sectional Representation of Geology by Bessis et al., which includes IFP authors, and is about applying object recognition methods and origin search genetics concepts to geological cross-sections [18].

3.2. Dictionary of Defined Words, Thesaurus, and Exception Words

In this study, morphological analysis was conducted on nouns and adjectives. TF-IDF is a statistical index that determines the importance of a given word in a specific document based on term frequency (TF) and document frequency (DF) [19]. The TF is a value indicating how often a specific word appears in a document; the higher the value, the more important the word. However, if a word is commonly used, the frequency value of the word may appear high even though it is not an important word; therefore, the number of documents in which a specific word appears is measured by the DF value. As a result of the preliminary analysis, TF-IDFs of “three dimensions” and “digital”, which are important keywords, were 0.2 and 0.5, respectively, and the TF-IDFs of “chromitite”, “smectite”, and “hydrochemical”, which are related to chromium, iron, clay minerals, and chemistry, were higher than 2.0. Therefore, TF-IDF is not analyzed in this study and all words with TF-IDF 0.1 or higher are included in topic modeling analysis.
For morphological analysis, we followed the procedures of tokenization to separate morphemes, the smallest units that have meaning from unstructured text data, refinement to remove noise, normalization to unify words with the same meaning, and exclusion of words that do not require analysis. Defined words, synonyms, and exception dictionaries were prepared and applied to the procedures, and the dictionaries were updated through a preliminary analysis. As a result of the preliminary analysis, the words “map”, “model”, “system”, “image”, and “dataset” were associated with “three dimensions” and analyzed. “Surface” word is used as a digital surface, a name for the height information of artificial structures and natural objects; therefore, it was included in the analysis. Through several preliminary morphological analyses, the defined words included keywords such as “digital twin”, “Cyber Physical System”, “three dimensions”, “real time”, and “artificial intelligence” and related words such as digital earth, digital elevation, digital terrain (surface), digital image, neural network, geologic map, high resolution, remote sensing, and unoccupied aerial.
Long-term exposure to radon (Rn) in the air is likely to cause lung cancer, and uranium (U) may be exposed to humans through dust in the air and through the ingestion of water and food [20]. According to the United States Environmental Protection Agency (US EPA) regulations, the content of 222Rn in indoor air is 4 pCi/m3 and the maximum contaminant levels (MCL) for uranium (U) in drinking water is 30 μg/L [20,21]. Kim suggested radium (226Ra), thorium (232Th), and potassium (40K) as natural radioactive nuclides, and strontium (Sr), neodymium (Nd), and lead (Pb) as environmental indicator isotopes [20]. Therefore, in this study, radon, uranium, radium, thorium, potassium, strontium, neodymium, and lead were prepared in a thesaurus including element symbols. Uraninite, the name of the uranium ore, was used as a synonym for uranium.

3.3. Results of Morphological Analysis and Word-Frequency Analysis

Through the above procedures, a final morphological analysis was performed on the noun and adjective data of 1702 papers’ abstracts from 15 public geological and deep underground research institutes. Among papers published after 2000, if the abstract was omitted from the WoS search results, it was replaced with a title. A total of 183 words from 1702 papers were derived from the results of the morphological analysis (Figure 1 and Table 3). From the word cloud, the frequency of map-related words was high, and the map-related words included digitalized and intelligent geology and deep underground research, such as topography, geological structure, and rock distribution (Figure 1). For detailed research subjects, words such as “volcanoes”, “earthquake”, “landslide”, “aquifer”, “groundwater”, and “CO2” appeared with high frequency. Words used in various research fields, such as “seismic”, “geophysics”, and “lithology”, also appeared frequently. We classified words into general fields such as topography and maps, and specific research fields such as disasters and mineral resources (Table 4). The subcategories of general fields were publication, general information, and general technology; therefore, “three dimensions” were classified as general information, and “digital”, “real time”, and “artificial intelligence” were classified as general technology. Because the frequency of “artificial intelligence” was 36 times, we included “neural network” (40 times) and “deep learning” (5 times) for the analysis of the subject. The geological environment field has many related words; therefore, it is classified as another category, and the topic is derived according to topic modeling. Among the hazardous mineral resources, only uranium appeared after morphological analysis; other words were not drawn for radon, radium, thorium, potassium, strontium, neodymium, or lead. Regarding geo-environmental disasters, words about geohazards appeared more, for example, “seismic”, “volcano”, “earthquake”, “landslide” and “sinkhole”. The “seismic” word is used for seismic exploration of earthquakes and vibrations. Words about environmental disasters appeared less frequently, but we found the environmental hazards research field to be a combination of “geochemistry”, “groundwater”, “flood”, “quaternary”, “seawater”, “anthropogenic”, “ecosystem”, and “sustainability” words. Words related to space utilization, such as “Mars”, “satellite”, “orbiter”, and “moon”, were also found.

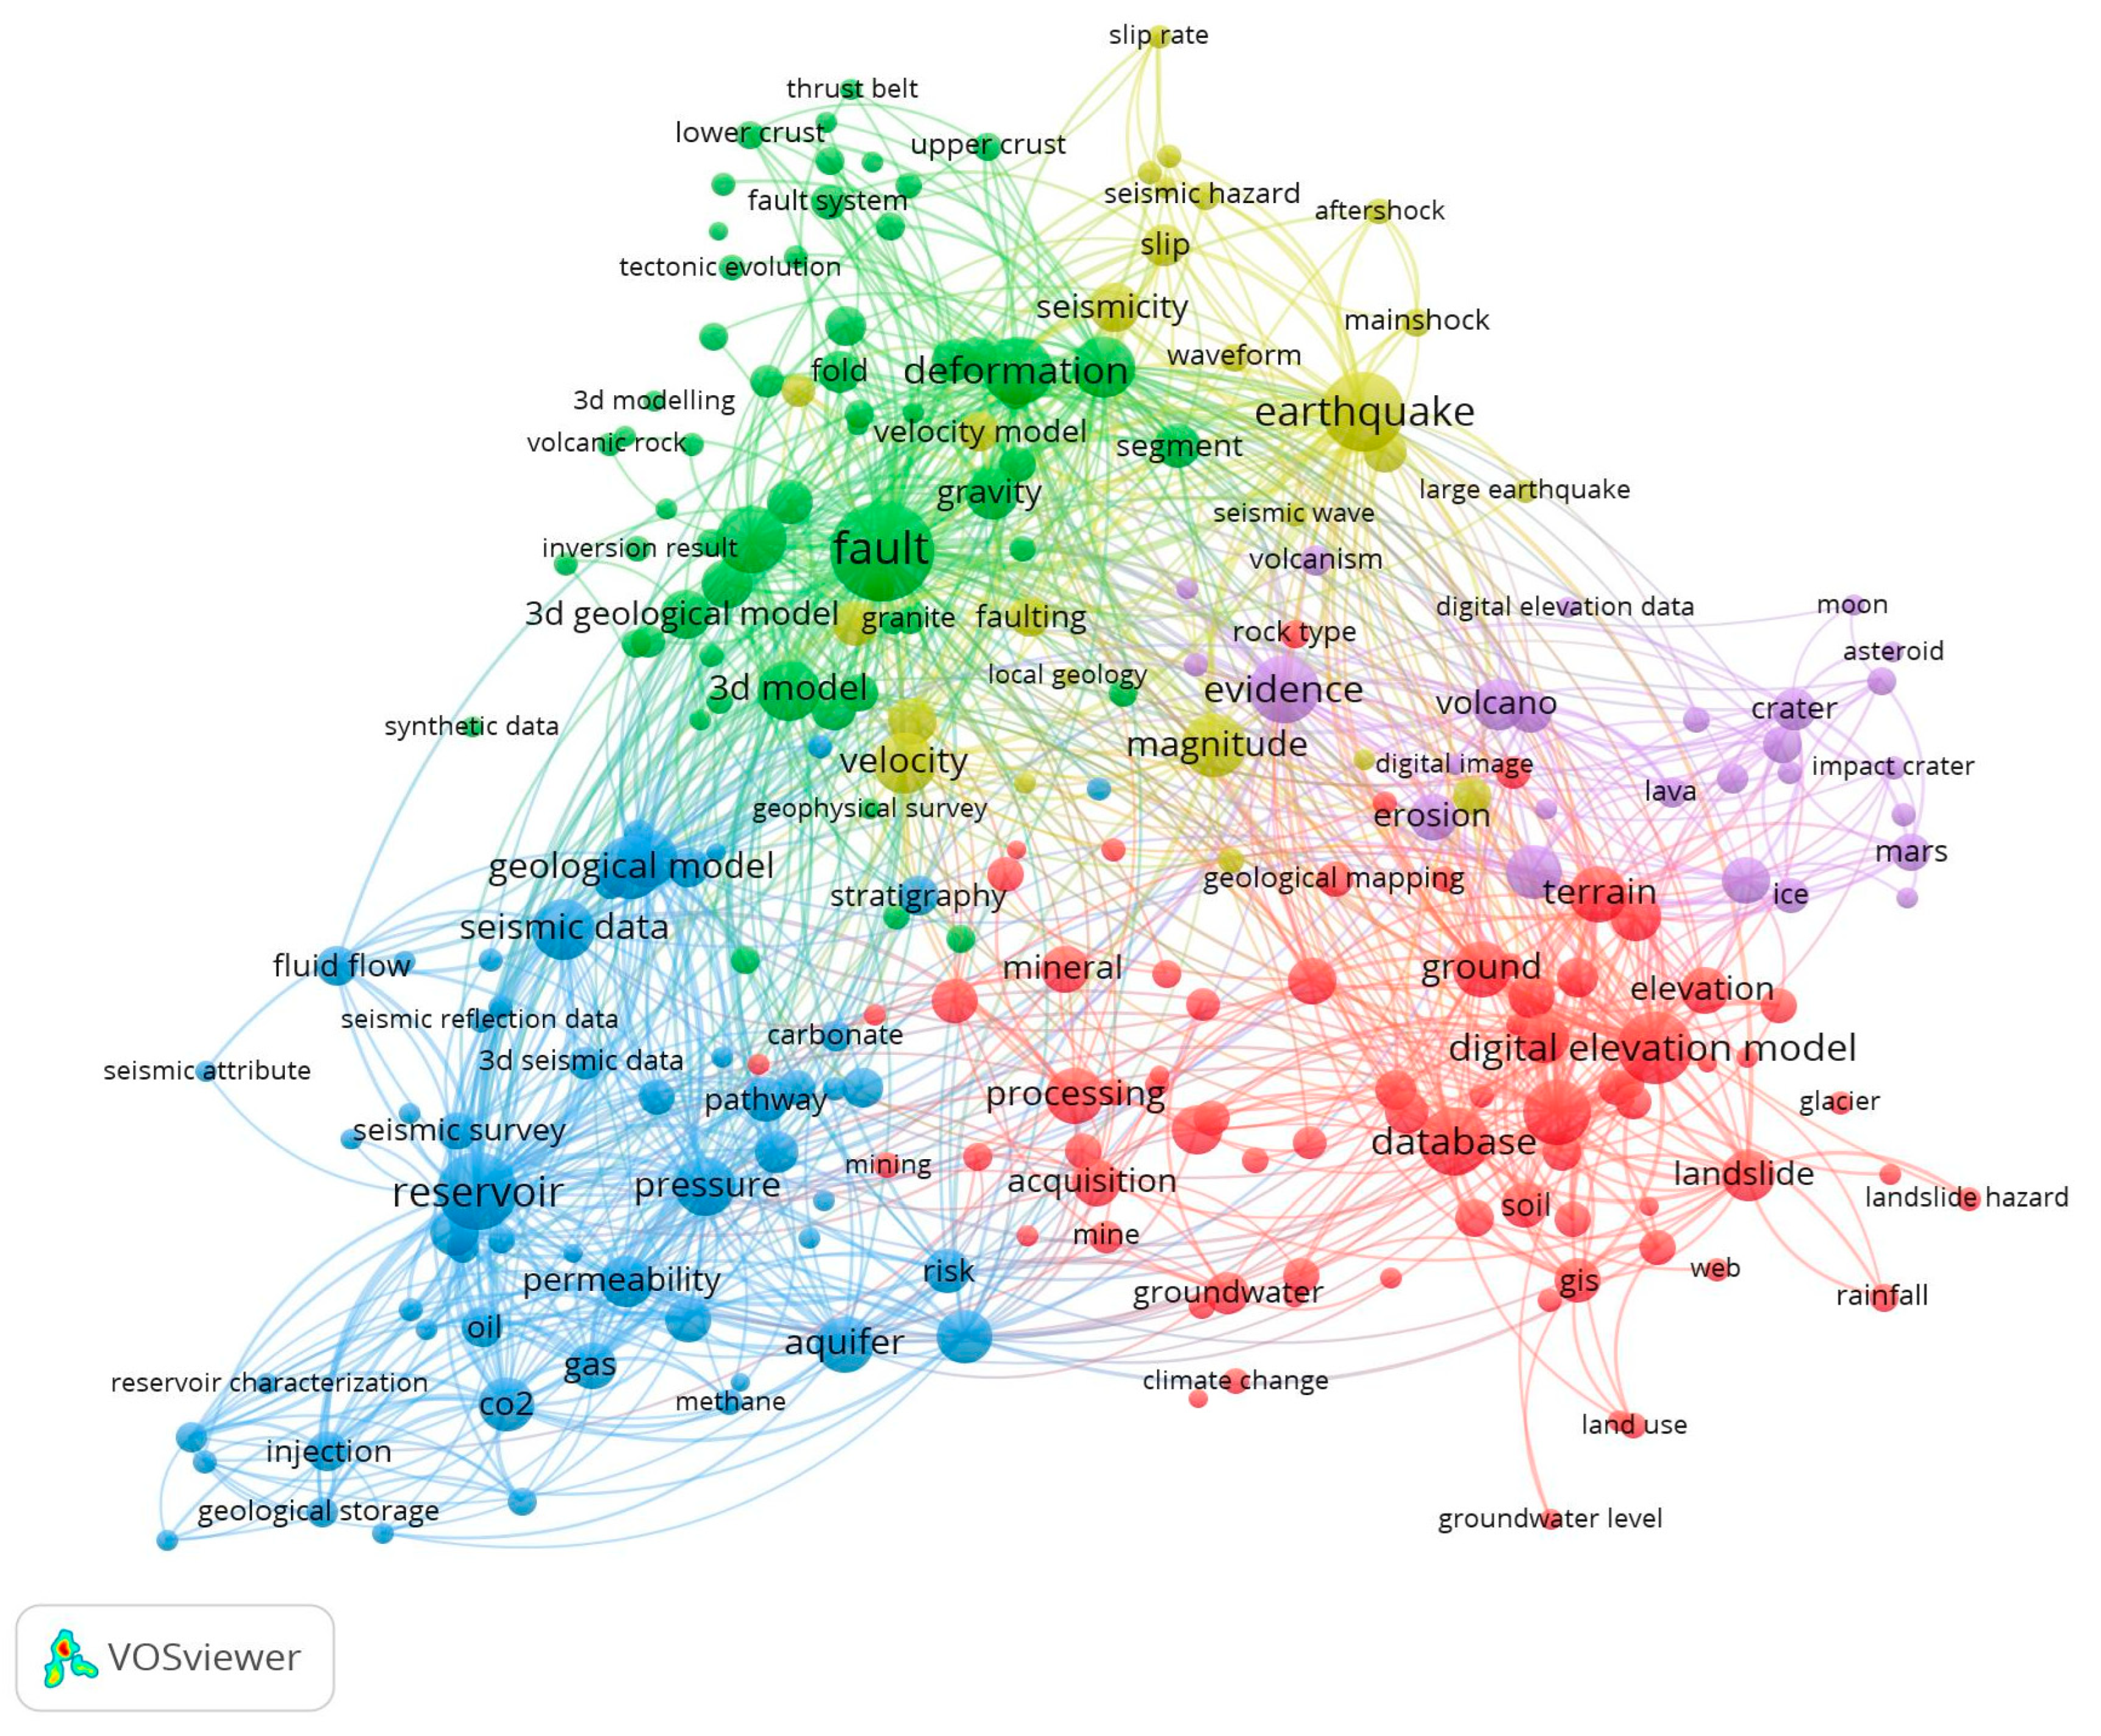
3.4. Results of Semantic Network Analysis through Co-Occurrence Frequency

Based on the above morphological analysis results, the co-occurrence frequency of three-word connections (window size = 3, direction applied) was illustrated as a word network, and a 2D spring network map was presented according to the algorithm of Fruchterman and Reingold [22] (Figure 2). Through the spring method, unconnected nodes push each other and connected nodes pull each other; thus, unconnected nodes are distributed, connected nodes are clustered together, and neighboring nodes are placed close together [19,22,23]. The word network was the result of arranging the nodes at equal intervals on a circle and then rearranging the nodes in the optimized position according to the Fruchterman and Reingold algorithm, which is more optimized than Eades. The words “artificial intelligence” and “deep learning” were placed farther away and had few links, whereas “digital”, “three dimensions”, and “real time” were placed in the middle and had many links. The “neural network” word was connected to the “artificial” word and was located in the middle rather than “artificial intelligence” and “deep learning”.
We examined the details with a co-occurrence frequency of 10 or higher. However, words such as “artificial intelligence” and “real time” have limited data, so “artificial”, “neural network”, “deep learning”, “network”, and “real”, which are related to the words, were examined with a frequency of two or higher. Regarding space utilization, words such as “Mars”, “planet”, and “satellite” were examined with the co-occurrence of two or more words. As the details of the co-occurrence frequency, “three dimensions” were associated with many words such as “dataset”, “geometry”, “image”, “magnetic”, “map”, “reconstruction”, “seismic”, “simulation”, “surface”, and “visualization” (Table 5). In the case of “artificial intelligence”, only the “porosity”, used in carbon dioxide and mineral resource research, showed a weak connection. No words were related to “deep learning” or “neural networks”. “Real time” was associated with research topics such as “earthquake”, “seismic”, “geochemistry”, and “CO2” and general research words such as “image”, “map”, and “network”. There was a connection between “real” and “three dimensions”. Words related to space utilization, such as “Mars”, “planet”, and “orbiter”, were interconnected.
Degree of centrality was considered in the co-occurrence frequency analysis (Table 6). Degree of centrality is calculated as the degree to which nodes are adjacent. In a directed network, the in-degree centrality is the sum of the number of times a node becomes the source node of a link, and the out-degree centrality is the sum of the number of times the node becomes the target node of a link [19]. The connection centrality of “seismic”, “geophysical”, “groundwater”, “landslide”, “earthquake”, “CO2”, and “Mars”, as well as “three dimensions” and “digital”, was high; however, “artificial intelligence”, “deep learning”, and “neural network” were words with low connection centrality. The degree centrality of “real time” was higher than that of “artificial intelligence”.
A semantic network analysis was conducted in which one or more clusters appeared (Link Frequency Threshold = 10, Binary Counting, resolution = 1.00) using the VOSviewer program for 1702 papers from the materials in Section 3.1, and five clusters were derived (Figure 3). VOSviewer is a tool for quantitative analysis through mapping and shows related words by clustering based on the co-occurrence frequency of words [24]. The dictionary of defined words, thesaurus, and exception words in Section 3.1, were not applied, and exception words were directly designated when deriving the VOSviewer results. The “digital” word appeared as “digital image” in cluster 1 (green), “digital data” in cluster 2 (red), and “digital elevation data” and “digital terrain model” in cluster 5 (purple). “Three dimensions” appeared as “3D geological model”, “3D geometry”, “3D inversion”, “3D model”, “3D modeling”, etc., in cluster 1 (green), “3D seismic data” in cluster 3 (blue), and “3D structural model” in cluster 4 (yellow). “Real” were used for “near real time”, “real time”, and “real time monitoring” in cluster 2 (red) and “real data” in cluster 3 (blue). “Artificial intelligence” and related words like “artificial”, “neural network”, “deep learning”, and “network” did not appear in clusters because the co-occurrence frequency of these words was less than 10, as discussed in Section 3.4. As the top 10 words based on links by cluster, cluster 1 (green) showed not only “anomaly”, “crust”, and “mineral” but also “3D model” and “3D geological model” (Table 7). Cluster 2 (red) shows “digital elevation model”, “slope”, and “landslide”, and cluster 3 (blue) shows “reservoir”, “seismic data”, and “CO2”. Cluster 4 (yellow) includes “fault” and “earthquake”, and cluster 5 (purple) includes “volcano”, “morphology”, “digital terrain model”, “MARS”, and “ice”. Cluster 5 (purple) can show the studies of the volcano and ice of MARS; however, the total link strength, occurrences, and links of the top 10 words were relatively low. Hence, it was necessary to examine the detailed research subjects of geohazards and space utilization.

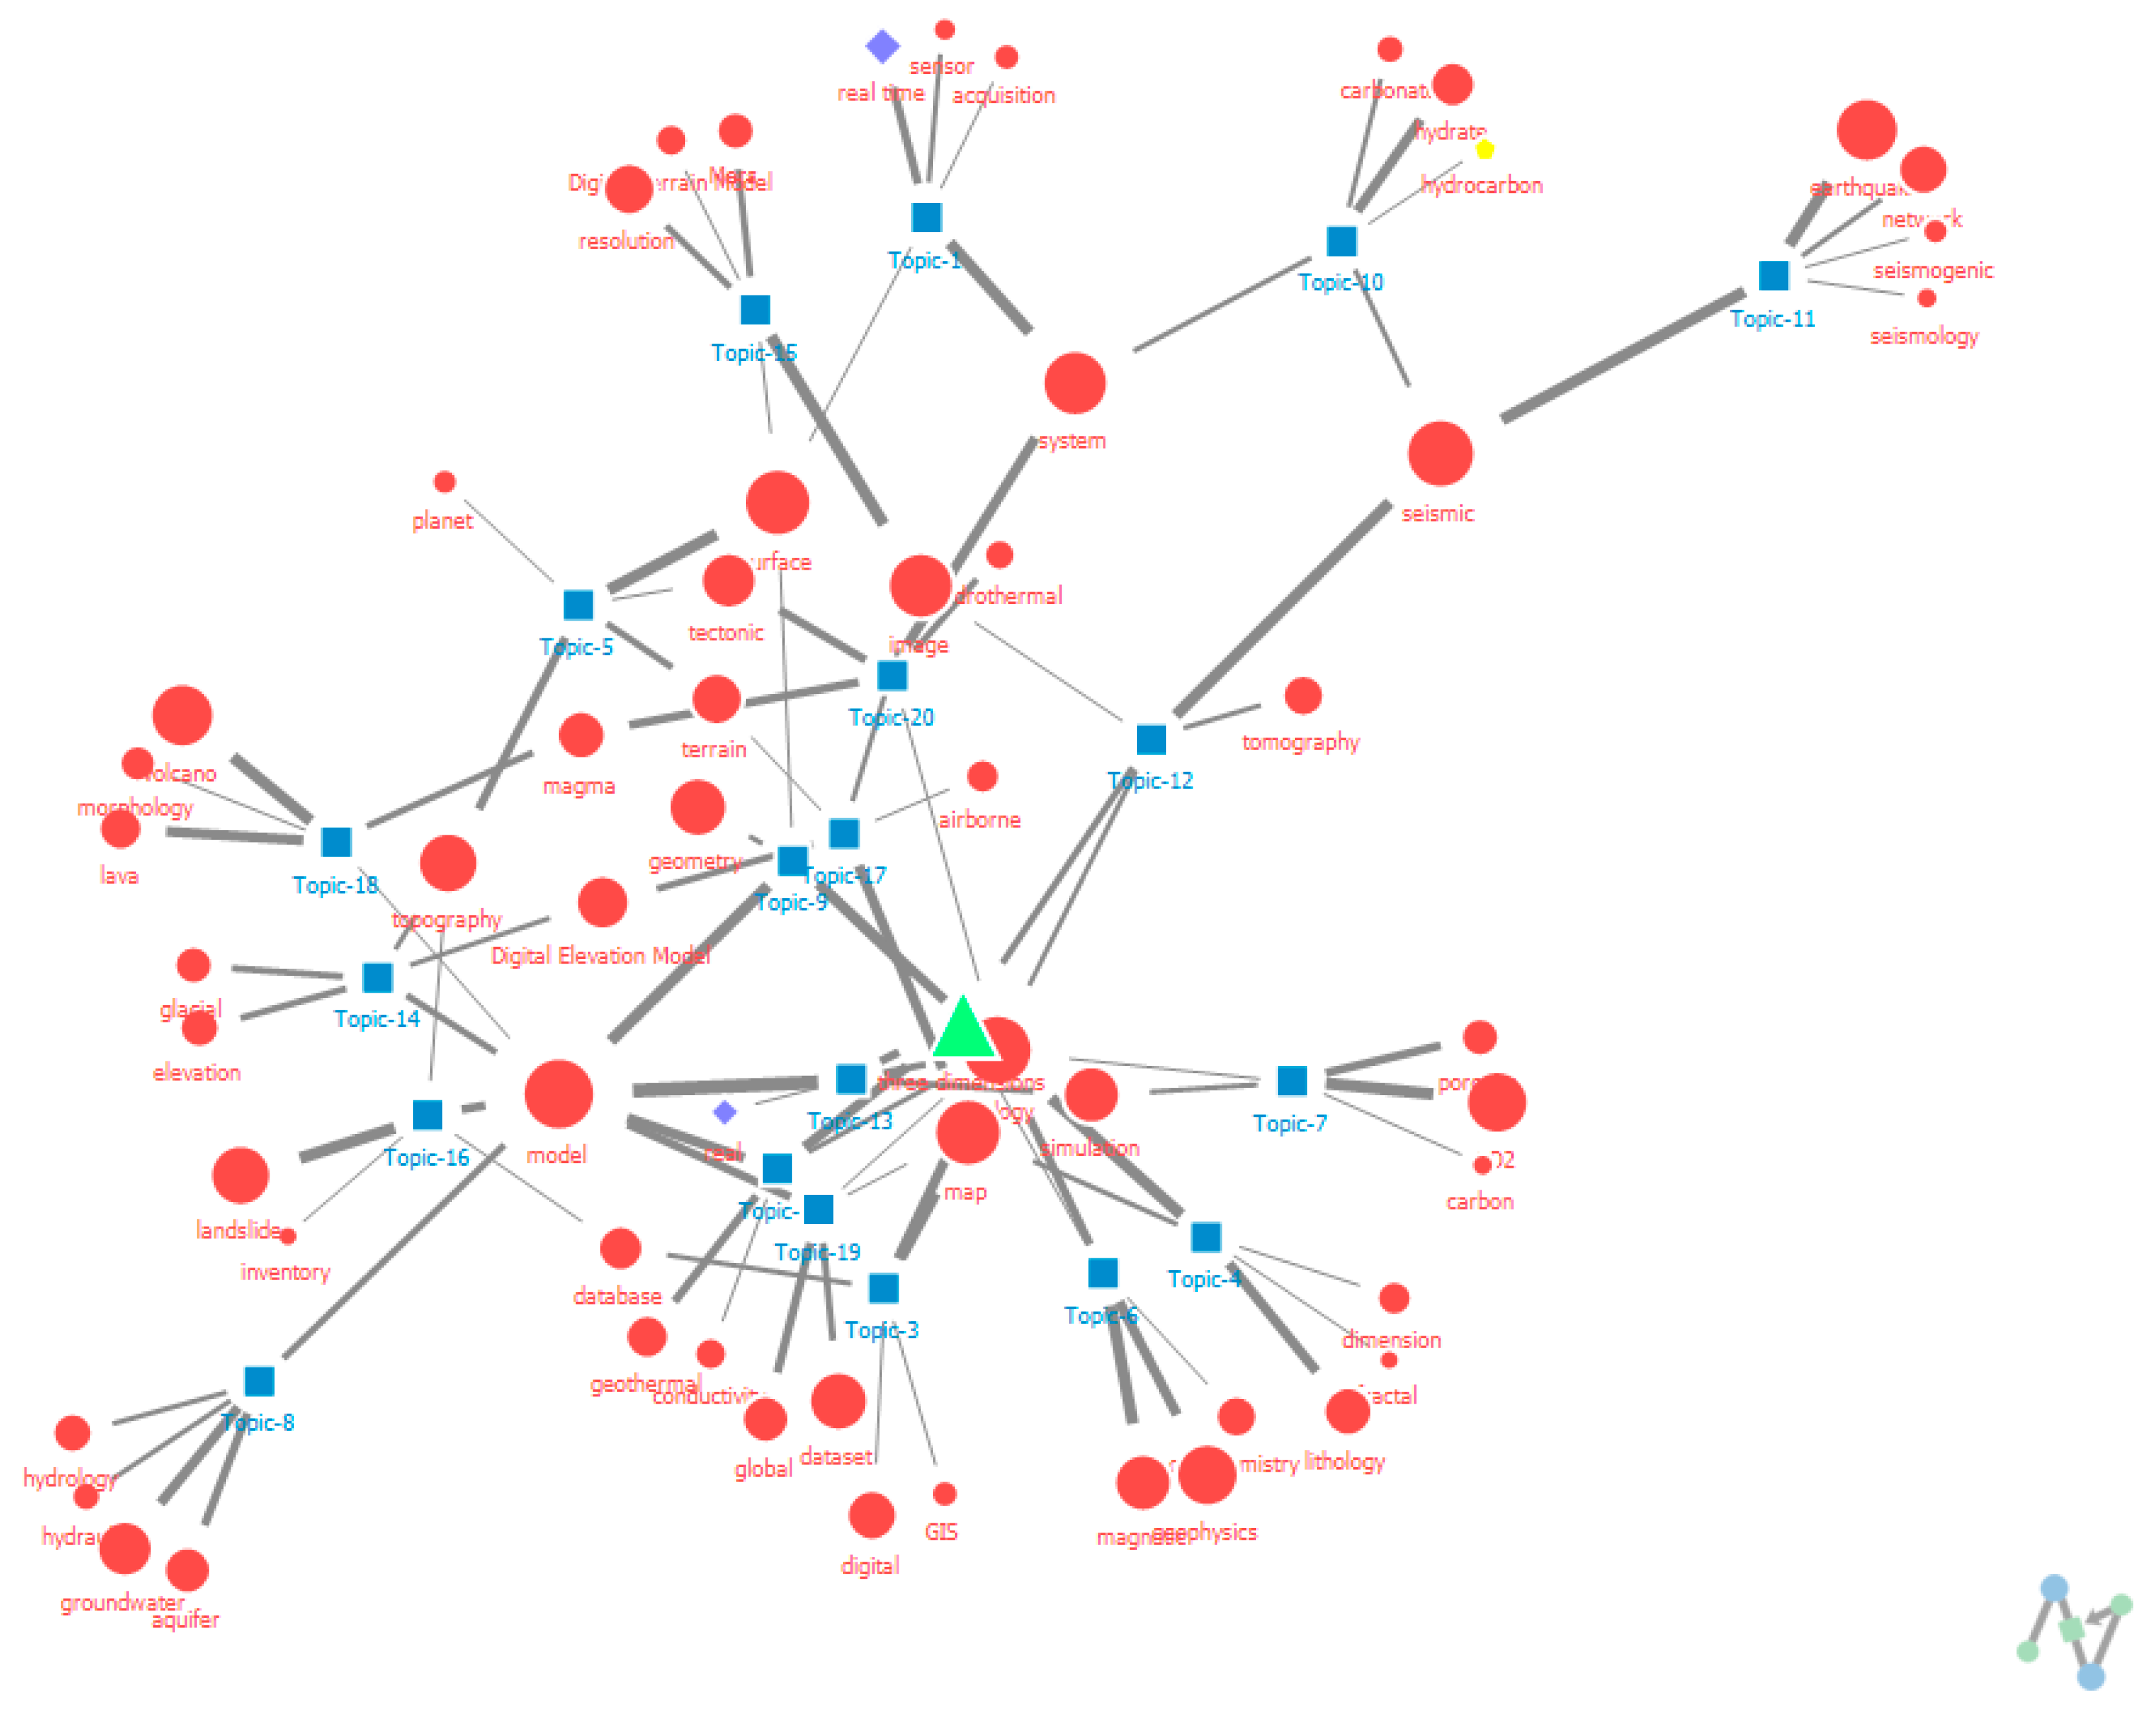
3.5. Results of Topic Modeling

The LDA machine learning algorithm was applied to extract meaningful research topics from the results of the above word networks. LDA is a representative model for deriving topics from large documents. It is an algorithm that expresses documents as the distribution of each topic, and the topic is expressed as the distribution characteristics of each word [25]. The LDA model learned from the results of the morphological analysis in Section 3.3, based on Words-Documents, through 1000 samplings with the Monte Carlo Markov Chain (MCMC) method using the Gibbs sampling of Griffiths and Steyvers. The silhouette coefficient value of the K-means clustering was used to determine the optimal number of topics. The silhouette coefficient of K-means clustering shows a value representing how dense the clusters are, ranging from −1 to 1; the closer the value is to 1, the more appropriate the number of clusters [19]. Many words were connected to the central part, as in the previous word network map (2D Spring, Fruchterman and Reingold). As the number of topics increased, the silhouette coefficients decreased (Table 8). More than 10 topics were considered to examine the topics of digitalized and intelligent geology and deep underground research in 15 public research institutes, which are divided into institutes for space utilization, natural disasters, and geological research.
When the 10 topics were analyzed, topics with “three dimensions” seemed related to “seismic-tectonic”, “simulation-surface”, and “groundwater-geothermal” (Table 9). “Digital”-related topics such as “lithology-database-dataset” and “topography–Digital Elevation Model” were also noted. Topics with “real time” or “artificial intelligence” did not appear among the 10 topics. Topics of digitalized and intelligent geology and deep underground research included “volcano-magnetic-magma-lava”, “CO2-porosity-carbonate”, “landslide-global-database”, “seismic-earthquake-hydrate”, and “image-surface-Mars”. Themes related to topography, geological structure, and rock distribution, which are the basic data for building a deep digital twin, were observed, and themes of earthquakes/vibrations, landslides, groundwater, and volcanic geohazards were identified. Although related to the “lithology-database-dataset” and “CO2-porosity-carbonate”, no topic words were directly found for hazardous mineral resources, sinkholes, waste, or seawater infiltration.
As the number of topics increased to 15, a “real time” keyword appeared with “global-dataset-sensor” (Table 10). The ten topics presented above appeared in 15 topics with similar keywords, but “lithology-database-digital” appeared instead of “lithology-database-dataset”. “Topography-surface-glacial-elevation” was also shown in the results for the 15 topics. Unlike the results for the 10 topics, a “landslide-flood” theme appeared, confirming the landslide research theme related to natural phenomena. After increasing the number of topics to 15, there were no topics related to hazardous mineral resources, underground cavitation, waste, or seawater infiltration. As the number of topics increased to 20, “three dimensions-simulation-real” topics appeared, and energy resource-related topics appeared as “hydrate-carbonate-seismic-hydrocarbon” (Figure 4).

4. Discussion

This study was conducted with an interest in geology and deep underground, which form the basis for elements like buildings, infrastructure, and transportation which, in turn, constitute national or city-led digital twins. “Digital”, “three dimensions”, “real time”, and “artificial intelligence” were set as the keywords of the deep underground digital twin according to the characteristics of the digital twin as true-to-life three-dimensional models, immediate data connections from deep underground, change prediction, and decision-making tools. Public research institutes conducting research on geology and deep underground that could contribute to building a deep underground digital twin were classified as institutes for aerospace and space utilization, natural disasters, and geological surveys. A morphological analysis was conducted on nouns and adjectives from the abstracts of 1702 papers from the top 15 public research institutes, and 182 words were derived. Word frequencies, word clouds, and word network maps were drawn and analyzed, and topics were extracted through topic modeling. As a result of the word cloud, the frequency of “three dimensions”, “image”, and “topography” words related to the digitization of geological publications or data was high. Because the frequency of “artificial intelligence” was low, it was suggested that “deep learning” and “neural network” should be included in word networks and topic modeling analysis. From the word network, “three dimensions” was associated with many words and “real time” was related to research topics such as “seismic”, “earthquake”, “geochemistry”. “Digital”, “three dimensions”, and “real time” keywords were placed in the middle and had many links in the word network map. “Neural network” was connected to “artificial intelligence”, and were located between “artificial intelligence” and “deep learning”. “Artificial intelligence”, “deep learning”, and “neural network” were all derived as words with low degree centrality. By examining the actual abstract data of 1702 papers, “artificial intelligence” was found in the abstracts of six papers and “deep learning” was found in four additional papers. A total of 29 papers were used for the “neural network” words, including two papers that overlapped with the previous words. “Artificial intelligence “related words have been used in several studies, such as 3D seismic, hazard map, lithological map/mineral system, and planetary exploration/orbital imagery words, and have been used with near real time, remote sensing, and seafloor maps. Through this additional investigation, it was found that artificial intelligence in geology and underground areas was researched together with topics such as disasters, rocks/resources, image analysis, real time analysis. Bibliometric analysis on “artificial intelligence” keywords in geology and deep underground research requires further research.
From the morphological analysis results, only “uranium” appeared in relation to the hazardous mineral resources and words for radon, radium, thorium, potassium, strontium, neodymium, and lead were not derived. Only “hydrocarbon” was included in relation to mineral and energy resources in the extraction results for the 20 topics. Geophysical hazard words such as “seismic”, “volcanic”, “earthquake”, “landslide”, and “sinkhole” and space utilization word, “Mars” appeared very frequently and was shown from the main words of the topic modeling. It was shown for geo-environmental hazards from the word frequency results, such as “geochemistry”, “groundwater”, “flood”, “quaternary”, “seawater”, “anthropogenic”, “ecosystem”, and “sustainability”, but these words were not shown except for “groundwater” and “flood” from the topic modeling’s main words. As a result of examining the actual abstracts data of 1702 papers, “geochemistry” related words have been used with geochemical mapping/groundwater (salinity) mapping, digital resource model/mineral evolution, geochemical and tectonic constraints/deep structure, geohazard information/geological hazard assessment, ground water quality/fluid flow evolution, mantle plumes and magma transport, deep geologic CO2 sequestration, and gas (methane) hydrate/unconventional energy resources. Geochemical disasters were studied together with the research subjects of digital, groundwater, rock/resource, deep structure, and geohazard information.
Because many words were located at the center of the word network map, the silhouette coefficient using K-means clustering decreased as the number of topics increased. As a result of drawing more than one cluster, five clusters appeared and the fifth cluster could be seen as a theme of volcanoes and ice on Mars. Therefore, it was necessary to increase the number of clusters to see if detailed research topics related to volcanoes and Mars appeared. More than ten topics were derived to examine the research topics of 15 public research institutes of space utilization, natural disasters, and geological surveys. Among the ten topics, “seismic-tectonic”, “simulation-surface”, and “groundwater-geothermal” appeared as topics including “three dimensions”, and “lithology-database-dataset” and “topography–Digital Elevation Model” topics appeared as “digital” topics. “Real time” and “artificial intelligence” topics did not appear in these ten topics; however, the “real time-global-dataset-sensor” topic appeared in the top 15 topics, and the “three dimensions-simulation-real” topic appeared in the top 20 topics. With the subject digitization and intelligence of geology and deep underground, topics such as “earthquake”, “volcano”, “landslide”, “CO2”, “groundwater”, and “Mars” appeared in ten subject classifications and as the number of topics increased to 15 and 20, subjects such as “sensor”, “digital”, “glacier”, “flood”, and “hydrocarbon” appeared. Subjects related to topography, geological structure, and rock distribution, which are the basic data for building a deep underground digital twin, appeared as a result of topic modeling. Although research on the digitization and intelligence of geology and deep underground areas is closely related to geohazard research, space utilization and energy resources have also emerged as central themes. For space utilization research, the related keyword is “surface”, so planetary surface research has mainly appeared rather than direct research on the deep parts of the planet. However, research on space utilization could be viewed as a research topic for building a deep underground digital twin that connects information from a distance in real time.
We formulated two research questions in the Introduction. Semantic network was conducted through morphological analysis of abstracts of digitization and intelligence papers in the field of geology and deep underground. LDA, a machine learning algorithm, and topics inherent in the text were derived. Although deep underground digital twins have not yet been established, real information and predictions of changes in the deep geological environment must be included in public digital twins in the future. To provide information on changes in the deep geological environment, research on geology and underground such as topography, geological structure, and mineral distribution, is essential. Public research institutions for geological surveys, natural disasters, and space utilization will contribute to the construction of deep underground digital twins in the future. The results of this study have significant implications for research directions and setting research goals, such as finding research topics and convergence between subfields for digitalization and intelligence studies on geology and deep underground research areas.

Author Contributions

Conceptualization, E.-Y.A.; methodology, E.-Y.A.; software, E.-Y.A.; validation, E.-Y.A. and S.-Y.K.; formal analysis, E.-Y.A.; investigation, E.-Y.A.; resources, E.-Y.A.; data curation, E.-Y.A.; writing—original draft preparation, E.-Y.A.; writing—review and editing, E.-Y.A. and S.-Y.K.; visualization, E.-Y.A.; supervision, E.-Y.A.; project administration, E.-Y.A.; funding acquisition, E.-Y.A. All authors have read and agreed to the published version of the manuscript.

Funding

This research was supported by the Basic Research Project (Basic Researches in Application and Development of Geological Samples and Geo-Technology R&D Policy/dissemination, GP2020-020) of the Korea Institute of Geoscience and Mineral Resources (KIGAM) funded by the Ministry of Science and ICT.

Institutional Review Board Statement

Not applicable.

Informed Consent Statement

Not applicable.

Data Availability Statement

The dataset described in this paper is available on https://github.com/eunyoungahn/digital-twin.

Conflicts of Interest

The authors declare no conflict of interest.

References

  1. CDBB (Centre for Digital Built Britain). The Approach to Delivering a National Digital Twin for the United Kingdom; CDBB: London, UK, 2020. [Google Scholar]
  2. Singapore Land Authority. Virtual Singapore—A 3D City Model Platform for Knowledge Sharing and Community Collaboration; Singapore Land Authority: Singapore, 2014. [Google Scholar]
  3. Shim, C.-S.; Dang, N.-S.; Lon, S.; Jeon, C.-H. Development of a bridge maintenance system for prestressed concrete bridges using 3D digital twin model. Struct. Infrastruct. Eng. 2019, 15, 1319–1332. [Google Scholar] [CrossRef]
  4. Nicoletti, V.; Martini, R.; Carbonari, S.; Gara, F. Operational Modal Analysis as a Support for the Development of Digital Twin Models of Bridges. Infrastructures 2023, 8, 24. [Google Scholar] [CrossRef]
  5. Semeraro, C.; Lezoche, M.; Panetto, H.; Dassisti, M. Digital twin paradigm: A systematic literature review. Comput. Ind. 2021, 130, 103469. [Google Scholar] [CrossRef]
  6. White, G.; Zink, A.; Codecá, L.; Clarke, S. A digital twin smart city for citizen feedback. Cities 2021, 110, 103064. [Google Scholar] [CrossRef]
  7. Grieves, M. Origins of the Digital Twin Concept; Florida Institute of Technology: Melbourne, FL, USA, 2016. [Google Scholar]
  8. Velosa, A.; Natis, Y.; Lheureux, B. Use the IoT Platform Reference Model to Plan Your IoT Business Solutions; Gartner Research: Stamford, CT, USA, 2016. [Google Scholar]
  9. Chang, Y.S.; Jang, I.S. Technology trends in digital twins for smart cities. Electr. Telecomm. Trends 2021, 36, 99–108. [Google Scholar]
  10. Tao, F.; Zhang, M.; Liu, Y.; Nee, A.Y.C. Digital twin driven prognostics and health management for complex equipment. CIRP Ann. 2018, 67, 169–172. [Google Scholar] [CrossRef]
  11. Warke, V.; Kumar, S.; Bongale, A.; Kotecha, K. Sustainable development of smart manufacturing driven by the digital twin framework: A statistical analysis. Sustainability 2021, 13, 10139. [Google Scholar] [CrossRef]
  12. Kukushkin, K.; Ryabov, Y.; Borovkov, A. Digital twins: A systematic literature review based on data analysis and topic modeling. Data 2022, 7, 173. [Google Scholar] [CrossRef]
  13. Lasi, H.; Fettke, P.; Kemper, H.G.; Feld, T.; Hoffmann, M. Industry 4.0. Bus. Inf. Syst. Eng. 2014, 6, 239–242. [Google Scholar] [CrossRef]
  14. Geisberger, E.; Broy, M. agendaCPS: Integrierte Forschungsagenda Cyber-Physical Systems; acatech: Berlin, Germany, 2012. [Google Scholar]
  15. Green, P.M. Digital image processing of integrated geochemical and geological information. J. Geol. Soc. 1984, 141, 941–949. [Google Scholar] [CrossRef]
  16. Condit, C.D.; Chavez, P.S. Basic Concepts of Computerized Digital Image Processing for Geologists; Geological Survey Bulletin; U.S. Government Publishing Office: Washingtnon, DC, USA, 1979; Volume 1462. [Google Scholar]
  17. Masuoka, P.M.; Harris, J.; Lowman, P.D.; Blodget, H.W. Digital processing of orbital radar data to enhance geologic structure: Examples from the Canadian shield. Photogramm. Eng. Remote Sens. 1988, 54, 621–632. [Google Scholar]
  18. Bessis, F.; Pochard, C.; Hamburger, J. Representation of geological cross-sections: An artificial intelligence approach, oil & gas science and technology. Rev. IFP 1989, 44, 275–289. [Google Scholar]
  19. CYRAM. NetMiner 4: NetMiner Semantic Network Analysis; CYRAM: Fairfax, VA, USA, 2022. [Google Scholar]
  20. Kim, S.W. Integrated Management and Harm Assessment of Potentially Hazardous Elements from Geological Bedrock in Korea; KIGAM: Daejeon, Republic of Korea, 2022. [Google Scholar]
  21. United States Environmental Protection Agency (US EPA). Radionuclides Rule; United States Environmental Protection Agency: Washingtnon, DC, USA, 2022. [Google Scholar]
  22. Fruchterman, T.M.J.; Reingold, E.M. Graph-drawing by force-directed placement. Softw. Pract. Exper. 1991, 21, 1129–1164. [Google Scholar] [CrossRef]
  23. Eades, P. A heuristic for graph drawing. Cong. Numer. 1984, 42, 149–160. [Google Scholar]
  24. Van Eck, N.J.; Waltman, L. Software survey: VOSviewer, a computer program for bibliometric mapping. Scientometrics 2010, 84, 523–538. [Google Scholar] [CrossRef] [PubMed]
  25. Blei, D.M.; Ng, A.Y.; Jordan, M.I. Latent dirichlet allocation. J. Mach. Learn. Res. 2003, 3, 993–1022. [Google Scholar]
Figure 1. Word cloud (created with NetMiner4).
Data 08 00073 g001
Figure 2. Word network map (2D Spring, Fruchterman and Reingold) (created with NetMiner4). Words marked with green triangles are words related to three dimensions (2D, 4D), purple diamonds are words related to real time and real, and blue squares are words related to Artificial Intelligence.
Data 08 00073 g002
Figure 3. Word network map (one or more clusters, link frequency threshold = 10, binary counting, resolution = 1.00) (created with VOSviewer).
Data 08 00073 g003
Figure 4. Topic map of 20 topic LDA results (created with NetMiner4). Words marked with a green triangle is three dimensions, purple diamonds are real time and real, and a yellow pentagon is hydrocarbon.
Data 08 00073 g004
Table 1. Number of papers from top 15 public geological and deep underground research institutes.
InstitutionNationalityNumber of Papers 1
United States Geological SurveyUnited States327
British Geological SurveyUnited Kingdom183
Istituto Nazionale di Geofisica e VulcanologiaItaly159
National Institute for Earth Sciences AstronomyFrance155
Deutsche GeoForschungsZentrumGermany138
Geological Survey of CanadaCanada128
National Aeronautics Space AdministrationUnited States118
Commonwealth Scientific and Industrial Research OrganizationAustralia107
China Geological SurveyChina99
Bureau de Recherches Geologiques et MinièresFrance89
IFP Energies NouvellesFrance70
Korea Institute of Geoscience and Mineral ResourcesKorea65
Geological Survey of Denmark GreenlandDenmark59
National Geophysical Research InstituteIndia57
Geological Survey of NorwayNorway55
1 Papers with authors from multiple institutions are duplicated, so the total number of papers in the table is different from the total analyzed papers of 1702.
Table 2. Annual number of papers from top 15 public geological and deep underground research institutes.
YearNumber of PapersYearNumber of Papers
2022125200427
2021146200324
2020130200225
2019105200114
2018114200022
201789199924
201685199815
20158519977
201472199610
20137019957
20127119949
201158199324
201063199213
200967199114
20085019902
20074419893
20063519881
20055119841
Table 3. Word-frequency results (created with NetMiner4) and word classification.
ClassificationWordsFrequencyClassificationWordsFrequency
publicationmap1248disasterseismic1309
global220volcano579
Enhanced Thematic Mapper14earthquake559
mapper13landslide436
seamless9magma247
seam9lava179
general
information
model2797seismogenic96
geology2307seismology51
three dimensions1598sinkhole35
surface937geohazard32
system923ShakeMaps24
image757seismotectonic16
topography418seismograph14
dataset406ShakeAlert12
geometry404mineral
resource
limestone36
Digital Elevation Model306calcite18
terrain290breccia18
resolution286uranium16
two dimensions 264chromitite16
network261smectite14
high resolution245magnetite14
database202otherCO2445
elevation164geophysics439
geomorphology145magnetic374
morphology140groundwater340
dimension136tectonic325
Digital Terrain Model131lithology240
geographic74aquifer227
geotechnical63hydrate210
photogrammetry52geothermal197
geostatistical52tomography169
inventory43geochemistry169
fractal39hydrology168
geodetic38porosity146
metamorphic36glacial145
GPS29Mars145
geospatial23airborne134
topology22conductivity128
digital data22hydrothermal127
digital geological21carbonate123
digital image16hydraulic117
graphic15climate115
repository14flood108
Digital Surface Model11satellite107
oceanographic9Quaternary101
morphometry8planet98
general
technology
simulation351radar92
digital259hydrocarbon91
real time176remote sensing83
real125anisotropy81
acquisition108lithosphere80
GIS103carbon77
cluster99isotope62
visualization98methane60
reconstruction93aerial58
sensor84aeromagnetic52
cloud65remote47
calibration64orbiter47
web51tensor45
neural network40viscosity43
artificial36anthropogenic43
Artificial Intelligence36orogenic42
recognition35SAR39
modification34geomechanical36
virtual21rheology35
four dimensions 20hyperspectral35
simulator19geodynamic34
virtual reality16spectrometry33
insitu15spectroscopy28
demonstration15InSAR28
unmanned14radiometric26
kriging13magnetotelluric26
drone13lithostratigraphic26
autonomous7sensing24
digital topographic5hydrodynamic24
digital representation5coseismic24
digital outcrop5thermogenic23
deep learning5microscopy23
wireless4liquefaction22
lot4moon21
-radiation20
GNSS20
isostatic19
hydrostratigraphic19
hydrochemical19
ecosystem19
metallogenic18
geomagnetic17
thermomechanical16
chronology16
lowdensity15
GPR15
lithofacies14
isotropic14
CCS14
teleseismic13
seawater13
geoelectrical13
hydromechanical12
hydrofacies12
sustainability9
hydrogeologic9
tomogram8
Table 4. Categories for classifying words.
First GroupSecond GroupThird Group
Generalpublicationgeneral informationgeneral technology
Specificdisastermineral resourceother
Table 5. Selection of co-occurrence results (created with NetMiner4).
SourceTargetWeightSourceTargetWeight
digitalgeology13mapDigital Elevation Model17
digitalmap20mapGeology26
digitalmodel15mapLandslide10
digitalseismic13mapmodel10
digitaltopography12mapsurface15
three dimensionsdataset11mapthree dimensions17
three dimensionsgeology186maptopography16
three dimensionsgeometry36geologycarbon11
three dimensionsimage19geologyCO212
three dimensionsmagnetic16geologygeochemistry20
three dimensionsmap20geologygeomorphology18
three dimensionsmodel428geologygeophysics90
three dimensionsreconstruction14geologyhydrology19
three dimensionsseismic106geologymap150
three dimensionssimulation15geologymodel267
three dimensionssurface15geologyseismic17
three dimensionsvisualization17geologysurface25
two dimensionsmodel23geologysystem13
two dimensionsseismic28geologytectonic16
two dimensionsthree dimensions61geologythree dimensions31
realCO22geophysicsdataset13
realdataset7geophysicsgeochemistry14
realgeology11geophysicsgeology35
realseismic3geophysicsimage11
realsystem2geophysicsmodel14
realthree dimensions4geothermalsystem22
real timeCO23groundwatermodel22
real timeearthquake5groundwatersystem16
real timegeochemistry2hydraulicconductivity31
real timeimage3hydrologymodel16
real timemap3hydrothermalsystem30
real timenetwork2seismicdataset18
real timeseismic11seismicgeology10
real timesurface4seismicimage22
real timesystem4seismicmodel25
artificialgroundwater3seismicnetwork21
artificialmodel2seismictomography21
artificialneural network12landslideinventory18
artificialsystem2landslidemap25
Artificial Intelligenceporosity3landslidemodel13
deep learningmodel2magmasystem11
neural networkgeographic2volcanosystem15
neural networkmodel6Marsimage2
earthquakemodel11Marslandslide3
networkDigital Elevation Model2Marsorbiter24
networkearthquake4Marssurface7
networkgeology2Marsterrain4
networkgeometry4Marsvolcano2
networkhigh resolution2planetDigital Terrain Model2
networkmodel7planetimage2
networkseismic3planetMars2
networktopology2planetmodel2
high resolutionDigital Elevation Model23planetsurface9
high resolutionimage29satelliteaerial2
high resolutionseismic26satelliteGNSS5
high resolutionthree dimensions13satelliteimage6
imageDigital Elevation Model16satellitemagnetic2
imagegeology21satelliteradar2
imageMars15satelliteremote sensing2
imagesurface12satellitesystem9
imagesystem15satelliteterrain2
Table 6. Degree-centrality results (created with NetMiner4).
WordIn-Degree CentralityOut-Degree Centrality
model0.469 0.429
geology0.374 0.340
map0.320 0.238
image0.286 0.245
system0.259 0.177
surface0.238 0.231
three dimensions0.190 0.374
dataset0.184 0.102
seismic0.184 0.177
topography0.143 0.129
Digital Elevation Model0.122 0.116
terrain0.122 0.082
volcano0.109 0.136
geophysics0.102 0.143
high resolution0.102 0.177
simulation0.102 0.061
geometry0.095 0.102
groundwater0.095 0.041
landslide0.095 0.082
database0.088 0.054
magnetic0.088 0.061
earthquake0.082 0.095
CO20.075 0.048
network0.075 0.054
two dimensions0.075 0.095
digital0.068 0.143
geochemistry0.068 0.061
Digital Terrain Model0.061 0.061
Mars0.061 0.041
omission
real0.034 0.041
real time0.034 0.061
omission
neural network0.014 0.014
omission
Artificial Intelligence0.000 0.007
deep learning0.000 0.007
omission
Table 7. Selection of co-occurrence results (created with VOSviewer).
ClusterWordsTotal Link StrengthOccurrencesLinks
1
(green)
anomaly774126206
crust659103176
3d model578100192
geological model558110179
gravity48382166
geophysical data43865175
3d geological model38669149
geological data32455143
gravity data28848123
mineral28259128
2
(red)
digital elevation model887143198
slope764117187
database629124184
accuracy600115185
terrain59393177
monitoring57686162
technology563102174
research554108192
ground52185177
hazard46071148
3
(blue)
reservoir1108168204
seismic data660105185
fluid64191179
migration63889180
pressure62493169
CO257777142
permeability53974151
aquifer52584155
processing47890177
storage39757149
4
(yellow)
fault1869272258
earthquake1102173186
deformation898127203
sequence737116217
magnitude675109196
velocity663100189
seismicity47267144
fault zone41754165
frequency38967167
slip38650136
5
(purple)
volcano53877168
morphology46682161
eruption36250117
erosion36159142
crater35851118
digital terrain model31658122
stratigraphy30546146
landform27942107
mars2574784
ice2333595
Table 8. Average silhouette coefficient of K-means clustering results.
Number of Clusters235101520
Average Silhouette
Coefficient
0.8960.8710.7320.7030.6300.597
Table 9. 10 Topic LDA results (created with NetMiner4).
1st Keyword2nd Keyword3rd Keyword4th Keyword5th KeywordNumber of Documents
Topic-1mapgeologylithologydatabasedataset166
Topic-2modelgroundwatersystemgeothermalthree dimensions154
Topic-3volcanomagneticmagmalavageology173
Topic-4CO2geologyporositycarbonatesystem125
Topic-5landslidemodelsystemglobaldatabase86
Topic-6seismicearthquakehydratenetworksystem172
Topic-7topographymapDigital Elevation Modelsurfaceterrain159
Topic-8three dimensionsseismicmodelgeologytectonic233
Topic-9imagesurfaceMarsresolutionsystem183
Topic-10modelgeologythree dimensionssimulationsurface251
Table 10. 15 Topic LDA results (created with NetMiner4).
1st Keyword2nd Keyword3rd Keyword4th Keyword5th KeywordNumber of
Documents
Topic-1systemreal timeglobaldatasetsensor65
Topic-2CO2porositygeologycarbonatesimulation94
Topic-3mapgeologylithologydatabasedigital140
Topic-4magneticgeologytectonicmodelgeophysics145
Topic-5modelgeologythree dimensionssimulationsurface175
Topic-6groundwatermodelaquiferhydrologyconductivity106
Topic-7seismicthree dimensionsgeologytomographyimage161
Topic-8earthquakemodelclusterseismicsimulation65
Topic-9volcanomagmahydratelavahydrothermal120
Topic-10topographysurfacemodelglacialelevation109
Topic-11seismicearthquakenetworkseismogenicgeology83
Topic-12landslidemodelfloodmapanisotropy65
Topic-13imagemapDigital Elevation Modeltopographysurface119
Topic-14imagesurfaceMarsresolutionDigital Terrain Model117
Topic-15three dimensionsmodelgeologygeometrygeothermal138
Disclaimer/Publisher’s Note: The statements, opinions and data contained in all publications are solely those of the individual author(s) and contributor(s) and not of MDPI and/or the editor(s). MDPI and/or the editor(s) disclaim responsibility for any injury to people or property resulting from any ideas, methods, instructions or products referred to in the content.

