1. Summary
Vestibular schwannomas are neurological tumors that account for about 5–8% of all intracranial tumors [
1]. The disease is usually diagnosed at the relatively young age of 50–60 years and the surgical removal of tumors can be complicated by meningitis, cerebellar injury, epilepsy, and persistent headaches [
2]. Due to the rarity and heterogeneity of this tumor, there is lack of data on the special molecular feature of vestibular schwannoma [
2], including data on vestibular schwannoma proteome.
The cerebrospinal fluid (CSF) contains various biomolecules, e.g., ctDNA, micro RNA, and proteins, which reflect the molecular landscape of the liquor [
3]. Of the variety of biological molecules, proteins represent the physical basis of the phenotype. CFS samples can be obtained via lumbar puncture or brain surgery. Thus, CSF represents an appealing source of potential protein biomarkers.
High throughput shotgun mass spectrometry, which has been rapidly developing in recent years, allows the identification of hundreds of proteins in one experiment [
4]. The understanding of proteome composition enables the shedding of light on biological processes associated with the neurological diseases [
5,
6]. In turn, targeted mass spectrometry, i.e., multiple reaction monitoring (MRM), is a highly sensitive, selective, and multiplex method for protein quantification in complex biological matrixes with potential to clinical application [
7,
8].
To date, most publications have considered schwannoma from a surgical point of view [
1,
9], while very little is known about the molecular, especially proteomic, features of the tumor. Only in the last 5 years, more than 300 articles that are devoted to the mass spectrometric study of CSF in the context of neurodegenerative diseases (e.g., Alzheimer’s disease) and other brain tumors (i.e., meningioma, glioblastoma, and astrocytoma) have been published (the PubMed database). In turn, there is a lack of proteomic data on tumor tissue or CSF derived from vestibular schwannoma patients. The current dataset describes the proteomic landscape associated with vestibular schwannoma.
We applied a shotgun and targeted mass spectrometric approach, i.e., MRM, to unveil the protein composition of CSF associated with vestibular schwannoma. The shotgun mass spectrometry allowed us to obtain a “snapshot” of the protein composition of the vestibular schwannoma-associated CSF proteome. The targeted method allows for the absolute quantification of CSF proteins using isotopically labeled peptide standards (SIS). The use of SIS standards confirms the correct identification of the proteins. In addition, the SIS/MRM is highly sensitive and allows the detection of proteins that could not be registered in a shotgun MS experiments. For MRM quantitative analysis, we used a previously developed panel that includes 148 stable isotopically labeled peptide standards (SIS). The natural counterparts of SIS standards originated from 111 proteins that are Food and Drug Administration (FDA)-approved for diagnostic use [
10].
To date, these vestibular schwannoma shotgun and targeted mass spectrometric datasets are unique. They demonstrate the proteomic features of this rare neurological tumor.
2. Data Description
We present two complementary mass spectrometry datasets obtained from CSF samples (N = 41) derived from patients with vestibular schwannoma.
The first dataset includes the results of protein identification and semi-quantitative characterization shotgun LC-MS/MS. The raw shotgun files and MaxQuant details data uploaded in the ProteomeXchange repository with the identifier PXD037746. The summary of a qualitative mass spectrometric experiment that encompasses 525 of the most confident proteins (identified by at least two peptides per protein with FDR < 1%) can be found in the
Supplementary Table S1.
The second dataset represents the MRM/SIS quantitative data obtained for analysis from the 148 peptides that are mapped on the 111 FDA-approved proteins [
10] in CSF samples derived from patients with vestibular schwannoma. The list of peptide transitions, retention times, and collision energies details can be found in the
Supplementary Table S2. The raw MRM files and Skyline-processed data were uploaded in the PASSEL repository with the identifier PASS04821.
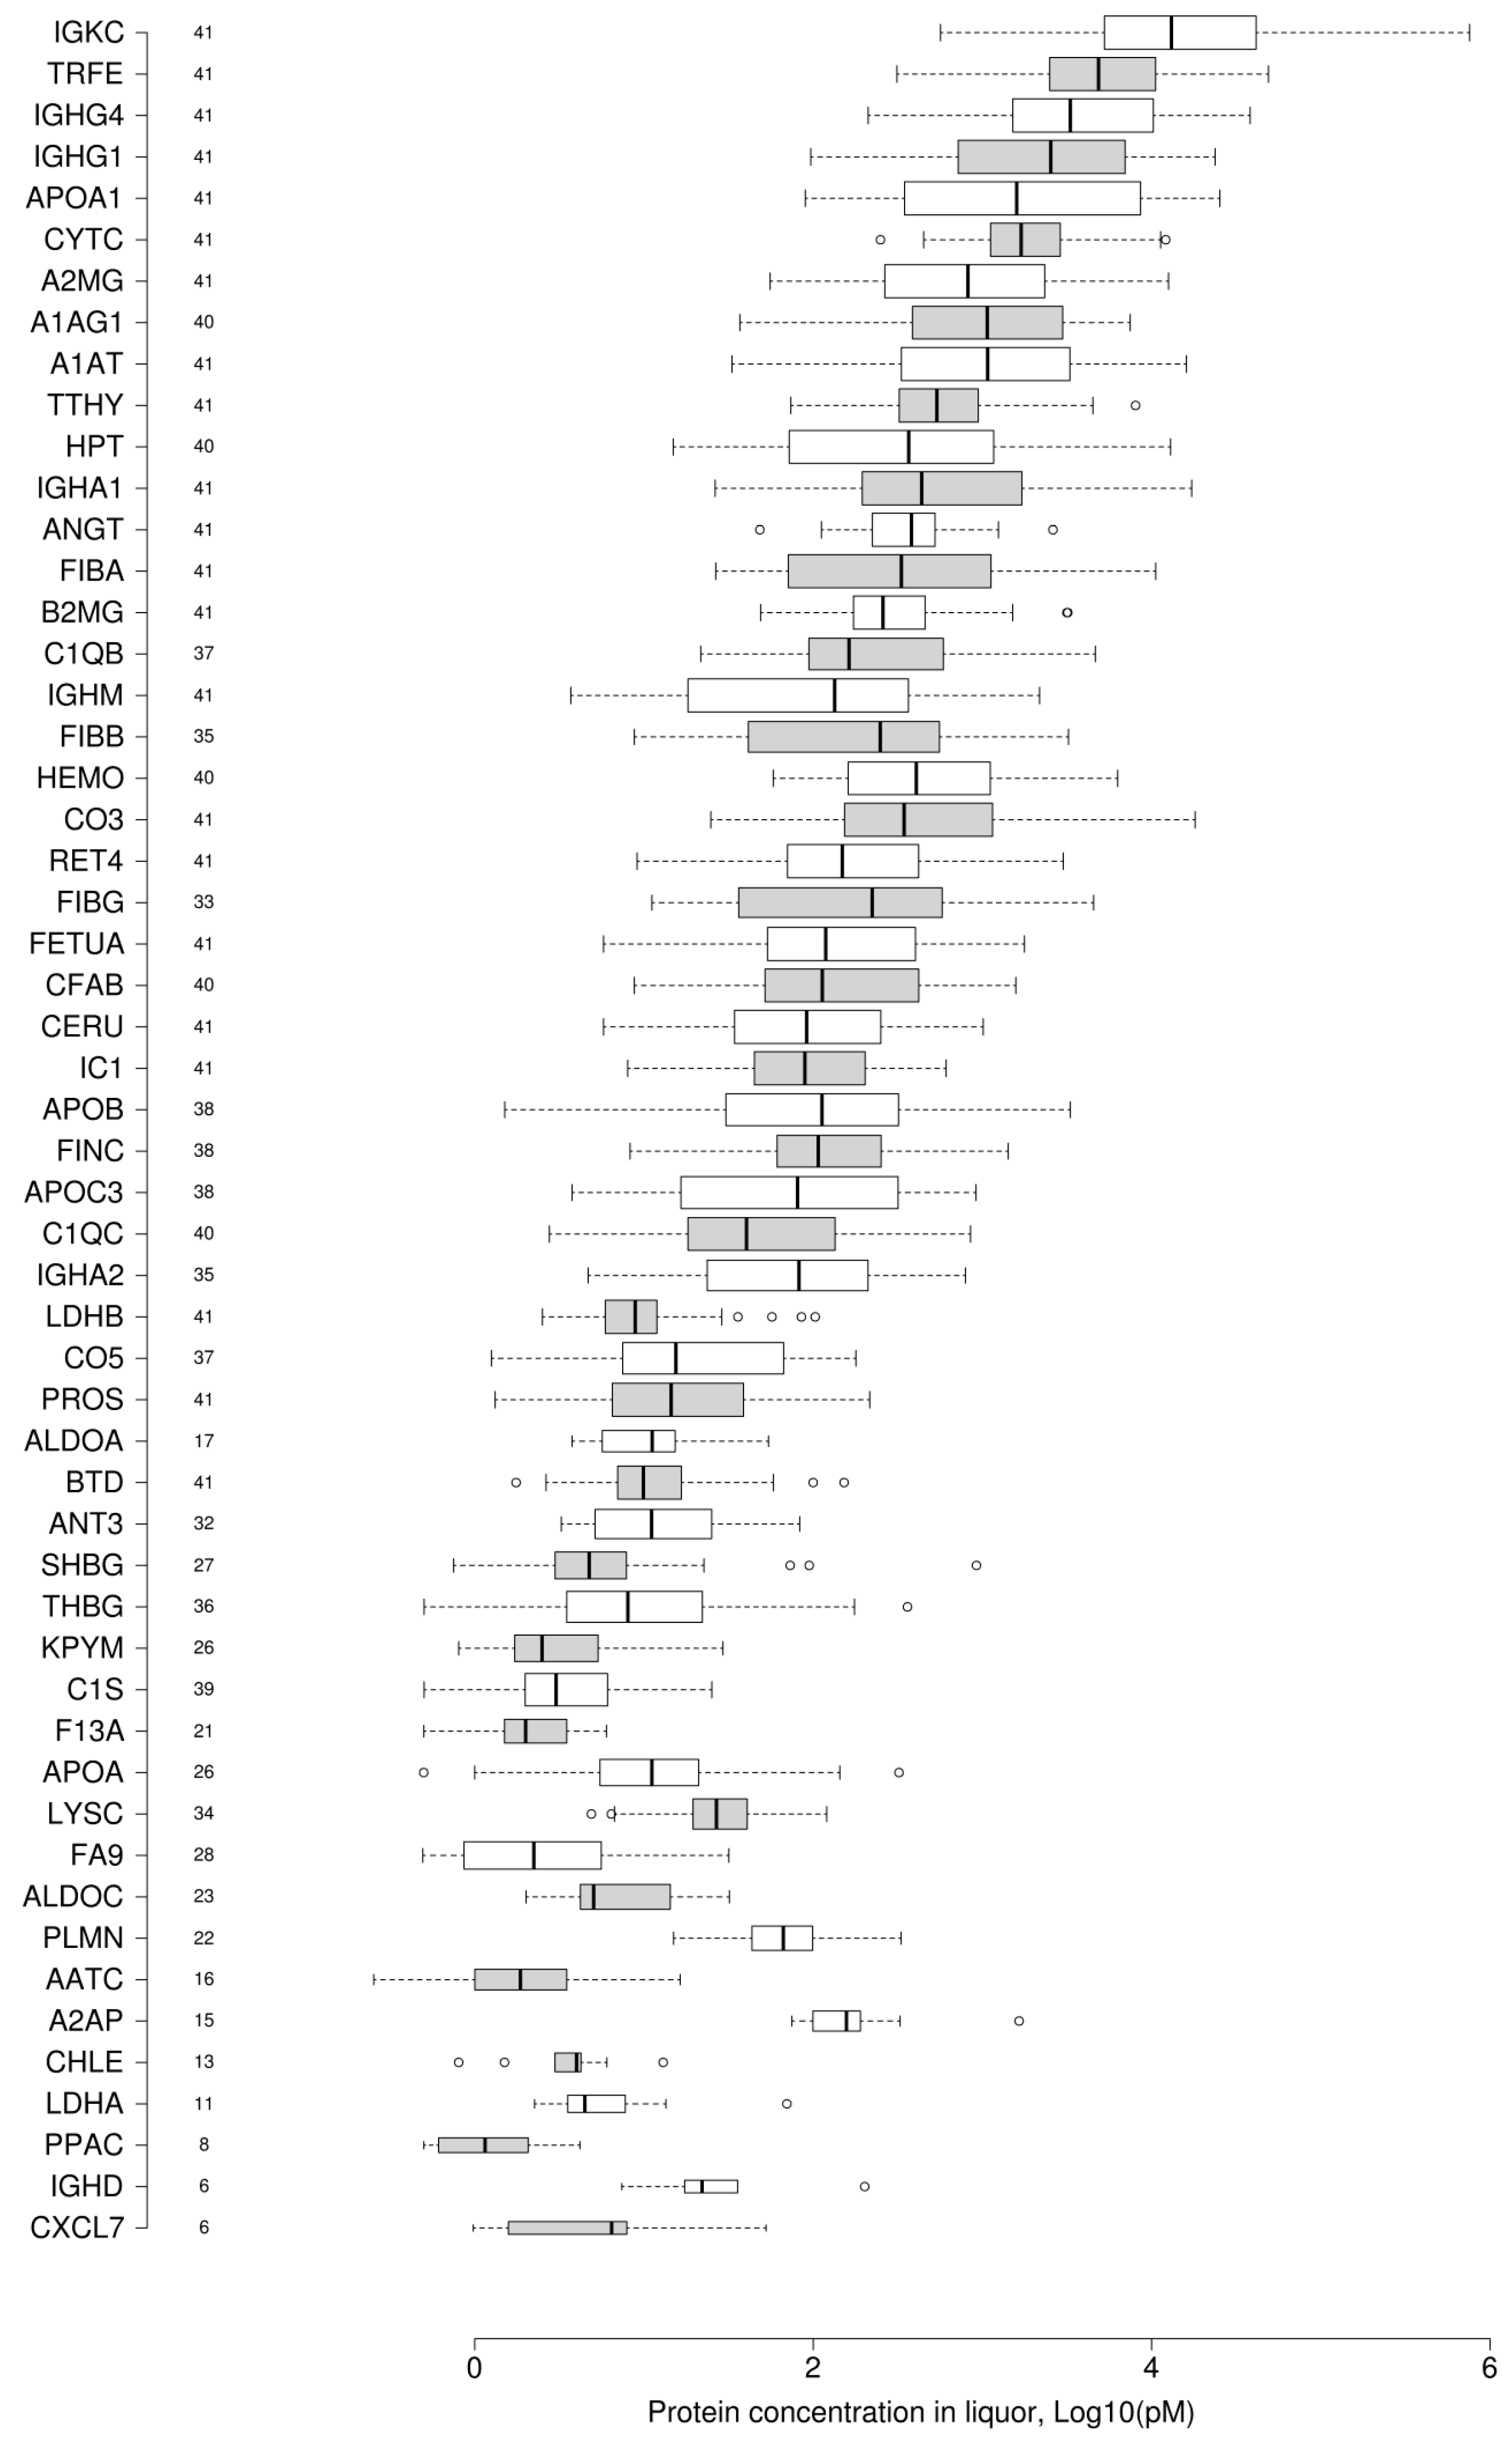
The absolute concentrations of unique peptides that are mapped onto 54 proteins are given in the
Supplementary Table S3. We obtained the dynamic range graph of 54 proteins of cerebrospinal fluid proteome measured by the MRM/SIS technique in at least five clinical samples (
Figure 1).
Figure 1 shows that the concentration of FDA-approved proteins span nearly six orders of magnitude, which is similar to the dynamic range of blood plasma [
11].
High-resolution mass spectrometric data are available via ProteomeXchange with the identifier PXD037746. MRM/SIS results are available via PASSEL with the identifier PASS04821. Access credentials are in the
Supplementary Table S4.
3. Methods
3.1. Sample Preparation Prior to Mass Spectrometric Analysis
Prior to tryptic digestion, all cerebrospinal fluid (liquor) samples were stored at −80 °C. The sample total protein concentration was determined using a Pierce™ BCA Protein Assay Kit (Pierce, Rockford, IL, USA). The liquor aliquots containing 100 μg of the total protein were used for in-solution tryptic digestion. Each liquor sample was subjected to disulfide bond reduction and alkylation in the presence of a 50 mM triethylammonium bicarbonate buffer (TEAB) (Sigma-Aldrich, St. Louis, MO, USA) (pH 8.5) containing 50 mM tris (2 carboxyethyl) phosphine (TCEP) (Thermo Fisher Scientific, Waltham, MA, USA), and 80 mM chloroacetamide (CAA) (Sigma-Aldrich, St. Louis, MO, USA) at 80 °C for 40 min. To dilute the reaction mixture and decrease the TCEP and CAA concentration, 100 μL of 50 mM TEAB (pH 8.5) was added to each sample. The sequencing grade modified porcine trypsin (Promega, Fitchburg, WI, USA) was added to the reaction mixture at an “enzyme:protein” ratio of 1:70 (w/w), followed by overnight incubation at 37 °C. The reaction was halted by adding formic acid (Sigma-Aldrich, St. Louis, MO, USA) to a final concentration of 5%. The peptide concentrations were assessed through a colorimetric method using a Pierce Quantitative Colorimetric Peptide Assay kit (Pierce, Rockford, IL, USA), in accordance with the manufacturer’s recommendations. Samples were evaporated using a SpeedVac vacuum concentrator (Thermo Fisher Scientific, Waltham, MA, USA) and resuspended in 0.1% FA solution to a final concentration of 2 μg/μL.
3.2. High-Resolution Mass Spectrometry for the Qualitative Analysis of Cerebrospinal Fluid (Liquor) Samples
Shotgun mass spectrometry was performed using UPLC nano Ultimate 3000 system (Thermo Fisher Scientific, Waltham, MA, USA), connected to Q Exactive HF-X Quadrupole-Orbitrap MS, and equipped with a nanoelectrospray ion source (Thermo Fisher Scientific, Waltham, MA, USA). The peptide samples were injected in 1 μL and loaded onto an analytical column RP-HPLC Zorbax 300SBC18 column (C18 3.5 µm, 75 µm inner diameter and 150 mm length, Agilent Technologies, Santa Clara, CA, USA) using a 98% solvent A (0.1% formic acid in HPLC grade H2O) and a 2% solvent B (80% HPLC grade acetonitrile, 0.1% formic acid in HPLC grade H2O) at a flow rate of 0.4 µL/min. The peptide separation was performed using a linear gradient of solvent B from 2 to 40% over 110 min at a flow rate of 0.4 µL/min.
Prior to the mass spectrometric experiment, standard mix Dionex™ Cytochrome C Digest (Thermo Fisher Scientific, Waltham, MA, USA) was used for the evaluation of LC-MS/MS performance. High-resolution tandem mass spectra were acquired using Orbitrap analyzer in the positive ion mode in a mass range of 375–1250 m/z. The resolution of 60,000 (at m/z = 400) and of 15,000 (at m/z = 400) were used for MS and MS/MS scans, respectively. The AGC target of 106 and 105 with maximum ion injection time 50 ms and 100 ms was applied at MS and MS/MS levels, respectively. The twenty most abundant precursors were selected for MS/MS spectra triggering based on a survey MS scan. The higher energy collisional dissociation (HCD) with normalized collision energy (NCE) of 29 was used. For MS/MS triggering, a signal threshold of 50,000 units was used with an m/z isolation window of 2. To increase MS/MS coverage, the dynamic exclusion mode was used with exclusion duration of 60 s. Singly charged ions and ions with undefined charge state were omitted from triggering the MS/MS scans.
Raw MS/MS data were loaded into MaxQuant software (version 1.6.3.4, Max Planck Institute of Biochemistry, Martinsried, Germany) and processed using built-in Andromeda algorithm [
12]. To identify proteins, a Homo Sapiens reference proteome provided by UniProt (UP000005640, UniProt Release 2022_02, 20,598 proteins, EMBL-EBI, Cambridge, Cambridgeshire, UK) as a FASTA file was applied. A decoy database and a database containing 245 of the most common contaminants (e.g., keratins, trypsin, albumin, etc.) were used alongside the target database. The false discovery rate (FDR) was calculated through the built-in algorithm based on the results of the identification against decoy database. The cut-off FDR of 0.01 was applied for both peptide and protein levels. The carbamidomethylation of cysteines was used as a fixed modification and protein N-terminal acetylation and the oxidation of methionine was also applied as a variable modification for the peptide search. The mass tolerance for MS and MS/MS spectra was set at 5 ppm and 20 ppm, respectively. A match between runs function was applied with a matching time window of 2 min and an alignment time window of 5 min. The product of protein-coding genes corresponding to the UniProt database reviewed entry was considered as an identified protein.
3.3. Solid Phase Synthesis of Stable Isotopically Labeled Peptide Standards (SIS)
The standard peptides were synthetized using the solid-phase technique on the Overture™Robotic Peptide Library Synthesizer (Protein Technologies, Manchester, UK), according to previously published protocols [
13]. The isotopically labeled amino acids lysine (13C6,15N2) or arginine (13C6,15N4) were incorporated into peptide chain instead of their unlabeled amino acid counterparts. The concentrations of SIS peptides were determined based on the acidic hydrolysis of peptides coupled with the fluorescent signal detection of amino acids, as described in a recent article [
14]. The stock solution, containing 500 fmol/μL of each of the 148 SIS peptides, was prepared. The SIS peptide mix was spiked into each sample of cerebrospinal fluid hydrolysate.
3.4. Alkaline Fractionation of Cerebrospinal Fluid (Liquor) Samples
To reduce the complexity of the matrix, the peptide fractionation in alkaline conditions was performed on an Agilent 1200 Series HPLC system, which was equipped with a degasser, dual pump, autosampler, UV-detector, fraction collector, and column compartment (all Agilent Technologies, Santa Clara, CA, USA). A total of 20 μL of digested liquor proteins containing 100 μg of peptides and SIS standards were loaded onto the analytical column C18- XBridge, Waters (4.6 × 250 mm, 5 µm pore size, Waters, Ireland) at a flow rate of 0.75 mL/min for 3 min in an isocratic mode of 98% solvent A (15 mM ammonia acetate in HPLC grade H2O, pH 9.0). The solvent B (80% HPLC grade acetonitrile, 15 mM ammonia acetate in HPLC grade H2O, pH 9.0) was applied to elute peptide fractions. The percentage of the solvent B was rapidly increased from 2 to 12% over 1 min, followed by the linear gradient from 12 to 40% of solvent B over 36 min, at a flow rate of 0.75 mL/min. As a result, five fractions were obtained, dried using a SpeedVac vacuum concentrator (Thermo Scientific, Waltham, MA, USA), and resuspended in 20 μL of 0.1% FA solution.
3.5. Scheduled Multiple Reaction Monitoring with Stable Isotopically Labeled Peptide Standards (MRM/SIS) for the Quantification Analysis of FDA-Approved Proteins in Cerebrospinal Fluid (Liquor) Samples
Scheduled MRM/SIS analysis was performed on Agilent 1200 series HPLC system (Agilent Technologies, Santa Clara, CA, USA) coupled with TSQ Quantiva triple quadrupole mass analyzer (Thermo Fisher Scientific, Waltham, MA, USA) equipped with an electrospray ionization (ESI) source operating in micro flow mode. A total of 5 microliters of each sample were loaded into the ZORBAX SB-C18 analytical column (150 × 0.5 mm, 5 μm particle diameter) (Agilent Technologies, Santa Clara, CA, USA) at a flow rate of 20 µL/min for 5 min in an isocratic mode of 95% solvent A (0.1% formic acid in HPLC grade H2O) and 5% solvent B (0.1% formic acid and 80% acetonitrile in HPLC grade H2O). The peptides were eluted in linear gradient of solvent B (from 5 to 50%) for 30 min at 20 µL/min flow rate. Next, the content of solvent B was increased to 99% for 1 min, followed by washing with 99% of solvent B for 5 min at 20 µL/min and equilibrating in the initial gradient conditions (5% of solvent B) for 9 min at 20 µL/min.
The MS system operated in positive ionization mode, using the following settings of the ESI source: the capillary voltage 4000 V was set, the velocity of the drying gas (nitrogen) of 7 L/min was used, and the velocity of the axillary gas (nitrogen) of 5 L/min and the capillary temperature was 300 °C were applied. The MS system operated in scheduled MRM mode with a retention time window of 2.3 min for each precursor ion. The isolation window of 0.7 Da was set for the first and third quadrupole. The scan cycle time of 1.2 s with dynamic dwell time, depending on the number of concurrent transitions, was used. The collision gas (argon) pressure in the second quadrupole of 1.5 mTorr was applied. The transitions and normalized collision energy values (V) are listed in the
Supplementary Table S3.
The MRM/SIS analysis was processed using Skyline (v. 4.1.0, University of Washington, Seattle, WA, USA) software. The peak area ratio for the endogenous peptide and the SIS counterpart was automatically calculated in Skyline. To obtain the protein abundance data, the Skyline results of the endogenous peptide/SIS ratio was extracted as an Excel table and the ratio values were multiplied by the known content of each SIS standard. The resulting value was expressed in the fmol of the target protein per μg of total protein. Next, the protein concentration was recalculated and expressed in pM. When two peptides per protein were MRM analyzed, the best flying peptide was selected for the calculation of protein concentration. For dynamic range visualization, the proteins that were detected in at least five liquor samples used. The protein concentrations were converted into a Log10 scale and box plots were generated using BoxPlotR (
http://shiny.chemgrid.org/boxplotr/) (accessed on 3 November 2022) [
15]. An analysis for determining the enrichment of proteins uniquely identified in CSF samples compared to blood plasma was performed using the Enrichr module of the GSEApy bioinformatics tool (v. 1.0.4) across the categories of the ARCHS4 and ProteomicsDB libraries; the
p-value cutoff was <0.05. The ten most significant categories were visualized.
4. User Notes
The shotgun MS data encompass 525 highly confident proteins of CSF identified by at least two peptides per protein with FDR < 1%. This dataset shows the proteomic landscape that is associated with the rare tumor vestibular schwannoma. The data on the concentration of 54 proteins, measured by the MRM/SIS technique, reflects the dynamic range of the CSF proteome and may be used for the quantitative extrapolation of proteins identified through shotgun MS.
The presented proteomic dataset contains proteins that are found in plasma (e.g., albumin, immunoglobulins, etc.). The CSF is formed when blood plasma is filtered through the blood capillary walls in the choroid plexuses of the ventricles of the brain, followed by the secretion of various substances into it by neurosecretory and ependymal cells [
16]. Thus, the CSF proteome reflects the qualitative protein composition of blood plasma and also includes proteins associated with brain tissue. According to bioinformatics analysis, 185 of 525 (35%) identified proteins are annotated as associated with brain tissue (
Table S1).
Moreover, we overlapped the CSF proteomic dataset with the data on the blood plasma proteome stored in the Peptide Atlas and Human Proteome Atlas databases (
Figure 2). According to above databases, over 4000 blood plasma proteins were identified in 240 MS-based experiments on healthy individuals and patients with various diseases carried out by various scientific groups across the world [
17].
Figure 2a shows that 465 proteins detected in the CSF samples overlapped between human plasma (HPL) and cerebrospinal fluid (CSF) proteomes. Among them, 133 proteins (29%) were annotated as associated with brain tissue. At the same time, 60 proteins were identified as unique for CSF samples compared to HPL. We performed the over-representation analysis of these proteins against ARCHS4 and ProteomicsDB libraries, which contain data on protein-coding gene tissue expression.
Figure 2b shows strong enrichment via brain-associated categories. Twenty three proteins (C1QB, SPTBN4, CNTNAP2, PCSK1, PIANP, MOG, OMG, GPR37L1, CARTPT, SORCS3 MT3, TUBB2B, CALB1, NOV, FABP7, PLP1, SPOCK1, GPR158, VSTM2B, GRIA4, CCK, HIST1H2BC, and HSPA1B) that were annotated as brain-specific and identified in CSF samples only represent unique liquor proteomic signature. The components of the signature could have diagnostic and prognostic potential for vestibular schwannoma patients.
Moreover, we compared the quantitative data on 54 proteins measured by MRM/SIS in the current study and the spectral counts mass spectrometric data available in Peptide Atlas and Human Proteome Atlas databases (Human Plasma 2021-07 dataset) (
Figure 3). We also compared the relative abundance of each protein on the scale of the subproteome (52 common proteins) in each type of sample (HPL and CSF).
Figure 3 demonstrates the two to four orders of magnitude of difference in the abundance of 52 common proteins between CSF and HPL, which is in agreement with the literature data [
18]. The protein abundance measured in CSF and HPL are moderately correlated (r
2 = 0.6). The relative content reflects the fact that, despite the close biological association between blood plasma and CSF, certain proteins, e.g., cystatin-C (CST3) and serotransferrin (TF), that have relatively low abundance of HPL, in contrast, have a high abundance of CSF (
Figure 4) and are probably important for biological functions.
Cystatin C is a cysteine protease inhibitor that is involved in protein degradation and is secreted by choroid plexus cells into the CSF [
19]. Transferrins are produced by the liver and by the choroid plexus. This protein transports iron, which is crucial for myelination and neurotransmission [
20].
Sample fractionation allows the increase in proteome coverage and sensitivity of MS analysis. At the same time, the number of analyzed samples increases significantly. To reduce the time of analysis, we applied the single shot approach (one injection per sample) that has been shown to be effective [
21]. Operations in this mode may increase measurement errors. However, in our previous MRM/SIS experiments, which were carried out in three technical replicates, it was shown that the coefficient of variation does not exceed 5% for most of the measurements [
10]. Moreover, for the three samples in this study, an additional MRM/SIS analysis was carried out in three technical replicates (
Figure S1). Technical replicates correlated well with each other, and for most measurements (85%) in the three replicates, the coefficient of variation did not exceed 20%.
It also should be mentioned that the CSF samples were derived during an invasive medical procedure, i.e., the surgical resection of tumor, implicating inevitable bleeding, which may cause minor contamination via blood proteins. This may affect the accuracy of quantitative measurements and lead to a large scatter in the data.
The current data could be reused for the development of an absolute quantitative assay for the desired CSF proteins detected in shotgun analysis. In the future, the MRM/SIS data could be compared to normal human liquor to find and validate vestibular schwannoma protein biomarkers.


