
Data Balancing Techniques for Predicting Student Dropout Using Machine Learning

Department of Information and Communication Sciences and Engineering, The Nelson Mandela African Institution of Science and Technology, Arusha P.O. Box 447, Tanzania
Data 2023, 8(3), 49; https://doi.org/10.3390/data8030049
Submission received: 28 January 2023
/
Revised: 19 February 2023
/
Accepted: 21 February 2023
/
Published: 27 February 2023
(This article belongs to the Special Issue Data Mining and Computational Intelligence for E-learning and Education)
Abstract
:Predicting student dropout is a challenging problem in the education sector. This is due to an imbalance in student dropout data, mainly because the number of registered students is always higher than the number of dropout students. Developing a model without taking the data imbalance issue into account may lead to an ungeneralized model. In this study, different data balancing techniques were applied to improve prediction accuracy in the minority class while maintaining a satisfactory overall classification performance. Random Over Sampling, Random Under Sampling, Synthetic Minority Over Sampling, SMOTE with Edited Nearest Neighbor and SMOTE with Tomek links were tested, along with three popular classification models: Logistic Regression, Random Forest, and Multi-Layer Perceptron. Publicly accessible datasets from Tanzania and India were used to evaluate the effectiveness of balancing techniques and prediction models. The results indicate that SMOTE with Edited Nearest Neighbor achieved the best classification performance on the 10-fold holdout sample. Furthermore, Logistic Regression correctly classified the largest number of dropout students (57348 for the Uwezo dataset and 13430 for the India dataset) using the confusion matrix as the evaluation matrix. The applications of these models allow for the precise prediction of at-risk students and the reduction of dropout rates.
1. Introduction
This paper presents a novel approach for predicting student dropout using machine learning (ML) methods and data balancing techniques. The proposed method has been tested on real-world datasets collected from Tanzania and India. Additionally, this paper provides a unique contribution by suggesting the use of data balancing techniques to improve the accuracy of machine learning models for student dropout prediction. This research can contribute to environmental sustainability by providing better education planning and policymaking. It can also help in understanding the impact of climate change on student dropout by providing better predictions of the risk factors associated with it, by taking into consideration supervised learning applications. The majority of supervised learning applications face the problem of classifying unbalanced datasets, where one class is underrepresented relative to another [1,2,3,4,5,6,7,8]. This problem is common in the real-world applications of telecommunications, the web, finance, ecology, biology, medicine, etc., with a negative impact on the classification performance of machine learning models [2,9,10]. In the context of education, the classification of an imbalance problem occurs in the field of student dropout because the number of students enrolled is higher than the number of dropouts [11,12]. Student dropout is one of the challenges facing several schools in developing countries [13,14]. It is more common in girls than boys, and in lower secondary schools as compared to higher levels [15]. According to [16], the imbalance ratio is around 1:10, and, in most cases, the minority class usually represents the target group [2]. Regarding improving the predictive accuracy of the minority class as one of the greatest learning interests, many researchers have focused on developing solutions for the problem of class imbalance. The data sampling technique among the developed solutions aims to balance data before model development [17]. It consists of undersampling techniques i.e., Random Under Sampling (RUS), oversampling techniques i.e., Random Over Sampling (ROS) together with Synthetic Minority Over Sampling Technique (SMOTE) and it also includes hybrid techniques i.e., Synthetic Minority Over Sampling Technique with Edited NearestNeighbor (SMOTE ENN) and Synthetic Minority Over Sampling Technique with Tomek links (SMOTE TOMEK). RUS is a non-heuristic technique that selects a subset of the majority class to create a balanced class distribution [18]. In this technique, examples are randomly selected from the majority class for exclusion, with no replacement until the outstanding number of examples is thoroughly combined with that of the minority class. The main advantage of this technique, especially in Big Data, is the reduction in execution cost due to the decrease in data size caused by removing some examples. However, by excluding certain examples from the majority class, potential information may be lost that could have an impact on the learning process. On the contrary, the ROS technique is more commonly used than the RUS technique since undersampling tends to eliminate important information from the data. ROS tends to randomly balance the distribution of data up until the number of chosen examples, plus the original examples of the minority class is roughly equal to that of the majority class [19]. Despite its ability to balance class distribution, ROS tends to cause overfitting problems. On the other hand, SMOTE emphasizes the creation of examples of synthetic minorities for inclusion in the original dataset [12]. This technique forms new examples of minority classes by combining several examples of minority classes [20]. SMOTE has become the most frequently used technique, but the limitation of this technique, similar to ROS, is to assume equal importance for all minority instances. SMOTE TOMEK hybrid technique combines both SMOTE and Tomek links. Tomek links were proposed to be applied in an oversampled training set as a data cleaning technique in order to come up with a better defined class cluster [21]. This technique tends to delete examples that form Tomek links between the two classes. In the meantime, SMOTE ENN combines SMOTE and Edited Nearest Neighbor (ENN) [22]. The motive behind this technique is similar to that of SMOTE TOMEK; however, ENN is used to expel examples from both classes, so any example that has been misclassified by its three nearest neighbors is removed from the training set. This technique should help to further clean up the data, as ENN tends to eliminate more examples than Tomek links. Apart from data sampling techniques, data imbalance can also be handled by using algorithmic modification techniques that focus on changing the learning algorithm to adapt the imbalance data settings [18] and cost-sensitive learning techniques that focus on minimizing costs associated with the learning process [23]. While there are several approaches to dealing with imbalanced datasets, data sampling techniques are simple to use to deal with the problem of class imbalance [12].
In addressing the problem of student dropout, different machine learning models such as Multi-Layer Perceptron (MLP), Random Forest (RF), and Logistic Regression (LR) have been used [24,25,26,27,28,29,30,31,32,33,34,35,36,37,38,39,40,41,42]. MLP is an Artificial Neural Networks (ANN) that consists of an input layer, one or more hidden layers, and an output layer [43,44,45]. This model is commonly used for classification problems because of its low complexity and ability to produce an appropriate outcome for nonlinear relationships [46,47]. The model is a feed-forward artificial neural network classifier with forward connections, and every perceptron is connected to all the perceptrons in the next layer except the output layer that directly gives the result [48].
On the other hand, RF is an ensemble classification model that is made up of several randomized decision trees [49,50,51,52,53]. It is a widely used overall model because of its efficient implementation and its ability to reduce overfitting [54,55,56,57,58]. The performance of the RF model is determined by the tuning of its parameters and the feature selection [59]. This model is a non-parametric tree model, which is somewhat required when dealing with high-dimensional datasets [60]. Since RF is based on the definition of several independent trees, it is straightforward to obtain a parallel and faster application of the RF method, in which many trees are built in parallel on different cores [61]. As well, LR is among the classification approaches used to model the probability of discrete (binary or multinomial) outcomes [62]. This model works very similarly to linear regression by analyzing the relationship between multiple independent variables and a categorical dependent variable and calculating the probability of the existence of an event by fitting data to a logistic curve [63,64].There are two kinds of logistic regression: binary logistic regression (as in the present study) and multinomial logistic regression [64,65]. Despite the ability of these models (MLP, RF and LR) to predict student dropout problems, data imbalance was ignored in many studies and needs to be addressed in order to improve the predictive results of machine learning models.
For the evaluation of the performance of machine models, one of the key factors guiding the algorithmic modeling is the evaluation criteria. Accuracy as a statistical measure to quantify the level of accuracy has been used as a common metric by many researchers [66,67]. However, in the imbalanced data domain, this metric is no longer an appropriate measure, for it has less effect on the minority class than the majority class, and combined with the fact that it cannot distinguish between the magnitude of errors. In the context of imbalanced datasets, standard measures using particular measures are used to account for class distribution. The confusion matrix saves the results for examples correctly and incorrectly recognized by each class in a binary class problem [68]. This matrix is an important tool for assessing prediction results in a way that is very easy to understand [69]. In addition, the Geometric Mean (Gm) of actual rates measures the capacity of the model to balance sensitivity (TPrate) and specificity (TNrate) [1]. Gm is at a maximum when TPrate and TNrate are equal. F-measure (Fm) is a harmonic mean of precision and recall [66]. This metric ensures the TPrate changes more in the positive predictive value (precision) than in the True Positive rate (TPrate). A high value of Fm shows that both precision and recall are sensibly high. On acquiring the highest TPrate without excessively minimizing the TNrate, the Adjusted Geometric Mean (AGm) was introduced [2]. Despite the ability of these metrics to evaluate the performance of the machine learning models, other studies have reported their limitations in terms of the effects on the minority classes in the imbalance datasets [2,70,71]; hence, the application of several metrics is highly recommended when evaluating the performance of the machine learning models.
Therefore, this paper presents several data balancing techniques for predicting student dropout using datasets from developing countries. The research problem is to identify how to effectively use machine learning models for predicting student dropout when the dataset is imbalanced. The objective of the paper is to explore the use of various data balancing techniques to improve the accuracy of machine learning models for predicting student dropout. The novelty of the paper lies in its comparison of the performance of different data balancing techniques to address the issue of imbalanced datasets.
The next section presents related works that applied data balancing techniques to addressing the problem of student dropout. Section 3 introduces the materials and methods used to conduct this study. The results are presented and discussed in Section 4. Finally, the article presents the conclusion and prospective future directions in Section 5.
2. Literature Review
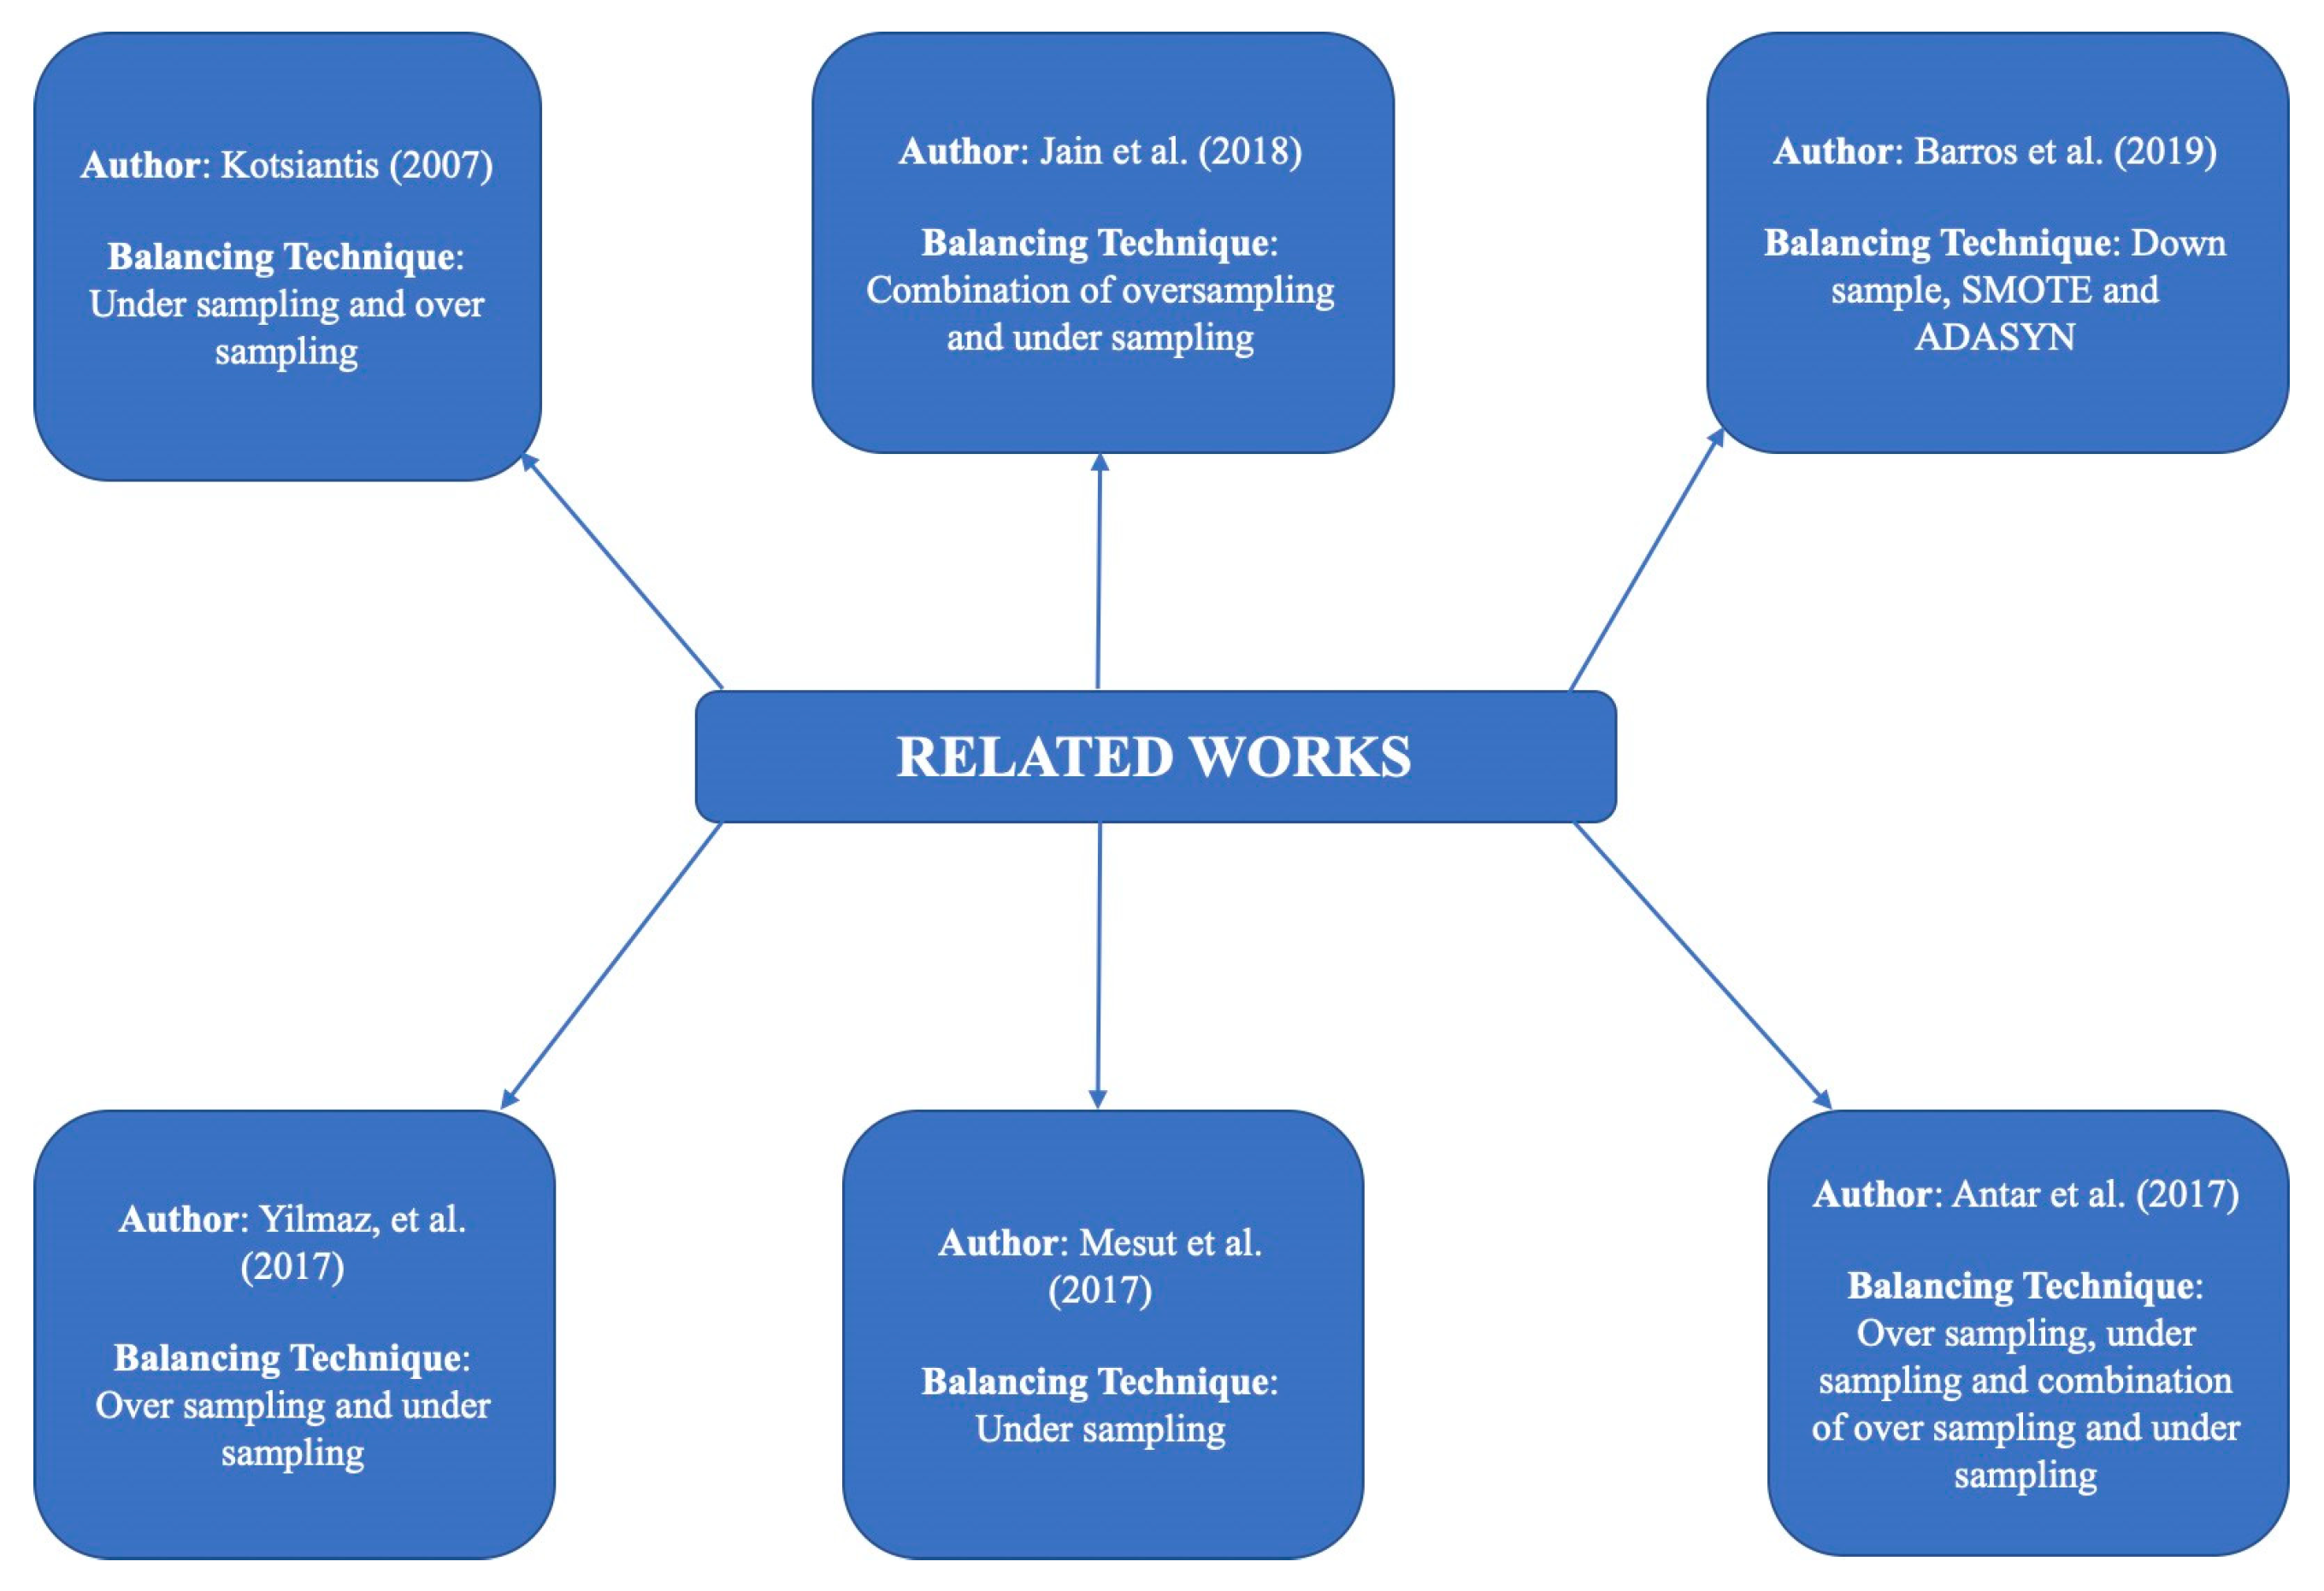
The use of data balancing techniques to predict student dropout using machine learning has been applied in several studies, as summarized in Figure 1. A study by [11] used machine learning to predict student dropout and academic success. The study used a dataset to build machine learning models for predicting academic performance and dropout. Imbalanced data were identified, and different techniques for handling this problem were proposed, such as data-level techniques including Synthetic Minority Over Sampling Technique (SMOTE) and Adaptive Synthetic Sampling Approach (ADASYN), or algorithm-level techniques including Balanced Random Forest and SMOTE-Bagging. Another study by [72] used data balancing techniques to predict student dropout at a university in Turkey. A dataset of 1510 student records was used, and different classifiers such as decision trees and support vector machines were applied. Data balancing techniques such as oversampling and undersampling were used to improve the accuracy of the models. The results showed that the use of data balancing techniques improved the accuracy of the models and reduced the bias in the data.
A study by [73] used machine learning and applied data balancing techniques to predict student dropout. The study used an unbalanced dataset from a real university and applied an undersampling technique to balance it. The study used a decision tree algorithm to predict student dropout and obtain an accuracy of 83.2%.
Another study by [74] used machine learning and applied data balancing techniques to predict student dropout. The study used a dataset of student records collected from a university and applied oversampling, undersampling, and a combination of both techniques to balance it. The study applied a Random Forest algorithm to predict student dropout and obtain an accuracy of 81.2%.
A study by [75] used machine learning and applied data balancing techniques to predict student dropout. The study used an imbalanced dataset from a university and applied a combination of oversampling and undersampling techniques to balance it. The study used a decision tree algorithm to predict student dropout and obtain an accuracy of 85.3%.
One study by [76] developed predictive models for imbalanced data. The study applied data mining techniques to forecast dropout rates. The study used a decision tree, neural networks, and balanced bagging. Classifiers were tested with and without the use of data balancing techniques, including downsample, SMOTE, and ADASYN data balancing. The results showed that the geometric mean and UAR provide reliable results when predicting dropout rates using balanced bagging classification techniques. Finally, a study by [77] applied data balancing techniques to predict student dropout using machine learning. The study used a dataset of 3420 student records from a university in Greece. A variety of classification algorithms were tested, including Naïve Bayes, C4.5, and Support Vector Machines. Furthermore, data balancing techniques such as undersampling and oversampling were applied to remove the bias and improve the accuracy of the models. The results showed that the use of data balancing techniques improved the accuracy of the models for predicting student dropout.
Despite the fact that many studies applied data balancing techniques to addressing the problem of student dropout, many of them were carried out in developed countries using developed countries’ datasets.
3. Materials and Methods
3.1. Dataset
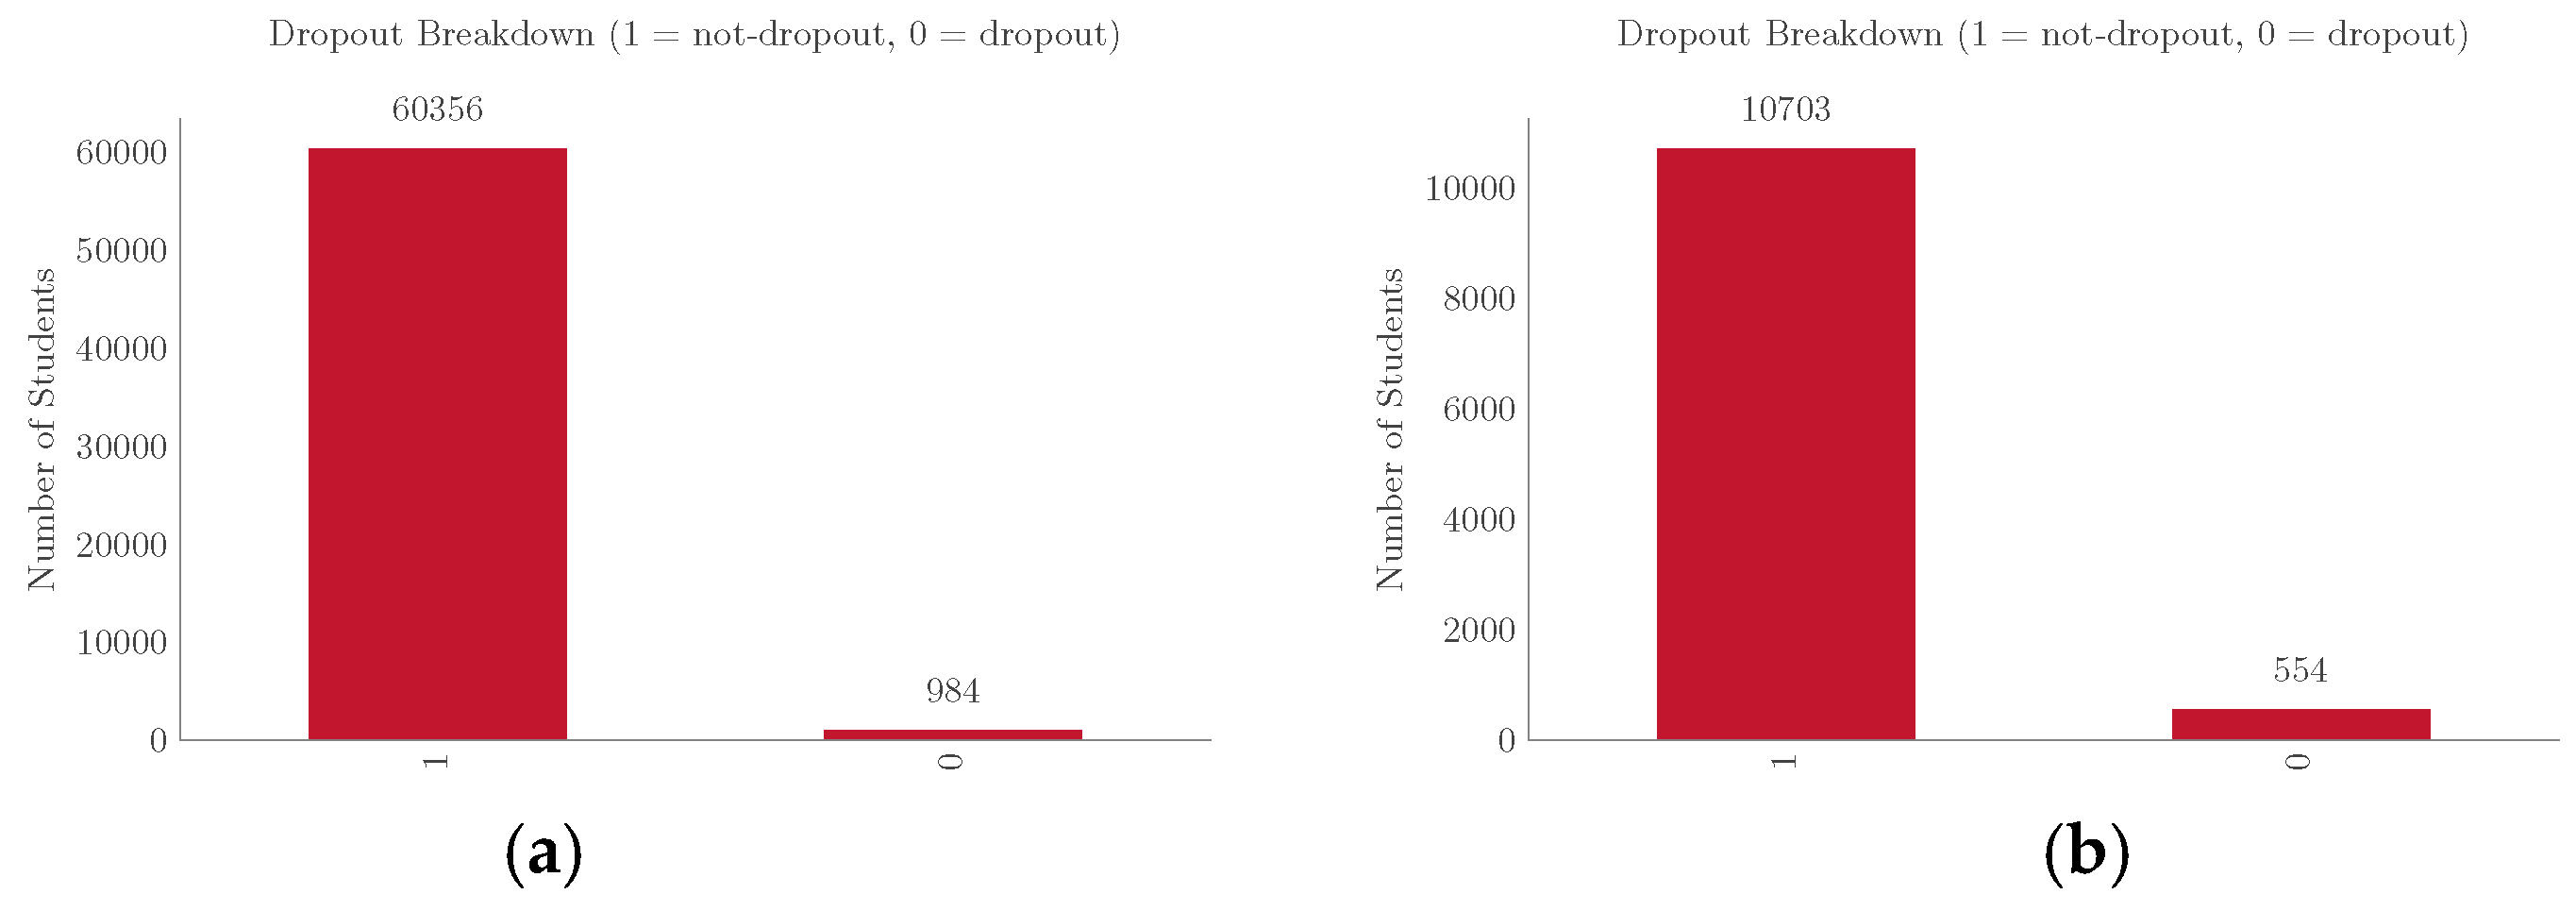
To address student dropout, this study used two publicly available datasets from developing countries. The first dataset was Uwezo data 1 on learning at the country level in Tanzania, which was collected in 2015 with the objective of assessing children’s learning levels across hundreds of thousands of households. The second dataset was collected in 2016 with the aim of assessing student dropout in India 2. The Uwezo dataset consisted of 61,340 samples, of which 98.4% were retained and 1.6% were dropouts, and the India dataset consisted of 11,257 samples, of which 95.1% were retained and 4.9% were dropouts. Therefore, these two datasets were highly imbalanced, as presented in Figure 2a,b, respectively.
The Uwezo dataset consisted of 18 variables: Main source of household income (Income), Boy’s Pupil Latrines Ratio (BPLR), School has a privacy room for girls (SGR), Region, District, Village, Student gender (Sex), Parent check child’s exercise book once a week (PCCB), Household meals per day (MLPD), Student read a book with his/her parent last week (SPB), Parent discuss child’s progress last term with the teacher (PTD), Student age (Age), Enumeration Area type (EA area), Household size (HH size), Girl’s Pupil Latrines Ratio (GPLR), Parent Teacher Meeting Ratio (PTMR), Pupil Classroom Ratio (PCR), Pupil Teacher Ratio (PTR) and Dropout. India dataset consisted of variables: Continue drop, Student id, Gender, Caste, Mathematics marks, English marks, Science marks, Science teacher, Languages teacher, Guardian, Internet, School id, Total students, Total toilets, and Establishment year.
3.2. Data Pre-Processing
Data from the two datasets were pre-processed prior to obtaining a final training set. This process was carried out as a precautionary measure to ensure that datasets are properly cleaned and accurate prior to model development. The data clean-up was carried out by removing information that could reveal the identity of individuals to the end-user. Missing values were replaced with medians and zeroes. The following variables were identified with missed values: Pupil Teacher Ratio (PTR), Pupil Classroom Ratio (PCR), Girl’s Pupil Latrines Ratio (GPLR), Boy’s Pupil Latrines Ratio (BPLR), Parent Teacher Meeting Ratio (PTMR), Main source of household income (Income), and Enumeration Area type (EA area).
Parent who checks his/her child’s exercise book once a week (PCCB), Parent who discusses his/her child’s progress last term with the teacher (PTD), Student who read a book with his/her parent last week (SPB), School has a privacy room for girls (SGR), Household meals per day (MLPD). On handling missing values, PTR, PCR, GPLR, and BPLR were imputed with medians, and PTMR, Income, EA area, PCCB, PTD, SPB, SGR, and MLPD were imputed with zeros. In addition, data samples with nominal variables were converted to numerical values to comply with Scikit-learn.
3.3. Data Sampling Techniques
Five data balancing techniques were employed to address the issue of data imbalance in the datasets. These techniques were employed before model development due to their ability to provide in-depth data cleaning, produce straight-forward and satisfactory results when handling data imbalance, address the overfit problem, and reduce running time and cost. RUS, ROS, SMOTE, SMOTE ENN, and SMOTE TOMEK have been implemented. RUS was performed by randomly selecting examples from the majority class for exclusion with no replacement until the outstanding number of examples were thoroughly combined with those of the minority class. This approach was chosen due to its ability to reduce the cost of execution by decreasing the size of the data through the removal of a few examples. ROS was performed by randomly balancing the distribution of data over the application of minority data duplication up to when the number of chosen examples plus the original examples of the minority class was roughly equal to that of the majority class. This approach was chosen based on its ability to not eliminate important information from the data. SMOTE was selected to form new minority class examples by incorporating several minority class examples. Furthermore, SMOTE TOMEK was selected to remove examples that form Tomek links from both classes, and SMOTE ENN was selected to expel examples from both classes; therefore, any example that has been misclassified by its three nearest neighbors was removed from the training set. This technique was anticipated to give more in-depth data cleaning, as ENN tends to eliminate more examples than Tomek links.
3.4. Classification Models
Three popular classification models: Logistic Regression (LR), Random Forest (RF), and Multi-Layer Perceptron (MLP) were assessed on a set of supervised classification datasets in order to see which model would perform better with consideration of the data imbalance problem. The selection of the three models took into consideration the supervised learning approach, particularly with respect to the classification problem. These models were selected because they were able to give satisfactory results on the prediction of student dropout. LR was selected to represent the linear model and was used to model the probability of binary outcomes (dropout/not dropout). In addition, RF represented an ensemble model and was chosen to reduce the overfitting problem and handle high-dimensional data. The MLP, on the other hand, represented an artificial neural network and was selected to reduce complexity.
3.5. Evaluation Metrics
To assess the performance of classification models, three popular metrics were used: Geometric Mean (Gm), F-measure (Fm), and Adjacent Geometric Mean (AGm). Furthermore, a confusion matrix was used to determine the best model based on the actual number of samples correctly and improperly classified. These metrics were chosen with an emphasis on the imbalance domain and as a standard measure in class distribution. Gm was selected to measure the ability of the model to balance TPrate and TNrate. Fm was selected to measure the harmonic means of TPrate and precision, whereas AGm was selected to measure the increase of TPrate rates without decreasing TNrate.
3.6. Experimental Design
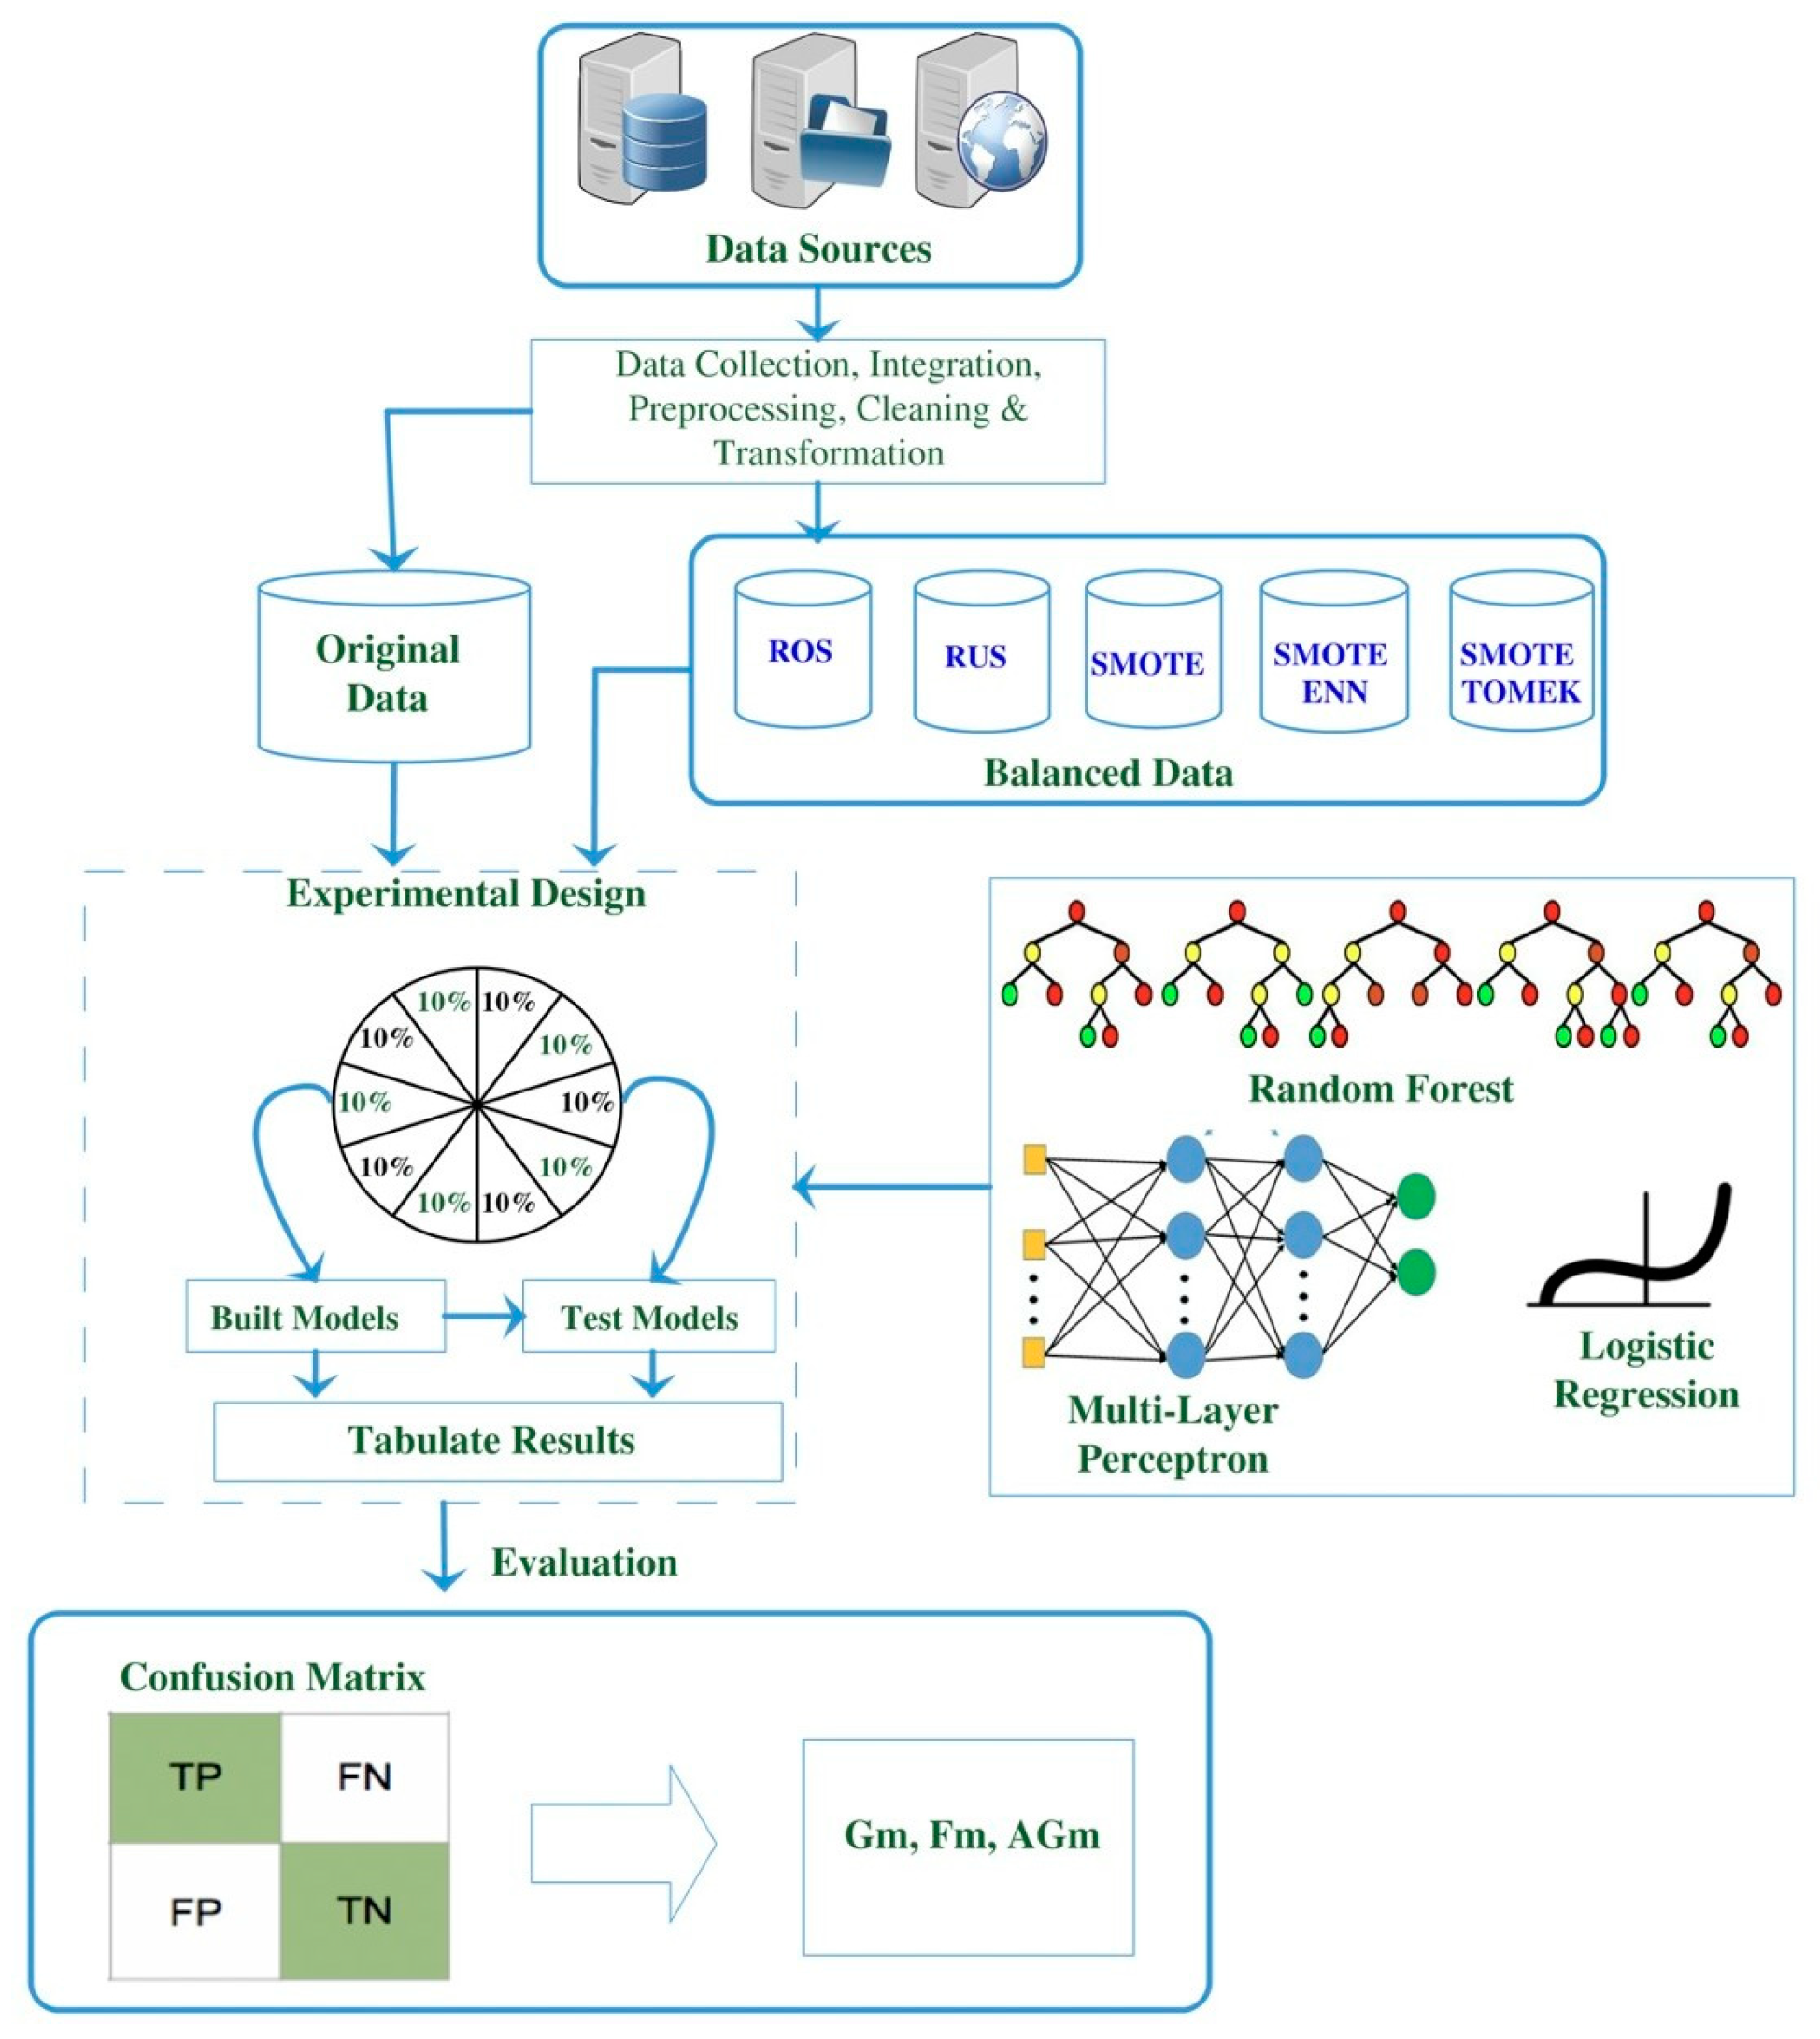
In this study, MLP, RF, and LR were compared over six different structures (original, balanced with ROS, balanced with RUS, balanced with SMOTE, balanced with SMOTE ENN, and balanced with SMOTE Tomek) using stratified 10-fold cross validation. The datasets were alienated in training, validation, and testing by 60%, 20%, and 20%, respectively, to minimize sampling bias. The methodology used to conduct this study is summarized in Figure 3.
Data balancing techniques for predicting student dropout using machine learning can help identify the key determinants of dropout more accurately. This can help schools and other educational institutions better understand the factors that lead to student dropout and take appropriate measures to prevent it. In addition to that, educational institutions can anticipate when students are at risk of dropping out and intervene early to provide the necessary support. This can help reduce the rate of student dropout and improve educational outcomes. By understanding the key determinants of student dropout and intervening early, educational stakeholders can provide targeted interventions to improve educational outcomes. This can help improve student success and reduce the overall dropout rate. Furthermore, data balancing techniques can also help identify disparities in educational outcomes among different groups of students, such as those from different backgrounds or those with different levels of academic achievement. This can help identify and address disparities in educational outcomes and promote equity in education.
4. Results and Discussion
The study used two datasets to compare data balancing techniques. The datasets used were highly imbalanced due to the fact that there are still many students in school compared to students who drop out, which makes balancing the data very important in this study because the focus was primarily on the minority class, in this case dropouts. The results showed that the SMOTE ENN data balancing technique had very good solutions for achieving greater performance, followed by SMOTE TOMEK and RUS on the Uwezo datasets. For the Indian dataset, the SMOTE ENN data balancing technique performed better, followed by SMOTE TOMEK and ROS (Table 1).
The SMOTE ENN data balancing technique has shown very good solutions for achieving greater performance due to its ability to provide in-depth data cleaning. Similar results were reported by [78] when assessing a number of methods to balance machine learning data. Furthermore, [79] stressed the techniques and importance of handling data imbalance when developing training sets from a machine learning model, and [80] emphasized the good performance of hybrid data balancing techniques such as SMOTE-RSB, SMOTETOMEK, and SMOTE ENN when dealing with highly imbalanced data like in the case of student dropout.
On the contrary, the RUS technique performed the worst in the study’s experiment evaluating data sampling techniques. This could be due to the nature of the loss of certain potential information that could have an impact on the learning process. Similar results were reported by [81,82] when assessing multiple approaches to managing imbalanced datasets. However, it was reported that this approach improved predictive performance in other studies compared with the lack of data sampling techniques [83,84]. Most datasets in the real world are not balanced, i.e., there is a majority and minority class, and if data balancing is ignored when training the machine learning model, it may lead to bias towards one class, and the model will learn more about the majority class and learn less about or ignore the minority class. Hence, handling unbalanced data is very important when developing a machine learning model.
Models Performance
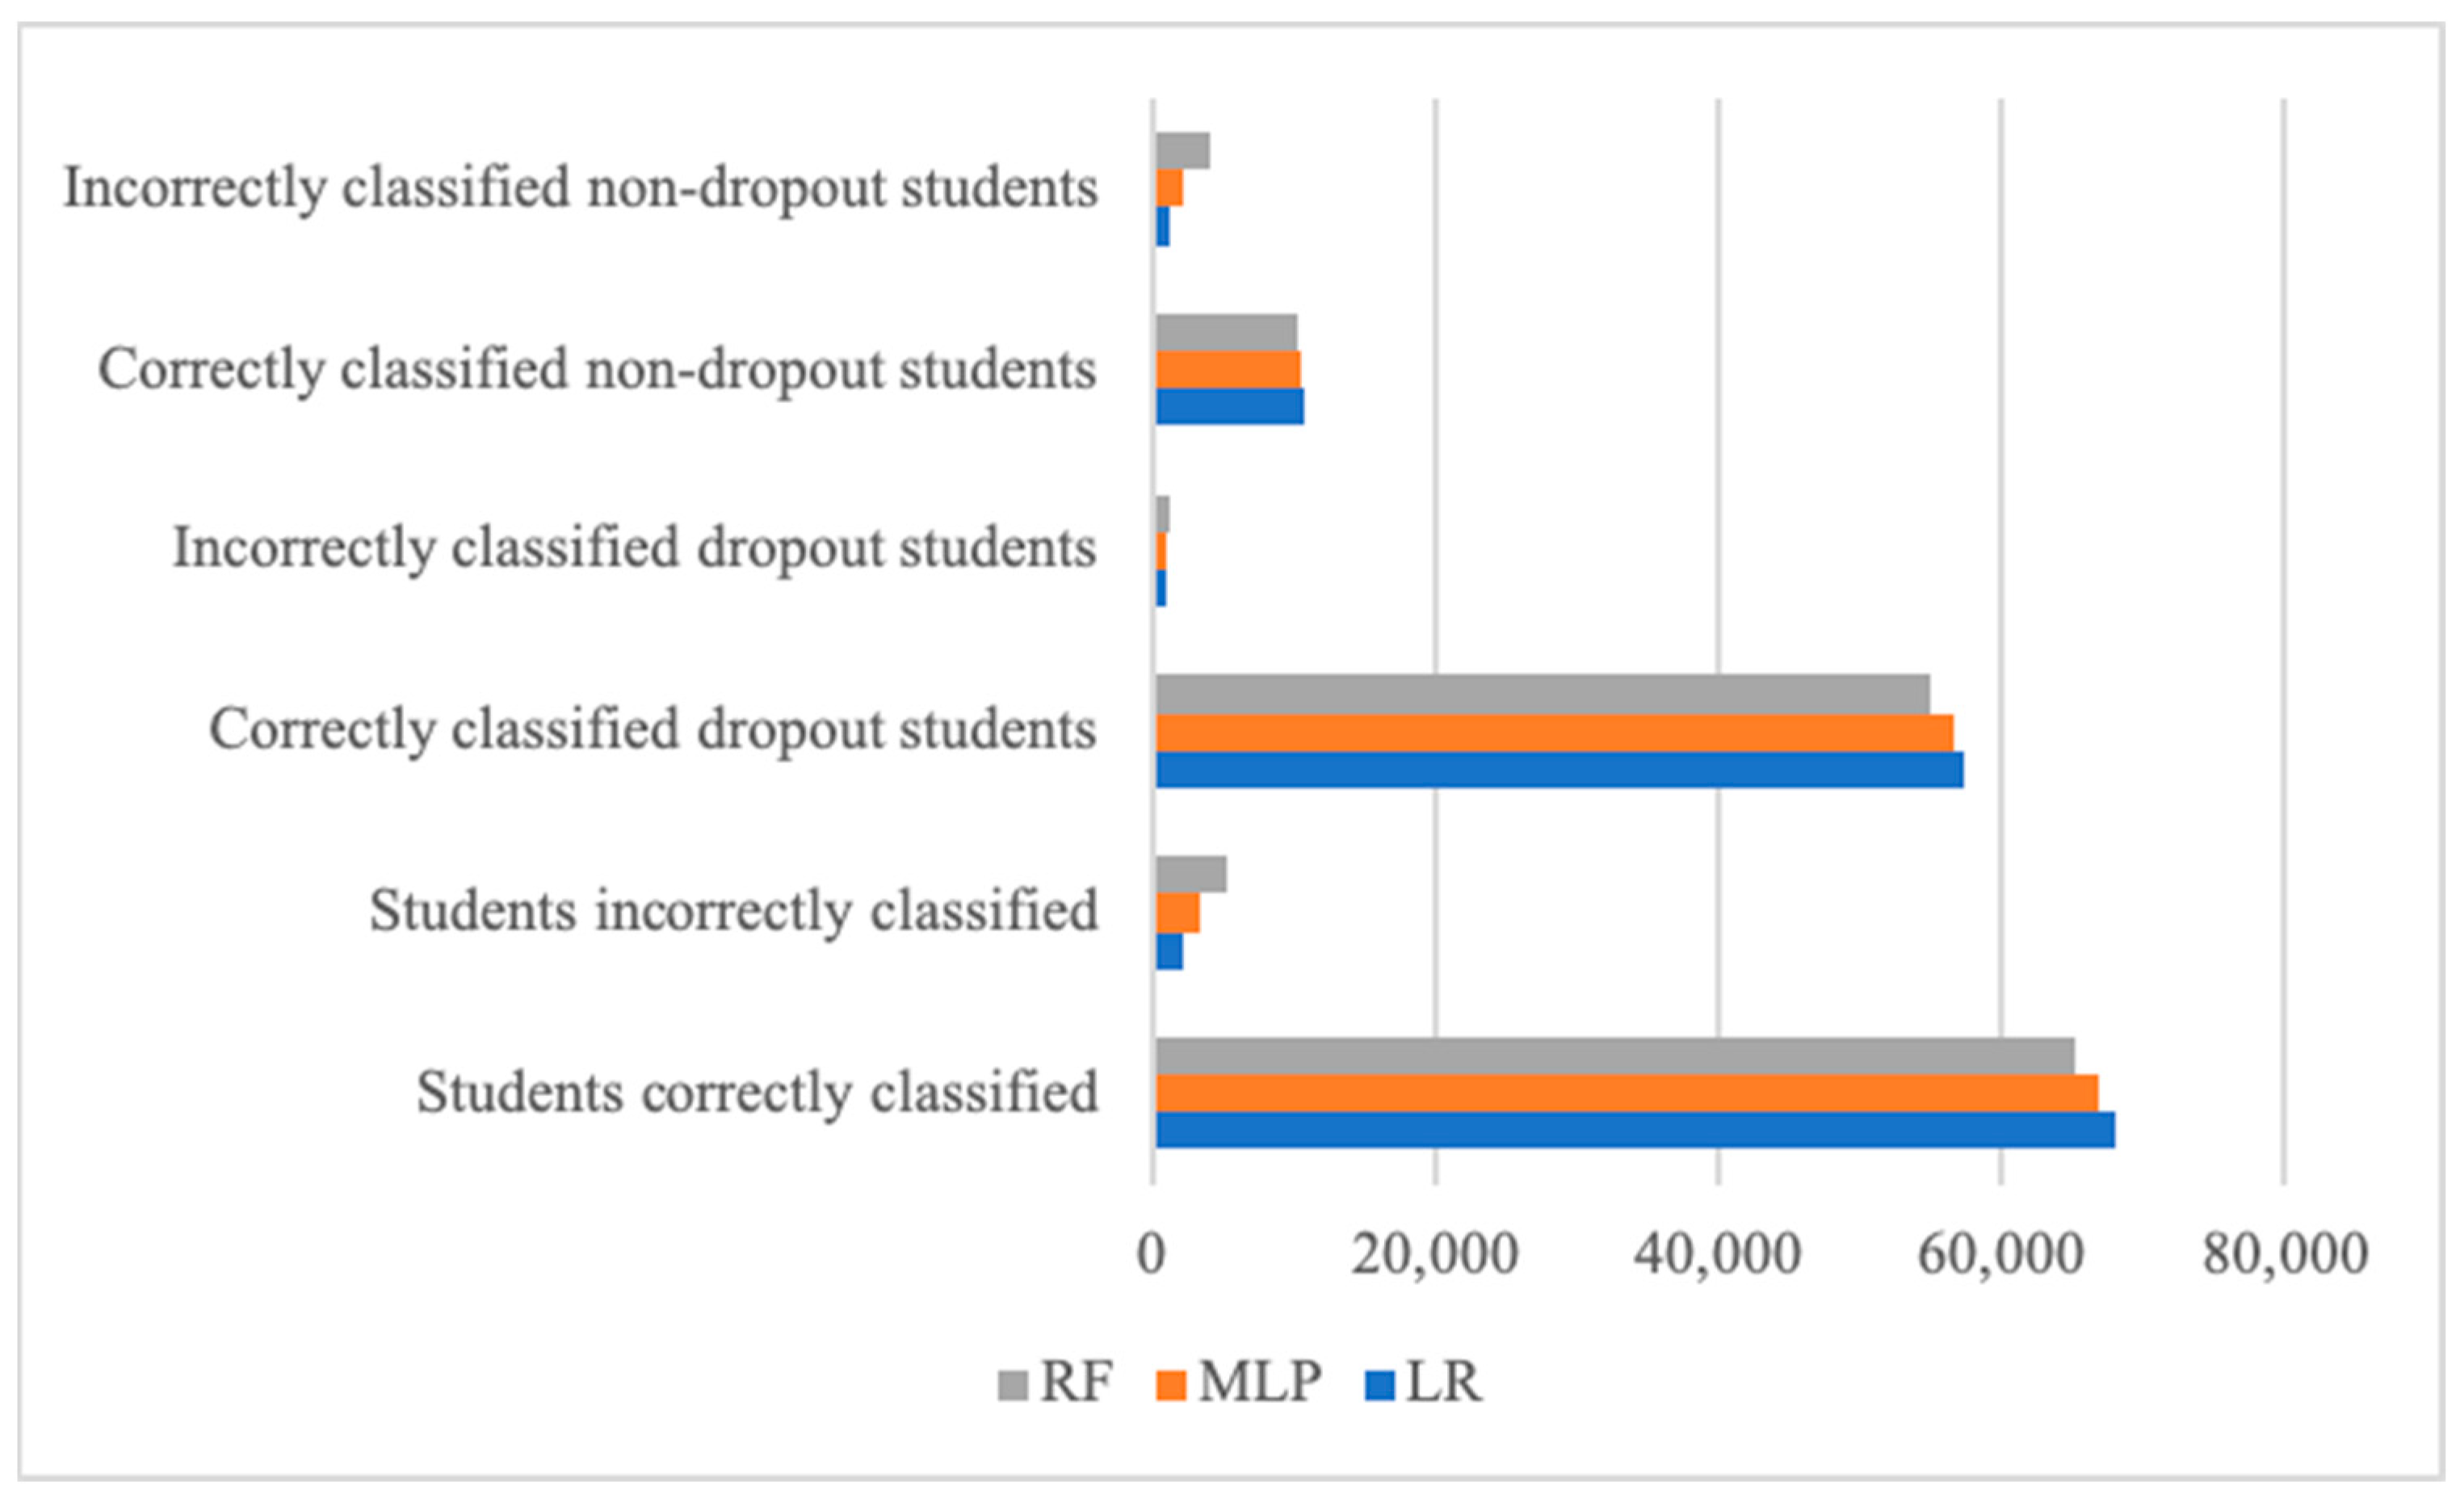
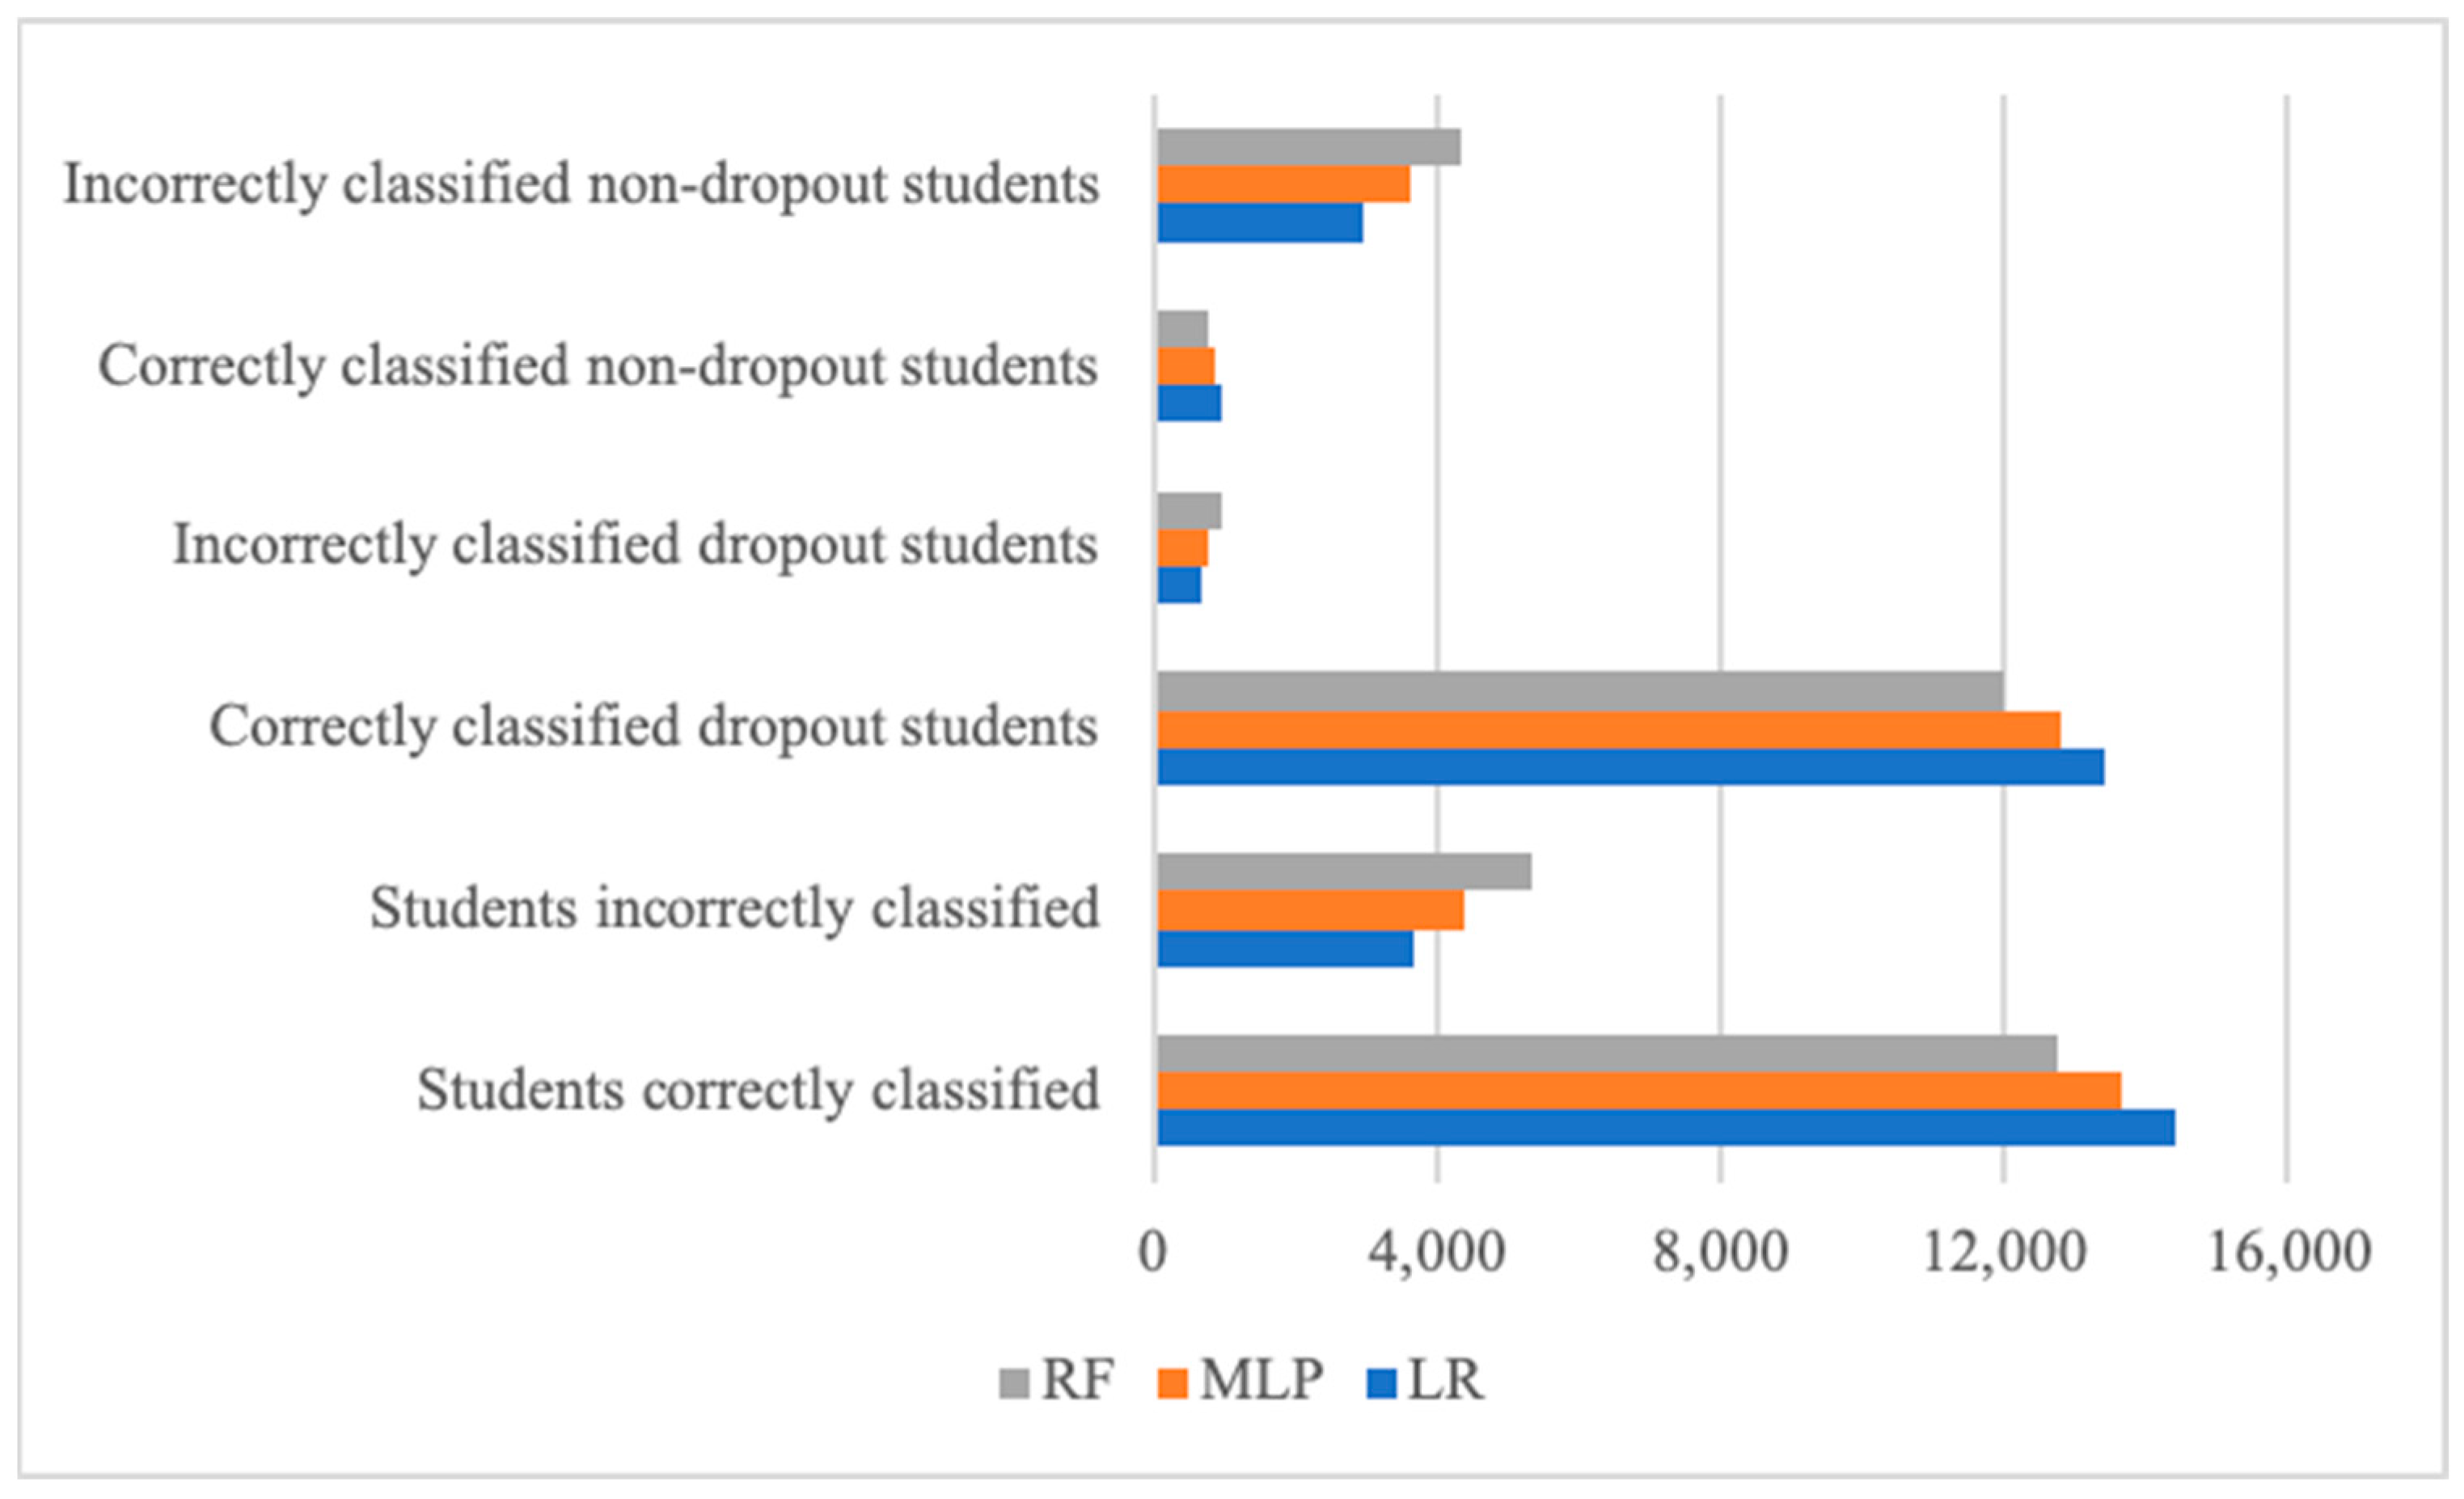
Three machine learning models used in data balancing techniques were evaluated, and the findings showed that LR was the best model to correctly classify the highest number of student dropouts and misclassify the lowest, followed by MLP and RF in the Uwezo (Figure 4) and Indian datasets (Figure 5).
Similar metrics (Gm, Fm, and AGm) were used by [41,75,76,77,78,79,80,81,82,83,84,85,86,87,88,89] in evaluating the performance of the developed models in order to take the class distribution into account. In addition, accuracy has been reported as a common metric for measuring the degree of correctness of machine learning models [66,67]. However, its limitations in the imbalanced domain make it unsuitable for evaluating models with imbalanced data [2,72].
Moreover, this study found that LR and MLP were the best models to correctly classifying the highest number of student dropouts and misclassifying the lowest. This may be due to the ability of LR to model the probability of binary results and the power of MLP to produce satisfactory results for nonlinear relationships. Similar results were reported by [42,90] when determining the accuracy of their predictive models for the early prediction of stroke and student dropout, respectively. Both studies indicated that LR was the best-performing classification model relative to the others. These results, however, contradict what was reported by [91] in their study of evaluating the performance of supervised machine learning models in healthcare, where K-Nearest Neighbor and Random Forest were reported to outperform other models such as Logistic Regression and Naive Bayes.
The issue of predicting student dropout using a machine learning model is an important one, and it’s been addressed by many different approaches. Data balancing is one of the most promising of these methods. Data balancing techniques are designed to identify the key determinants of student dropout and then use machine learning to develop a model that can accurately predict dropout rates. Data balancing techniques involve creating a data set that is as balanced as possible. This means that the data must be stratified to ensure that the populations being compared are equal in terms of key attributes. By ensuring that the data is balanced in terms of key attributes, it allows the machine learning model to accurately predict dropout rates. The machine learning solution presented in this study can be used to accurately predict students at risk of dropping out of school and provide early measures for intervention.
5. Conclusions
Based on the analysis of the results, the study concluded that the SMOTE ENN balancing technique provides a good solution for achieving superior performance. Furthermore, LR has been considered a potential model for the type of data used due to its high accuracy in classifying the dropout class, which is the focus of this study. The study also concluded that the use of data balancing techniques before model development helps to improve the performance of the predictive results when measured by the Gm, Fm, and AGm. In other words, predictive outcomes were improved by comparing original (unbalanced) data with data that were collected using sampling techniques. In a real-world environment, most datasets are imbalanced and contain a large number of anticipated examples with only a small number of unexpected examples. Most of the interest is in the predictions of the unexpected examples. Machine learning models are not as precise for predicting the minority class in unbalanced datasets. Therefore, a data balancing task is required as part of the pre-processing phase to deal with this situation. This study is limited to the application of data sampling techniques to address the problem of student dropout. Prospective future directions will focus on alternative methods, including algorithmic modification and cost-sensitive learning, with the aim of improving the predictive power of the machine learning model.
Funding
This work was carried out with the aid of a grant from the Artificial Intelligence for Development in Africa Program, a program funded by the Canada’s International Development Research Centre, Ottawa, Canada and the Swedish International Development Cooperation Agency, grant number 109704-001/002.
Institutional Review Board Statement
Not applicable.
Informed Consent Statement
Not applicable.
Data Availability Statement
The data presented in this study are publicly available at http://www.twaw37e1za.o datasets and https://www.kaggle.com/imrandude/studentdropindia2016 (accessed on 30 January 2017).
Acknowledgments
The author would like to thank the UNESCO-L’Oreal Foundation for supporting this study.
Conflicts of Interest
The author declares no conflict of interest.
Abbreviations
The following abbreviations are used in this manuscript:
| RUS | Random Under Sampling |
| ROS | Random Over Sampling |
| SMOTE | Synthetic Minority Over Sampling Technique |
| SMOTE ENN | Synthetic Minority Over Sampling Technique with Edited Nearest Neighbor |
| SMOTE TOMEK | Synthetic Minority Over Sampling Technique with Tomek links |
| LR | Logistic Regression |
| RF | Random Forest |
| MLP | Multi-Layer Perceptron |
| Gm | Geometric Mean |
| Fm | F-measure |
| AGm | Adjusted Geometric Mean |
| 1 | http://www.twaweza.org/go/uwezo-datasets (accessed on 30 January 2017). |
| 2 | https://www.kaggle.com/imrandude/studentdropindia2016 (accessed on 30 January 2017) |
References
- Lin, W.J.; Chen, J.J. Class-imbalanced classifiers for high-dimensional data. Brief. Bioinform. 2013, 14, 13–26. [Google Scholar] [CrossRef] [PubMed] [Green Version]
- López, V.; Fernández, A.; García, S.; Palade, V.; Herrera, F. An insight into classification with imbalanced data: Empirical results and current trends on using data intrinsic characteristics. Inf. Sci. 2013, 250, 113–141. [Google Scholar] [CrossRef]
- Krawczyk, B. Combining One-vs-One Decomposition and Ensemble Learning for Multi-class. In Proceedings of the 9th International Conference on Computer Recognition Systems CORES 2015; Springer International Publishing: Berlin/Heidelberg, Germany, 2015; pp. 27–36. [Google Scholar] [CrossRef]
- Galar, M.; Fernández, A.; Barrenechea, E.; Bustince, H.; Herrera, F. New Ordering-Based Pruning Metrics for Ensembles of Classifiers in Imbalanced Datasets. In Proceedings of the 9th International Conference on Computer Recognition Systems CORES 2015; Springer International Publishing: Berlin/Heidelberg, Germany, 2016. [Google Scholar] [CrossRef]
- Krawczyk, B. Learning from imbalanced data: Open challenges and future directions. Prog. Artif. Intell. 2016, 5, 221–232. [Google Scholar] [CrossRef] [Green Version]
- Borowska, K.; Topczewska, M. New Data Level Approach for Imbalanced Data Classification Improvement. In Proceedings of the 9th International Conference on Computer Recognition Systems CORES 2015; Springer International Publishing: Berlin/Heidelberg, Germany, 2016; pp. 283–294. [Google Scholar] [CrossRef]
- Mazumder, R.U.; Begum, S.A.; Biswas, D. Rough Fuzzy Classi fi cation for Class Imbalanced Data. In Proceedings of Fourth International Conference on Soft Computing for Problem Solving; Springer: Delhi, India, 2015. [Google Scholar] [CrossRef]
- Abdi, L.; Hashemi, S. An Ensemble Pruning Approach Based on Reinforcement Learning in Presence of Multi-class Imbalanced Data. In Proceedings of the Third International Conference on Soft Computing for Problem Solving; Springer: Delhi, India, 2014. [Google Scholar] [CrossRef]
- Sonak, A.; Patankar, R.A. A Survey on Methods to Handle Imbalance Dataset. Int. J. Comput. Sci. Mob. Comput. 2015, 4, 338–343. [Google Scholar]
- Ali, H.; Salleh, M.N.M.; Saedudin, R.; Hussain, K.; Mushtaq, M.F. Imbalance class problems in data mining: A review. Indones. J. Electr. Eng. Comput. Sci. 2019, 14, 1552–1563. [Google Scholar] [CrossRef]
- Realinho, V.; Machado, J.; Baptista, L.; Martins, M.V. Predicting Student Dropout and Academic Success. Data 2022, 7, 146. [Google Scholar] [CrossRef]
- Thammasiri, D.; Delen, D.; Meesad, P.; Kasap, N. A critical assessment of imbalanced class distribution problem: The case of predicting freshmen student attrition. Expert Syst. Appl. 2013, 41, 321–330. [Google Scholar] [CrossRef] [Green Version]
- UNESCO. Estimation of the Numbers and Rates of Out-of-school Children and Adolescents Using Administrative and Household Survey Data; UNESCO Institute for Statistics: Montreal, QC, Canada, 2017; pp. 1–33. [Google Scholar] [CrossRef]
- Valles-coral, M.A.; Salazar-ram, L.; Injante, R.; Hernandez-torres, E.A.; Ju, J.; Navarro-cabrera, J.R.; Pinedo, L.; Vidaurre-rojas, P. Density-Based Unsupervised Learning Algorithm to Categorize College Students into Dropout Risk Levels. Data 2022, 7, 165. [Google Scholar] [CrossRef]
- Mduma, N. Data Driven Approach for Predicting Student Dropout in Secondary Schools. Ph.D. Thesis, NM-AIST, Arusha, Tanzania, 2020. [Google Scholar]
- Gao, T. Hybrid Classification Approach of SMOTE and Instance Selection for Imbalanced Datasets. Ph.D. Thesis, Iowa State University, Ames, IA, USA, 2015. [Google Scholar]
- Hoens, T.R.; Chawla, N.V. Imbalanced Datasets: From Sampling to Classifiers. In Imbalanced Learning: Foundations, Algorithms, and Applications; John Wiley & Inc.: Hoboken, NJ, USA, 2013; pp. 43–59. [Google Scholar] [CrossRef]
- Elhassan, T.; Aljurf, M.; Shoukri, M. Classification of Imbalance Data using Tomek Link (T-Link) Combined with Random Under-sampling (RUS) as a Data Reduction Method. J. Inform. Data Min. 2016, 1, 1–12. [Google Scholar]
- Santoso, B.; Wijayanto, H.; Notodiputro, K.A.; Sartono, B. Synthetic Over Sampling Methods for Handling Class Imbalanced Problems: A Review. In IOP Conference Series: Earth and Environmental Science; IOP Publishing: Bristol, UK, 2017. [Google Scholar] [CrossRef]
- Skryjomski, P. Influence of minority class instance types on SMOTE imbalanced data oversampling. Proc. Mach. Learn. Res. 2017, 74, 7–21. [Google Scholar]
- Yu, X.; Zhou, M.; Chen, X.; Deng, L.; Wang, L. Using Class Imbalance Learning for Cross-Company Defect Prediction. Int. Conf. Softw. Eng. Knowl. Eng. 2017, 117–122. [Google Scholar] [CrossRef]
- Douzas, G.; Bacao, F. Geometric SMOTE: Effective oversampling for imbalanced learning through a geometric extension of SMOTE. arXiv 2017, arXiv:1709.07377. [Google Scholar]
- Shilbayeh, S.A. Cost Sensitive Meta Learning Samar Ali Shilbayeh School of Computing, Science and Engineering; University of Salford: Salford, UK, 2015. [Google Scholar]
- Kumar, M.; Singh, A.; Handa, D. Literature Survey on Educational Dropout Prediction. Int. J. Educ. Manag. Eng. 2017, 7, 8–19. [Google Scholar] [CrossRef] [Green Version]
- Siri, A.; Siri, A. Predicting Students’ Dropout at University Using Artificial Neural Networks. Ital. J. Sociol. Educ. 2015, 7, 225–247. [Google Scholar]
- Oancea, B.; Dragoescu, R.; Ciucu, S. Predicting Students’ Results in Higher Education Using Neural Networks. In Proceedings of the International Conference on Applied Information and Communication Technologies, Baku, Azerbaijan, 23–25 October 2013; pp. 190–193. [Google Scholar]
- Saranya, A.; Rajeswari, J. Enhanced Prediction of Student Dropouts Using Fuzzy Inference System and Logistic Regression. ICTACT J. Soft Comput. 2016, 6, 1157–1162. [Google Scholar] [CrossRef]
- Fei, M.; Yeung, D.Y. Temporal Models for Predicting Student Dropout in Massive Open Online Courses. In Proceedings of the 2015 IEEE International Conference on Data Mining Workshop (ICDMW), Atlantic City, NJ, USA, 14–17 November 2015; pp. 256–263. [Google Scholar] [CrossRef]
- Goga, M.; Kuyoro, S.; Goga, N. A Recommender for Improving the Student Academic Performance. Procedia Soc. Behav. Sci. 2015, 180, 1481–1488. [Google Scholar] [CrossRef] [Green Version]
- Sales, A.; Balby, L.; Cajueiro, A. Exploiting Academic Records for Predicting Student Drop Out: A case study in Brazilian higher education. J. Inf. Data Manag. 2016, 7, 166–180. [Google Scholar]
- Nagrecha, S.; Dillon, J.Z.; Chawla, N.V. MOOC Dropout Prediction: Lessons Learned from Making Pipelines Interpretable. In Proceedings of the 26th International Conference on World Wide Web Companion; ACM: New York, NY, USA, 2017; pp. 351–359. [Google Scholar] [CrossRef]
- Aulck, L.; Velagapudi, N.; Blumenstock, J.; West, J. Predicting Student Dropout in Higher Education. ICML Workshop on #Data4Good: Machine Learning in Social Good Applications 2016. arXiv 2017, 16–20. [Google Scholar] [CrossRef]
- Halland, R.; Igel, C.; Alstrup, S. High-School Dropout Prediction Using Machine Learning: A Danish Large-scale Study. In Proceedings of the 23rd European Symposium on Artificial Neural Networks, Bruges, Belgium, 22–23 April 2015; pp. 22–24. [Google Scholar]
- Kemper, L.; Vorhoff, G.; Wigger, B.U. Predicting student dropout: A machine learning approach. Eur. J. High. Educ. 2020, 10, 28–48. [Google Scholar] [CrossRef]
- de Oliveira Durso, S.; da Cunha, J.V. Determinant Factors for Undergraduate Student’s Dropout in Accounting Studies Department of A Brazilian Public University. Fed. Univ. Minas Gerais 2018, 34, 186332. [Google Scholar] [CrossRef] [Green Version]
- Nath, S.R.; Ferris, D.; Kabir, M.M.; Chowdhury, T.; Hossain, A. Transition and Dropout in Lower Income Countries: Case Studies of Secondary Education in Bangladesh and Uganda. World Innov. Summit Educ. 2017. Available online: https://www.wise-qatar.org/app/uploads/2019/04/rr.3.2017_brac.pdf (accessed on 1 January 2023).
- Wang, X.; Schneider, H. A Study of Modelling Approaches for Predicting Dropout in a Business College; Louisiana State University: Baton Rouge, LA, USA, 2018; pp. 1–8. [Google Scholar]
- Franklin, B.J.; Trouard, S.B. An Analysis of Dropout Predictors within a State High School Graduation Panel. Schooling 2014, 5, 1–8. [Google Scholar]
- Helou, I. Analytical and experimental investigation of steel friction dampers and horizontal brake pads in chevron frames under cyclic loads. Issues Inf. Sci. Inf. Technol. Educ. 2018, 15, 249–278. [Google Scholar]
- Aguiar, E.; Dame, N.; Miller, D.; Yuhas, B.; Addison, K.L. Who, When, and Why: A Machine Learning Approach to Prioritizing Students at Risk of not Graduating High School on Time. ACM 2015, 93–102. [Google Scholar] [CrossRef]
- Rovira, S.; Puertas, E.; Igual, L. Data-driven System to Predict Academic Grades and Dropout. PLoS ONE 2017, 12, e0171207. [Google Scholar] [CrossRef] [Green Version]
- Mgala, M.; Mbogho, A. Data-driven Intervention-level Prediction Modeling for Academic Performance. In Proceedings of the Seventh International Conference on Information and Communication Technologies and Development, Singapore, 15–18 May 2015; pp. 2:1–2:8. [Google Scholar] [CrossRef]
- Voyant, C.; Paoli, C.; Nivet, M.l.; Notton, G. Multi-layer Perceptron and Pruning. Turk. J. Forecast. 2017, 1, 1–6. [Google Scholar]
- Ramchoun, H.; Amine, M.; Idrissi, J.; Ghanou, Y.; Ettaouil, M. Multilayer Perceptron: Archi-tecture Optimization and Training. Int. J. Interact. Multimed. Artif. Intell. 2016, 4, 26. [Google Scholar] [CrossRef] [Green Version]
- Fesghandis, G.S. Comparison of Multilayer Perceptron and Radial Basis Function Neural Networks in Predicting the Success of New Product Development. Eng. Technol. Appl. Sci. Res. 2017, 7, 1425–1428. [Google Scholar] [CrossRef]
- Rani, K.U. Advancements in Multi-Layer Perceptron Training to Improve Classification. Int. J. Recent Innov. Trends Comput. Commun. 2017, 5, 353. [Google Scholar] [CrossRef]
- Ahmed, K.; Shahid, S.; Haroon, S.B.; Xiao-jun, W. Multilayer perceptron neural network for downscaling rainfall in arid region: A case study of Baluchistan, Pakistan. J. Earth Syst. Sci. 2015, 124, 1325–1341. [Google Scholar] [CrossRef] [Green Version]
- Taravat, A.; Proud, S.; Peronaci, S.; Del Frate, F.; Oppelt, N. Multilayer perceptron neural networks model for meteosat second generation SEVIRI daytime cloud masking. Remote Sens. 2015, 7, 1529–1539. [Google Scholar] [CrossRef] [Green Version]
- Wu, Z.; Lin, W.; Zhang, Z.; Wen, A.; Lin, L. An Ensemble Random Forest Algorithm for Insurance Big Data Analysis. In Proceedings of the 2017 IEEE International Conference on Computational Science and Engineering and IEEE/IFIP International Conference on Embedded and Ubiquitous Computing, CSE and EUC 2017, Guangzhou, China, 21–24 July 2017; Volume 1, pp. 531–536. [Google Scholar] [CrossRef]
- Compo, P.; Pca, E.; Variances, A.U.; Analysis, B.S. Submitted to the Annals of Statistics. Ann. Stat. 2017, 45, 1–37. [Google Scholar]
- Biau, G.; Scornet, E. A Random Forest Guided Tour. TEST 2015, 25, 197–227. [Google Scholar] [CrossRef] [Green Version]
- Prajwala, T.R. A Comparative Study on Decision Tree and Random Forest Using R Tool. Ijarcce 2015, 4, 196–199. [Google Scholar] [CrossRef]
- Ibrahim, M. Scalability and Performance of Random Forest based Learning-to-Rank for Information Retrieval. In ACM SIGIR Forum; ACM: New York, NY, USA, 2017; Volume 51, pp. 73–74. [Google Scholar]
- Kulkarni, A.D.; Lowe, B. Random Forest for Land Cover Classification. Int. J. Recent Innov. Trends Comput. Commun. 2016, 4, 58–63. [Google Scholar]
- Fabris, F.; Doherty, A.; Palmer, D.; de Magalhães, J.P.; Freitas, A.A. A new approach for interpreting Random Forest models and its application to the biology of ageing. Bioinformatics 2018, 34, 2449–2456. [Google Scholar] [CrossRef] [Green Version]
- Goel, E.; Abhilasha, E. Random Forest: A Review. Int. J. Adv. Res. Comput. Sci. Softw. Eng. 2017, 7, 251–257. [Google Scholar] [CrossRef]
- Aydın, C. Classification of the Fire Station Requirement with Using Machine Learning Algorithms. I.J. Inf. Technol. Comput. Sci. 2019, 11, 24–30. [Google Scholar] [CrossRef]
- Klusowski, J.M. Complete Analysis of a Random Forest Model; Rutgers University: New Brunswick, NJ, USA, 2018. [Google Scholar]
- Tyralis, H.; Papacharalampous, G. Variable selection in time series forecasting using random forests. Algorithms 2017, 10, 114. [Google Scholar] [CrossRef] [Green Version]
- Ahmadlou, M.; Delavar, M.R.; Shafizadeh-Moghadam, H.; Tayyebi, A. Modeling urban dynamics using random forest: Implementing Roc and Toc for model evaluation. Int. Arch. Photogramm. Remote Sens. Spat. Inf. Sci. ISPRS Arch. 2016, 41, 285–290. [Google Scholar] [CrossRef] [Green Version]
- Genuer, R.; Poggi, J.M.; Tuleau-Malot, C.; Villa-Vialaneix, N. Random Forests for Big Data. Big Data Res. 2015, 9, 28–46. [Google Scholar] [CrossRef] [Green Version]
- Kudakwashe, M.; Mohammed Yesuf, K. Application of Binary Logistic Regression in Assessing Risk Factors Affecting the Prevalence of Toxoplasmosis. Am. J. Appl. Math. Stat. 2014, 2, 357–363. [Google Scholar] [CrossRef] [Green Version]
- Sperandei, S. Understanding logistic regression analysis. Biochem. Med. 2014, 24, 12–18. [Google Scholar] [CrossRef] [PubMed]
- Park, H.A. An introduction to logistic regression: From basic concepts to interpretation with particular attention to nursing domain. J. Korean Acad. Nurs. 2013, 43, 154–164. [Google Scholar] [CrossRef] [PubMed] [Green Version]
- Shu, D.; He, W. A New Method for Logistic Model Assessment. Int. J. Stat. Probab. 2017, 6, 120. [Google Scholar] [CrossRef] [Green Version]
- Ameri, S.; Fard, M.J.; Chinnam, R.B.; Reddy, C.K. Survival Analysis based Framework for Early Prediction of Student Dropouts. ACM 2016, 903–912. [Google Scholar] [CrossRef] [Green Version]
- Lakkaraju, H.; Aguiar, E.; Shan, C.; Miller, D.; Bhanpuri, N.; Ghani, R.; Addison, K.L. A Machine Learning Framework to Identify Students at Risk of Adverse Academic Outcomes. In Proceedings of the 21th ACM SIGKDD International Conference on Knowledge Discovery and Data Mining, Sydney, NSW, Australia, 10-13 August 2015; pp. 1909–1918. [Google Scholar] [CrossRef]
- Susheel Kumar, S.M.; Laxkar, D.; Adhikari, S.; Vijayarajan, V. Assessment of various supervised learning algorithms using different performance metrics. IOP Conf. Ser. Mater. Sci. Eng. 2017, 263, 042087. [Google Scholar] [CrossRef]
- Maggo, S.; Gupta, C. A Machine Learning based Efficient Software Reusability Prediction Model for Java Based Object Oriented Software. I.J. Inf. Technol. Comput. Sci. 2014, 1–13. [Google Scholar] [CrossRef] [Green Version]
- Liang, J.; Li, C.; Zheng, L. Machine learning application in MOOCs: Dropout prediction. In Proceedings of the ICCSE 2016 11th International Conference on Computer Science and Education, Nagoya, Japan, 23–25 August 2016; pp. 52–57. [Google Scholar] [CrossRef]
- Longadge, R.; Dongre, S.S.; Malik, L. Class imbalance problem in data mining: Review. Int. J. Comput. Sci. Netw. 2013, 2, 83–87. [Google Scholar] [CrossRef]
- Yilmaz, D.; Boz, H.; Yücel, M.; Günay, E. Prediction of student dropout from a university in Turkey using data balancing techniques. Comput. Educ. 2020, 108, 11–29. [Google Scholar] [CrossRef]
- Mesut, G.; Demir, I.; Batur, K.; Sahin, F. Applying data balancing techniques to predict student dropout using machine learning. Int. J. Adv. Comput. Technol. 2017, 5, 1–8. [Google Scholar]
- Antar, K.; Al-Dmour, R.; Zbaidieh, M.; Al-Kabi, M. Prediction of Student Dropouts Using Machine Learning Techniques. Int. J. Comput. Appl. 2020, 5, 1–8. [Google Scholar] [CrossRef]
- Jain, A.; Singh, U.; Kumar, S. Application of data balancing techniques to predict student dropout using machine learning. Int. J. Comput. Appl. 2018, 11, 430–439. [Google Scholar]
- Barros, T.M.; Neto, P.A.; Silva, I.; Guedes, L.A. Predictive models for imbalanced data: A school dropout perspective. Educ. Sci. 2019, 9, 275. [Google Scholar] [CrossRef] [Green Version]
- Kotsiantis, S.B. Supervised Machine Learning: A Review of Classification Techniques. Informatica 2007, 31, 249–268. [Google Scholar]
- Batista, G.E.A.P.A.; Prati, R.C.; Monard, M.C. A Study of the Behavior of Several Methods for Balancing Machine Learning Training Data. SIGKDD Explor. Newsl. 2004, 6, 20–29. [Google Scholar] [CrossRef]
- Farquad, M.A.; Bose, I. Preprocessing Unbalanced Data Using Support Vector Machine. Decis. Support Syst. 2012, 53, 226–233. [Google Scholar] [CrossRef]
- Ramentol, E.; Caballero, Y.; Bello, R.; Herrera, F. SMOTE-RSB *: A Hybrid Preprocessing Approach Based on Oversampling and Undersampling for High Imbalanced Data-sets Using SMOTE and Rough Sets Theory. Knowl. Inf. Syst. 2012, 33, 245–265. [Google Scholar] [CrossRef]
- Yen, S.J.; Lee, Y.S. Cluster-based Under-sampling Approaches for Imbalanced Data Distributions. Expert Syst. Appl. 2009, 36, 5718–5727. [Google Scholar] [CrossRef]
- Wang, S.; Yao, X. Using Class Imbalance Learning for Software Defect Prediction. IEEE Trans. Reliab. 2013, 62, 434–443. [Google Scholar] [CrossRef] [Green Version]
- Burez, J.; Van den Poel, D. Handling Class Imbalance in Customer Churn Prediction. Expert Syst. Appl. 2009, 36, 4626–4636. [Google Scholar] [CrossRef] [Green Version]
- Prusa, J.; Khoshgoftaar, T.M.; DIttman, D.J.; Napolitano, A. Using Random Undersampling to Alleviate Class Imbalance on Tweet Sentiment Data. In Proceedings of the IEEE 16th International Conference on Information Reuse and Integration, IRI 2015, San Francisco, CA, USA, 13–15 August 2015; pp. 197–202. [Google Scholar] [CrossRef]
- Aulck, L.; Aras, R.; Li, L.; Heureux, C.L.; Lu, P.; West, J. STEM-ming the Tide: Predicting STEM Attrition Using Student Transcript Data. arXiv 2017, arXiv:1708.09344. [Google Scholar] [CrossRef]
- Batuwita, R.; Palade, V. Adjusted Geometric-mean: A Novel Performance Measure for Imbalanced Bioinformatics Datasets Learning. J. Bioinform. Comput. Biol. 2012, 10, 1250003. [Google Scholar] [CrossRef]
- Kim, M.J.; Kang, D.K.; Kim, H.B. Geometric mean based boosting algorithm with over-sampling to resolve data imbalance problem for bankruptcy prediction. Expert Syst. Appl. 2015, 42, 1074–1082. [Google Scholar] [CrossRef]
- Mgala, M. Investigating Prediction Modelling of Academic Performance for Students in Rural Schools in Kenya. Ph.D. Thesis, University of Cape Town, Cape Town, South Africa, 2016. [Google Scholar]
- Kuncheva, L.I.; Arnaiz-González, Á.; Díez-Pastor, J.F.; Gunn, I.A. Instance Selection Improves Geometric Mean Accuracy: A Study on Imbalanced Data Classification. Prog. Artif. Intell. 2019, 8, 215–228. [Google Scholar] [CrossRef] [Green Version]
- Hakim, A. Performance Evaluation of Machine Learning Techniques for Early Prediction of Brain Strokes. Ph.D. Thesis, United International University, Dhaka, Bangladesh, 2019. [Google Scholar]
- Amin, M.Z.; Ali, A. Performance Evaluation of Supervised Machine Learning Classifiers for Predicting Healthcare Operational Decisions. Tech. Rep. 2017. [Google Scholar] [CrossRef]
Figure 1.
Summary of the related works. Note: Yilmaz, et al. (2017) [72]; Mesut et al. (2017) [73]; Antar et al. (2017) [74]; Jain et al. (2018) [75]; Barros et al. (2019) [76]; Kotsiantis (2007) [77].

Figure 2.
Dropout distributions for the Uwezo and India datasets; (a) Dropout distribution: Uwezo dataset; (b) Dropout distribution: India dataset.
Figure 2.
Dropout distributions for the Uwezo and India datasets; (a) Dropout distribution: Uwezo dataset; (b) Dropout distribution: India dataset.

Figure 3.
Overview of the experimental design.

Figure 4.
Comparison of models’ performance in terms of numbers of correctly and incorrectly classified students (the Uwezo dataset).
Figure 4.
Comparison of models’ performance in terms of numbers of correctly and incorrectly classified students (the Uwezo dataset).

Figure 5.
Comparison of models’ performance in terms of numbers of correctly and incorrectly classified students (the India dataset).
Figure 5.
Comparison of models’ performance in terms of numbers of correctly and incorrectly classified students (the India dataset).


Table 1.
Comparison of data balancing techniques (Uwezo and India datasets).
| Preprocessing | Models | Gm | Fm | AGm | Gm | Fm | AGm |
|---|---|---|---|---|---|---|---|
| Uwezo dataset | India dataset | ||||||
| None | LR | 0.000 | 0.000 | 0.000 | 0.000 | 0.000 | 0.000 |
| MLP | 0.011 | 0.002 | 0.012 | 0.000 | 0.000 | 0.000 | |
| RF | 0.004 | 8.32 × 10⁻⁵ | 0.004 | 0.031 | 0.002 | 0.031 | |
| ROS | LR | 0.536 | 0.547 | 1.010 | |||
| MLP | 0.499 | 0.438 | 0.920 | 0.524 | 0.450 | 0.957 | |
| RF | 0.293 | 0.270 | 0.449 | 0.707 | 0.667 | 1.207 | |
| RUS | LR | 0.548 | 0.546 | 1.042 | 0.582 | 0.570 | 1.085 |
| MLP | 0.512 | 0.332 | 1.031 | 0.515 | 0.139 | 0.925 | |
| RF | 0.624 | 0.561 | 1.192 | 0.711 | 0.667 | 1.210 | |
| SMOTE | LR | 0.551 | 0.556 | 1.034 | 0.648 | 0.603 | 1.190 |
| MLP | 0.525 | 0.475 | 0.967 | 0.555 | 0.410 | 1.032 | |
| RF | 0.661 | 0.645 | 1.138 | 0.707 | 0.667 | 1.207 | |
| SMOTE ENN | LR | 0.562 | 0.572 | 1.079 | 0.722 | 0.638 | 1.343 |
| MLP | 0.577 | 0.491 | 1.104 | 0.791 | 0.438 | 1.531 | |
| RF | 0.676 | 0.666 | 1.176 | 0.738 | 0.706 | 1.283 | |
| SMOTE Tomek | LR | 0.550 | 0.556 | 1.032 | 0.655 | 0.605 | 1.201 |
| MLP | 0.546 | 0.508 | 1.015 | 0.735 | 0.441 | 1.390 | |
| RF | 0.663 | 0.646 | 1.140 | 0.707 | 0.667 | 1.206 |
Disclaimer/Publisher’s Note: The statements, opinions and data contained in all publications are solely those of the individual author(s) and contributor(s) and not of MDPI and/or the editor(s). MDPI and/or the editor(s) disclaim responsibility for any injury to people or property resulting from any ideas, methods, instructions or products referred to in the content. |
© 2023 by the author. Licensee MDPI, Basel, Switzerland. This article is an open access article distributed under the terms and conditions of the Creative Commons Attribution (CC BY) license (https://creativecommons.org/licenses/by/4.0/).
Share and Cite
MDPI and ACS Style
Mduma, N. Data Balancing Techniques for Predicting Student Dropout Using Machine Learning. Data 2023, 8, 49. https://doi.org/10.3390/data8030049
AMA Style
Mduma N. Data Balancing Techniques for Predicting Student Dropout Using Machine Learning. Data. 2023; 8(3):49. https://doi.org/10.3390/data8030049
Chicago/Turabian StyleMduma, Neema. 2023. "Data Balancing Techniques for Predicting Student Dropout Using Machine Learning" Data 8, no. 3: 49. https://doi.org/10.3390/data8030049