


Runoff for Russia (RFR v1.0): The Large-Sample Dataset of Simulated Runoff and Its Characteristics

State Hydrological Institute, 199004 Saint Petersburg, Russia
Data 2023, 8(2), 31; https://doi.org/10.3390/data8020031
Submission received: 9 November 2022
/
Revised: 13 January 2023
/
Accepted: 27 January 2023
/
Published: 30 January 2023
(This article belongs to the Special Issue 2nd Edition of Data in Astrophysics & Geophysics: Research and Applications)
Abstract
:Global warming challenges communities worldwide to develop new adaptation strategies that are required to be based on reliable data. As a vital component of life, river runoff comes into particular focus as a determining and limiting factor of water-related hazard assessment. Here, we present a dataset that makes it possible to estimate the influence of projected climate change on runoff and its characteristics. We utilize the HBV (in Swedish, Hydrologiska Byråns Vattenbalansavdelning) hydrological model and drive it with the ISIMIP (The Inter-Sectoral Impact Model Intercomparison Project) meteorological forcing data for both historical (1979–2016) and projected (2017–2099) periods to simulate runoff and the respective hydrological states and variables, i.e., state of the soil reservoir, snow water equivalent, and predicted amount of melted water, for 425 river basins across Russia. For the projected period, the bias-corrected outputs from four General Circulation Models (GCM) under three Representative Concentration Pathways (RCPs) are used, making it possible to assess the uncertainty of future projections. The simulated runoff formed the basis for calculating its characteristics (191 in total), representing the properties of water regime dynamics. The presented dataset also comprises two auxiliary parts to ensure the seamless assessment of inter-connected hydro-meteorological variables and characteristics: (1) meteorological forcing data and its characteristics and (2) geospatial data. The straightforward use of the presented dataset makes it possible for many interested parties to identify and further communicate water-related climate change issues in Russia on a national scale.
Dataset: Ayzel, Georgy. (2022). Runoff for Russia (RFR v1.0) [Data set]. Zenodo. https://doi.org/10.5281/zenodo.7082269.
Dataset License: Creative Commons Attribution 4.0 International Public License.
1. Summary
Climate change provides new challenges to local communities worldwide. Mitigating increasing temperatures, more extreme rainfalls, and more frequent and severe floods and droughts is essential to support sustainable development and a safe environment. During the last two decades, water-related disasters accounted for around 74% of all natural disasters [1]. Moreover, these numbers tend to increase due to projected climate change [2,3], putting them into the focus of scientific research.
In recent decades, researchers worldwide have tried to understand the underlying mechanisms of global warming and articulate them to the public and governments [4]. The core of the respective research comprises the Global Circulation Models (GCM)—physically-based models which try to describe the complex system of heat and water transfer in the Earth system by mathematical equations [5]. These models provide projections of many meteorological variables, among which the most known are air temperature and precipitation, based on different scenarios of Representative Concentration Pathways (RCP)—trajectories of greenhouse gas emissions. In this way, calculated climate projections form the basis for scientifically-based assessment of global warming mechanisms and upcoming consequences.
The Inter-Sectoral Impact Model Intercomparison Project (ISIMIP) was initiated by the Potsdam Institute for Climate Impact Research (PIK) and the International Institute for Applied Systems Analysis (IIASA) and offers a framework for consistently projecting the impacts of climate change across affected sectors and spatial scales [6]. Under the ISIMIP project, different research groups aim to propagate climate inputs through global impact models—agricultural, hydrological, ecological—to assess respective projections of, e.g., wheat yield, runoff, or biodiversity [6,7,8].
In recent years, several research groups related to the ISIMIP project have been assessing potential changes in water resources at global and regional scales due to climate change [9,10,11,12]. They use global or regional hydrological models (SWAP, SWAT, and EcoMAG) forced with bias-corrected and downscaled weather and climate data distributed through the ISIMIP project to obtain runoff projections for the world’s largest basins on different continents, e.g., Nile, Mississippi, Lena, etc. While the conducted studies made an apparent effort in disseminating projected runoff changes at the scale of the largest river basins, there is a clear gap in representing medium river basins (at scales less than 100,000 km2). These basins could be of particular interest because of their high relevance for local communities, which closely link their activities to the river’s water resources.
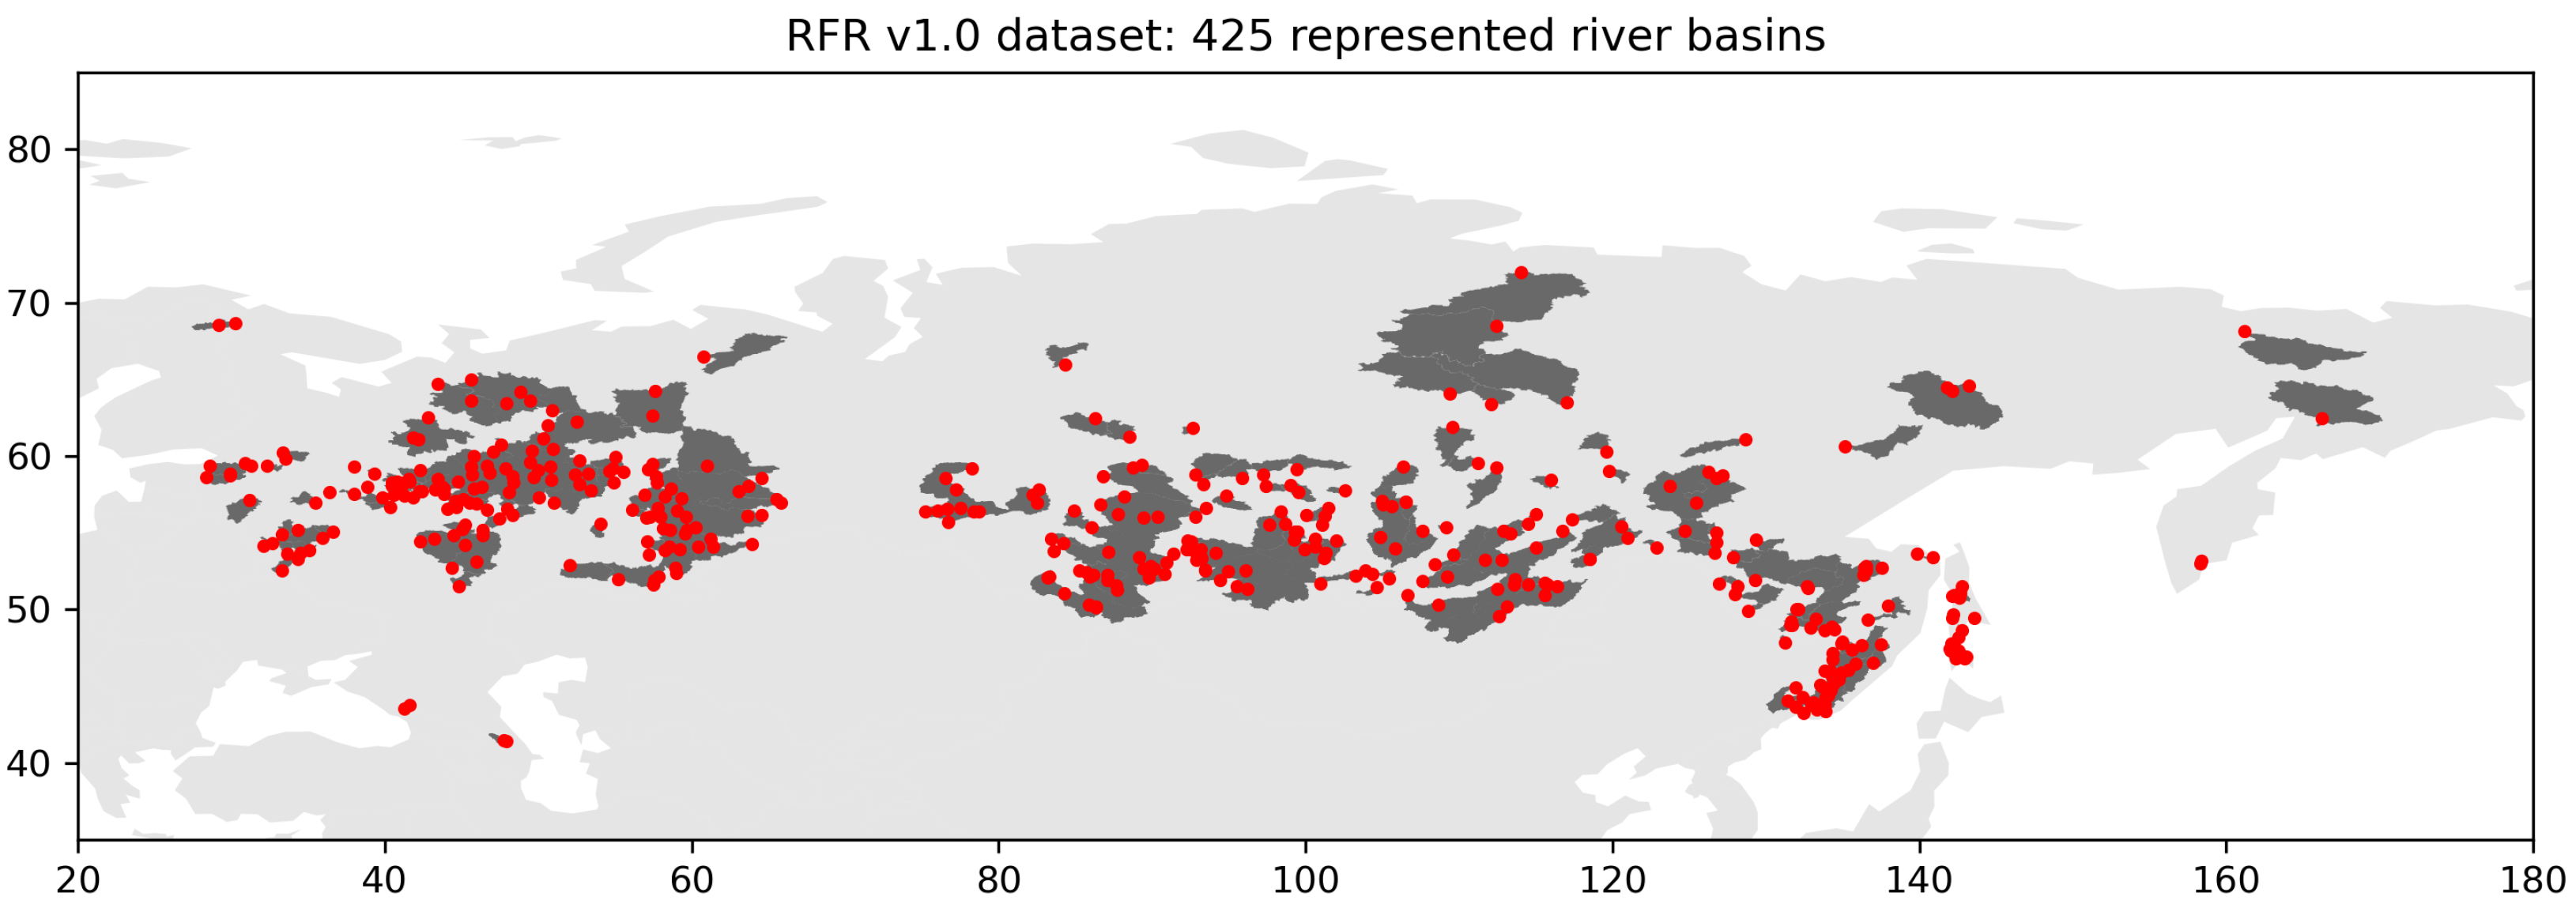
To fill this gap, we present Runoff for Russia (RFR v1.0, [13]), the large-sample dataset of simulated runoff and its characteristics for 425 river basins across Russia (Figure 1). The dataset covers both historical (1979–2016) and projected (2017–2099) periods, which helps to assess ongoing, as well as expected, changes in river runoff and their corresponding characteristics (e.g., volume and timing of spring flood). The presented dataset is based on global meteorological data distributed by the ISIMIP project and the HBV hydrological model, which utilizes the corresponding data as forcing and calculates the respective runoff. In addition to basin-averaged meteorological forcing and runoff predictions, RFR consists of a large number of their characteristics: 68 meteo-related and 191 runoff-related characteristics. All data for the projected period are obtained using meteorological forcing provided by four GCMs (GFDL-ESM2M, HadGEM2-ES, IPSL-CM5A-LR, and MIROC5) and three RCPs (RCP2.6, RCP6.0, and RCP8.5) to account for related uncertainties and different scenarios of future climate. The respective GCMs differ by the way they represent the complex structure of atmospheric processes [4,6,8]. The respective RCPs describe different trajectories of global warming, depicting a possible range of radiative forcing values in the year 2100, i.e., 2.6, 6.0, and 8.5 W/m2. Thus, in general, larger values describe a warmer atmosphere with a more aggressive rise of greenhouse gas emissions [4]. We should mention that the use of a large-sample approach is in line with the current trends in hydrological data production [14,15,16] and provides a robust way of assessing current and future hydro-meteorological variables at large scales (i.e., regional and national).
The presented dataset has a prominent potential benefit for society (both academic and civil). One could widely utilize it for scientifically-based decision-making in adaptation to climate change and mitigation of possible consequences of respective runoff changes and their characteristics.
2. Data Description
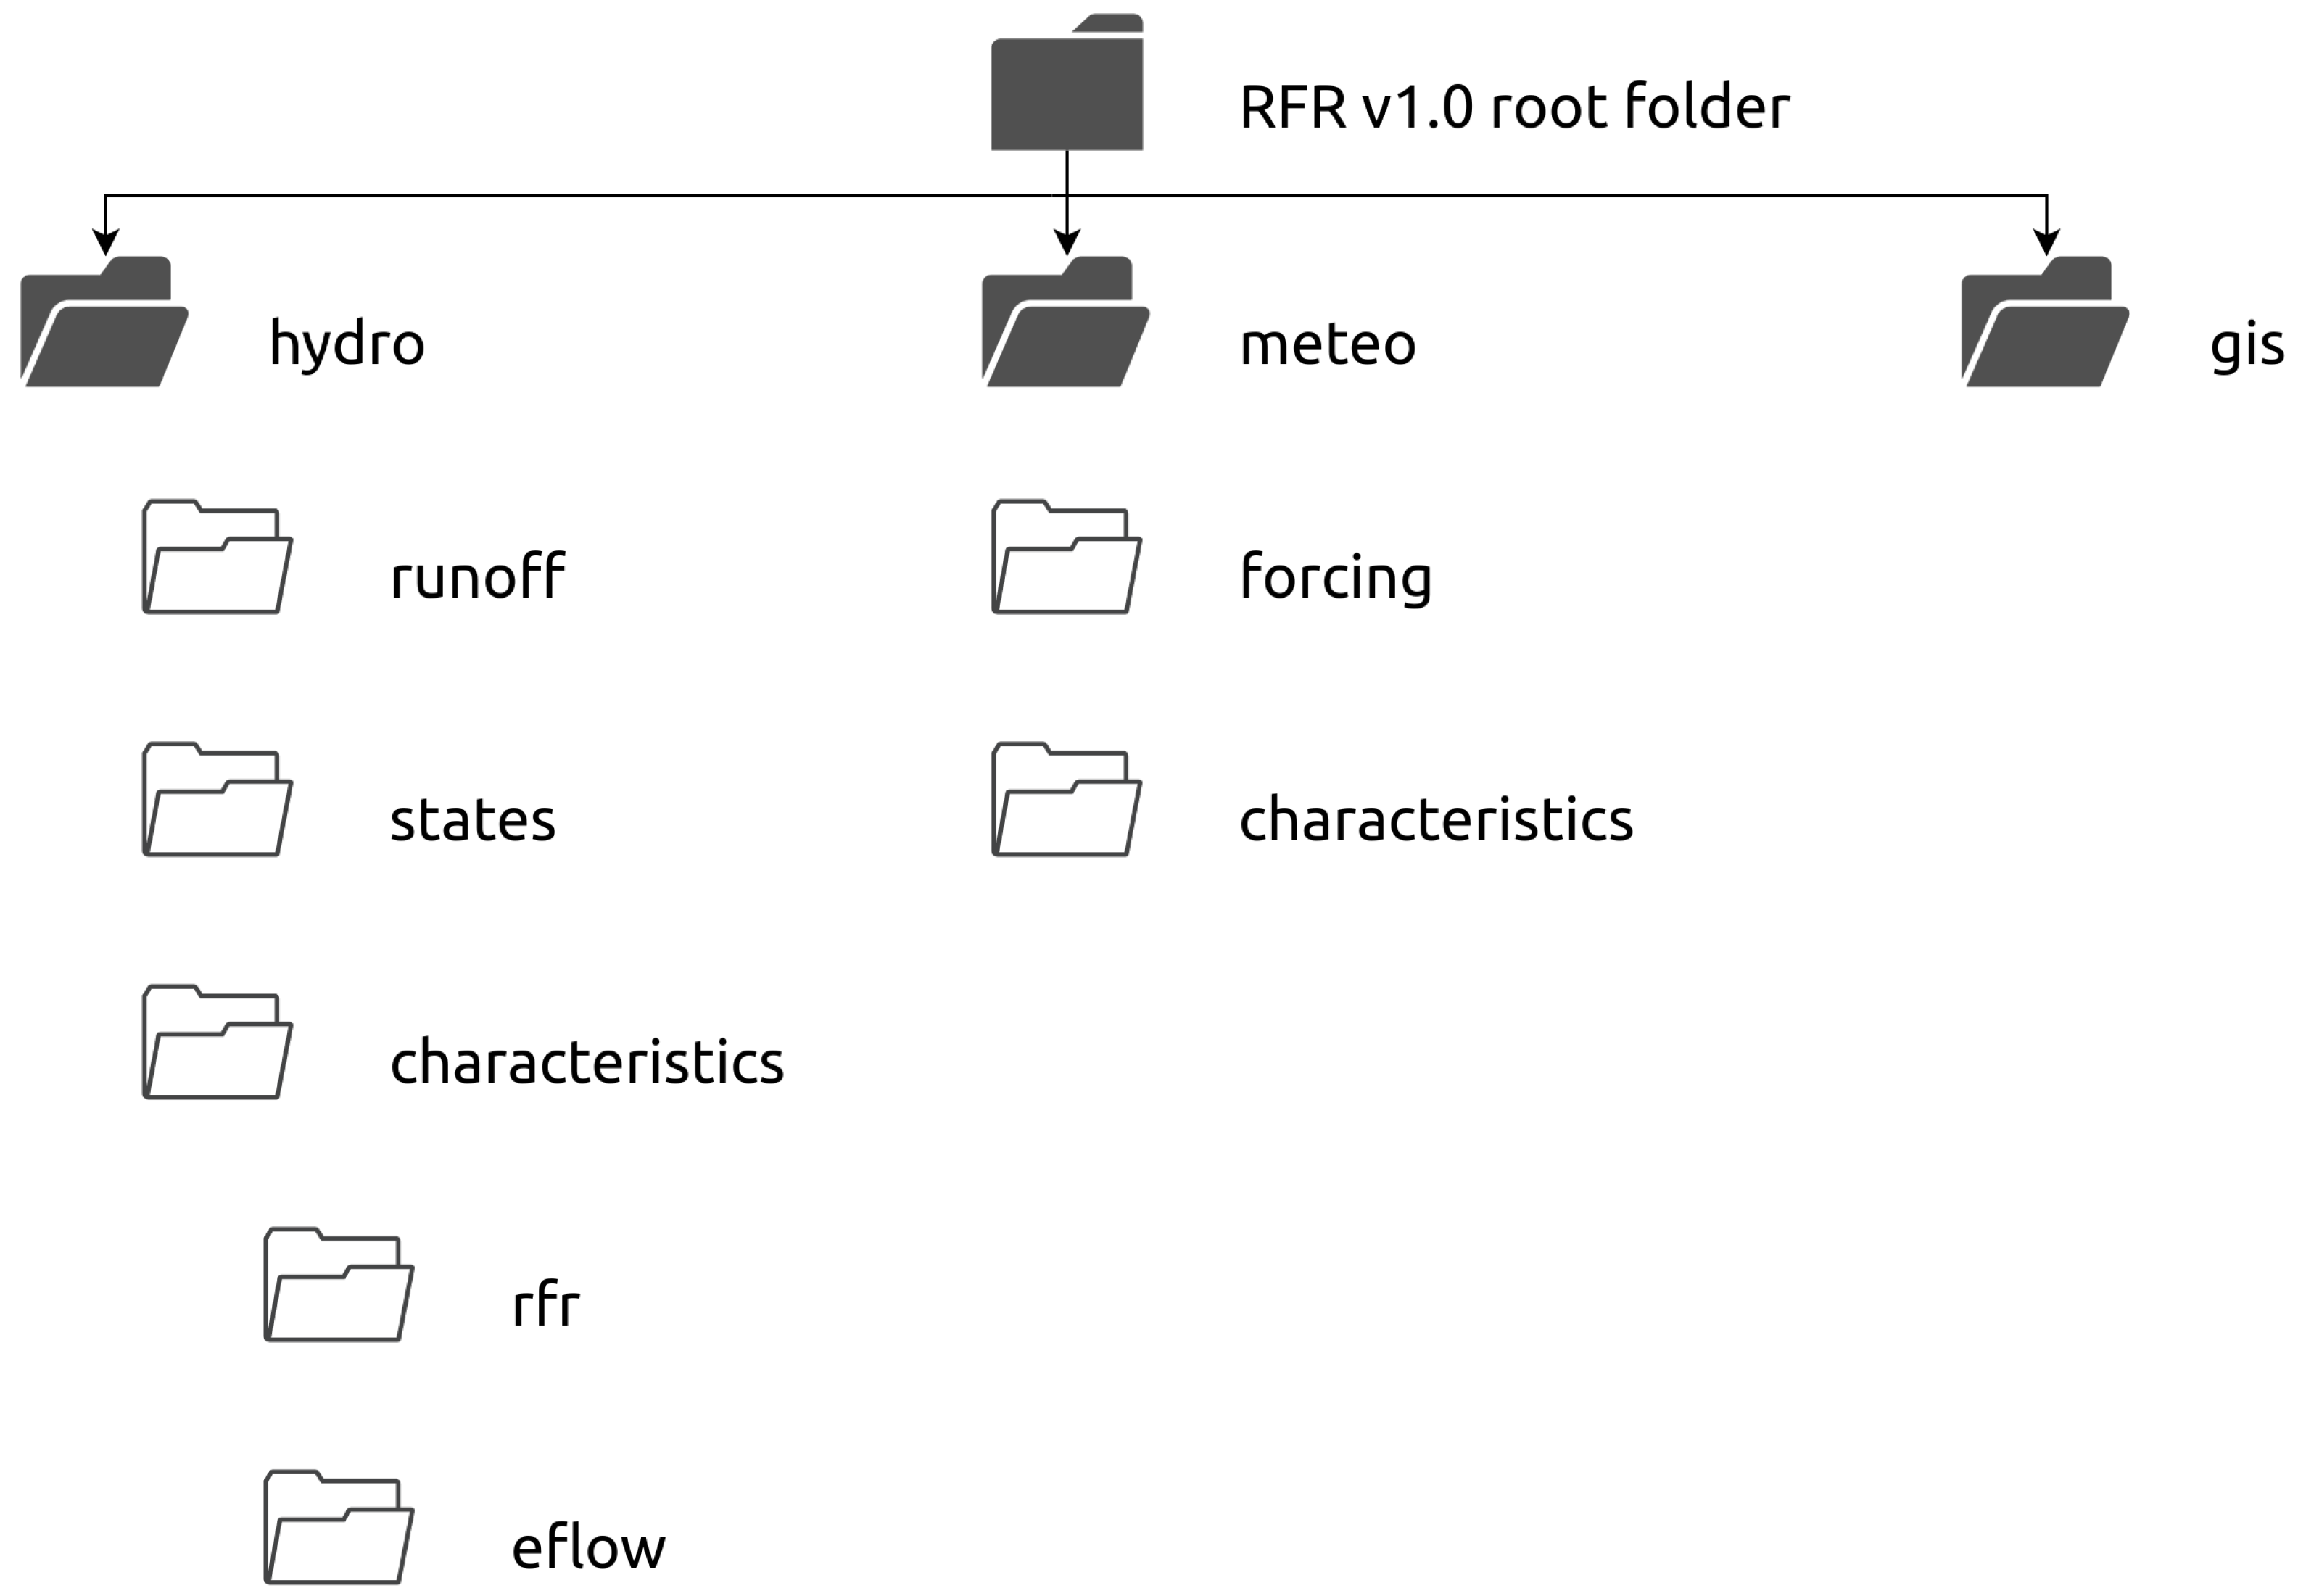
The RFR v1.0 dataset [13] is distributed as a single compressed archive in a “tar.gz” format. After extraction ($ tar-xf RFR_v1.0.tar.gz), the dataset represents a standard structure of nested folders with machine-readable files (in “.csv” and “.geojson” formats). The dataset can be divided into three parts (Figure 2): the main part consists of hydrological (folder hydro) data and the two auxiliary parts include meteorological (folder meteo) data with the related geospatial information (folder gis).
Despite the fact that the full dataset’s name only features runoff and its characteristics, RFR v1.0 also provides meteorological and geospatial data to ensure the seamless assessment of the wide range of inter-connected hydro-meteorological variables and attributes.
2.1. Hydrological Data (Folder: Hydro)
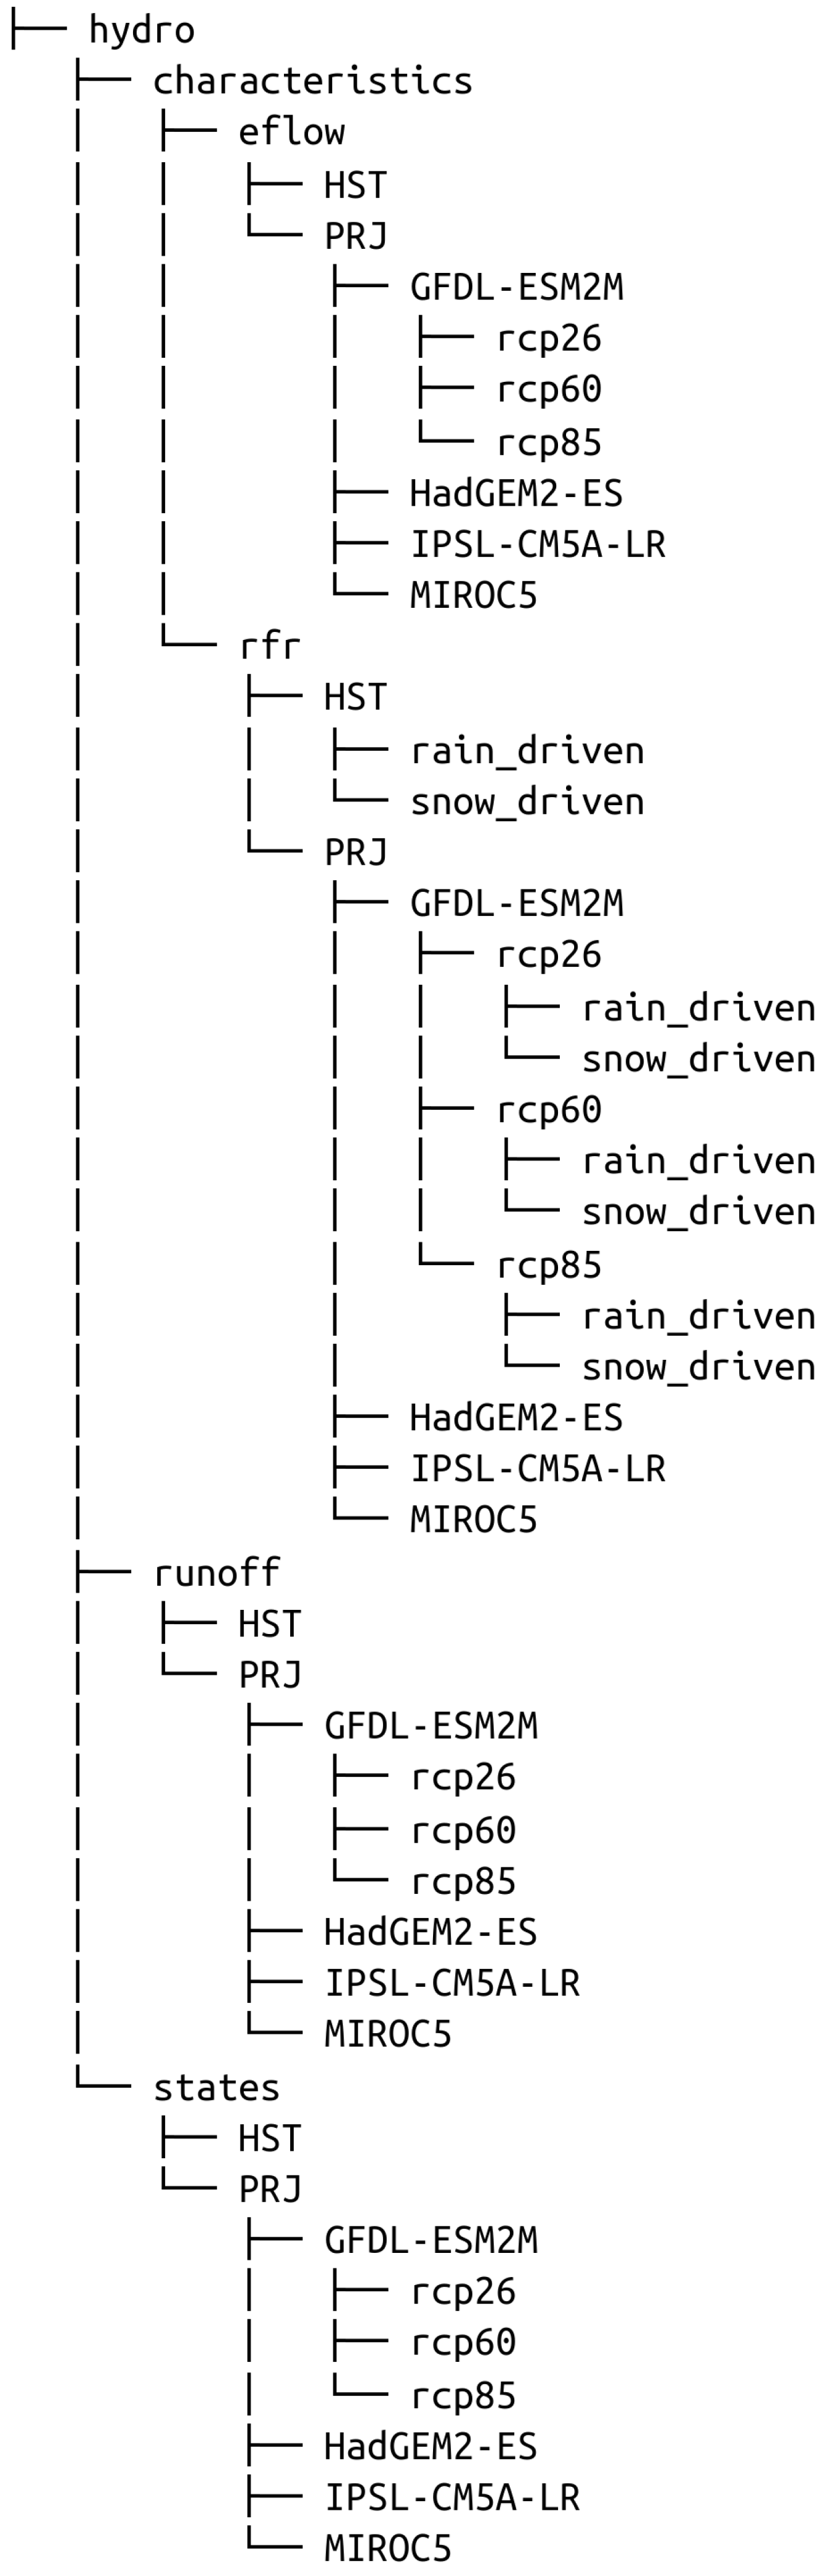
Hydrological data consists of two main parts (Figure 3):
- 1.
- Hydrological model outputs (folders runoff and states),
- 2.
- Runoff characteristics (folder characteristics).
2.1.1. Hydrological Model Outputs
There are two types of hydrological model outputs that are presented in the RFR dataset:
- (1)
- Runoff (folder runoff);
- (2)
- Model states (folder states).
There are two nested folders in both the runoff and states folders, which represent historical (HST folder, 1979–2016) and projected (PRJ folder, 2017–2099) periods, respectively. Inside the HST folder, one will find 425 individual “.csv” files, separated according to the number of river basins (Figure 1). The PRJ folder includes four nested folders according to the number of GCM used (GFDL-ESM2M, HadGEM2-ES, IPSL-CM5A-LR, and MIROC5), each of which contains three more subfolders according to the number of RCP used (rcp26, rcp60, rcp85). Then, each subfolder (e.g., runoff/PRJ/GFDL-ESM2M/rcp26) consists of 425 individual “.csv” files according to the number of presented river basins. Each individual “.csv” file has an identification number as a name and includes the following columns according to the represented variable (daily temporal resolution):
- runoff
- –
- date index column (DD-MM-YYYY format);
- –
- ‘runoff’ (predicted river runoff, mm/day).
- states
- –
- date index column (DD-MM-YYYY format);
- –
- ‘soilstore’ (state of the soil reservoir that could characterize soil moisture dynamics, mm);
- –
- ‘snowpack’ (snow water equivalent, mm);
- –
- ‘meltwater’ (predicted amount of melted water mm).
2.1.2. Runoff Characteristics
There are two sets of runoff characteristics: the author’s set (folder rfr) and the set that is based on the eflowcalc software package [17] (folder eflow). Each set is organized in the same way as the hydrological model outputs data: there are separate folders: historical (HST folder, 1979–2016); and projected periods (PRJ folder, 2017–2099). Similarly, each projected period includes subfolders for the respective GCMs and RCPs (Figure 3). Runoff characteristics are calculated for the hydrological year (1 November–31 October).
The author’s set of characteristics is also divided into two subsets of snow-driven (subfolder snow_driven) and rain-driven (subfolder rain_driven) characteristics.
Individual “.csv” files include the following snow-driven characteristics:
- ‘sf_start’ (spring flood beginning, day from the 1 November);
- ‘sf_end’ (spring flood end, day from the 1 November);
- ‘sf_dur’ (spring flood duration, days);
- ‘sf_vol’ (spring flood runoff volume, mm);
- ‘sf_vol_ratio’ (ratio of spring flood runoff volume to total runoff volume, unitless);
- ‘sf_maxQ’ (spring flood maximum runoff, mm);
- ‘sf_maxd’ (day of spring flood maximum runoff, day from the 1 November);
- ‘sf_peaks_num’ (number of runoff peak during spring flood);
- ‘sf_mgn’ (spring flood magnitude, mm);
- ‘bfi’ (baseflow index, ratio between baseflow and total runoff volumes, unitless);
- ‘rf_vol’ (rain flood volume, mm);
- ‘rf_vol_ratio’ (ratio of rain flood volume to total runoff volume);
- ‘rf_maxQ’ (maximum runoff of rain flood, mm);
- ‘rf_maxd’ (day of rain flood maximum runoff, day from the 1 November);
- ‘rf_peaks_num’ (number of runoff peak during rain floods);
- ‘rf_periods_number’ (number of rain floods);
- ‘rf_duration_max’ (maximum duration of rain floods, days);
- ‘rf_duration_min’ (minimum duration of rain floods, days);
- ‘rf_duration_mean’ (mean duration of rain floods, days);
- ‘sf_ratio’ (, spring-flood-related ratio, unitless);
- ‘mar’ (mean annual runoff, mm).
Individual “.csv” files include the following rain-driven characteristics:
- ‘flood_ratio’ (ratio of flood volume to total runoff volume);
- ‘bfi’ (baseflow index, ratio between baseflow and total runoff volumes, unitless);
- ‘peaks_num’ (number of flood peaks);
- ‘maxQ’ (maximum runoff, mm);
- ‘maxd’ (day of maximum runoff, day from the 1 November);
- ‘mgn’ (runoff magnitude, mm);
- ‘fl_periods_number’ (number of flood periods);
- ‘fl_duration_max’ (maximum duration of floods, days);
- ‘fl_duration_min’ (minimum duration of floods, days);
- ‘fl_duration_mean’ (mean duration of floods, days);
- ‘mar’ (mean annual runoff, mm).
For the set based on the eflowcalc software package, individual “.csv” files include information about 159 runoff characteristics. For brevity, we refer to the documentation of the eflowcalc package, that provides a complete description of all calculated features [18].
2.2. Meteorological Data (Folder: Meteo)
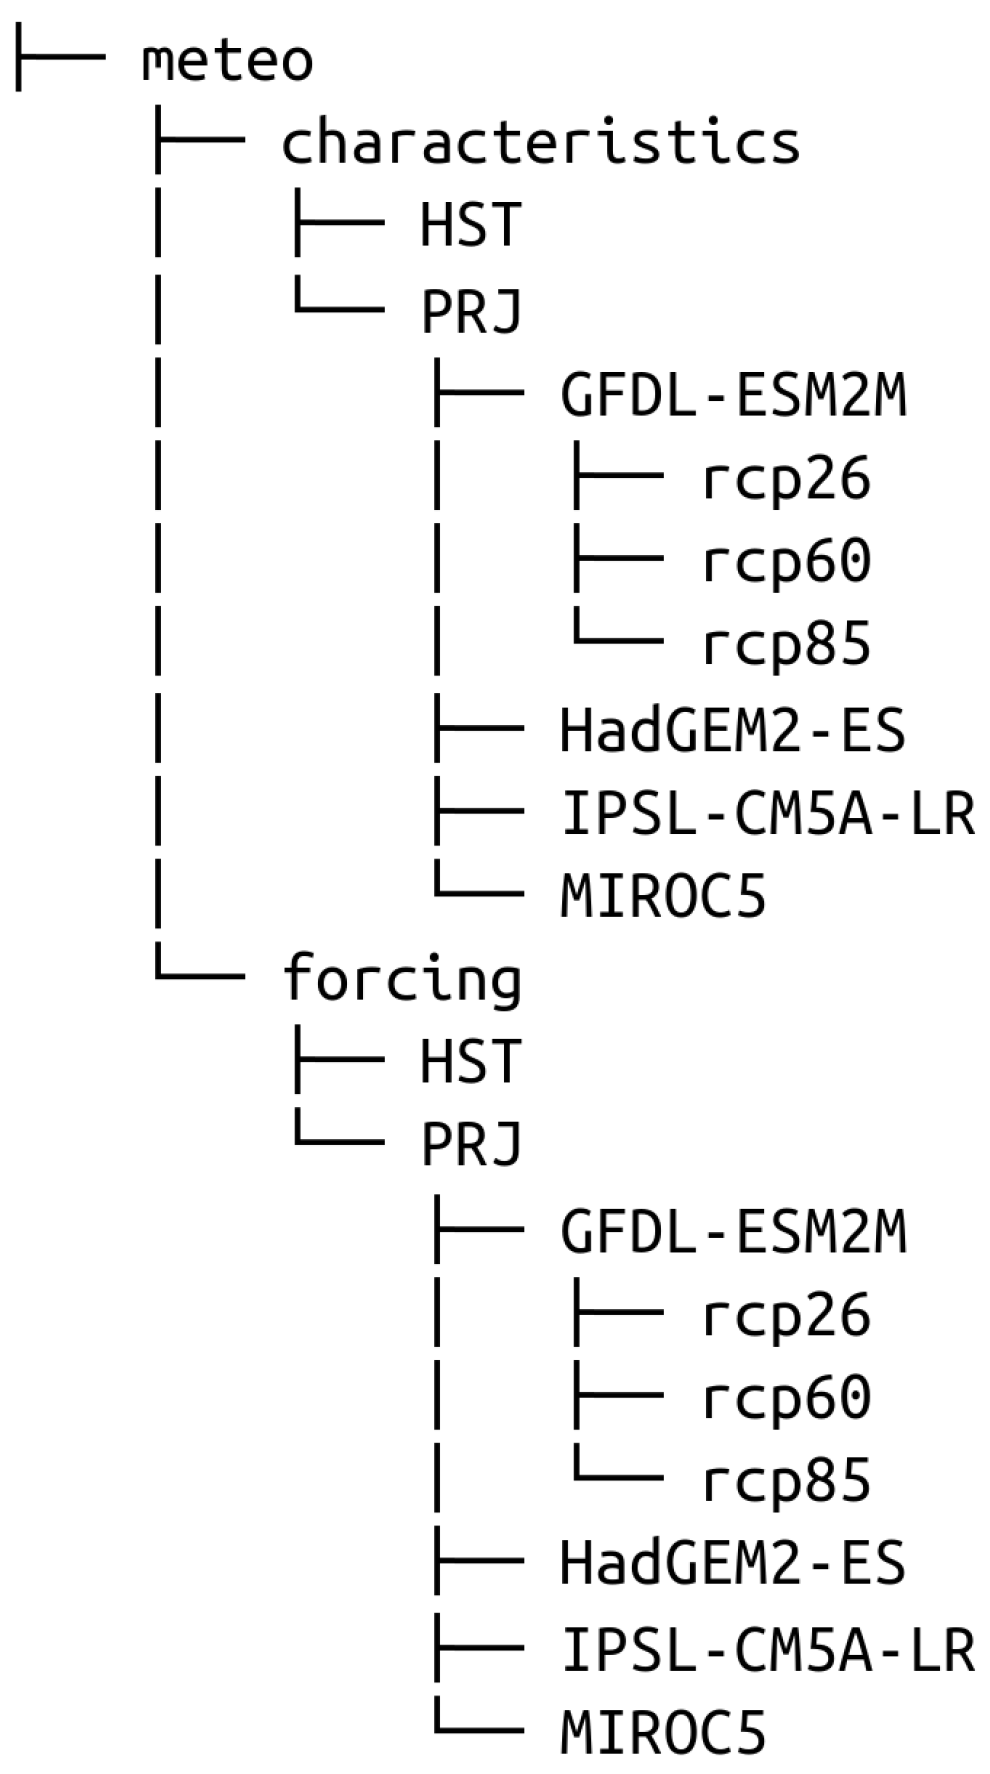
The organizational structure of meteorological data is similar to the hydrological data (Figure 4). There are two nested parts—meteorological forcing data (folder forcing) and characteristics (folder characteristics). Both of these parts include subfolders for historical (HST folder, 1979–2016) and projected (PRJ folder, 2017–2099) periods, respectively. In turn, projected period data include subfolders for the respective GCMs and RCPs. For consistency with the hydrological part, meteorological characteristics have also been computed for the hydrological year (1 November–31 October).
Each end-level subfolder with meteorological forcing (folder forcing) includes 425 individual “.csv” files according to the number of river basins (Figure 1). These “.csv” files represent the following information at daily temporal resolution:
- date index column (DD-MM-YYYY format);
- ‘T’ (mean air temperature, °C);
- ‘P’ (precipitation, mm/day);
- ‘PET’ (potential evaporation, mm/day).
Individual “.csv” files with meteorological characteristics include 68 characteristics: 20 have been computed annually and the remaining 48 represent monthly statistics (4 variables by 12 months).
Annual characteristics are the following:
- ‘T_mean’ (mean annual temperature, °C);
- ‘T_min’ (minimum annual temperature, °C);
- ‘T_max’ (maximum annual temperature, °C);
- ‘T_numdays_belowzero’ (number of days with mean daily temperature below zero);
- ‘T_numdays_thaw’ (number of days with above zero temperatures while snow);
- ‘T_sum_thaw’ (sum of air temperatures while thaw, °C);
- ‘P_sum’ (total annual of precipitation, mm);
- ‘P_max’ (maximum daily precipitation, mm);
- ‘P_numdays_rain’ (number of days with rain);
- ‘P_numdays_snow’ (number of days with snow);
- ‘P_sum_rain’ (sum of liquid precipitation, mm);
- ‘P_sum_snow’ (sum of solid precipitation, mm);
- ‘P_ratio_rain’ (ratio of liquid to total precipitation, unitless);
- ‘P_numdays_rainonsnow’ (number of days with rain-on-snow);
- ‘P_sum_rainonsnow’ (rain-on-snow precipitation sum, mm);
- ‘P_ratio_rainonsnow’ (ratio of rain-on-snow to total precipitation, unitless);
- ‘PET_sum’ (total annual potential evaporation, mm);
- ‘Snowpack_mean’ (mean snow water equivalent, mm);
- ‘Snowpack_max’ (max snow water equivalent, mm);
- ‘Snowpack_numdays’ (number of days while snow).
Monthly characteristics are the following:
- ‘T_mean_(1...12)’ (mean monthly air temperature, °C);
- ‘T_sum_(1...12) (sum of monthly temperatures, °C)’;
- ‘P_sum_(1...12)’ (monthly precipitation, mm);
- ‘PET_sum_(1...12) (monthly potential evaporation, mm)’.
2.3. GIS Data (Folder: Gis)
The RFR dataset consists of folder, which includes two files in “.geojson” format: (1) “basins.geojson” and (2) “hydroatlas.geojson”. These files aim to support the set of hydro-meteorological characteristics with geospatial data. The Geojson format has been selected, as it is widely used in GIS software and corresponding tools for geospatial data analysis.
The file “basins.geojson” includes the following columns that describe the characteristics of presented river basins:
- ‘idx’ (numerical index, number);
- ‘county’ (water management county, number);
- ‘name_ru’ (basin name in Russian Cyrillic letters);
- ‘name_en’ (basin name in English);
- ‘area’ (basin area based on AIS directory, km);
- ‘area_merit’ (basin area based on MERIT data [19], km2);
- ‘lat’ (latitude, degrees);
- ‘lon’ (longitude, degrees);
- ‘geometry’ (spatial representation of basin compatibe with geojson format).
For compatibility with “basins.geojson”, the file “hydroatlas.geojson” has four identical columns: ‘idx’, ‘lat’, ‘lon’, ‘geometry’. The description of the remaining 107 columns can be accessed on the HydroATLAS website [20].
3. Methods and Input Data
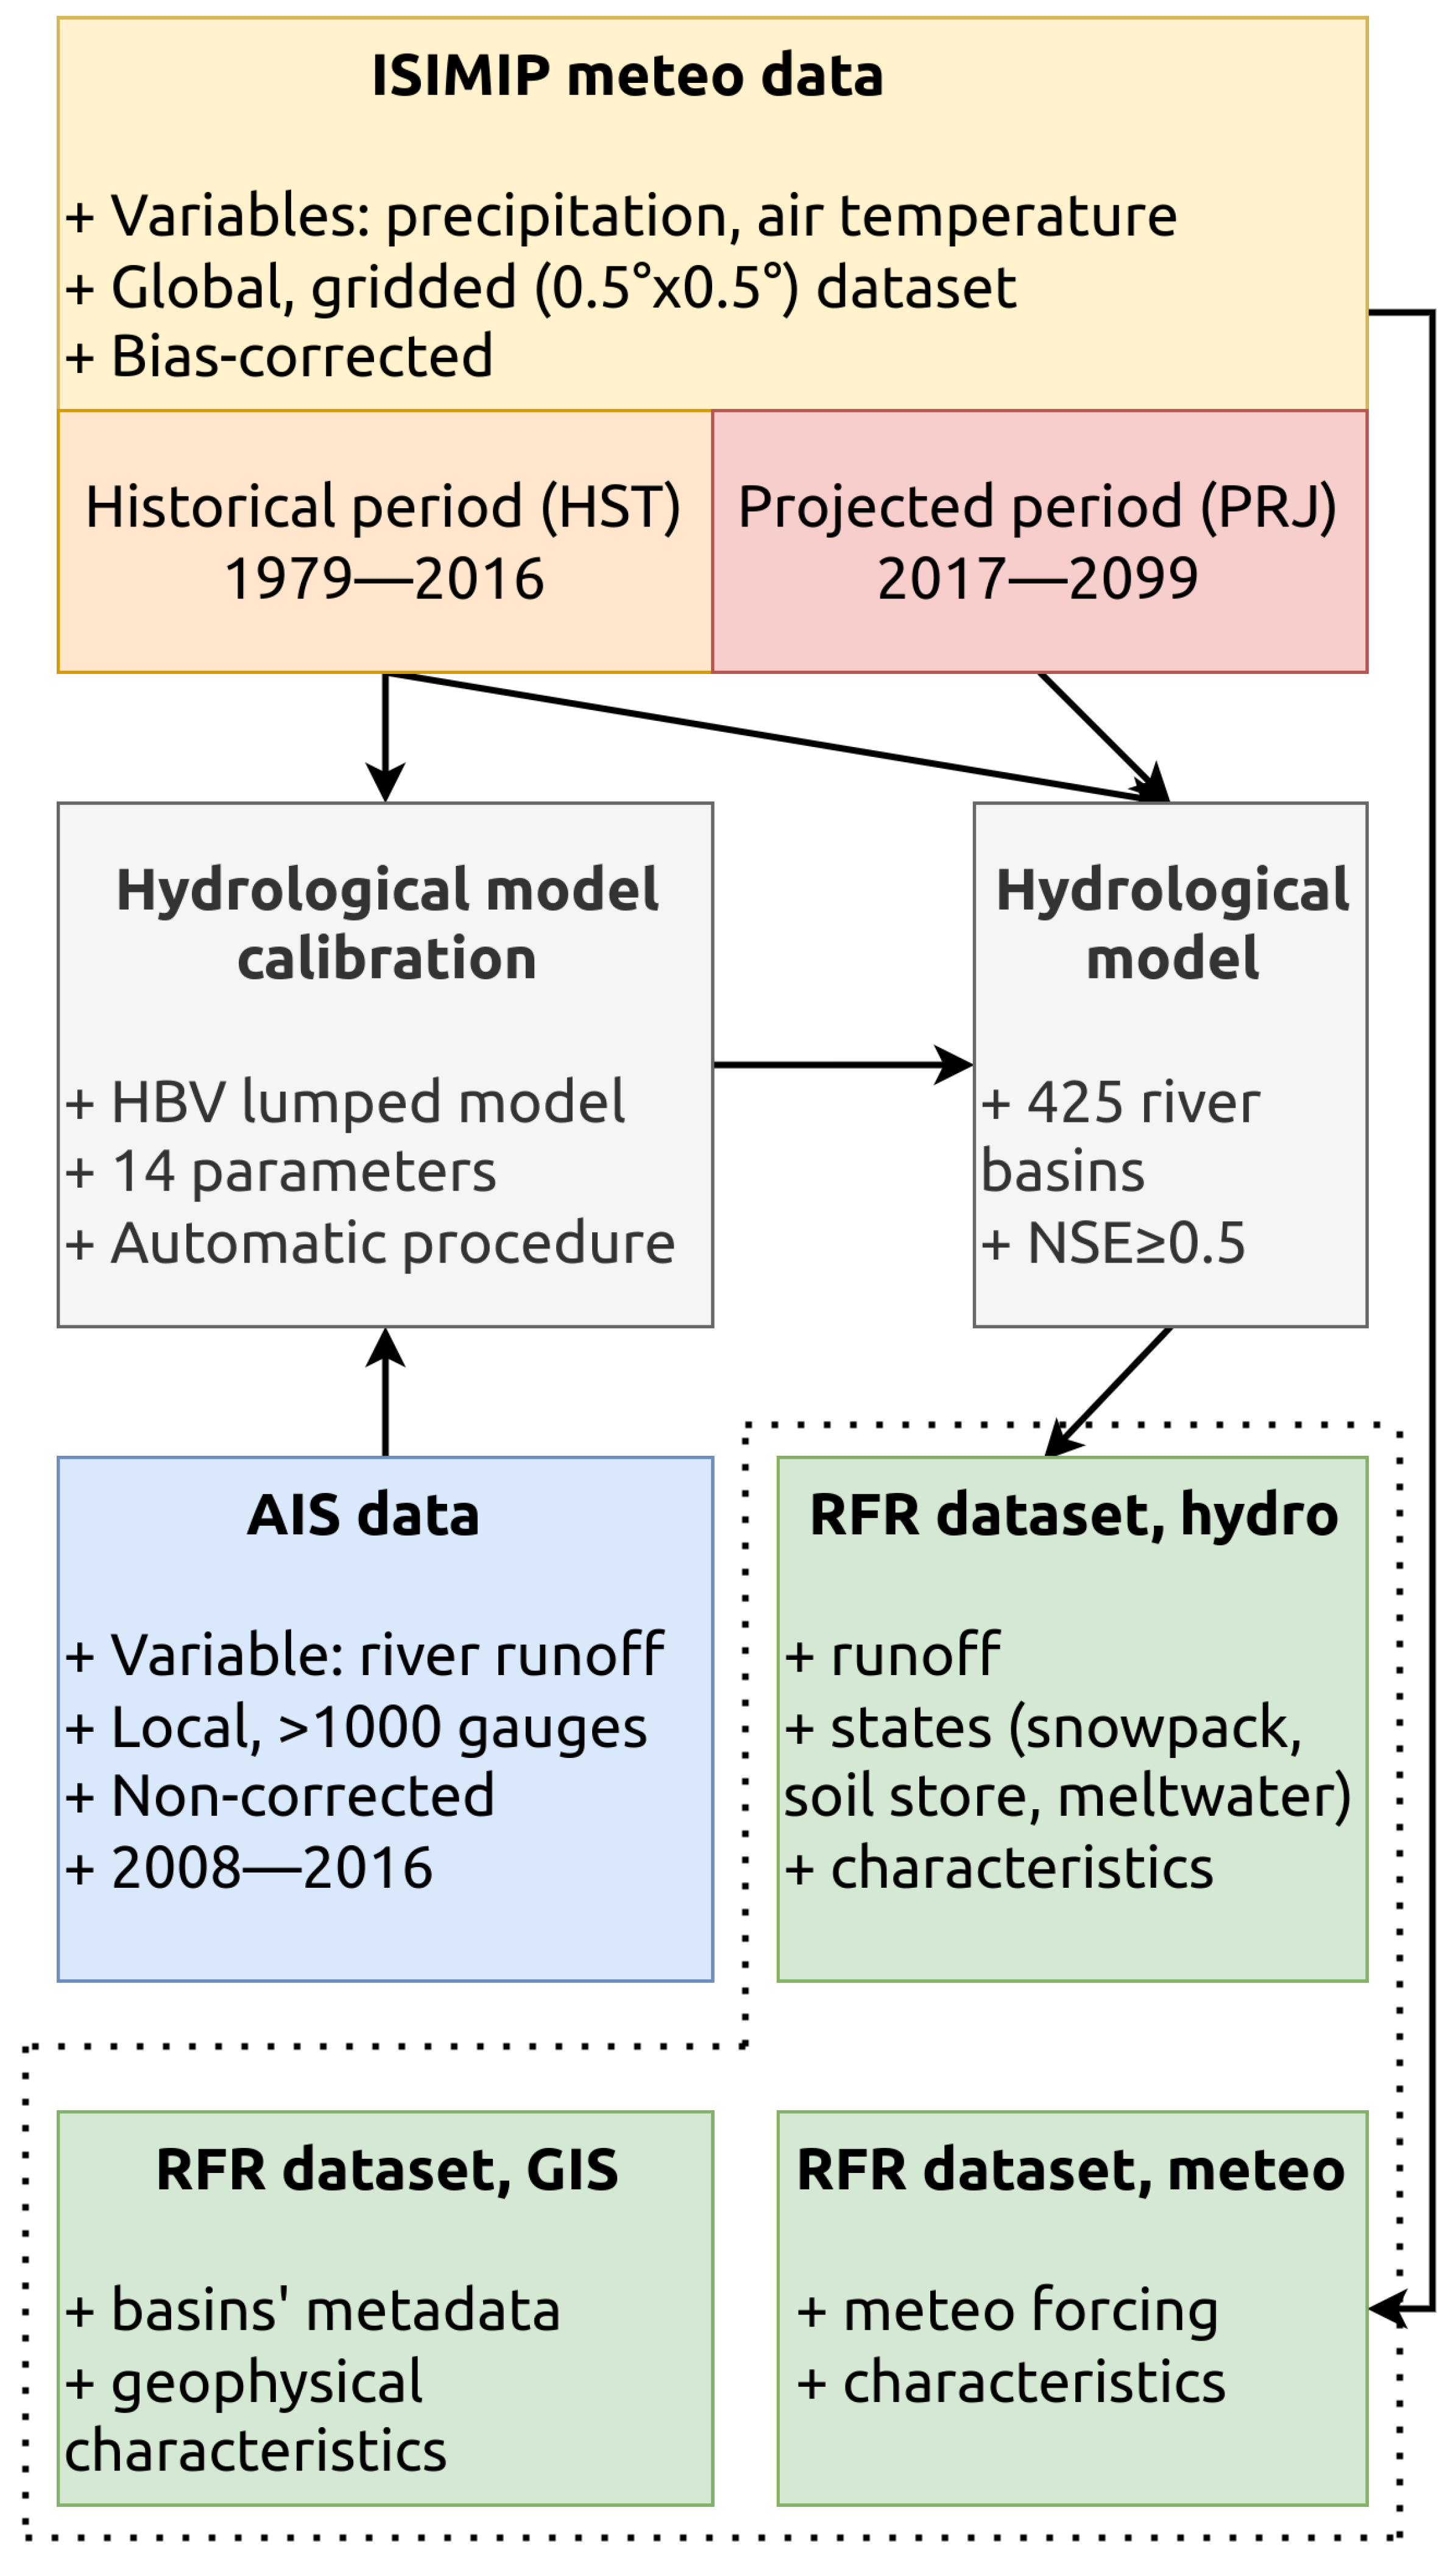
Figure 5 represents the core research workflow. The general idea of the presented workflow is to propagate meteorological data through the robust hydrological model to derive reliable estimates of runoff, snowpack, and soil moisture dynamics that form the baseline for calculating runoff characteristics. The presented workflow follows the state of the art practices in the field of hydrological modeling and has already been implemented by authors in several studies for the different regions of the globe [21,22,23,24].
3.1. Input Data
We use two input data sources to support the RFR dataset’s development. First, the collection of ISIMIP meteorological data [25,26,27]. This data source consists of gridded estimates of precipitation and air temperature data that have undergone multiple bias correction procedures and statistical down-scaling. The datasets have global coverage with daily temporal resolution and 0.5× 0.5 spatial resolution. Two periods are covered: historical (HST, 1979–2016) and projected (PRJ, 2017–2099). For the projected period, the output time series of four GCMs (GFDL-ESM2M, HadGEM2-ES, IPSL-CM5A-LR, and MIROC5) driven with three RCP scenarios (RCP 2.6, RCP 6.0, and RCP 8.5) are used for the correction procedures and utilized for further development. The presented set of ISIMIP meteorological data have been successfully used as a reliable source of meteorological forcing data for a wide range of hydrological models and river basins worldwide [9,10,11,12,21,28,29].
The second source is observed runoff time series for hundreds of gauges across Russia, which we use for model parameter calibration (in m/s). The corresponding data are available at the website of the Automated Information System for State Monitoring of Water Bodies (AIS; https://gmvo.skniivh.ru, last access: 8 November 2022). The respective observations have been made on stationary hydrological stations by direct measure of river discharge (in m/s) or by the transformation of measured river stage to discharge using established rating curves. The corresponding datasets are available from 2008 to 2017 (10 years) and distributed in a machine-readable format (.csv).
3.2. Hydrological Modeling
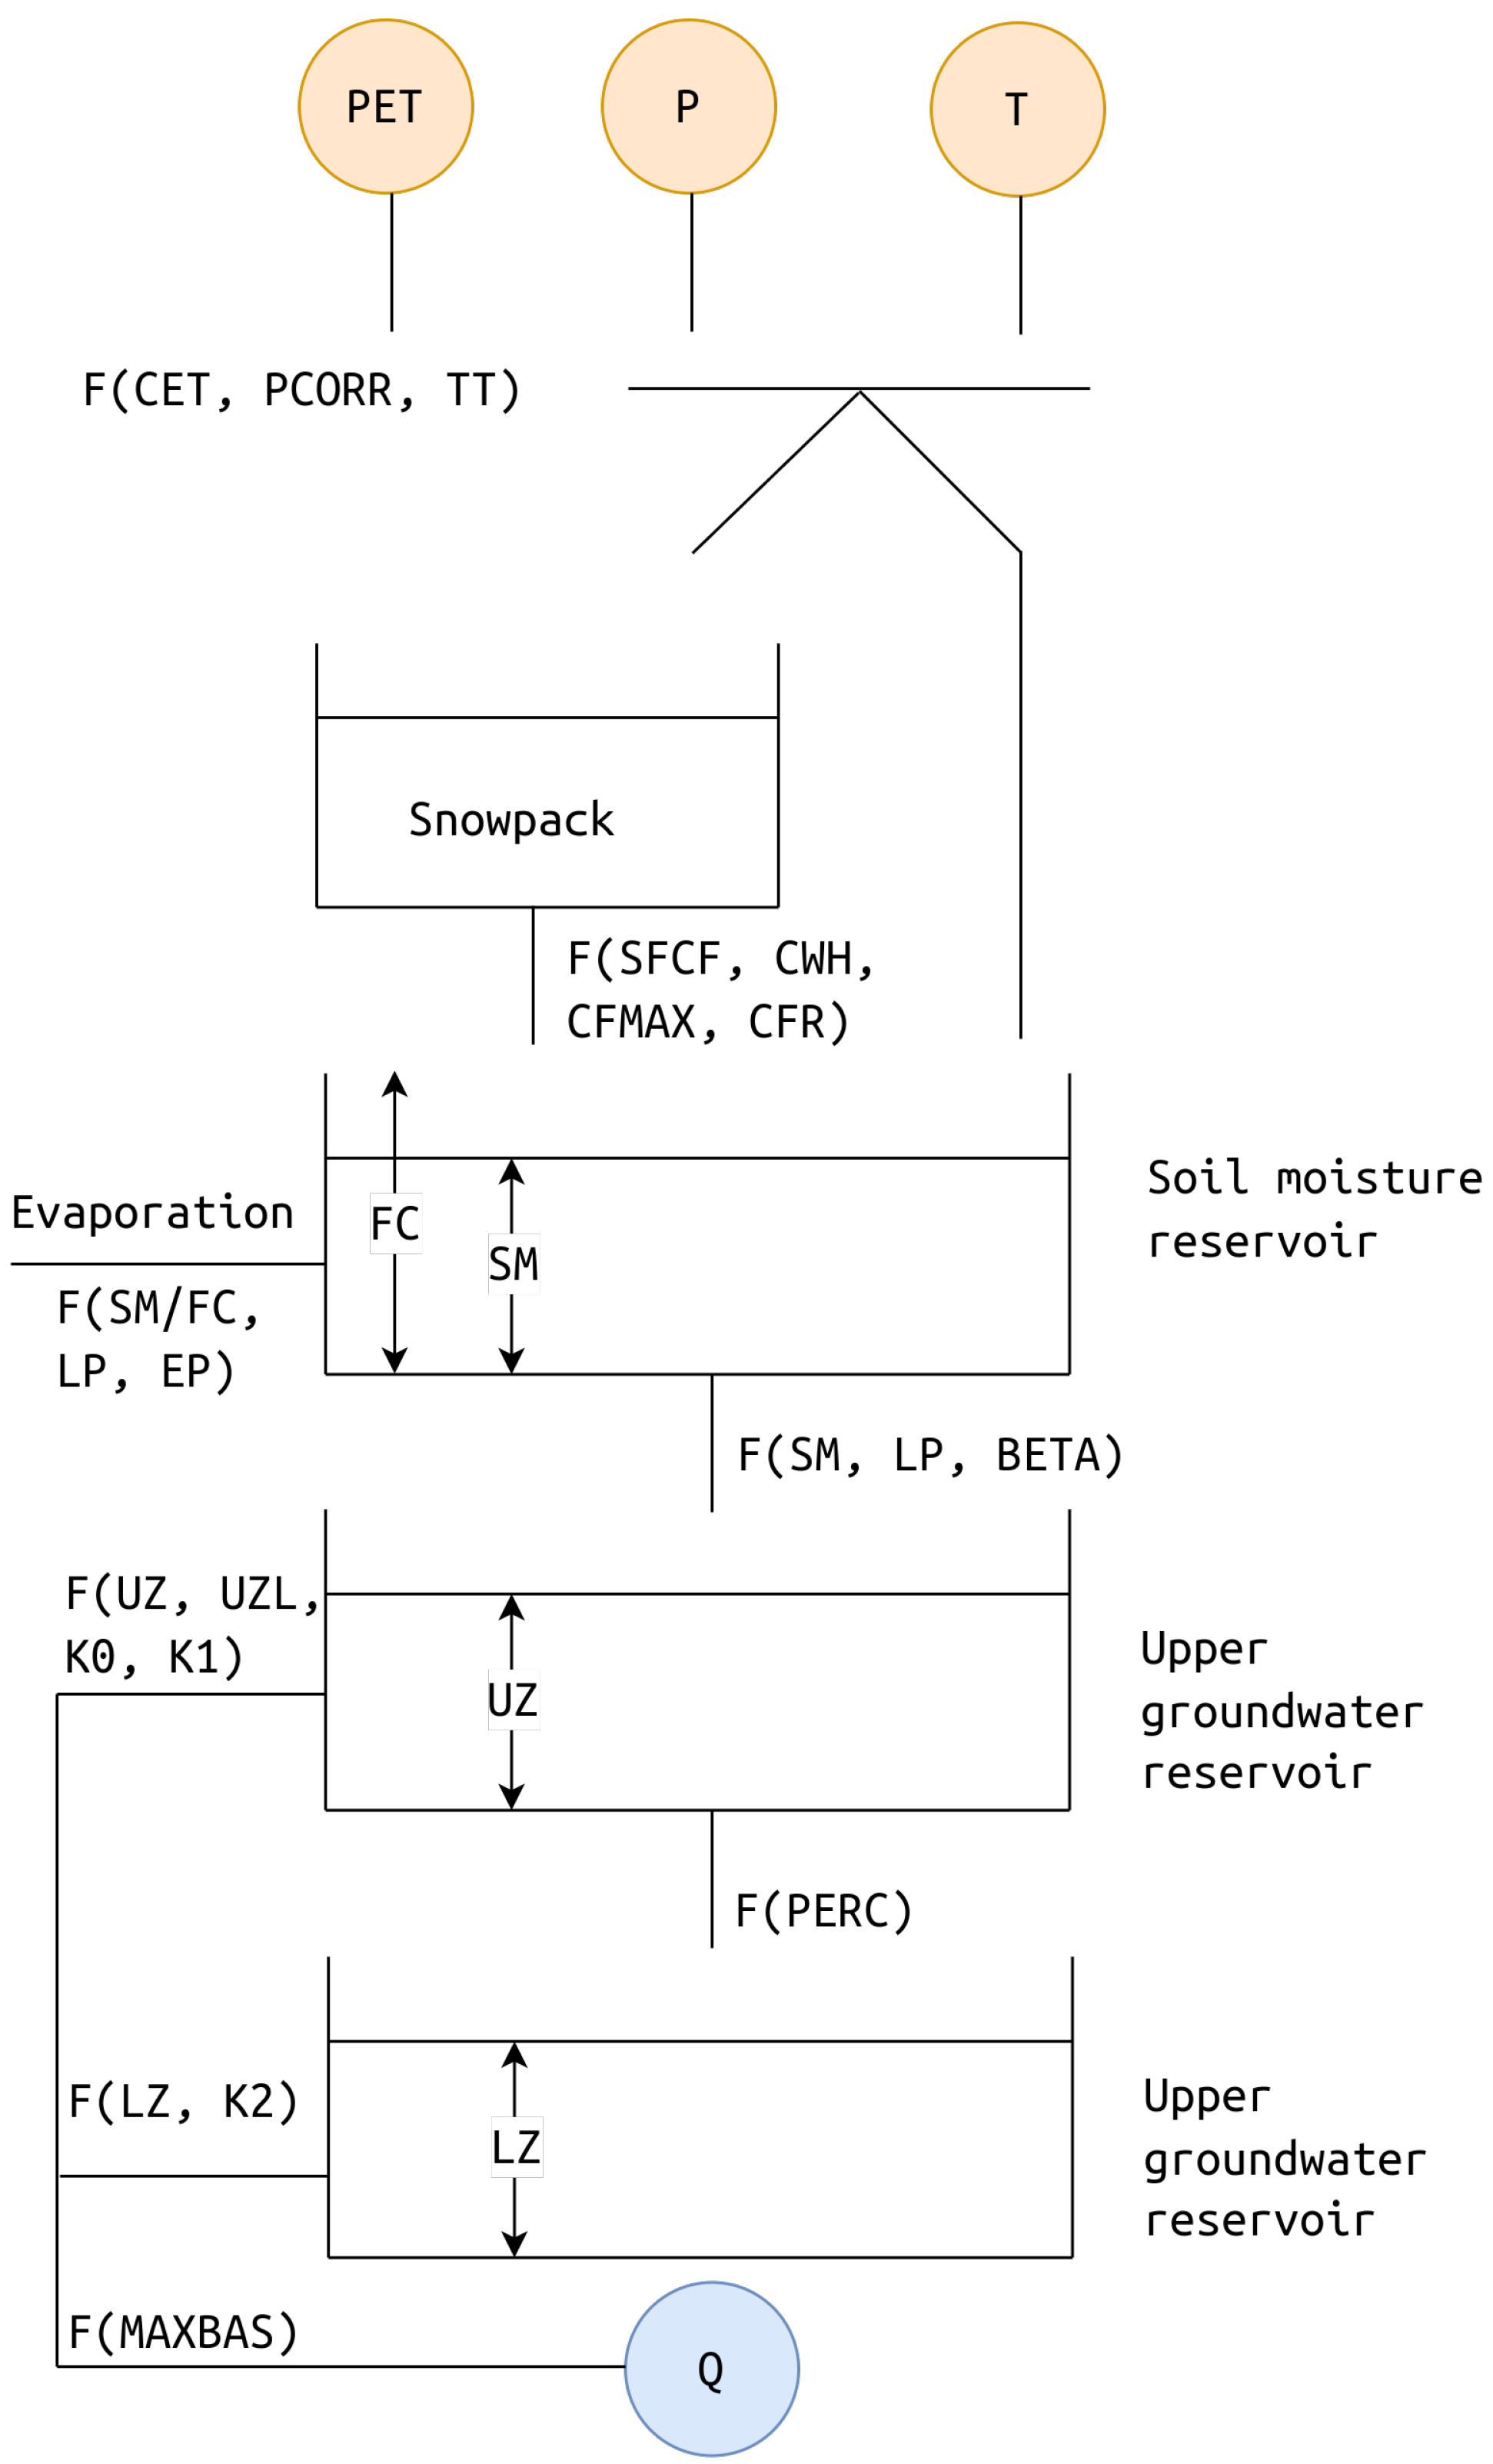
A hydrological model is a core component of the presented workflow (Figure 5). Here, we use the HBV (in Swedish, Hydrologiska Byråns Vattenbalansavdelning) hydrological model [30,31]. HBV is a lumped conceptual hydrological model that represents river runoff formation mechanism at the basin scale using the system of connected storage reservoirs (Figure 6). The model has 14 free parameters to fit a wide range of natural conditions (Table 1). The required input data is a daily time series of air temperature (T, °C), precipitation (P, mm), and potential evaporation (PET, mm). All variables are computed by spatial averaging based on the relative weights of the intersection between basin boundaries and corresponding grid cells of the ISIMIP meteorological data (Section 3.1). Potential evaporation (PE, mm) is calculated using the temperature-based equation proposed in [32].
The model choice is based on a widespread representation and there is a long and successful history of the HBV model being utilized in many hydrological studies for thousands of river basins worldwide [33]. In addition, the HBV model is routinely used to model the impacts of climate change on water resources all over the world [33,34,35]. The authors’ experience with utilizing the HBV model in Russian basins proves its stability and robustness for runoff modeling in various geographical conditions [21,23]. Thus, the selected HBV model is a reliable and solid instrument for runoff simulation on a national scale for a diverse set of river basins and for assessing climate change’s impact on runoff and its characteristics.

Table 1.
Description and calibration ranges for HBV model parameters (based on Beck et al. [36]).
Table 1.
Description and calibration ranges for HBV model parameters (based on Beck et al. [36]).
| Parameters | Description | Calibration Range |
|---|---|---|
| TT | Threshold temperature when precipitation is simulated as snowfall (C) | −2.5–2.5 |
| SFCF | Snowfall gauge undercatch correction factor | 1–1.5 |
| CWH | Water holding capacity of snow | 0–0.2 |
| CFMAX | Melt rate of the snowpack (mm/(day*C)) | 0.5–5 |
| CFR | Refreezing coefficient | 0–0.1 |
| FC | Maximum water storage in the unsaturated-zone store (mm) | 50–700 |
| LP | Soil moisture value above which actual evaporation reaches potential evaporation | 0.3–1 |
| BETA | Shape coefficient of recharge function | 1–6 |
| UZL | Threshold parameter for extra outflow from upper zone (mm) | 0–100 |
| PERC | Maximum percolation to lower zone (mm/day) | 0–6 |
| K0 | Additional recession coefficient of upper groundwater store (1/day) | 0.05–0.99 |
| K1 | Recession coefficient of upper groundwater store (1/day) | 0.01–0.8 |
| K2 | Recession coefficient of lower groundwater store (1/day) | 0.001–0.15 |
| MAXBAS | Length of equilateral triangular weighting function (day) | 1–3 |
For each basin, the optimal values of model parameters have been found by their calibration (numerical optimization) against the entire period of observed runoff time series (Section 3.1). To this end, a global optimization algorithm of differential evolution is used [37]. This algorithm finds a set of optimal model parameters by minimizing the loss function, 1-NSE, where NSE is the Nash–Sutcliffe efficiency coefficient [38]. The NSE coefficient has been selected because of its prominent use and de facto standard in hydrological studies worldwide [39,40,41]. The calibration procedure for each basin ends up with an optimal set of model parameters; we can further use the parameters for runoff prediction using meteorological data as forcing (Figure 5). To ensure the reliability of the predicted runoff, we selected only basins where NSE ≥ 0.5 [42]. This way, 425 individual river basins (Figure 1) were retained for further development.
In the next step, for each of 425 selected river basins, runoff predictions, as well as hydrological models states—soil reservoir dynamics, snow water equivalent, and amount of melted water—are calculated by using historical and projected meteorological data as forcing (Section 2.1.1).
3.3. Runoff and Meteorological Characteristics Calculation
Runoff characteristics are calculated for the hydrological year (1 November–31 October) based on the hydrological model output data: runoff and model states. The eflow set of characteristics (folder hydro/characteristics/eflow) is obtained using the eflowcalc software package [17] and is solely based on runoff time series.
In contrast, the author’s set (folder hydro/characteristics/rfr) utilizes predicted hydrological model states in addition to runoff time series. The calculation of the respective set begins with estimating the hydrological year type: is it snow-driven (a period of continuous snow cover of more than 30 days) or only rain-driven? For snow-driven years, we calculate the set of 21 runoff characteristics (Section 2.1.2), which represents the respective properties of spring flood and rain flood periods, as well as some standard properties (e.g., mean annual runoff). For rain-driven years, the number of calculated characteristics is eleven. The core part of the calculation procedure is runoff hydrograph separation on baseflow (water that flows to the river network from soil and groundwater reservoirs) and quick flow (precipitation or melted water that does not reach soil reservoirs). We utilize the algorithm partially based on B.I. Kudelin’s method [43]. After the automated procedure for hydrograph separation, quickflow and baseflow fraction time series are used to calculate runoff characteristics (Section 2.1.2). The calculation procedure is written in the Python programming language with the use of the scientific software libraries numpy [44] and scipy [45].
For ensuring consistency with the set of runoff characteristics, the collection of meteorological characteristics is also calculated for the hydrological year (1 November–31 October), based on time series of air temperature, precipitation, and evaporation (Section 2.2).
The extra set of geophysical characteristics for the selected 425 river basins is distributed in the “hydroatlas.geojson” file (folder gis) and has been compiled from the original HydroATLAS dataset [46] using spatial averaging and generalization.
The utilized programming code used for runoff and meteorological characteristics calculation is available in the open repository [47] in Jupyter Notebooks and Python scripts.
4. User Notes
In the presented paper, we introduced the RFR v1.0 dataset that combines runoff, meteorological forcing, and multiple hydrometeorological characteristics for 425 river basins across Russia for both historical (1979–2016) and projected (2017–2099) periods. The dataset is based on reliable input data sources—the state runoff observations archive, the ISIMIP (The Inter-Sectoral Impact Model Intercomparison Project) meteorological forcing data [25,26,27]—and a robust hydrological model—HBV [33]. To ensure the high reliability and credibility of runoff predictions and projections, only 425 river basins that passed a calibration threshold (NSE ≥ 0.5) have been used as a core selection for the RFR dataset. Thus, the presented dataset follows the high standards of recent hydrological modeling research and could serve as a reliable basis for further scientific investigations.
Despite the ongoing progress in hydrological modeling and related disciplines, runoff estimates are still prone to many sources of uncertainties that stem from input and calibration data, model structure, and its parameters [48]. Regarding the assessment of climate change’s impact on runoff, the primary source of uncertainties is climate projections sourced from GCMs and RCP scenarios [9,49]. The RFR dataset provides an opportunity to assess and quantify the respective uncertainties by introducing runoff projections calculated based on four GCMs and three RCP scenarios.
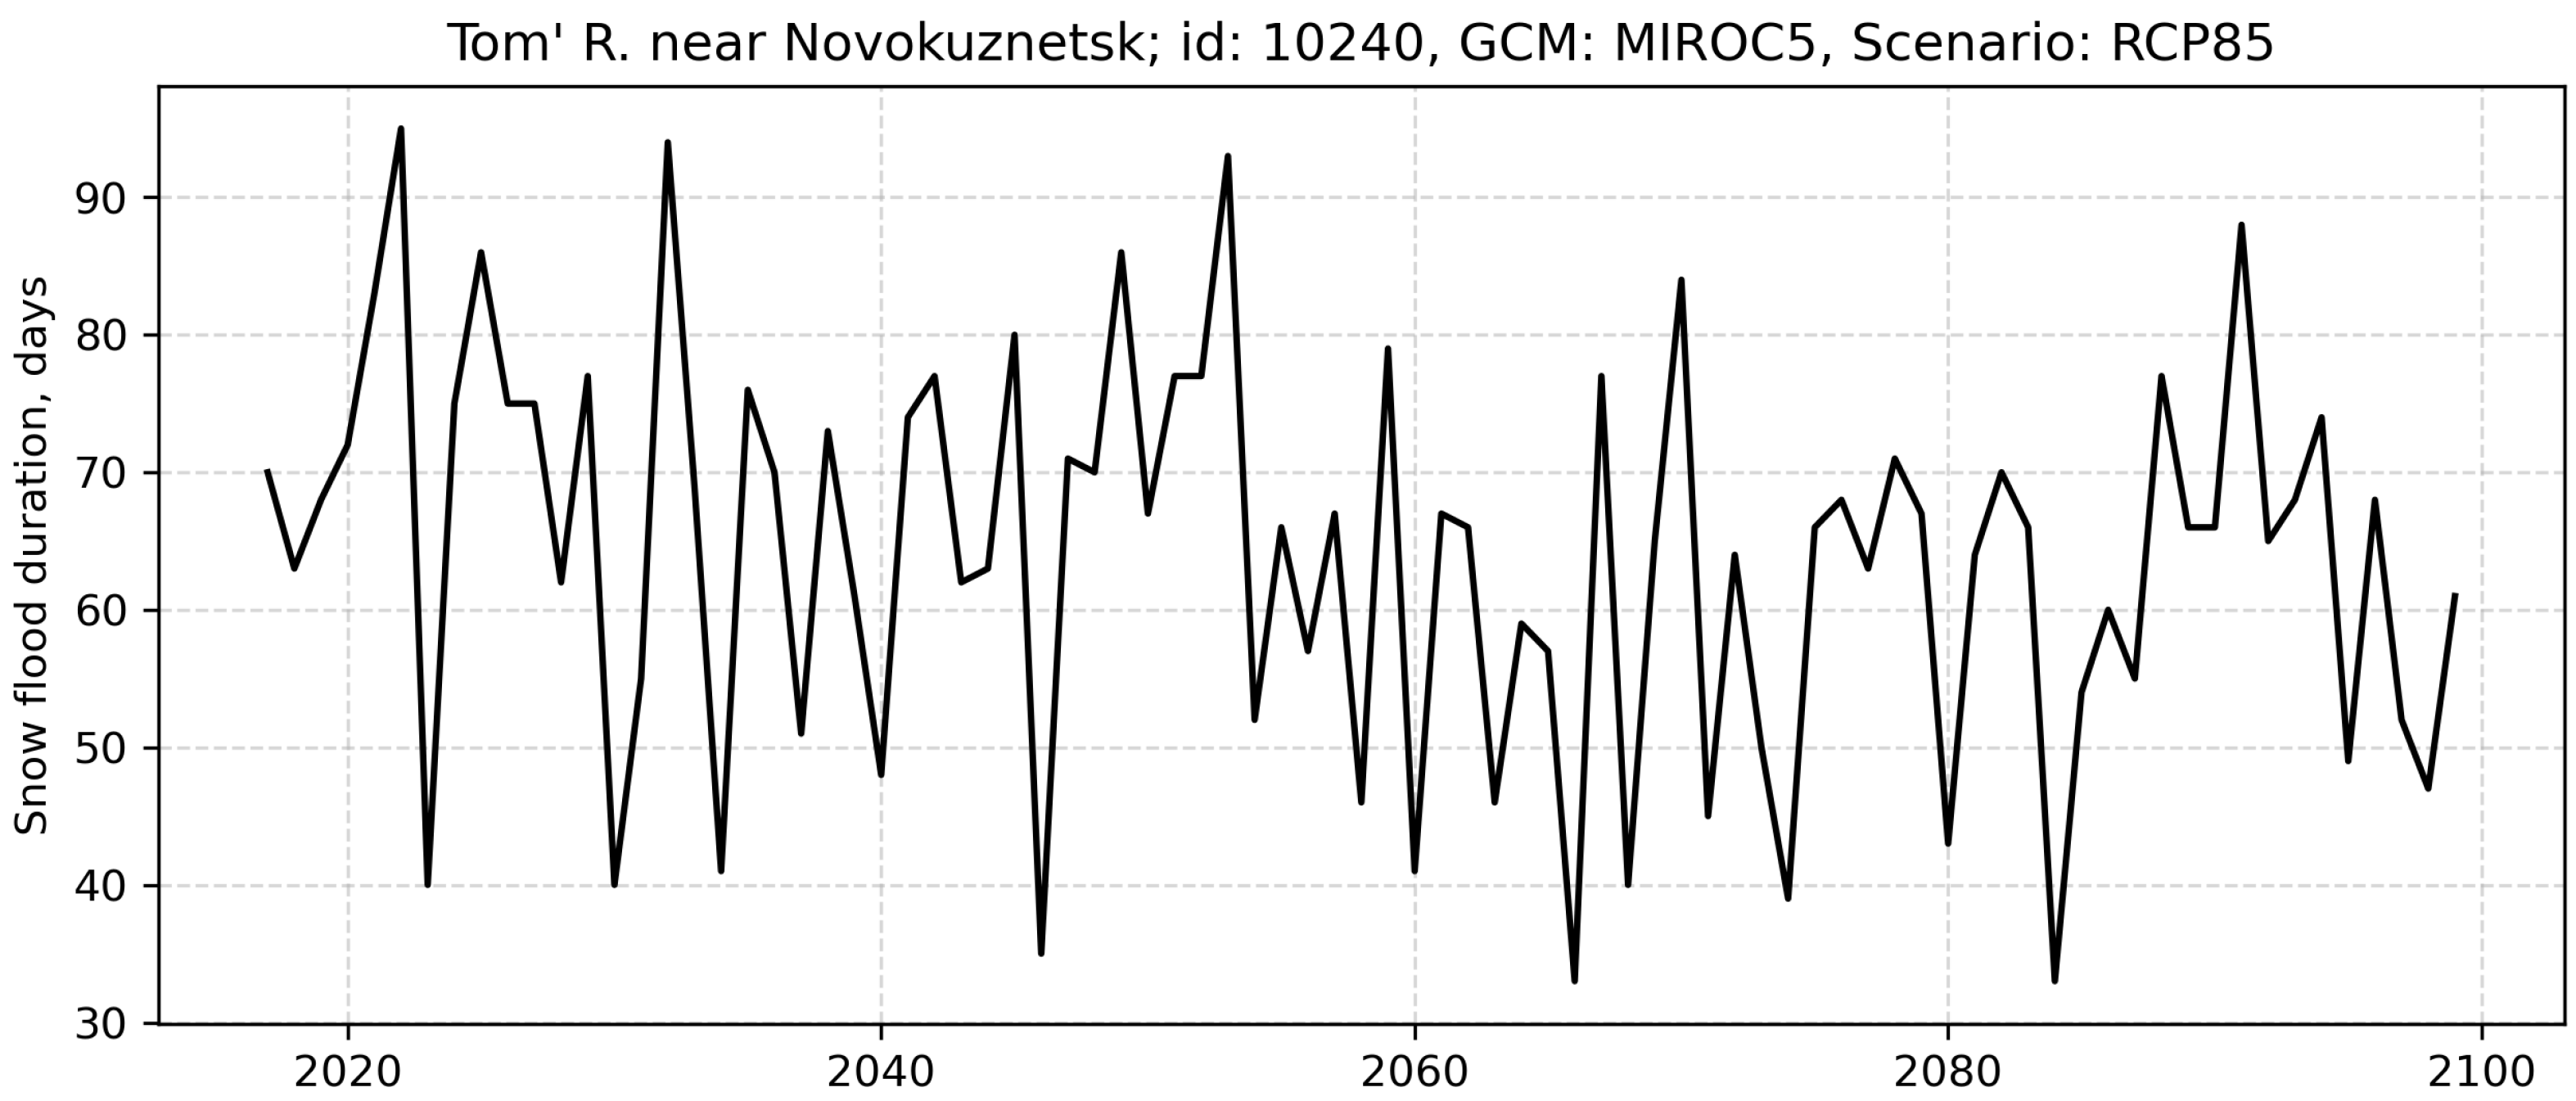
The use of the presented RFR dataset is straightforward. All the data is provided in a machine-readable “.csv” format; this format can be opened by all modern office software (e.g., Microsoft Excel, LibreOffice Calc, Google Spreadsheets, etc.), as well as programming languages (Python, R, or Julia). By providing a formatted date/time column, plotting time series data is also straightforward with the standard tools and applications (Figure 7). Furthermore, any specialized software can easily display the provided auxiliary GIS data in “.geojson” format (e.g., ArcGIS, Qgis) or software library (e.g., geopandas).
The comparably moderate size of the distributed dataset (9.5 Gb in “.gzip” archive and 24.7 Gb of uncompressed files), its straightforward structure, and use of popular file formats make it affordable for many parties, including scientists, journalists, or enthusiasts from local communities. We hope that the RFR dataset will be widely used to identify and further communicate water-related climate change issues in Russia.
Funding
The reported study was funded by the Russian Foundation for Basic Research (RFBR) according to the research project No. 19-35-60005.
Institutional Review Board Statement
Not applicable.
Informed Consent Statement
Not applicable.
Data Availability Statement
The reported dataset is freely available in the open repository [13].
Conflicts of Interest
The author declare no conflict of interest.
References
- UN World Water Development Report 2020. Available online: https://www.unwater.org/publications/world-water-development-report-2020/ (accessed on 25 June 2020).
- Blöschl, G.; Hall, J.; Viglione, A.; Perdigão, R.A.; Parajka, J.; Merz, B.; Lun, D.; Arheimer, B.; Aronica, G.T.; Bilibashi, A.; et al. Changing climate both increases and decreases European river floods. Nature 2019, 573, 108–111. [Google Scholar] [CrossRef] [PubMed]
- Blöschl, G.; Kiss, A.; Viglione, A.; Barriendos, M.; Böhm, O.; Brázdil, R.; Coeur, D.; Demarée, G.; Llasat, M.C.; Macdonald, N.; et al. Current European flood-rich period exceptional compared with past 500 years. Nature 2020, 583, 560–566. [Google Scholar] [CrossRef]
- Pörtner, H.O.; Roberts, D.C.; Adams, H.; Adler, C.; Aldunce, P.; Ali, E.; Begum, R.A.; Betts, R.; Kerr, R.B.; Biesbroek, R.; et al. Climate Change 2022: Impacts, Adaptation and Vulnerability; IPCC Sixth Assessment Report; Cambridge University Press: Cambridge, UK; New York, NY, USA, 2022. [Google Scholar]
- Weart, S. The development of general circulation models of climate. Stud. Hist. Philos. Sci. Part B: Stud. Hist. Philos. Mod. Phys. 2010, 41, 208–217. [Google Scholar] [CrossRef]
- Frieler, K.; Lange, S.; Piontek, F.; Reyer, C.P.O.; Schewe, J.; Warszawski, L.; Zhao, F.; Chini, L.; Denvil, S.; Emanuel, K.; et al. Assessing the impacts of 1.5 °C global warming—Simulation protocol of the Inter-Sectoral Impact Model Intercomparison Project (ISIMIP2b). Geosci. Model Dev. 2017, 10, 4321–4345. [Google Scholar] [CrossRef] [Green Version]
- Golub, M.; Thiery, W.; Marcé, R.; Pierson, D.; Vanderkelen, I.; Mercado-Bettin, D.; Woolway, R.I.; Grant, L.; Jennings, E.; Kraemer, B.M.; et al. A framework for ensemble modelling of climate change impacts on lakes worldwide: The ISIMIP Lake Sector. Geosci. Model Dev. 2022, 15, 4597–4623. [Google Scholar] [CrossRef]
- Ito, R.; Shiogama, H.; Nakaegawa, T.; Takayabu, I. Uncertainties in climate change projections covered by the ISIMIP and CORDEX model subsets from CMIP5. Geosci. Model Dev. 2020, 13, 859–872. [Google Scholar] [CrossRef] [Green Version]
- Nasonova, O.N.; Gusev, Y.M.; Kovalev, E.E.; Ayzel, G.V.; Panysheva, K.M. Projecting Changes in Russian Northern River Runoff due to Possible Climate Change during the 21st Century: A Case Study of the Northern Dvina, Taz and Indigirka Rivers. Water Resour. 2019, 46, S145–S154. [Google Scholar] [CrossRef]
- Gusev, E.M.; Nasonova, O.N.; Kovalev, E.E.; Ayzel, G.V. Impact of Possible Climate Change on Extreme Annual Runoff from River Basins Located in Different Regions of the Globe. Water Resour. 2019, 46, S126–S136. [Google Scholar] [CrossRef]
- Huang, S.; Kumar, R.; Flörke, M.; Yang, T.; Hundecha, Y.; Kraft, P.; Gao, C.; Gelfan, A.; Liersch, S.; Lobanova, A.; et al. Evaluation of an ensemble of regional hydrological models in 12 large-scale river basins worldwide. Clim. Change 2017, 141, 381–397. [Google Scholar] [CrossRef]
- Krysanova, V.; Vetter, T.; Eisner, S.; Huang, S.; Pechlivanidis, I.; Strauch, M.; Gelfan, A.; Kumar, R.; Aich, V.; Arheimer, B.; et al. Intercomparison of regional-scale hydrological models and climate change impacts projected for 12 large river basins worldwide—A synthesis. Environ. Res. Lett. 2017, 12, 105002. [Google Scholar] [CrossRef]
- Ayzel, G. Runoff for Russia (RFR v1.0), 2022. Available online: https://doi.org/10.5281/zenodo.7082269 (accessed on 10 January 2023).
- Arsenault, R.; Bazile, R.; Ouellet Dallaire, C.; Brissette, F. CANOPEX: A Canadian hydrometeorological watershed database. Hydrol. Process. 2016, 30, 2734–2736. [Google Scholar] [CrossRef]
- Addor, N.; Newman, A.J.; Mizukami, N.; Clark, M.P. The CAMELS data set: Catchment attributes and meteorology for large-sample studies. Hydrol. Earth Syst. Sci. 2017, 21, 5293–5313. [Google Scholar] [CrossRef] [Green Version]
- Arsenault, R.; Brissette, F.; Martel, J.L.; Troin, M.; Lévesque, G.; Davidson-Chaput, J.; Gonzalez, M.C.; Ameli, A.; Poulin, A. A comprehensive, multisource database for hydrometeorological modeling of 14,425 North American watersheds. Sci. Data 2020, 7, 243. [Google Scholar] [CrossRef] [PubMed]
- Hallouin, T. Eflowcalc: A Streamflow Characteristics Calculator in Python. 2021. Available online: 10.5281/zenodo.4721439 (accessed on 10 January 2023).
- A Streamflow Characteristics Calculator in Python. Available online: https://thibhlln.github.io/eflowcalc/index.html (accessed on 2 November 2022).
- Yamazaki, D.; Ikeshima, D.; Sosa, J.; Bates, P.D.; Allen, G.H.; Pavelsky, T.M. MERIT Hydro: A High-Resolution Global Hydrography Map Based on Latest Topography Dataset. Water Resour. Res. 2019, 55, 5053–5073. [Google Scholar] [CrossRef] [Green Version]
- HydroATLAS. Available online: hydrosheds.org/hydroatlas (accessed on 2 November 2022).
- Ayzel, G.; Izhitskiy, A. Climate Change Impact Assessment on Freshwater Inflow into the Small Aral Sea. Water 2019, 11, 2377. [Google Scholar] [CrossRef] [Green Version]
- Ayzel, G.; Kurochkina, L.; Zhuravlev, S. The influence of regional hydrometric data incorporation on the accuracy of gridded reconstruction of monthly runoff. Hydrol. Sci. J. 2022, 67, 2429–2440. [Google Scholar] [CrossRef]
- Ayzel, G. OpenForecast v2: Development and Benchmarking of the First National-Scale Operational Runoff Forecasting System in Russia. Hydrology 2021, 8, 3. [Google Scholar] [CrossRef]
- Ayzel, G. Machine Learning Reveals a Significant Shift in Water Regime Types Due to Projected Climate Change. ISPRS Int. J. Geo-Inf. 2021, 10, 660. [Google Scholar] [CrossRef]
- Lange, S. Bias correction of surface downwelling longwave and shortwave radiation for the EWEMBI dataset. Earth Syst. Dyn. 2018, 9, 627–645. [Google Scholar] [CrossRef] [Green Version]
- Lange, S. Trend-preserving bias adjustment and statistical downscaling with ISIMIP3BASD (v1.0). Geosci. Model Dev. 2019, 12, 3055–3070. [Google Scholar] [CrossRef]
- Lange, S. EartH2Observe, WFDEI and ERA-Interim data Merged and Bias-corrected for ISIMIP (EWEMBI). V. 1.1. GFZ Data Services. 2019. Available online: https://doi.org/10.5880/pik.2019.004 (accessed on 10 January 2023).
- Döll, P.; Trautmann, T.; Gerten, D.; Schmied, H.M.; Ostberg, S.; Saaed, F.; Schleussner, C.F. Risks for the global freshwater system at 1.5 °C and 2 °C global warming. Environ. Res. Lett. 2018, 13, 044038. [Google Scholar] [CrossRef]
- Gelfan, A.; Kalugin, A.; Krylenko, I.; Nasonova, O.; Gusev, Y.; Kovalev, E. Does a successful comprehensive evaluation increase confidence in a hydrological model intended for climate impact assessment? Clim. Change 2020. [Google Scholar] [CrossRef]
- Bergström, S.; Forsman, A. Development of a conceptual deterministic rainfall-runoff model. Hydrol. Res. 1973, 4, 147–170. [Google Scholar] [CrossRef]
- Lindström, G. A simple automatic calibration routine for the HBV model. Hydrol. Res. 1997, 28, 153–168. [Google Scholar] [CrossRef] [Green Version]
- Oudin, L.; Hervieu, F.; Michel, C.; Perrin, C.; Andréassian, V.; Anctil, F.; Loumagne, C. Which potential evapotranspiration input for a lumped rainfall–runoff model?: Part 2—Towards a simple and efficient potential evapotranspiration model for rainfall–runoff modelling. J. Hydrol. 2005, 303, 290–306. [Google Scholar] [CrossRef]
- Seibert, J.; Bergström, S. A retrospective on hydrological catchment modelling based on half a century with the HBV model. Hydrol. Earth Syst. Sci. 2022, 26, 1371–1388. [Google Scholar] [CrossRef]
- Teutschbein, C.; Seibert, J. Bias correction of regional climate model simulations for hydrological climate-change impact studies: Review and evaluation of different methods. J. Hydrol. 2012, 456–457, 12–29. [Google Scholar] [CrossRef]
- Veijalainen, N.; Lotsari, E.; Alho, P.; Vehviläinen, B.; Käyhkö, J. National scale assessment of climate change impacts on flooding in Finland. J. Hydrol. 2010, 391, 333–350. [Google Scholar] [CrossRef]
- Beck, H.E.; van Dijk, A.I.J.M.; de Roo, A.; Miralles, D.G.; McVicar, T.R.; Schellekens, J.; Bruijnzeel, L.A. Global-scale regionalization of hydrologic model parameters. Water Resour. Res. 2016, 52, 3599–3622. [Google Scholar] [CrossRef] [Green Version]
- Storn, R.; Price, K. Differential evolution—A simple and efficient heuristic for global optimization over continuous spaces. J. Glob. Optim. 1997, 11, 341–359. [Google Scholar] [CrossRef]
- Nash, J.E.; Sutcliffe, J.V. River flow forecasting through conceptual models part I—A discussion of principles. J. Hydrol. 1970, 10, 282–290. [Google Scholar] [CrossRef]
- Schaefli, B.; Gupta, H.V. Do Nash values have value? Hydrol. Process. 2007, 21, 2075–2080. [Google Scholar] [CrossRef] [Green Version]
- Mizukami, N.; Rakovec, O.; Newman, A.J.; Clark, M.P.; Wood, A.W.; Gupta, H.V.; Kumar, R. On the choice of calibration metrics for “high-flow” estimation using hydrologic models. Hydrol. Earth Syst. Sci. 2019, 23, 2601–2614. [Google Scholar] [CrossRef] [Green Version]
- Liu, D. A rational performance criterion for hydrological model. J. Hydrol. 2020, 590, 125488. [Google Scholar] [CrossRef]
- Roudier, P.; Andersson, J.C.; Donnelly, C.; Feyen, L.; Greuell, W.; Ludwig, F. Projections of future floods and hydrological droughts in Europe under a+ 2 C global warming. Clim. Change 2016, 135, 341–355. [Google Scholar] [CrossRef] [Green Version]
- Rets, E.; Kireeva, M.; Samsonov, T.; Ezerova, N.; Gorbarenko, A.; Frolova, N. Algorithm grwat for Automated Hydrograph Separation by BI Kudelin’s Method: Problems and Perspectives. Water Resour. 2022, 49, 23–37. [Google Scholar] [CrossRef]
- Oliphant, T.E. Guide to Numpy, 2nd ed.; Continuum Press: Austin, TX, USA, 2015. [Google Scholar]
- Jones, E.; Oliphant, T.; Peterson, P. SciPy: Open source scientific tools for Python. 2018. Available online: https://scipy.org/ (accessed on 10 January 2023).
- Linke, S.; Lehner, B.; Ouellet Dallaire, C.; Ariwi, J.; Grill, G.; Anand, M.; Beames, P.; Burchard-Levine, V.; Maxwell, S.; Moidu, H.; et al. Global hydro-environmental sub-basin and river reach characteristics at high spatial resolution. Sci. Data 2019, 6, 283. [Google Scholar] [CrossRef] [Green Version]
- Ayzel, G. Runoff for Russia (RFR v1.0): Computational Codes. 2022. Available online: https://doi.org/10.5281/zenodo.7305133 (accessed on 10 January 2023).
- Moges, E.; Demissie, Y.; Larsen, L.; Yassin, F. Review: Sources of Hydrological Model Uncertainties and Advances in Their Analysis. Water 2020, 13, 28. [Google Scholar] [CrossRef]
- Nasonova, O.N.; Gusev, Y.M.; Kovalev, E.E.; Ayzel, G.V. Climate change impact on streamflow in large-scale river basins: Projections and their uncertainties sourced from GCMs and RCP scenarios. Proc. Int. Assoc. Hydrol. Sci. 2018, 379, 139–144. [Google Scholar] [CrossRef]
Figure 1.
Location of the represented river basins and the corresponding runoff gauges within the RFR dataset.
Figure 1.
Location of the represented river basins and the corresponding runoff gauges within the RFR dataset.

Figure 2.
RFR v1.0 structure: main folders.

Figure 3.
Structure of hydrological data.

Figure 4.
Structure of meteorological data.

Figure 5.
RFR v1.0 generalized development workflow.

Figure 6.
The HBV hydrological model. F denotes function between fluxes/states and parameters, e.g., the final runoff Q is the function (F(MAXBAS)) from the outflow sum from conceptual reservoirs. The model parameters description is presented in Table 1.
Figure 6.
The HBV hydrological model. F denotes function between fluxes/states and parameters, e.g., the final runoff Q is the function (F(MAXBAS)) from the outflow sum from conceptual reservoirs. The model parameters description is presented in Table 1.

Figure 7.
Projected snow flood duration (days) for Tom’ R. near Novokuznetsk.

Disclaimer/Publisher’s Note: The statements, opinions and data contained in all publications are solely those of the individual author(s) and contributor(s) and not of MDPI and/or the editor(s). MDPI and/or the editor(s) disclaim responsibility for any injury to people or property resulting from any ideas, methods, instructions or products referred to in the content. |
© 2023 by the author. Licensee MDPI, Basel, Switzerland. This article is an open access article distributed under the terms and conditions of the Creative Commons Attribution (CC BY) license (https://creativecommons.org/licenses/by/4.0/).
Share and Cite
MDPI and ACS Style
Ayzel, G. Runoff for Russia (RFR v1.0): The Large-Sample Dataset of Simulated Runoff and Its Characteristics. Data 2023, 8, 31. https://doi.org/10.3390/data8020031
AMA Style
Ayzel G. Runoff for Russia (RFR v1.0): The Large-Sample Dataset of Simulated Runoff and Its Characteristics. Data. 2023; 8(2):31. https://doi.org/10.3390/data8020031
Chicago/Turabian StyleAyzel, Georgy. 2023. "Runoff for Russia (RFR v1.0): The Large-Sample Dataset of Simulated Runoff and Its Characteristics" Data 8, no. 2: 31. https://doi.org/10.3390/data8020031