

Machine Learning for Credit Risk Prediction: A Systematic Literature Review


Abstract
:1. Introduction
2. Materials and Methods
Research Strategy
3. Current Research
4. Results
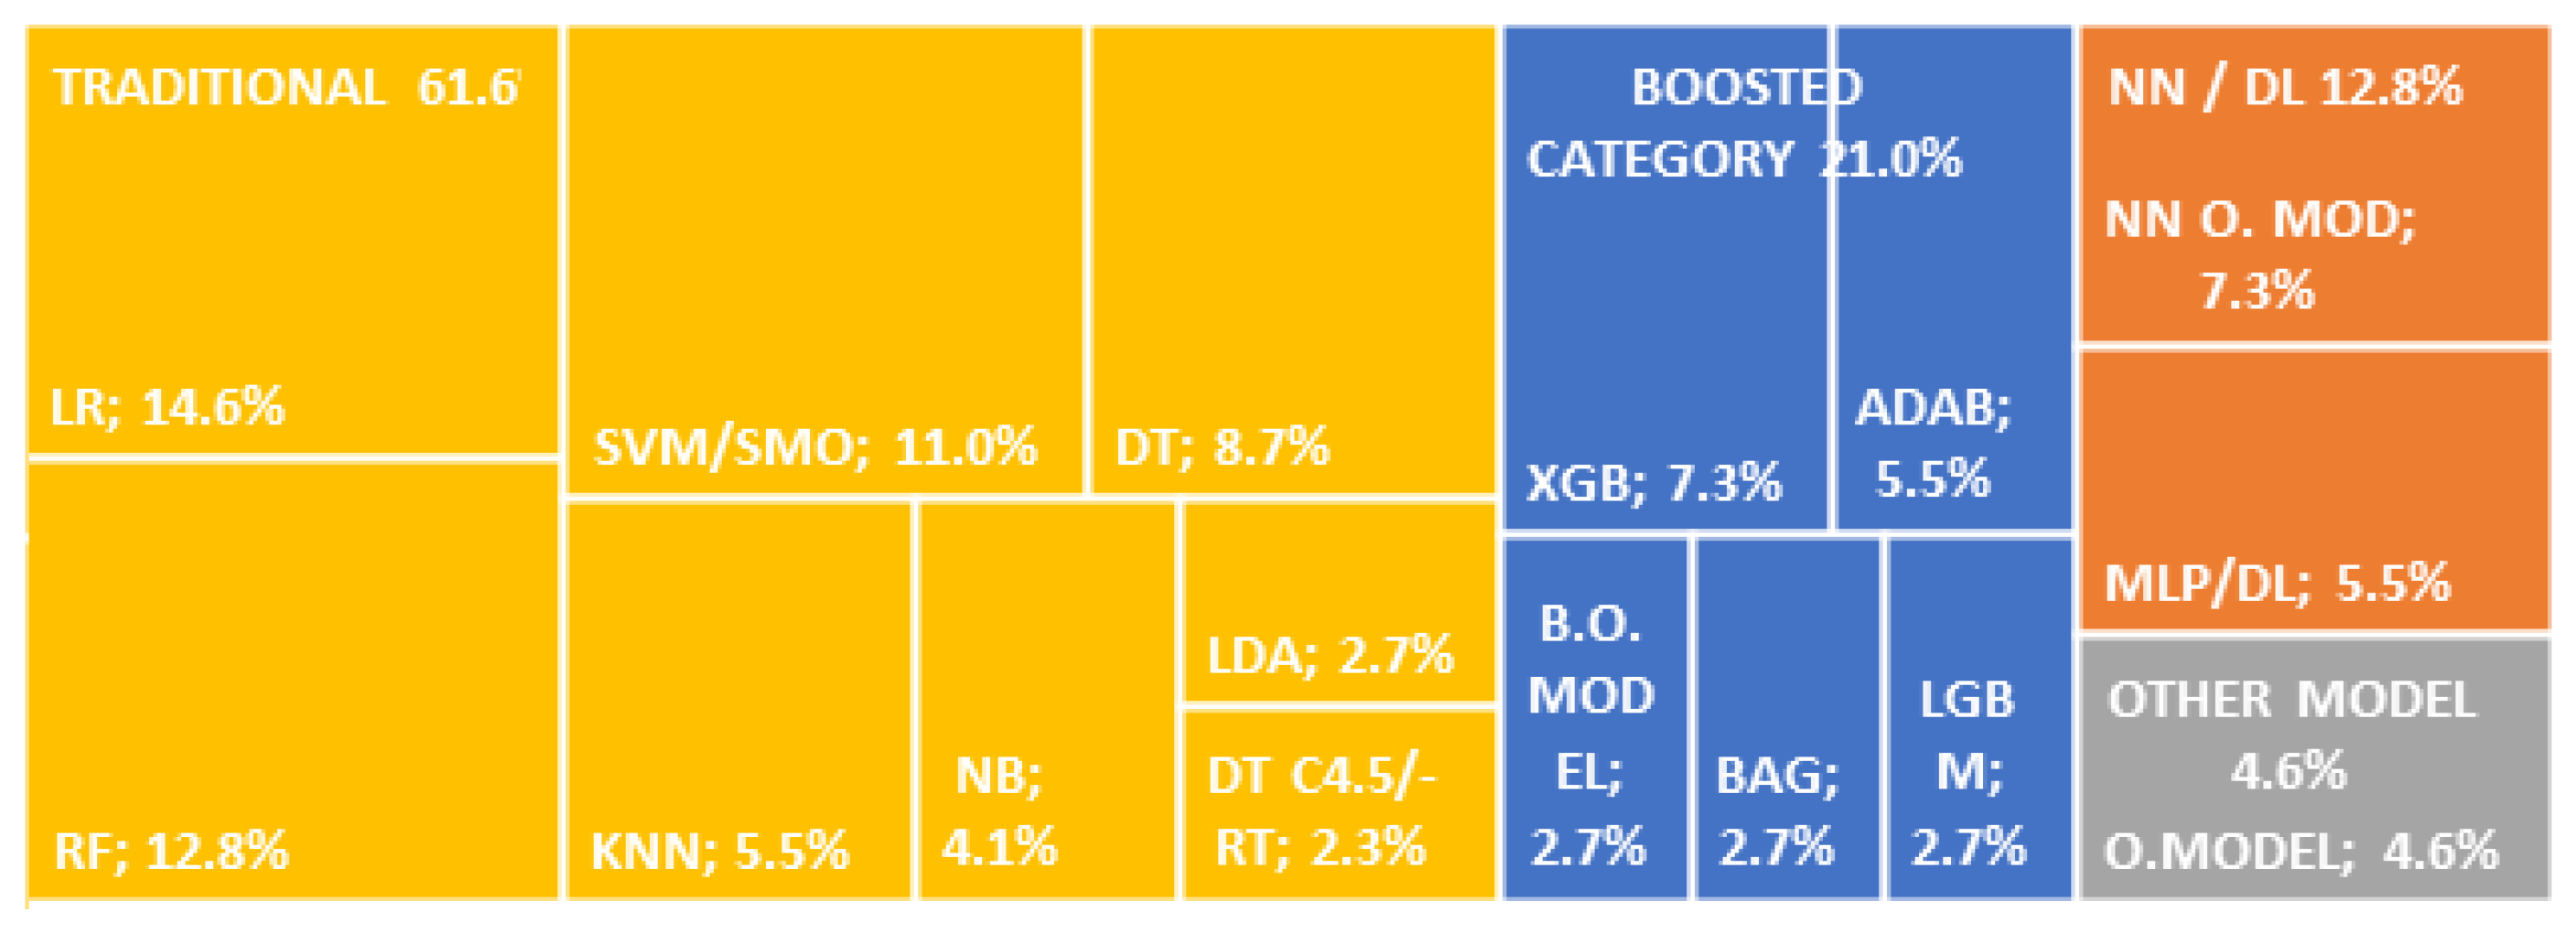
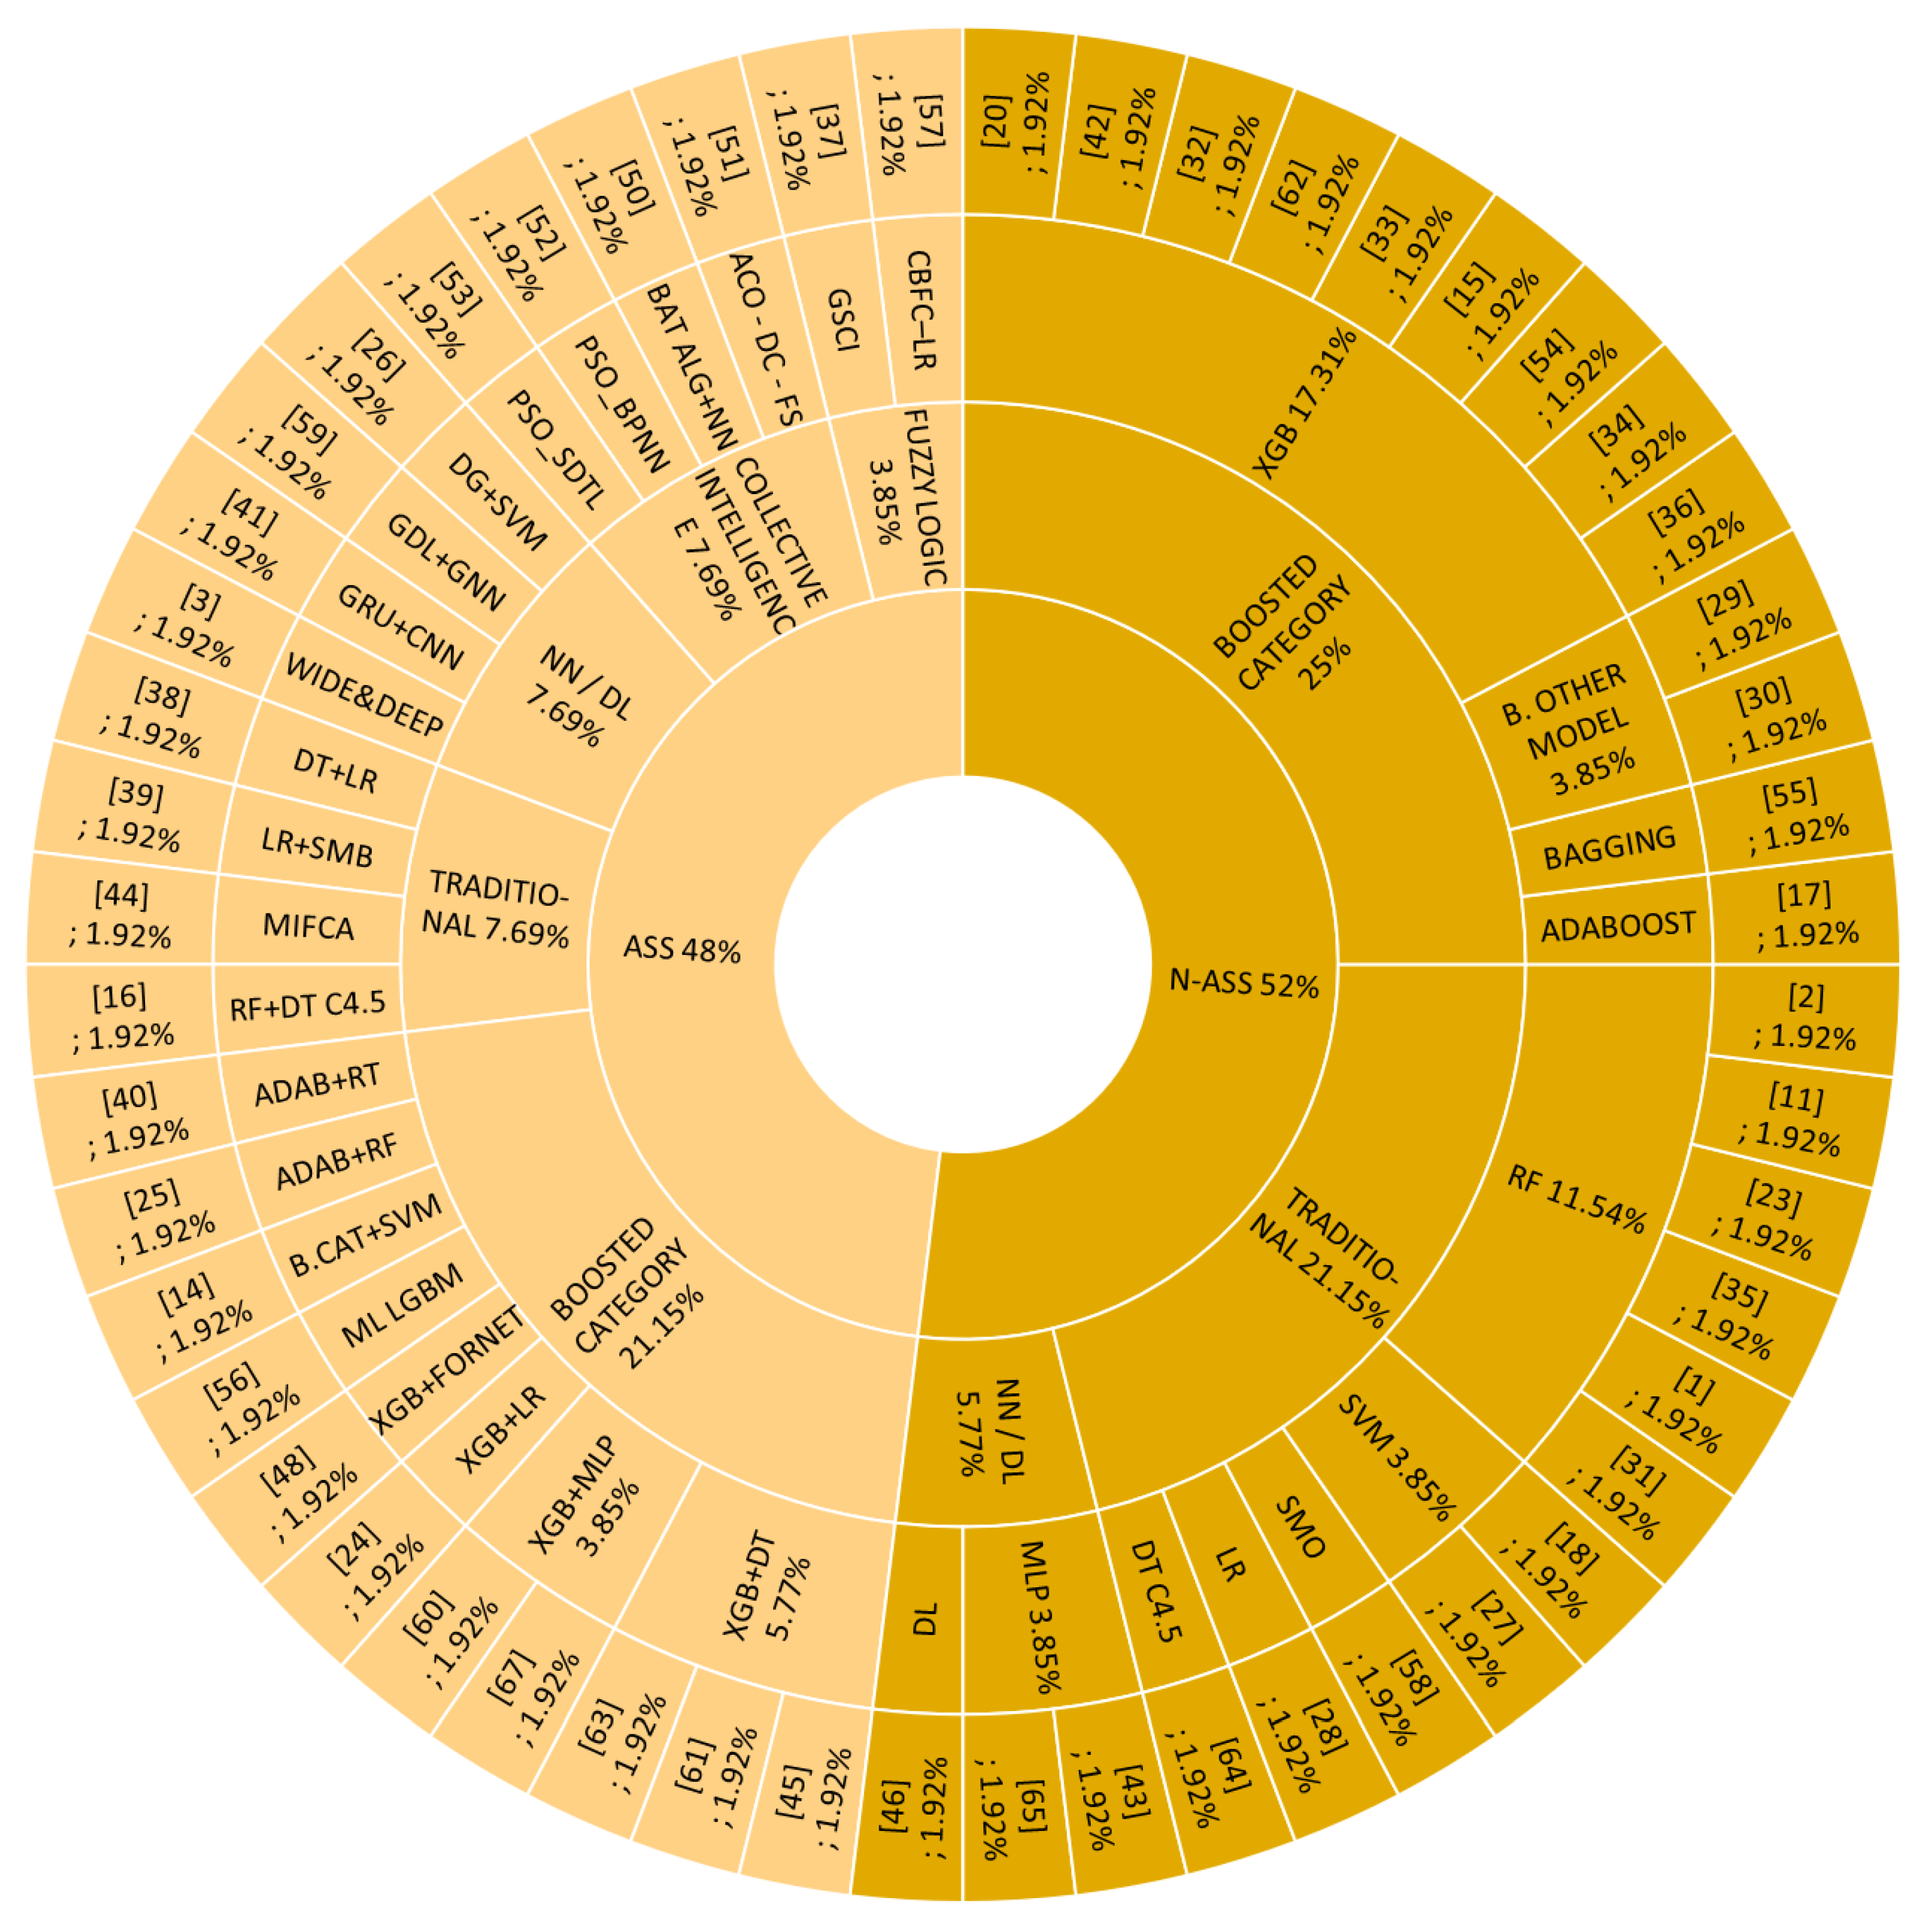
4.1. Answer to RQ1: What Are the Algorithms, Methods, and Models Used to Predict Credit Risk?
4.2. Answer to RQ2: Which Are the Metrics to Evaluate the Performance of Algorithms, Methods, or Models?
4.3. Answer to RQ3: What Are These Models’ Accuracy, Precision, F1 Measure, and AUC?
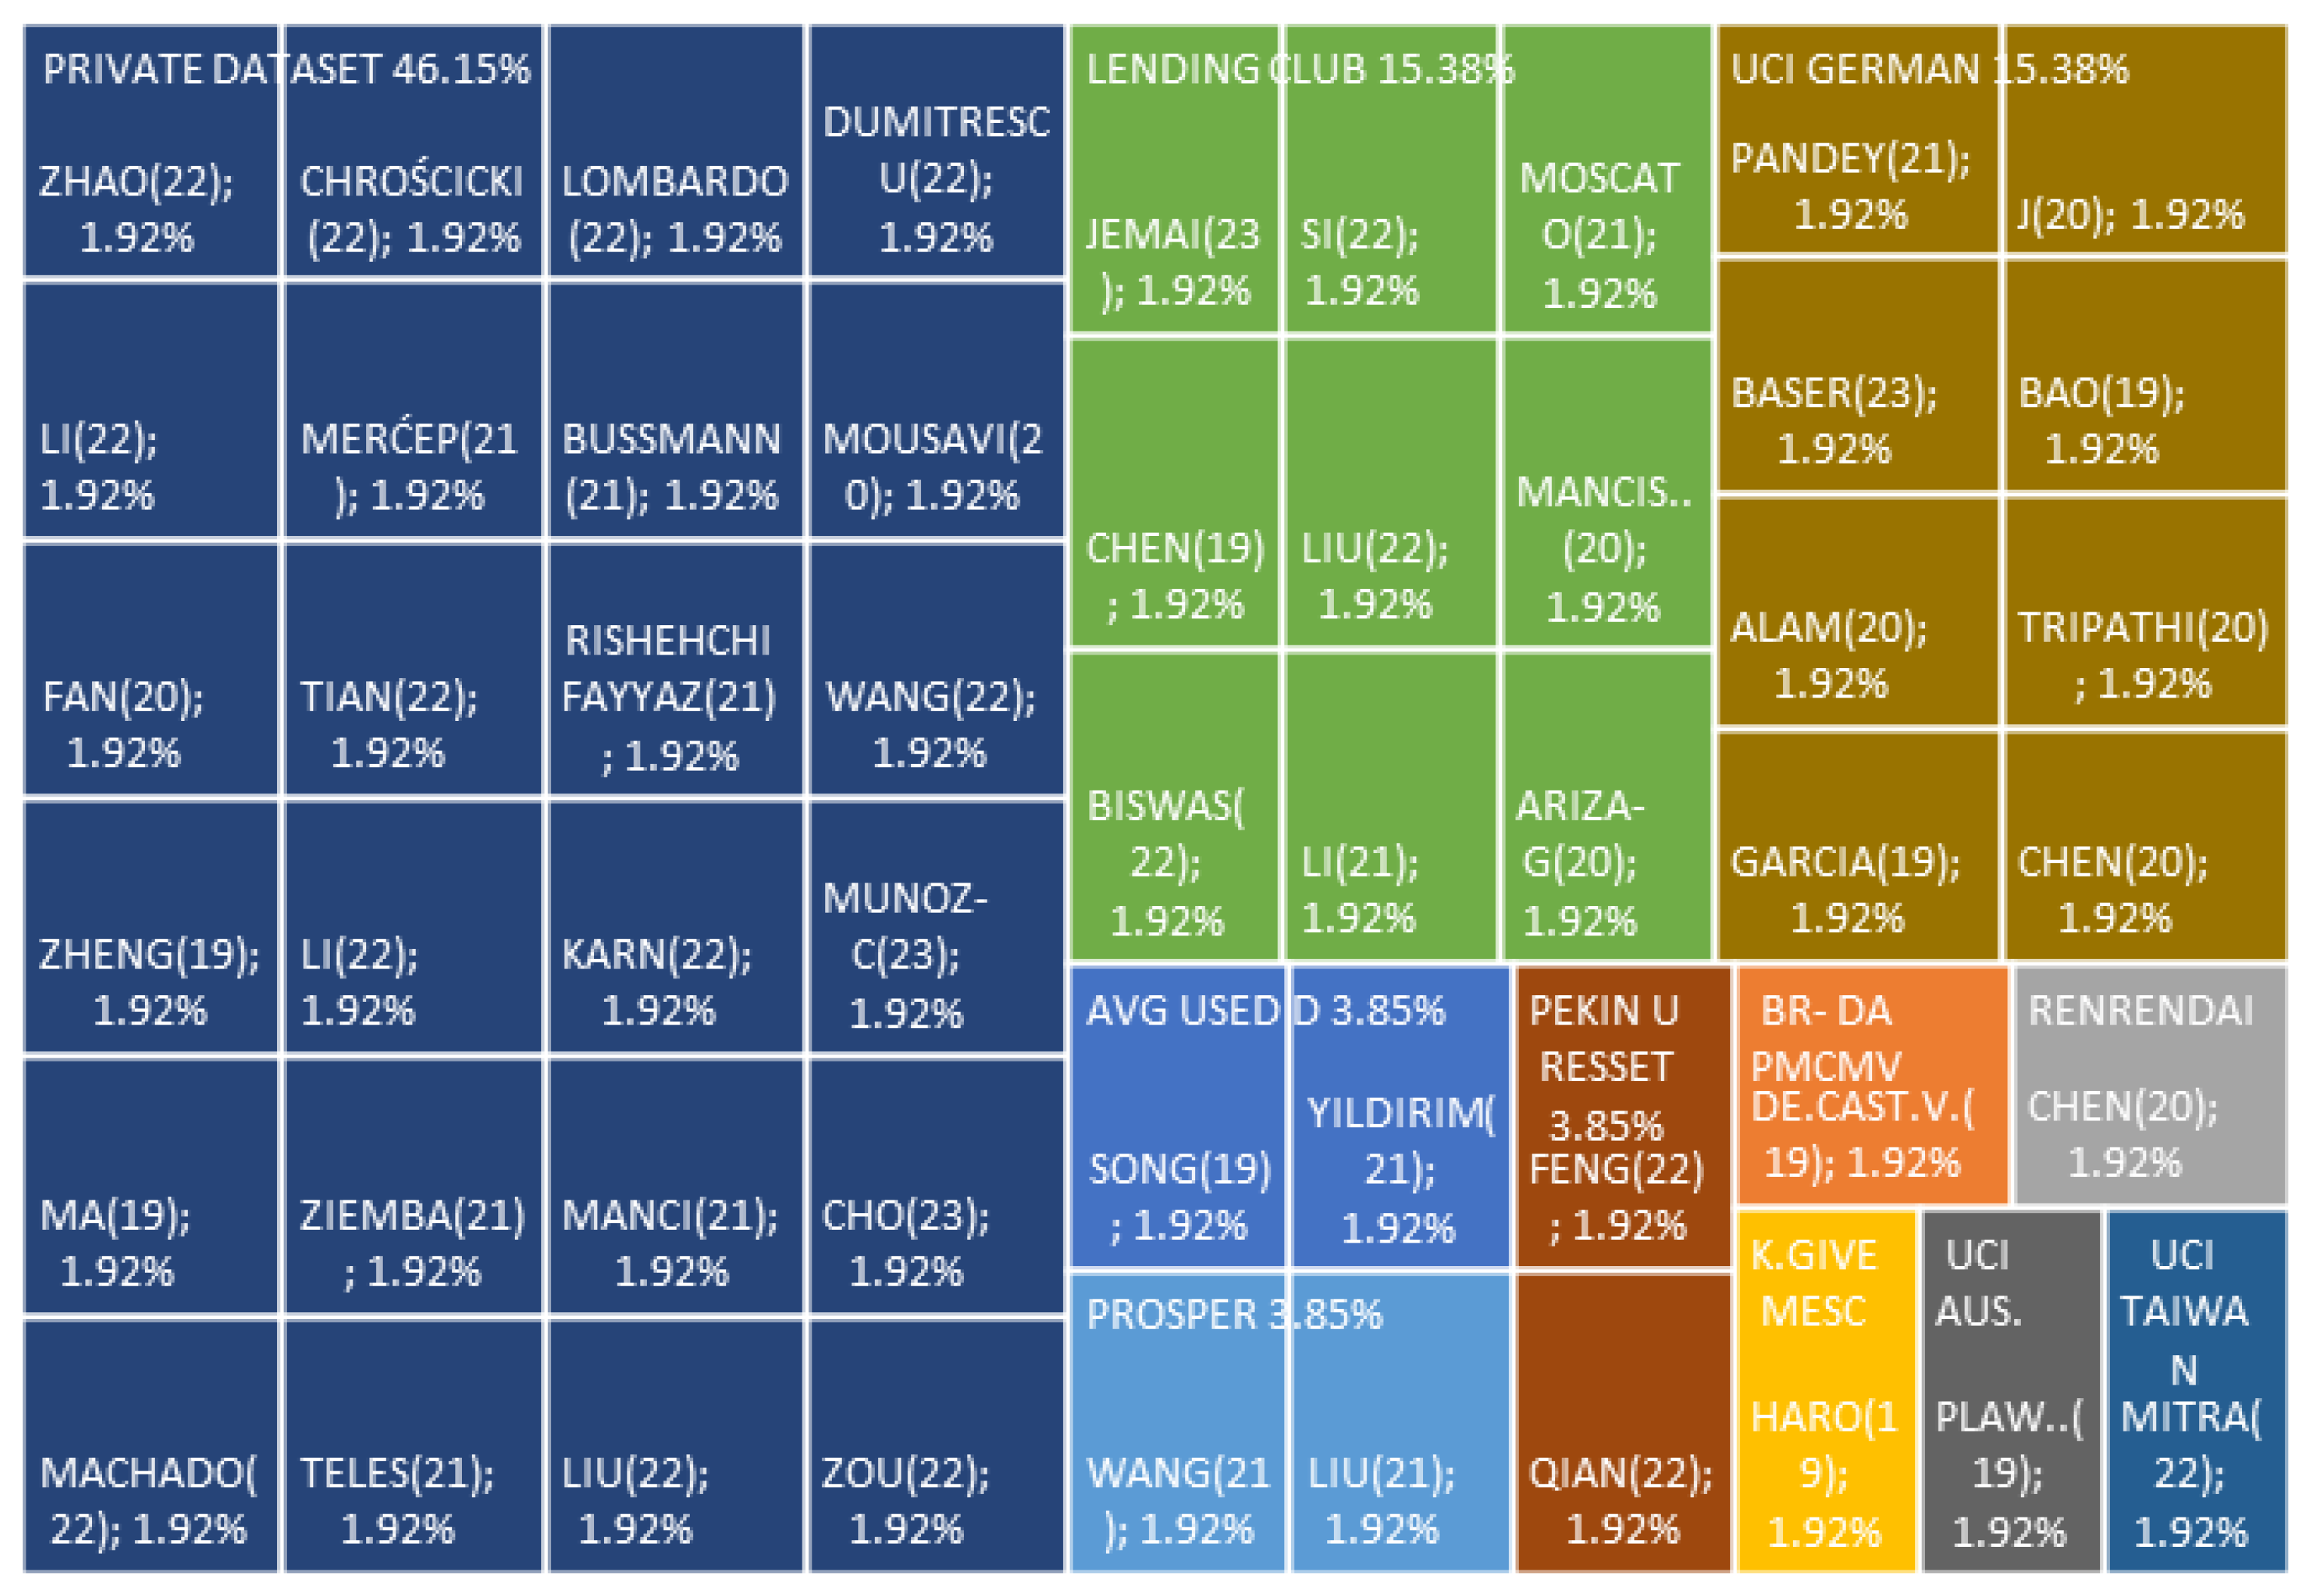
4.4. Answer to RQ4: What Datasets Are Used in the Prediction of Credit Risk?
4.5. Answer to RQ5: What Variables or Features Are Used to Predict Credit Risk?
4.6. Answer to RQ6: What Are the Main Problems or Limitations of Predicting Credit Risk?
5. Additional Findings
6. Discussion
7. Conclusions and Future Research
- The Boosted Category is a family of ML models being investigated. They are the most used in Ass and N-Ass situations, highlighting the XGB model, with the tendency being its use in Ass. This category in the experiments obtained better results than other models due to its ability to process categorical variables—numerical, with noise, missing, and unbalanced data—and applying regularization could avoid overfitting. However, since they are complex models, they are challenging to interpret and are not very tolerant of applying atypical values.
- The five most-used metrics are AUC, ACC, Recall, F1 measure, and Precision, although, in practice, the problem must considered when choosing the most appropriate metrics. However, AUC stands out for its ability to not be influenced by the distribution of classes and preferable behavior when processing unbalanced data.
- Public datasets are more utilized; of this group, the commonly used are UCI German Dataset and Landing Club Dataset. Their main use is to validate the behavior against other models under the same conditions. Private datasets generate knowledge from the application to a specific situation.
- For the evaluation of credit risks through ML, demographic variables are mainly used, which represent behavior, preferences, socioeconomic profile, and operations that represent the characteristics of the financial product acquired. However, this information is insufficient and is complemented by external variables and those related to unstructured data such as images, video, or others generated from hyperconnectivity, which is supported by DDI and BIG DATA development and processing.
- The main problems are the representativeness of reality, the imbalance of data for the training, and the inconsistency in recording information. All cases arise due to biases, errors, or problems in recording information.
- The most widely used method to solve the imbalance problem is SMOTE to optimize the performance of ML models, while the methods to determine the hyperparameters are KFold-CV and Grid Search to guide their optimization.
Author Contributions
Funding
Institutional Review Board Statement
Informed Consent Statement
Data Availability Statement
Conflicts of Interest
References
- Lombardo, G.; Pellegrino, M.; Adosoglou, G.; Cagnoni, S.; Pardalos, P.M.; Poggi, A. Machine Learning for Bankruptcy Prediction in the American Stock Market: Dataset and Benchmarks. Future Internet 2022, 14, 244. [Google Scholar] [CrossRef]
- Ziemba, P.; Becker, J.; Becker, A.; Radomska-Zalas, A.; Pawluk, M.; Wierzba, D. Credit decision support based on real set of cash loans using integrated machine learning algorithms. Electronics 2021, 10, 2099. [Google Scholar] [CrossRef]
- Liu, C.; Ming, Y.; Xiao, Y.; Zheng, W.; Hsu, C.H. Finding the next interesting loan for investors on a peer-to-peer lending platform. IEEE Access 2021, 9, 111293–111304. [Google Scholar] [CrossRef]
- Chen, C.; Lin, K.; Rudin, C.; Shaposhnik, Y.; Wang, S.; Wang, T. A holistic approach to interpretability in financial lending: Models, visualizations, and summary-explanations. Decis. Support Syst. 2022, 152, 113647. [Google Scholar] [CrossRef]
- Shih, D.H.; Wu, T.W.; Shih, P.Y.; Lu, N.A.; Shih, M.H. A Framework of Global Credit-Scoring Modeling Using Outlier Detection and Machine Learning in a P2P Lending Platform. Mathematics 2022, 10, 2282. [Google Scholar] [CrossRef]
- Zhang, Z.; Jia, X.; Chen, S.; Li, M.; Wang, F. Dynamic Prediction of Internet Financial Market Based on Deep Learning. Comput. Intell. Neurosci. 2022, 2022, 1465394. [Google Scholar] [CrossRef]
- BM Panorama General. Available online: https://www.bancomundial.org/es/topic/financialsector/overview (accessed on 22 December 2021).
- Hani, U.; Wickramasinghe, A.; Kattiyapornpong, U.; Sajib, S. The future of data-driven relationship innovation in the microfinance industry. In Annals of Operations Research; Springer: Dordrecht, The Netherlands, 2022; pp. 1–27. [Google Scholar]
- Zhang, C.; Zhong, H.; Hu, A. A Method for Financial System Analysis of Listed Companies Based on Random Forest and Time Series. Mob. Inf. Syst. 2022, 2022, 6159459. [Google Scholar] [CrossRef]
- Majerník, M.; Daneshjo, N.; Malega, P.; Drábik, P.; Barilová, B. Sustainable development of the intelligent industry from Industry 4.0 to Industry 5.0. Adv. Sci. Technol. Res. J. 2022, 16. [Google Scholar] [CrossRef]
- Yıldırım, M.; Okay, F.Y.; ∅zdemir, S. Big data analytics for default prediction using graph theory. Expert Syst. Appl. 2021, 176, 114840. [Google Scholar] [CrossRef]
- Bi, W.; Liang, Y. Risk Assessment of Operator’s Big Data Internet of Things Credit Financial Management Based on Machine Learning. Mob. Inf. Syst. 2022, 2022, 5346995. [Google Scholar] [CrossRef]
- Hariri, R.H.; Fredericks, E.M.; Bowers, K.M. Uncertainty in big data analytics: Survey, opportunities, and challenges. J. Big Data 2019, 6, 44. [Google Scholar] [CrossRef]
- Chen, Z.; Chen, W.; Shi, Y. Ensemble learning with label proportions for bankruptcy prediction. Expert Syst. Appl. 2020, 146, 113155. [Google Scholar] [CrossRef]
- Fan, S.; Shen, Y.; Peng, S. Improved ML-based technique for credit card scoring in internet financial risk control. Complexity 2020, 2020, 8706285. [Google Scholar] [CrossRef]
- García, V.; Marques, A.I.; Sánchez, J.S. Exploring the synergetic effects of sample types on the performance of ensembles for credit risk and corporate bankruptcy prediction. Inf. Fusion 2019, 47, 88–101. [Google Scholar] [CrossRef]
- Wang, M.; Yang, H. Research on personal credit risk assessment model based on instance-based transfer learning. In Proceedings of the Intelligence Science III: 4th IFIP TC 12 International Conference, ICIS 2020, Durgapur, India, 24–27 February 2021; Revised Selected Papers 4. Springer: Dordrecht, The Netherlands, 2021; pp. 159–169. [Google Scholar]
- Teles, G.; Rodrigues, J.J.; Rabêlo, R.A.; Kozlov, S.A. Comparative study of support vector machines and random forests machine learning algorithms on credit operation. Softw. Pract. Exp. 2021, 51, 2492–2500. [Google Scholar] [CrossRef]
- Orlova, E.V. Decision-making techniques for credit resource management using machine learning and optimization. Information 2020, 11, 144. [Google Scholar] [CrossRef]
- Zou, Y.; Gao, C.; Gao, H. Business failure prediction based on a cost-sensitive extreme gradient boosting machine. IEEE Access 2022, 10, 42623–42639. [Google Scholar] [CrossRef]
- Fritz-Morgenthal, S.; Hein, B.; Papenbrock, J. Financial risk management and explainable, trustworthy, responsible AI. Front. Artif. Intell. 2022, 5, 779799. [Google Scholar] [CrossRef]
- Sun, M.; Li, Y. Credit Risk Simulation of Enterprise Financial Management Based on Machine Learning Algorithm. Mob. Inf. Syst. 2022, 2022, 9007140. [Google Scholar] [CrossRef]
- Mousavi, M.M.; Lin, J. The application of PROMETHEE multi-criteria decision aid in financial decision making: Case of distress prediction models evaluation. Expert Syst. Appl. 2020, 159, 113438. [Google Scholar] [CrossRef]
- Zhao, L.; Yang, S.; Wang, S.; Shen, J. Research on PPP Enterprise Credit Dynamic Prediction Model. Appl. Sci. 2022, 12, 10362. [Google Scholar] [CrossRef]
- Pandey, M.K.; Mittal, M.; Subbiah, K. Optimal balancing & efficient feature ranking approach to minimize credit risk. Int. J. Inf. Manag. Data Insights 2021, 1, 100037. [Google Scholar]
- Pławiak, P.; Abdar, M.; Acharya, U.R. Application of new deep genetic cascade ensemble of SVM classifiers to predict the Australian credit scoring. Appl. Soft Comput. 2019, 84, 105740. [Google Scholar] [CrossRef]
- Cho, S.H.; Shin, K.s. Feature-Weighted Counterfactual-Based Explanation for Bankruptcy Prediction. Expert Syst. Appl. 2023, 216, 119390. [Google Scholar] [CrossRef]
- Bao, W.; Lianju, N.; Yue, K. Integration of unsupervised and supervised machine learning algorithms for credit risk assessment. Expert Syst. Appl. 2019, 128, 301–315. [Google Scholar] [CrossRef]
- Mitra, R.; Goswami, A.; Tiwari, M.K. Financial supply chain analysis with borrower identification in smart lending platform. Expert Syst. Appl. 2022, 208, 118026. [Google Scholar] [CrossRef]
- Jemai, J.; Zarrad, A. Feature Selection Engineering for Credit Risk Assessment in Retail Banking. Information 2023, 14, 200. [Google Scholar] [CrossRef]
- Chen, S.F.; Chakraborty, G.; Li, L.H. Feature selection on credit risk prediction for peer-to-peer lending. In Proceedings of the New Frontiers in Artificial Intelligence: JSAI-isAI 2018 Workshops, JURISIN, AI-Biz, SKL, LENLS, IDAA, Yokohama, Japan, 12–14 November 2018; Revised Selected Papers. Springer: Dordrecht, The Netherlands, 2019; pp. 5–18. [Google Scholar]
- Si, Z.; Niu, H.; Wang, W. Credit Risk Assessment by a Comparison Application of Two Boosting Algorithms. In Fuzzy Systems and Data Mining VIII; IOS Press: Amsterdam, The Netherlands, 2022; pp. 34–40. [Google Scholar]
- Merćep, A.; Mrčela, L.; Birov, M.; Kostanjčar, Z. Deep neural networks for behavioral credit rating. Entropy 2020, 23, 27. [Google Scholar] [CrossRef]
- Bussmann, N.; Giudici, P.; Marinelli, D.; Papenbrock, J. Explainable machine learning in credit risk management. Comput. Econ. 2021, 57, 203–216. [Google Scholar] [CrossRef]
- Moscato, V.; Picariello, A.; Sperlí, G. A benchmark of machine learning approaches for credit score prediction. Expert Syst. Appl. 2021, 165, 113986. [Google Scholar] [CrossRef]
- Ariza-Garzón, M.J.; Arroyo, J.; Caparrini, A.; Segovia-Vargas, M.J. Explainability of a machine learning granting scoring model in peer-to-peer lending. IEEE Access 2020, 8, 64873–64890. [Google Scholar] [CrossRef]
- Chen, X.; Li, S.; Xu, X.; Meng, F.; Cao, W. A novel GSCI-based ensemble approach for credit scoring. IEEE Access 2020, 8, 222449–222465. [Google Scholar] [CrossRef]
- Dumitrescu, E.; Hué, S.; Hurlin, C.; Tokpavi, S. Machine learning for credit scoring: Improving logistic regression with non-linear decision-tree effects. Eur. J. Oper. Res. 2022, 297, 1178–1192. [Google Scholar] [CrossRef]
- Li, D.; Li, L. Research on Efficiency in Credit Risk Prediction Using Logistic-SBM Model. Wirel. Commun. Mob. Comput. 2022, 2022, 5986295. [Google Scholar] [CrossRef]
- Ma, X.; Lv, S. Financial credit risk prediction in internet finance driven by machine learning. Neural Comput. Appl. 2019, 31, 8359–8367. [Google Scholar] [CrossRef]
- Karn, A.L.; Sachin, V.; Sengan, S.; Gandhi, I.; Ravi, L.; Sharma, D.K.; Subramaniyaswamy, V. Designing a Deep Learning-Based Financial Decision Support System for Fintech to Support Corporate Customer’s Credit Extension. Malays. J. Comput. Sci. 2022, 2022, 116–131. [Google Scholar] [CrossRef]
- Zheng, B. Financial default payment predictions using a hybrid of simulated annealing heuristics and extreme gradient boosting machines. Int. J. Internet Technol. Secur. Trans. 2019, 9, 404–425. [Google Scholar] [CrossRef]
- Mancisidor, R.A.; Kampffmeyer, M.; Aas, K.; Jenssen, R. Learning latent representations of bank customers with the variational autoencoder. Expert Syst. Appl. 2021, 164, 114020. [Google Scholar] [CrossRef]
- Wang, T.; Liu, R.; Qi, G. Multi-classification assessment of bank personal credit risk based on multi-source information fusion. Expert Syst. Appl. 2022, 191, 116236. [Google Scholar] [CrossRef]
- Liu, W.; Fan, H.; Xia, M.; Pang, C. Predicting and interpreting financial distress using a weighted boosted tree-based tree. Eng. Appl. Artif. Intell. 2022, 116, 105466. [Google Scholar] [CrossRef]
- Andrade Mancisidor, R.; Kampffmeyer, M.; Aas, K.; Jenssen, R. Deep generative models for reject inference in credit scoring. Knowl.-Based Syst. 2020, 196, 105758. [Google Scholar] [CrossRef]
- Wu, Z. Using machine learning approach to evaluate the excessive financialization risks of trading enterprises. Comput. Econ. 2021, 59, 1607–1625. [Google Scholar] [CrossRef]
- Liu, J.; Zhang, S.; Fan, H. A two-stage hybrid credit risk prediction model based on XGBoost and graph-based deep neural network. Expert Syst. Appl. 2022, 195, 116624. [Google Scholar] [CrossRef]
- Shu, R. Deep Representations with Learned Constraints; Stanford University: Stanford, CA, USA, 2022. [Google Scholar]
- Tripathi, D.; Edla, D.R.; Kuppili, V.; Bablani, A. Evolutionary extreme learning machine with novel activation function for credit scoring. Eng. Appl. Artif. Intell. 2020, 96, 103980. [Google Scholar] [CrossRef]
- Uj, A.; Nmb, E.; Ks, C.; Skl, D. Financial crisis prediction model using ant colony optimization-ScienceDirect. Int. J. Inf. Manag. 2020, 50, 538–556. [Google Scholar]
- Feng, Y. Bank Green Credit Risk Assessment and Management by Mobile Computing and Machine Learning Neural Network under the Efficient Wireless Communication. Wirel. Commun. Mob. Comput. 2022, 2022, 3444317. [Google Scholar] [CrossRef]
- Tian, J.; Li, L. Digital universal financial credit risk analysis using particle swarm optimization algorithm with structure decision tree learning-based evaluation model. Wirel. Commun. Mob. Comput. 2022, 2022, 4060256. [Google Scholar] [CrossRef]
- Chrościcki, D.; Chlebus, M. The Advantage of Case-Tailored Information Metrics for the Development of Predictive Models, Calculated Profit in Credit Scoring. Entropy 2022, 24, 1218. [Google Scholar] [CrossRef]
- de Castro Vieira, J.R.; Barboza, F.; Sobreiro, V.A.; Kimura, H. Machine learning models for credit analysis improvements: Predicting low-income families’ default. Appl. Soft Comput. 2019, 83, 105640. [Google Scholar] [CrossRef]
- Li, Z.; Zhang, J.; Yao, X.; Kou, G. How to identify early defaults in online lending: A cost-sensitive multi-layer learning framework. Knowl.-Based Syst. 2021, 221, 106963. [Google Scholar] [CrossRef]
- Koç, O.; Başer, F.; Kestel, S.A. Credit Risk Evaluation Using Clustering Based Fuzzy Classification Method. Expert Syst. Appl. 2023, 223, 119882. [Google Scholar]
- Rishehchi Fayyaz, M.; Rasouli, M.R.; Amiri, B. A data-driven and network-aware approach for credit risk prediction in supply chain finance. Ind. Manag. Data Syst. 2021, 121, 785–808. [Google Scholar] [CrossRef]
- Muñoz-Cancino, R.; Bravo, C.; Ríos, S.A.; Graña, M. On the combination of graph data for assessing thin-file borrowers’ creditworthiness. Expert Syst. Appl. 2023, 213, 118809. [Google Scholar] [CrossRef]
- Li, Y.; Stasinakis, C.; Yeo, W.M. A hybrid XGBoost-MLP model for credit risk assessment on digital supply chain finance. Forecasting 2022, 4, 184–207. [Google Scholar] [CrossRef]
- Haro, B.; Ortiz, C.; Armas, J. Predictive Model for the Evaluation of Credit Risk in Banking Entities Based on Machine Learning. In Brazilian Technology Symposium; Springer: Dordrecht, The Netherlands, 2018; pp. 605–612. [Google Scholar]
- Qian, H.; Wang, B.; Yuan, M.; Gao, S.; Song, Y. Financial distress prediction using a corrected feature selection measure and gradient boosted decision tree. Expert Syst. Appl. 2022, 190, 116202. [Google Scholar] [CrossRef]
- Alam, T.M.; Shaukat, K.; Hameed, I.A.; Luo, S.; Sarwar, M.U.; Shabbir, S.; Li, J.; Khushi, M. An investigation of credit card default prediction in the imbalanced datasets. IEEE Access 2020, 8, 201173–201198. [Google Scholar] [CrossRef]
- Song, Y.; Peng, Y. A MCDM-based evaluation approach for imbalanced classification methods in financial risk prediction. IEEE Access 2019, 7, 84897–84906. [Google Scholar] [CrossRef]
- Biswas, N.; Mondal, A.S.; Kusumastuti, A.; Saha, S.; Mondal, K.C. Automated credit assessment framework using ETL process and machine learning. Innov. Syst. Softw. Eng. 2022, 1–14. [Google Scholar] [CrossRef]
- Wang, Y. Research on supply chain financial risk assessment based on blockchain and fuzzy neural networks. Wirel. Commun. Mob. Comput. 2021, 2021, 5565980. [Google Scholar] [CrossRef]
- Machado, M.R.; Karray, S. Assessing credit risk of commercial customers using hybrid machine learning algorithms. Expert Syst. Appl. 2022, 200, 116889. [Google Scholar] [CrossRef]


| Motivation | Research Topics |
|---|---|
| We wish to know what models the industry and academics use to predict credit risk. | The algorithms, methods, and models used to predict credit risk. |
| We wish to know what metrics to use in the industry for academics to evaluate the performance of algorithms, methods, or models to predict credit risk. | The metrics to evaluate the performance of algorithms, methods, or models. |
| We wish to know the metrics accuracy, precision, F1 measure, and AUC of algorithms, methods, or models to predict credit risk. | The models’ accuracy, precision, F1 measure, and AUC. |
| We wish to know what datasets to use in the industry and for academics to predict credit risk. | The datasets are used in the prediction of credit risk. |
| We wish to know what variables or features to use in the industry and for academics to predict credit risk. | The variables or features used in the prediction of credit risk. |
| We wish to know the main problems or limitations to predicting credit risk. | The main problems or limitations of predicting credit risk. |
| Id. | Metrics |
|---|---|
| RQ1 | What are the algorithms, methods, and models used to predict credit risk? |
| RQ2 | Which are the metrics to evaluate the performance of algorithms, methods, or models? |
| RQ3 | What are these models’ accuracy, precision, F1 measure, and AUC? |
| RQ4 | What datasets are used in the prediction of credit risk? |
| RQ5 | What variables or features are used to predict credit risk? |
| RQ6 | What are the main problems or limitations of predicting credit risk? |
| Inclusion Criteria | Exclusion Criteria | # | % |
|---|---|---|---|
| Article of conference | 2 | 0.73% | |
| Article of journal | 50 | 18.18% | |
| Article duplicated | 77 | 28.00% | |
| Not related | 15 | 5.45% | |
| Review article | 1 | 0.36% | |
| Without access to the full document | 57 | 20.73% | |
| Without rank in Scimagojr | 73 | 26.55% | |
| Total | 275 | 100.00% |
| It. | Challenges | ML Methods & Techniques | # | Author |
|---|---|---|---|---|
| 1 | Uncertainty | NN, DL, BCAT, MC, MIFCA, FL, GA, HI | 28 | [2,15,17,19,20,28,30,36,37,38,39,40,41,42,43,44,45,46,47,48,49,50,51,52,53,54,55,56,57,58] |
| 2 | Explainability | XAI, SHAP, GSCI, MLIA | 18 | [1,19,20,22,27,28,29,30,31,32,33,34,35,36,37,38,39,40] |
| 3 | Complexity | GA, K-Fold CV, RS, GS | 9 | [15,17,20,23,24,38,56,57,63] |
| 4 | Multivariate Data | BIG DATA | 9 | [1,15,17,23,24,25,59,60,61] |
| 5 | Unbalanced Data | SMOTE, RUS, ROS, KFold, CS, ADASYN | 7 | [20,29,54,55,56,63,64] |
| It. | Family | # | % | ||||
|---|---|---|---|---|---|---|---|
| Ass | N-Ass | Total | Ass | N-Ass | Total | ||
| 1 | Boosted Category | 36 | 46 | 82 | 11.96% | 15.28% | 27.24% |
| 2 | Collective Intelligence | 7 | - | 7 | 2.33% | 0.00% | 2.33% |
| 3 | Fuzzy Logic | 10 | - | 10 | 3.32% | 0.00% | 3.32% |
| 4 | NN/DL | 8 | 28 | 36 | 2.66% | 9.30% | 11.96% |
| 5 | Other Model | 3 | 10 | 13 | 1.00% | 3.32% | 4.32% |
| 6 | Traditional | 18 | 135 | 153 | 5.98% | 44.85% | 50.83% |
| Total | 82 | 219 | 301 | 27.24% | 72.76% | 100.00% | |
| It. | Metrics | # | % | Author |
|---|---|---|---|---|
| 1 | AUC | 34 | 16.11% | [1,2,11,16,17,20,24,25,27,28,30,32,33,34,35,36,37,38,39,40,41,42,43,46,50,54,55,56,57,58,61,62,63,64] |
| 2 | ACC | 30 | 14.22% | [3,11,15,18,25,26,27,28,29,30,31,32,35,36,37,39,44,46,48,50,51,52,53,55,57,58,60,61,62,63,65,65] |
| 3 | F1 | 24 | 11.37% | [11,17,18,24,27,29,30,32,36,37,39,41,42,44,48,51,56,58,60,61,62,63,64,65] |
| 4 | Precis. | 22 | 10.43% | [3,11,17,18,24,27,28,29,30,32,36,39,41,42,44,46,58,60,61,62,65] |
| 5 | Recall | 19 | 9.00% | [11,24,27,28,29,30,36,39,41,42,44,46,58,60,61,62,63,65,66] |
| 6 | TPR | 14 | 6.64% | [16,18,24,25,31,32,35,37,45,50,51,55,57,65] |
| 7 | TNR | 13 | 6.16% | [16,25,31,32,35,37,39,45,50,51,55,57,65] |
| 8 | GMEAN | 9 | 4.27% | [20,31,35,39,45,48,50,63,64] |
| 9 | KS | 7 | 3.32% | [24,36,38,39,43,55,56] |
| 10 | BS | 6 | 2.84% | [33,37,38,55,57,62] |
| 11 | GINNI | 5 | 2.37% | [2,24,38,43,46] |
| 12 | RMSE | 2 | 0.95% | [53,67] |
| 13 | KAPPA | 1 | 0.47% | [51] |
| 14 | MAE | 1 | 0.47% | [67] |
| 15 | Other | 24 | 11.37% | [2,14,23,25,28,33,35,36,38,41,43,45,46,51,53,54,57,59,60,61,62,64,65,67] |
| Total | 211 | 100.00% |
| It. | Dataset | Author | Metrics’ Values | ||||
|---|---|---|---|---|---|---|---|
| ACC | Precision | F1 | Recall | AUC | |||
| 1 | UCI Taiwan | [29] | 85.00 | 70.00 | 50.00 | 62.00 | - |
| 2 | UCI German | [63] | 83.50 | 82.10 | 84.40 | 86.80 | 91.00 |
| 3 | UCI German | [25] | 82.80 | - | - | - | 91.20 |
| 4 | UCI German | [50] | 81.18 | - | - | - | 85.38 |
| 5 | UCI German | [51] | 76.60 | - | 84.74 | - | - |
| 6 | UCI German | [28] | 75.80 | 54.20 | - | 82.00 | 85.90 |
| 7 | UCI German | [57] | 74.90 | - | - | - | 75.80 |
| 8 | UCI German | [16] | - | - | - | - | 79.40 |
| 9 | Lending Club | [32] | 92.60 | 97.90 | 92.20 | - | 97.00 |
| 10 | Lending Club | [65] | 84.40 | 88.99 | 91.42 | 93.98 | - |
| 11 | Lending Club | [30] | 76.10 | 75.98 | 75.95 | 76.35 | 76.80 |
| 12 | Lending Club | [48] | 88.77 | - | 94.14 | - | - |
| 13 | Lending Club | [31] | 74.90 | - | - | - | - |
| 14 | Lending Club | [35] | 64.00 | - | - | - | 71.70 |
| 15 | Lending Club | [36] | 63.60 | 85.30 | 73.50 | 64.50 | 67.40 |
| 16 | Lending Club | [46] | - | 18.25 | - | 46.88 | 63.63 |
| 17 | Lending Club | [56] | - | - | 2.72 | - | 75.86 |
| 18 | K Prosper | [3] | 78.50 | 54.70 | - | - | - |
| 19 | K Prosper | [17] | - | 79.00 | 71.00 | 65.00 | 80.00 |
| 20 | K Give Me | [61] | 88.30 | 78.50 | 77.60 | 76.70 | 93.30 |
| 21 | RenRenDai | [37] | 93.35 | - | 73.12 | - | 82.64 |
| 22 | BR | [55] | 96.68 | - | - | - | 89.63 |
| 23 | AVG Used | [11] | 92.80 | 31.60 | 33.40 | 35.50 | 82.80 |
| 24 | AVG Used | [64] | - | - | 91.89 | - | 96.19 |
| 25 | UCI Austr... | [26] | 97.39 | - | - | - | - |
| 26 | Tsinghua | [52] | 91.23 | - | - | - | - |
| 27 | Tsinghua | [62] | 77.20 | 75.90 | 77.54 | 79.38 | 85.01 |
| 28 | Private Data | [18] | 98.34 | 100.00 | 96.00 | - | - |
| 29 | Private Data | [53] | 98.00 | - | - | - | - |
| 30 | Private Data | [60] | 97.80 | 98.90 | 98.70 | 98.90 | - |
| 31 | Private Data | [15] | 90.10 | - | - | - | - |
| 32 | Private Data | [27] | 84.29 | 82.63 | 84.68 | 86.83 | 84.29 |
| 33 | Private Data | [44] | 84.15 | 82.15 | 83.40 | 84.68 | - |
| 34 | Private Data | [58] | 83.00 | 83.50 | 83.00 | 83.00 | 83.30 |
| 35 | Private Data | [39] | 77.49 | 79.87 | 85.59 | 92.18 | 79.00 |
| 36 | Private Data | [24] | - | 87.15 | 84.56 | 83.91 | 83.59 |
| 37 | Private Data | [54] | - | - | - | - | 46.10 |
| 38 | Private Data | [1] | - | - | - | - | 75.40 |
| 39 | Private Data | [38] | - | - | - | - | 85.68 |
| 40 | Private Data | [33] | - | - | - | - | 93.39 |
| 41 | Private Data | [34] | - | - | - | - | 93.00 |
| 42 | Private Data | [42] | - | 42.81 | 52.00 | 67.01 | 78.00 |
| 43 | Private Data | [40] | - | - | - | - | 71.32 |
| 44 | Private Data | [2] | - | - | - | - | 91.40 |
| 45 | Private Data | [41] | - | 88.00 | 88.00 | 88.00 | 93.00 |
| 46 | Private Data | [43] | - | - | - | - | 77.56 |
| 47 | Private Data | [20] | - | - | - | - | 95.50 |
| It. | Features Group | Feature | # | % |
|---|---|---|---|---|
| 1 | Demographic | External Debt Value/historical | 27 | 5.02% |
| 2 | Demographic | Domestic Debt Value/historical | 27 | 5.02% |
| 3 | Operation | Loan value | 24 | 4.46% |
| 4 | Demographic | Average/Total revenue | 20 | 3.72% |
| 5 | Demographic | Residence/Registered Assets | 19 | 3.53% |
| 6 | Demographic | Economic Activity/Experience | 18 | 3.35% |
| 7 | Demographic | Family Income | 18 | 3.35% |
| 8 | Payment behavior | Days in arrears/Range Days in arrears | 17 | 3.16% |
| 9 | Operation | Historical use of debt | 16 | 2.97% |
| 10 | Operation | Destination of the Credit/Purpose | 16 | 2.97% |
| 11 | Operation | Interest Rate | 16 | 2.97% |
| 12 | External factors | Debt Profitability | 16 | 2.97% |
| 13 | Demographic | Total Debt/Income/DTI | 15 | 2.79% |
| 14 | Demographic | Gender/Sex | 14 | 2.60% |
| 15 | Demographic | Risk Segment/Buro Rating/Score | 14 | 2.60% |
| 16 | Demographic | Age/Date of Birth | 13 | 2.42% |
| 17 | Operation | Checking/Savings Account | 13 | 2.42% |
| 18 | Operation | Credit Line Limit | 13 | 2.42% |
| 19 | Demographic | Civil Status | 12 | 2.23% |
| 20 | Demographic | Mortgage Debt | 12 | 2.23% |
| 21 | Operation | Monthly Fees | 12 | 2.23% |
| 22 | Payment behavior | Collection status | 11 | 2.04% |
| 23 | Payment behavior | Unpaid Installment Number | 11 | 2.04% |
| 24 | Demographic | Financial maturity | 9 | 1.67% |
| 25 | Demographic | Residence type | 9 | 1.67% |
| 26 | Demographic | Fee value | 9 | 1.67% |
| 27 | External factors | Inventory turnover | 9 | 1.67% |
| 28 | Demographic | Labor Old | 7 | 1.30% |
| 29 | Demographic | Education Level | 7 | 1.30% |
| 30 | Others | Others | 114 | 21.21% |
| Total | 538 | 100.00% |
| It. | Features Group | # | % |
|---|---|---|---|
| 1 | Demographic | 291 | 54.09% |
| 2 | Operation | 157 | 29.18% |
| 3 | Payment behavior | 41 | 7.62% |
| 4 | External factors | 36 | 6.69% |
| 5 | Unstructured data | 7 | 1.30% |
| 6 | Transaction | 6 | 1.12% |
| Total | 538 | 100.00% |
| It. | Limits Identified | # | % |
|---|---|---|---|
| 1 | Representativeness of reality | 39 | 31.71% |
| 2 | Unbalanced data | 35 | 28.46% |
| 3 | Inconsistency in information recording | 21 | 17.07% |
| 4 | Lack of ability to explain the proposed results | 16 | 13.01% |
| 5 | Availability of information and centralized processing | 7 | 5.69% |
| 6 | Adaptability in processing struct. and unstruct. information | 5 | 4.07% |
| Total | 123 | 100.00% |
| It. | Method | # | % | Author |
|---|---|---|---|---|
| 1 | KFold CV | 21 | 58.33% | [1,2,15,18,26,28,29,31,33,35,38,40,41,43,45,46,50,55,59,62,67] |
| 2 | Grid Search Method | 8 | 22.22% | [11,15,16,44,48,56,57,63] |
| 3 | LightGBM Bayesian Optimization | 2 | 5.56% | [20,56] |
| 4 | Genetic Algorithm | 2 | 5.56% | [26,52] |
| 5 | Random Search | 1 | 2.78% | [20] |
| 6 | Ant Colony Optimization | 1 | 2.78% | [53] |
| 7 | Other | 1 | 2.78% | [65] |
| Total | 36 | 100.00% |
| It. | Method | # | % | Author |
|---|---|---|---|---|
| 1 | SMOTE | 13 | 29.55% | [2,11,15,20,25,30,32,35,36,44,45,63,64] |
| 2 | KFold | 9 | 20.45% | [14,16,24,25,26,29,50,55,57] |
| 3 | ROS | 5 | 11.36% | [2,20,35,45,63] |
| 4 | RUS | 5 | 11.36% | [2,20,45,63,64] |
| 5 | ADASYN | 2 | 4.55% | [35,63] |
| 6 | SMOTEBoost | 2 | 4.55% | [20,64] |
| 7 | B-SMOT | 1 | 2.27% | [63] |
| 8 | CC | 1 | 2.27% | [63] |
| 9 | CS-Classifiers | 1 | 2.27% | [64] |
| 10 | KN-SMOTE | 1 | 2.27% | [63] |
| 11 | NMISS | 1 | 2.27% | [63] |
| 12 | RESAMPLE | 1 | 2.27% | [48] |
| 13 | SMOTE-T | 1 | 2.27% | [63] |
| 14 | Under-Bagging | 1 | 2.27% | [64] |
| Total | 44 | 100.00% |
| It. | Family | 2019 | 2020 | 2021 | 2022 | 2023 | Total |
|---|---|---|---|---|---|---|---|
| 1 | Boosted Category | 4 | 4 | 5 | 10 | 1 | 24 |
| 2 | Traditional | 4 | 1 | 5 | 4 | 1 | 15 |
| 3 | NN/DL | 1 | 1 | 2 | 2 | 1 | 7 |
| 4 | Collective Intelligence | 2 | 2 | 4 | |||
| 5 | Fuzzy Logic | 1 | 1 | 2 | |||
| Total | 9 | 9 | 12 | 18 | 4 | 52 |
Disclaimer/Publisher’s Note: The statements, opinions and data contained in all publications are solely those of the individual author(s) and contributor(s) and not of MDPI and/or the editor(s). MDPI and/or the editor(s) disclaim responsibility for any injury to people or property resulting from any ideas, methods, instructions or products referred to in the content. |
© 2023 by the authors. Licensee MDPI, Basel, Switzerland. This article is an open access article distributed under the terms and conditions of the Creative Commons Attribution (CC BY) license (https://creativecommons.org/licenses/by/4.0/).
Share and Cite
Noriega, J.P.; Rivera, L.A.; Herrera, J.A. Machine Learning for Credit Risk Prediction: A Systematic Literature Review. Data 2023, 8, 169. https://doi.org/10.3390/data8110169
Noriega JP, Rivera LA, Herrera JA. Machine Learning for Credit Risk Prediction: A Systematic Literature Review. Data. 2023; 8(11):169. https://doi.org/10.3390/data8110169
Chicago/Turabian StyleNoriega, Jomark Pablo, Luis Antonio Rivera, and José Alfredo Herrera. 2023. "Machine Learning for Credit Risk Prediction: A Systematic Literature Review" Data 8, no. 11: 169. https://doi.org/10.3390/data8110169