Data Descriptor

Climate Dataset for South Africa by the Agricultural Research Council

by
Mokhele Edmond Moeletsi
1,2,*,
Lindumusa Myeni
1,
Ludwig Christian Kaempffer
1,
Derick Vermaak
1,
Gert de Nysschen
1,
Chrisna Henningse
1,
Irene Nel
1 and
Dudley Rowswell
1
1
Agricultural Research Council—Natural Resources and Engineering, Private Bag X79, Pretoria 0001, South Africa
2
Risks and Vulnerability Assessment Centre, University of Limpopo, Private Bag X1106, Polokwane 0727, South Africa
*
Author to whom correspondence should be addressed.
Data 2022, 7(8), 117; https://doi.org/10.3390/data7080117
Submission received: 11 June 2022 / Revised: 3 August 2022 / Accepted: 4 August 2022 / Published: 17 August 2022

Abstract

:
Long-term, reliable, continuous and real-time weather and climatic data are essential for efficient management and sustainable use of natural resources. This paper describes the weather station network (WSN) of the Agricultural Research Council (ARC) of South Africa, including information on instrumentation, data retrieval and processing protocols, calibration and maintenance protocols, as well as applications of the collected data. To this end, the WSN of the ARC consists of over 600 automatic weather stations that are distributed across the country to cover a wide range of agro-climatic zones. At each weather station, air temperature, rainfall, relative humidity, solar irradiance, wind speed and direction are monitored and archived on an hourly basis. The main objective of this WSN is to archive climate information for South Africa as well as supply the agricultural community with weather data to support decision-making.
Dataset License: CC-BY

1. Summary

The need for weather and climatic data is becoming more urgent to support efficient water management, sustainable agricultural productivity, weather forecasting, validation of hydrological and crop models, and drought and flood management as climate change threatens the livelihoods of the communities of South Africa [1,2,3,4,5,6,7]. A climate dataset is essential for the development and validation of early warning systems for weather disasters and remote sensing products [3,8,9]. Furthermore, a long-term climate dataset is critical in climate change studies to develop decision-support tools required for efficient adaptation and mitigation strategies [10,11,12,13,14,15]. The importance of long-term, reliable, continuous and real-time weather and climatic data covering a wide range of agro-climatic zones of South Africa cannot be over-emphasized for efficient management and sustainable use of natural resources.
This paper aims at providing a description of the WSN of the ARC, including information on the spatial distribution of stations, instrumentation, data retrieval and processing, as well as calibration and maintenance protocols. This information is normally not well documented and not readily available to the end-users, thus limiting the utility of the collected data and could result in misleading conclusions. Therefore, there is a need to provide a full operational description so that end-users can efficiently utilize and interpret these datasets.

2. Data Description

2.1. Overview of the Weather Station Network of the Agricultural Research Council

2.1.1. History of the Weather Station Network of the Agricultural Research Council

The WSN of the ARC dates back to the early 1900s when rainfall was measured mostly on experimental farms of the Department of Agriculture across South Africa. However, the first fully mechanical weather station was installed in 1941 at Bien Donne winery experimental farm located in the Paarl wine lands region of the Western Cape Province. This type of weather station measured air temperature, rainfall, humidity, pan evaporation and wind run (Figure 1). In 1970, the WSN of the ARC comprised about 80 mechanical weather stations around the country which increased to more than 450 by the year 2000. Mechanical weather stations were phased out in the early 2000s as the new technology of automatic weather stations was introduced in South Africa. The ARC installed its first automatic weather station in 1992 (Figure 2) and the WSN of the ARC currently comprises around 600 automatic weather stations. At this point, it is worth mentioning that mechanical and automatic weather stations were operated in parallel for an extended period at some sites before the mechanical stations were phased out. This allowed for a long-term comparison of the two types of weather stations and enabled the homogenization of the datasets. For example, three stations were selected to compare datasets from mechanical and automatic weather stations. These sites were selected based on the availability of long records of quality datasets from both mechanical and automatic weather stations at different climatic conditions. The characteristics of the three stations are presented in Table 1. Comparisons between the mechanical and automatic weather stations at the selected sites indicate reasonable agreement, with coefficient of determination ( r 2 ) values ranging from 0.73 to 0.99 and index of agreement ( d ) values ranging from 0.91 to 0.99 (Table 2). Although the correlations between the datasets from mechanical and automatic weather stations were reasonable, there were discrepancies, particularly in parameters, that were computed from the observations such as sunshine hours (solar irradiance) and wind run (wind speed). These discrepancies could be attributed to the different instrumentation, theoretical assumptions and coefficients used in computing the equivalent data from the mechanical stations to match the datasets from automatic weather stations.

2.1.2. Location and Distribution of Weather Stations of the Agricultural Research Council

The WSN of the ARC has monitoring points in different agro-climatic zones and mostly in agriculturally active regions of South Africa (Figure 3). Thus, weather station density is high in traditional commercial farming areas of the country including the wine-, fruit- and grain-producing regions of the Western Cape Province. Monitoring points are sparse in the Northern Cape Province due to relatively low agricultural activity in this arid region.

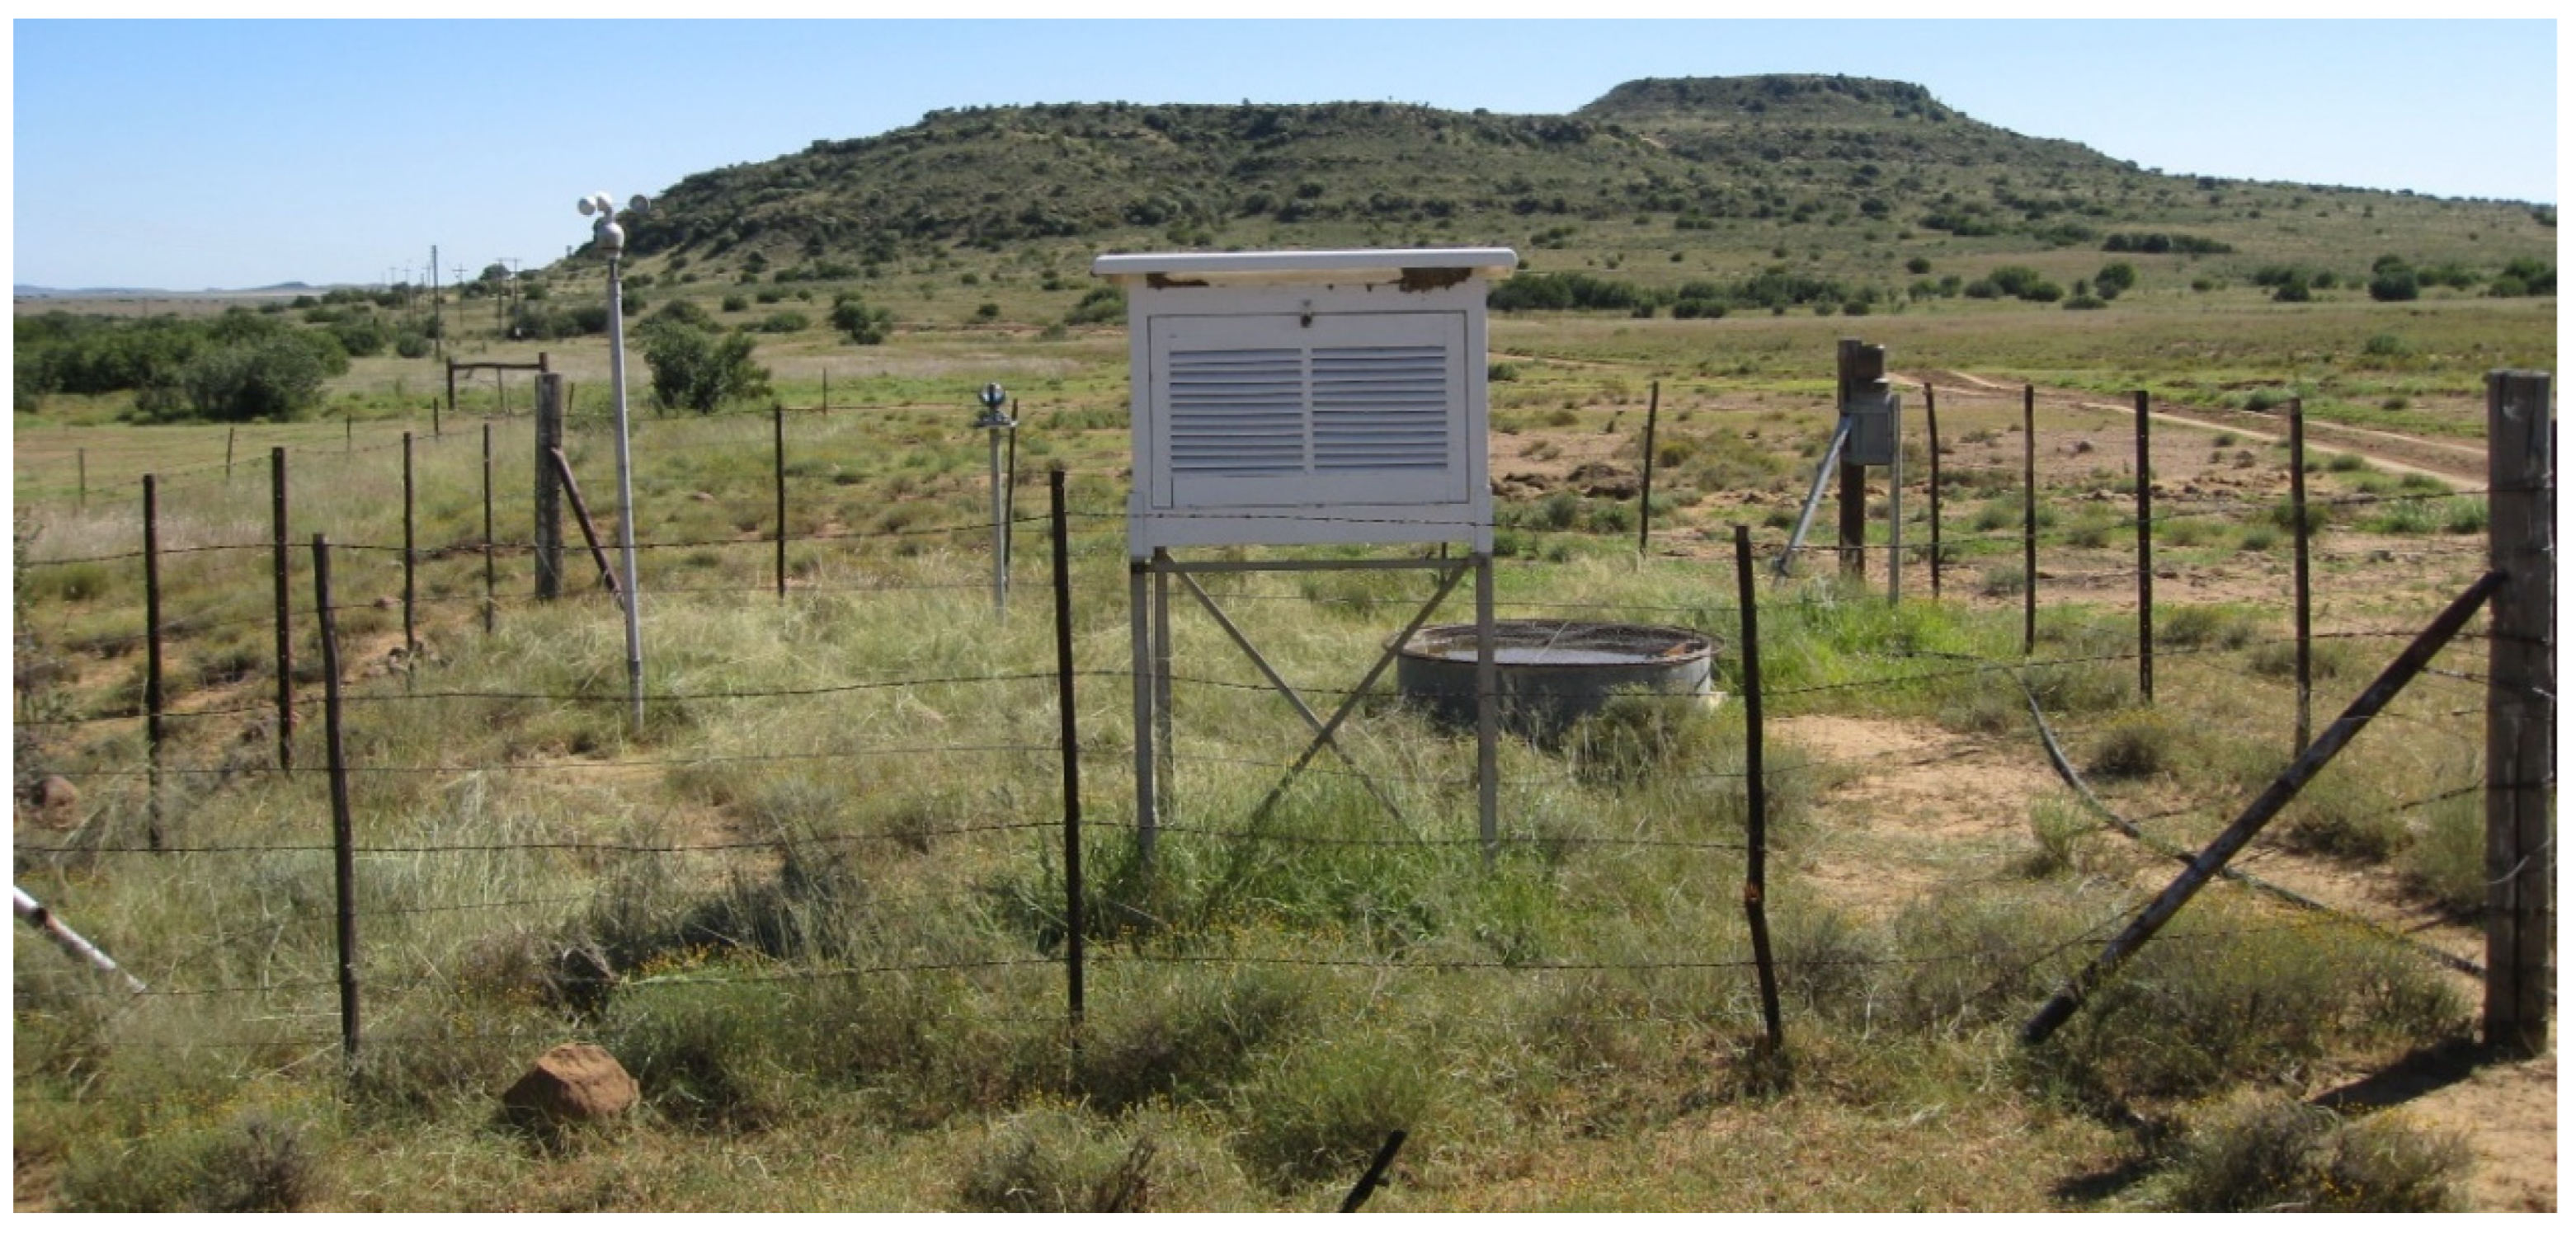
2.1.3. Instrumentation and Data Logging

The weather stations of the ARC are installed away from obstructions such as trees and buildings in accordance with the World Meteorological Organization (WMO) standards to attain representative meteorological data [16]. Each station is equipped with air temperature and relative humidity, wind speed, wind direction, rain gauge and solar radiation sensors, but only about 25 stations are also equipped with barometric sensors and soil moisture probes. Table 3 shows the height at which the sensors are installed as per the recommendations of the WMO [16]. Detailed information about the soil moisture network of the ARC was described by Myeni et al. [17].
Each automatic weather station is equipped with a weather station structure (stand), lockable enclosure, data logger, General Packet Radio Services (GPRS) modem, battery (12 volts power) and solar panel. All stations collect data from sensors at 10 s intervals which are averaged or summed to hourly outputs and then stored in the station’s internal storage. Rainfall is recorded every 1 s and averaged at 5 min intervals to support the analysis of rainfall intensity.

2.2. Network Maintenance

The ARC maintenance protocol states that all weather stations need to be visited at least twice a year by qualified technicians for maintenance or calibration. During each site visit, calibrations are undertaken using a test kit (new and calibrated sensors) by comparing the data with values from the sensors of the weather station. The rain gauge is also tipped to ensure that the tip is actually registered and that the number of tips is compared to the readings from the rain gauge for testing purposes—this is then removed from the data. The sensors are then cleaned or replaced, if required, to ensure accurate readings. In addition, the station is cleaned to remove any obstacles shadowing the sensors and the grass is cut. Technicians also ensure that there is communication between the servers in the office and the station that is currently being visited. Furthermore, every time a weather station is visited, the technician takes a set of four photos in specific directions (North, South, East and West) and one of the insides of the enclosure showing the data logger, modem and battery (Figure 4). In addition, a maintenance and calibration (MAC) form is captured (Figure 5). The MAC form and photos are used as metadata and stored in the database. The station metadata consists of detailed notes on any changes, maintenance and operations undertaken during each site visit, the date and time, as well as possible future changes that will be due during the next visit. These data assist technicians and management in the planning of weather station visits for routine maintenance. The metadata also provides other end-users with all the other necessary information regarding station location, land use/cover, soil type and instrumentation to assist them in correctly interpreting datasets.

2.3. Data retrieval, Processing and Quality Assurance

All meteorological data are retrieved from stations equipped with GPRS modems with private Access Point Name (APN) access security using LoggerNet software (Campbell Scientific Inc., Logan, UT, USA). Each station has been allocated with its own Internet Protocol (IP) address and is contacted hourly to download the latest available data. During the data transmission process, stations communicate in batches for a maximum of five retries per station, and thereafter, failed data transmissions are flagged and investigated. The data are in a plain text file format with commas separating the values and are stored in a Structured Query Language (SQL) database hosted in the ARC’s Information and Communications Technology (ICT) infrastructure. The hourly data retrieval is to ensure the availability of near real-time data, and it is also an early indication of any problems at the stations to minimize the potential data loss. The datalogger also has a storage capability in cases of communication failure which can be up to 6 months depending on the type of logger.
Before being stored in the database, the retrieved data undergoes a quality control routine to identify missing and erroneous data as well as to ensure the consistency of the collected data such that it meet the quality standards of the WMO [16]. The quality control routine of the retrieved data is performed in two steps on a daily basis:
The first step involves an automatic quality control process, where all the data undergoes a set of tests with boundary values to check for missing values, range, rate of change, consistency, suspiciously persistent, extreme and sensor drift [16]. Furthermore, logical tests of relationships between different weather parameters are also undertaken at this stage of data quality control. For example, minimum air temperature values must be less than maximum air temperature values, wind speed must always be greater than zero and relative humidity values must be greater than zero but less than or equal to 100% with minimum humidity values less than maximum humidity values. The missing and erroneous (coded) datasets are highlighted in a fault report, which is sent to the technician responsible for the maintenance of the particular station to help ascertain the possible cause of the data faults. The missing and erroneous data are removed from the datasets that are disseminated to the users, and the specific reason for the missing data is also provided to the user.
The second step involves the use of daily data reports to examine data in graphs and tables to identify meteorologically improbable or impossible values. This ensures that values are within the acceptable range limits. For example, air temperature values of less than −10 °C in the middle of summer, relative humidity values of less than 5% and rainfall of more than 200 mm per day are mostly improbable for South African climatic conditions. Although this is a very robust check, it is important in evaluating the general state of the data observed at each weather station. The values that are considered improbable or suspicious are flagged and investigated. Suspicious values are checked against the sources and nearby weather stations to confirm their integrity, while faulty data is either corrected if the origin of the fault is known or otherwise removed and copied into a “fault database” for historic value and possible future correction.
The third step involves the use of GIS rainfall surfaces to identify high or low rainfall errors at some stations as the normal tests cannot easily indicate low measured rainfall, especially in summer rainfall areas.
It is important to note that data might be affected by certain non-climatic inhomogeneities such as a change in station location, changes in instrumentation, changes in the frequency or time of observations and a change in land use. Although the weather stations of the ARC are generally located in agricultural sites where future changes in land use are minimal, there are some cases where these changes could not be avoided (e.g., if the farm is no longer productive and is converted into a different land use that is more productive) and such changes are documented in the meta-database. Furthermore, in the case where an individual sensor needs to be replaced due to damage or theft, it is always replaced by a similar sensor, installed in the same position and follows a similar procedure as the previous sensor. In cases where sensors are being upgraded or replaced with new models, ideally, the previous and new sensor models are run in parallel for long enough before discontinuing the old type of sensor to enable data homogenization. All changes and operations undertaken are documented in a meta-database that is available to the user by request. At this point, scientific users should be encouraged to conduct their own statistical tests to detect and adjust for any non-climatic inhomogeneities using statistical packages, such as the Climatol tool (https://www.climatol.eu/ accessed on 25 July 2022), to avoid potential errors that could compromise the integrity of these long-term datasets.

2.4. Data Visualization and Storage

Each weather station is identified by a unique code (known as the station identity number) that includes the name of the station, which often refers to the town or village or farm where the data is collected. Alongside the type of weather station (either mechanical or automatic), geographical data such as latitude, longitude and elevation are also included in the station identification. Furthermore, these station identifications are also used to link the climate data for each station to the metadata tables that are stored in Excel format in the SQL database.
Hourly, daily, monthly, yearly or long-term average data of air temperature (average, minimum, maximum, as well as the single extreme minimum and maximum values for the day), rainfall, relative humidity (minimum and maximum values), solar irradiance, wind speed and direction, as well as calculated reference evapotranspiration, the meteorological data of the cold and heat units are stored in the agro-climate databank of the ARC. Detailed information about all the meteorological data available in the databank can be found in Table 4 and Table 5. These datasets vary due to instrumentation changes and technological advances. Data availability is dependent on the technology of the weather stations and can be described as historical data and near real-time data.

2.5. Data Availability and Dissemination

The climate summaries of selected weather stations with long-term datasets are available at: https://www.arc.agric.za/arc-iscw/Pages/Agrometeorology-Reports.aspx, accessed on 5 August 2022. This information on the deviations of the monthly rainfall and air temperature averages from the long-term mean (1991–2020) is critical for understanding and monitoring the climate variability and longer-term changes and trends. Additional climate data are available on request at:
ARC-Natural Resources and Engineering
Tel: +27 (0)12 310 2500
Fax: +27 (0)12 323 1157
Physical address: 600 Belvedere Street, Arcadia, Pretoria, South Africa
Postal address: Private Bag X79, Pretoria, 0001
GPS coordinates: 25°44′19.4″ S, 28°12′26.4″ E
For downstream applications, Application Programming Interfaces (API’s) with strict security measures are used to access these climate data.

2.6. Challenges in the Weather Station Network of the ARC

Like any other national weather station network, the WSN of the ARC faces several operational challenges. The extent of this WSN is such that a significant investment is needed to maintain it to WMO standards. In some cases, issues such as the availability of stock in the market due to several reasons have an impact on the time taken to replace malfunctioning sensors. Most of the stock in Africa is imported from overseas and thus the procuring of equipment and sensors can take extended periods and results in the delayed replacement of sensors in the network. Furthermore, lack of financial resources can be one of the factors causing a prolonged period of missing data in the WSN of the ARC.
One of the major obstacles is the clogging of the tipping bucket rain gauges and this affects the continuity and integrity of the collected rainfall data. The main sources of clogging are dust and leaves deposited by the wind, as well as the accumulation of bird droppings in the funnel of the rain gauge. Spider webs also interfere with the wind speed and rainfall sensors in some stations. The solar radiation sensors are sometimes shaded by dust and bird droppings, thus resulting in lower readings of solar irradiance. Solar panels also get covered by dust and bird droppings causing a drop in battery voltage that influences all the sensors and communication with the station. Furthermore, dust, mist and lichens can accumulate in the fins of Gill screens and influence the temperature and humidity readings, particularly in humid regions such as the Mpumalanga Lowveld and the eastern coastal belt. Wasps tend to nest in the Gill screens which causes the temperature and RH readings to increase unnaturally. In some stations, especially those located in areas with high vegetation cover, runner plants tend to grow along and shade instruments, resulting in lower wind speed readings.
The WSN of the ARC experiences vandalism and theft of some weather stations, which is a serious problem that affects the continuity of the data. Furthermore, some of the sensors and cables are damaged by either livestock or wild animals, sunshine and extreme temperatures, which also has an impact on the continuity of the data. Network failures and cellphone modem malfunctions are among the other setbacks that are faced by the WSN of the ARC.

2.7. Scientific Importance and Use of Climatic Datasets from the Weather Station Network of the ARC

The primary goal of the WSN of the ARC is to supply the agricultural community with weather data to inform decision-making on planning and efficient management of resources for sustainable agricultural productivity. For example, these data form the basis of the monthly Umlindi “Watchman” newsletter produced by the ARC (https://www.arc.agric.za/arc-iscw/Pages/News-Articles.aspx, accessed on 5 August 2022). This newsletter aims to provide the agricultural community with weather information and its implications on agriculture, as well as provide the relevant adaptation strategies to enhance agricultural productivity and climate resilience.
The data from the WSN of the ARC can also be used to support mobile applications like the AgriCloud application which was developed and tested for South African farmers as part of the Rain for Africa project (https://www.rain4africa.org/, accessed on 5 August 2022). This mobile application provides rainfed maize farmers with timely weather-based advisories, such as the selection of planting dates and suitable days for spraying herbicides and pesticides at their specific farms [18].
The climatic datasets have been used extensively for scientific research purposes and the development of South African government policies [3,7,13,14,15,19,20,21,22,23]. Specifically, datasets from the WSN of the ARC are being used in a wide range of fields of research such as agriculture, climate change, variability and impact studies, disaster management as well as environment, water and natural resources assessments, amongst others. Researchers are encouraged to use these long-term and reliable datasets in any other relevant studies. However, it is recommended that further data quality control measures and homogeneity testing procedures be undertaken to ensure that the dataset supplied meets the specific quality standards of its intended use. Furthermore, several tools for climate data patching have been developed by researchers of the ARC to support the use of data from the WSN in climate research [24,25].

3. Concluding Remarks and Recommendations

This paper describes the operational WSN of the ARC, which is distributed across a wide range of agro-climatic zones, mostly in agriculturally active regions. Data from the WSN of the ARC are important for the government of South Africa, scientific research and the agricultural community, and thus there is a need to maintain high-quality standards of the monitored meteorological data. Establishing, operating and maintaining such a national WSN requires significant financial investment in resources, equipment and capacity building.

Author Contributions

The manuscript was conceptualized by M.E.M. and L.M. Information was provided by D.V., C.H., G.d.N., L.C.K., I.N. and D.R., L.M. and M.E.M. compiled the manuscript. All authors have read and agreed to the published version of the manuscript.

Funding

This project was funded by the Agricultural Research Council, Project Numbers P07000012 and P07000014.

Institutional Review Board Statement

Not applicable.

Informed Consent Statement

Not applicable.

Data Availability Statement

Additional climate data are available on request at: ARC-Natural Resources and Engineering.

Acknowledgments

The field technicians of the Agrometeorology division of the ARC are gratefully acknowledged for the installation and maintenance of the weather stations. The authors also acknowledge Thomas Fyfield (ARC) for editorial assistance.

Conflicts of Interest

The authors declare no conflict of interest.

References

  1. Bryan, E.; Deressa, T.T.; Gbetibouo, G.A.; Ringler, C. Adaptation to climate change in Ethiopia and South Africa: Options and constraints. Environ. Sci. Policy 2009, 12, 413–426. [Google Scholar] [CrossRef]
  2. Bugan, R.D.H.; Jovanovic, N.Z.; de Clercq, W.P. The water balance of a seasonal stream in the semi-arid Western Cape (South Africa). Water SA 2012, 38, 201–212. [Google Scholar] [CrossRef]
  3. Landman, S.; Engelbrecht, F.A.; Engelbrecht, C.J. A short-range weather prediction system for South Africa based on a multi-model approach. Water SA 2012, 38, 765–774. [Google Scholar] [CrossRef]
  4. Gandure, S.; Walker, S.; Botha, J.J. Farmers’ perceptions of adaptation to climate change and water stress in a South African rural community. Environ. Dev. 2013, 5, 39–53. [Google Scholar] [CrossRef]
  5. Zinyengere, N.; Crespo, O.; Hachigonta, S.; Tadross, M. Crop model usefulness in drylands of southern Africa: An application of DSSAT. South Afr. J. Plant Soil 2015, 32, 95–104. [Google Scholar] [CrossRef]
  6. Stander, J.H.; Dyson, L.; Engelbrecht, C.J. A snow forecasting decision tree for significant snowfall over the interior of South Africa. South Afr. J. Sci. 2016, 112, 1–10. [Google Scholar] [CrossRef]
  7. Myeni, L.; Moeletsi, M.E.; Clulow, A.D. Development and analysis of a long-term soil moisture data set in three different agroclimatic zones of South Africa. South Afr. J. Sci. 2021, 117, 1–8. [Google Scholar] [CrossRef]
  8. Musyoki, A.; Thifhulufhelwi, R.; Murungweni, F.M. The impact of and responses to flooding in Thulamela Municipality, Limpopo Province, South Africa. Jàmbá J. Disaster Risk Stud. 2016, 8, a166. [Google Scholar] [CrossRef]
  9. Nhamo, L.; Mabhaudhi, T.; Modi, A.T. Preparedness or repeated short-term relief aid? Building drought resilience through early warning in southern Africa. Water SA 2019, 45, 75–85. [Google Scholar] [CrossRef]
  10. Moeletsi, M.E.; Moopisa, S.G.; Walker, S.; Tsubo, M. Development of an agroclimatological risk tool for dryland maize production in the Free State Province of South Africa. Comput. Electron. Agric. 2013, 95, 108–121. [Google Scholar] [CrossRef]
  11. Moeletsi, M.E.; Mellaart, E.A.R.; Mpandeli, N.S.; Hamandawana, H. The use of rainfall forecasts as a decision guide for small-scale farming in Limpopo Province, South Africa. J. Agric. Educ. Ext. 2013, 19, 133–145. [Google Scholar] [CrossRef]
  12. Shikwambana, S.; Malaza, N.; Shale, K. Impacts of Rainfall and Temperature Changes on Smallholder Agriculture in the Limpopo Province, South Africa. Water 2021, 13, 2872. [Google Scholar] [CrossRef]
  13. Ziervogel, G.; New, M.; Archer van Garderen, E.; Midgley, G.; Taylor, A.; Hamann, R.; Stuart-Hill, S.; Myers, J.; Warburton, M. Climate change impacts and adaptation in South Africa. Wiley Interdiscip. Rev. Clim. Chang. 2014, 5, 605–620. [Google Scholar] [CrossRef]
  14. Moeletsi, M.E.; Tongwane, M.I. Spatiotemporal Variation of Frost within Growing Periods. Adv. Meteorol. 2017, 2017, 5472869. [Google Scholar] [CrossRef]
  15. Jury, M.R. Climate trends across South Africa since 1980. Water SA 2018, 44, 297–307. [Google Scholar] [CrossRef]
  16. Zahumenský, I. Guidelines on Quality Control Procedures for Data from Automatic Weather Stations. World Meteorol. Organ. Switz. 2004, 1–10. Available online: https://library.wmo.int/?lvl=notice_display&id=21988#.YpCZHChBxPY (accessed on 18 April 2022).
  17. Myeni, L.; Moeletsi, M.E.; Clulow, A.D. Present status of soil moisture estimation over the African continent. J. Hydrol. Reg. Stud. 2019, 21, 14–24. [Google Scholar] [CrossRef]
  18. Walker, S. Value-added weather advisories for small-scale farmers in South Africa delivered via mobile apps*. Irrig. Drain. 2021, 70, 505–511. [Google Scholar] [CrossRef]
  19. Moeletsi, M.E.; Walker, S.; Landman, W.A. ENSO and implications on rainfall characteristics with reference to maize production in the Free State Province of South Africa. Phys. Chem. Earth Parts A/B/C 2011, 36, 715–726. [Google Scholar] [CrossRef]
  20. Malherbe, J.; Engelbrecht, F.A.; Landman, W.A.; Engelbrecht, C.J. Tropical systems from the southwest Indian Ocean making landfall over the Limpopo River Basin, southern Africa: A historical perspective. Int. J. Climatol. 2012, 32, 1018–1032. [Google Scholar] [CrossRef]
  21. Tongwane, M.I.; Savage, M.J.; Tsubo, M.; Moeletsi, M.E. Seasonal variation of reference evapotranspiration and Priestley-Taylor coefficient in the eastern Free State, South Africa. Agric. Water Manag. 2017, 187, 122–130. [Google Scholar] [CrossRef]
  22. Myeni, L.; Moeletsi, M.E.; Clulow, A.D. Assessment of three models for estimating daily net radiation in southern Africa. Agric. Water Manag. 2020, 229, 105951. [Google Scholar] [CrossRef]
  23. Myeni, L.; Moeletsi, M.E.; Clulow, A.D. Development and validation of an operational multi-layered model for estimation of soil moisture at point-scale in South Africa. South Afr. J. Plant Soil 2022, 39, 28–40. [Google Scholar] [CrossRef]
  24. Moeletsi, M.E.; Shabalala, Z.P.; De Nysschen, G.; Walker, S. Evaluation of an inverse distance weighting method for patching daily and dekadal rainfall over the Free State Province, South Africa. Water SA 2016, 42, 466–474. [Google Scholar] [CrossRef]
  25. Shabalala, Z.P.; Moeletsi, M.E.; Tongwane, M.I.; Mazibuko, S.M. Evaluation of Infilling Methods for Time Series of Daily Temperature Data: Case Study of Limpopo Province, South Africa. Climate 2019, 7, 86. [Google Scholar] [CrossRef]
Figure 1. A typical mechanical weather station of the Agricultural Research Council.
Data 07 00117 g001
Figure 2. A typical automatic weather station of the Agricultural Research Council.
Data 07 00117 g002
Figure 3. Location of the weather stations in the network of the Agricultural Research Council in the year 2022.
Data 07 00117 g003
Figure 4. An example of the photos captured during each weather station visit: four showing the station from each direction and one showing the inside of the enclosure with the data logger, modem and battery.
Data 07 00117 g004
Figure 5. An example of the maintenance and calibration (MAC) form captured by a technician during each station visit for the meta-database.
Data 07 00117 g005
Table 1. Characteristics of three stations used in this study.
SiteLatitude (°S)Longitude (°E)Elevation (m a.s.l.)Climatic ConditionsData Period
Alice−32.7826.85520Arid, steppe and hot aridJune 2008 to December 2015
Kakamas−28.7920.66662Arid, desert and hot aridJanuary 2000 to October 2003
Moorresburg−33.1518.67199Warm temperate, winter dry, cool summerJuly 2012 to June 2014
Description of climatic conditions according to the Köppen-Geiger climate classification (http://stepsa.org/climate_koppen_geiger.html: accessed on 25 July 2022).
Table 2. Statistical results of comparisons between datasets from mechanical and automatic weather stations at three selected sites.
SiteStatistics T n   T x   R H n   R H x   U R s R a i n f a l
Alice n 2554265625212427248519712645
r 2 0.970.980.950.780.740.830.99
RMSE1.060.964.413.060.332.820.167
MBE−0.06−0.411.45−0.530.01−0.01−0.01
d 0.980.990.980.920.930.950.99
Kakamas n 11481177720362115511761278
r 2 0.960.980.810.950.730.950.91
RMSE1.751.045.075.750.412.620.32
MBE−1.10−0.17−1.493.630.031.580.02
d 0.980.990.940.970.920.920.97
Moorresburg n 715717386281621226719
r 2 0.960.990.960.900.830.960.99
RMSE0.990.576.046.420.471.730.49
MBE−0.200.095.075.480.27−0.76−0.15
d 0.980.990.950.910.990.980.99
T n ,   T x are minimum and maximum air temperature (°C), respectively,   R H n , R H x are minimum and maximum relative humidity (%), respectively,   U (m s−1) is the wind speed, R s (MJ m−2) is the solar irradiance, rainfall (mm), n is the number of observations, r 2 is the regression coefficient, RMSE is the root mean square error, MBE is the mean bias error and d is the index of agreement. RMSE is the root mean square error, MBE is the mean bias error and d is the index of agreement. RMSE and MBE values are expressed in the same unit as the weather variable of interest.
Table 3. Installation height of the main instruments in the weather station network of the Agricultural Research Council.
Weather ParameterHeight above the Soil Surface (cm)
Rainfall120
Air temperature120
Relative humidity120
Solar irradiance130
Wind speed and direction200
Soil moisture and temperature−10, −20, −30, −40, −60 and −90
Table 4. Hourly weather parameters currently measured from the automatic weather stations.
Weather ParameterAbbreviationUnitDate of First Measurement (Average Start)Average Years with Data (Maximum Years)
Average air temperatureT°C1 Janaury 1992 (9 December 200510 (27)
Total solar irradianceRsW m−21 March 2004 (19 October 2010)7 (15)
Average wind speedU2m s−122 June 1992 (1 June 2006)10 (24)
Average wind directionUdirdegrees22 June 1992 (1 June 2006)10 (24)
Total rainfallRainmm1 Junaury 1992 (6 June 2006)10 (24)
Average relative humidityRh%1 January 1992 (17 June 2006)10 (27)
Table 5. Daily weather parameters measured from the mechanical weather stations.
Weather ParameterAbbreviationUnitDate of First Measurement (Average Start)Average Years with Data (Maximum Years)
Maximum air temperatureTx°C1 January 1903 (1 November 1977)23 (94)
Minimum air temperatureTn°C1 Junaury 1903 (1 Septmeber 1978)22 (94)
RainfallRRmm1 January 1900 (1 May 1987)20 (114)
Pan evaporationEvapmm1 November 1909 (1 April 1981)21 (92)
Sunshine hoursSSh1 November 1909 (30 December 1983)19 (92)
WindrunUtotkm1 November 1909 (4 August 1983)19 (92)
Maximum relative humidityRHx%1 November 1909 (17 February 1982)20 (92)
Minimum relative humidityRHn%1 November 1909 (9 February 1982)19 (92)
Publisher’s Note: MDPI stays neutral with regard to jurisdictional claims in published maps and institutional affiliations.

