
Daily Precipitation Data for the Mexico City Metropolitan Area from 1930 to 2015

 ,
, 
Abstract
:1. Summary
2. Data Description
- ID: short name of the site (alphanumeric values);
- Name: long name of the site (alphanumeric values);
- State: state where the site is located (Mexico City, State of Mexico, Hidalgo);
- Location: place of the recording site (alphanumeric values);
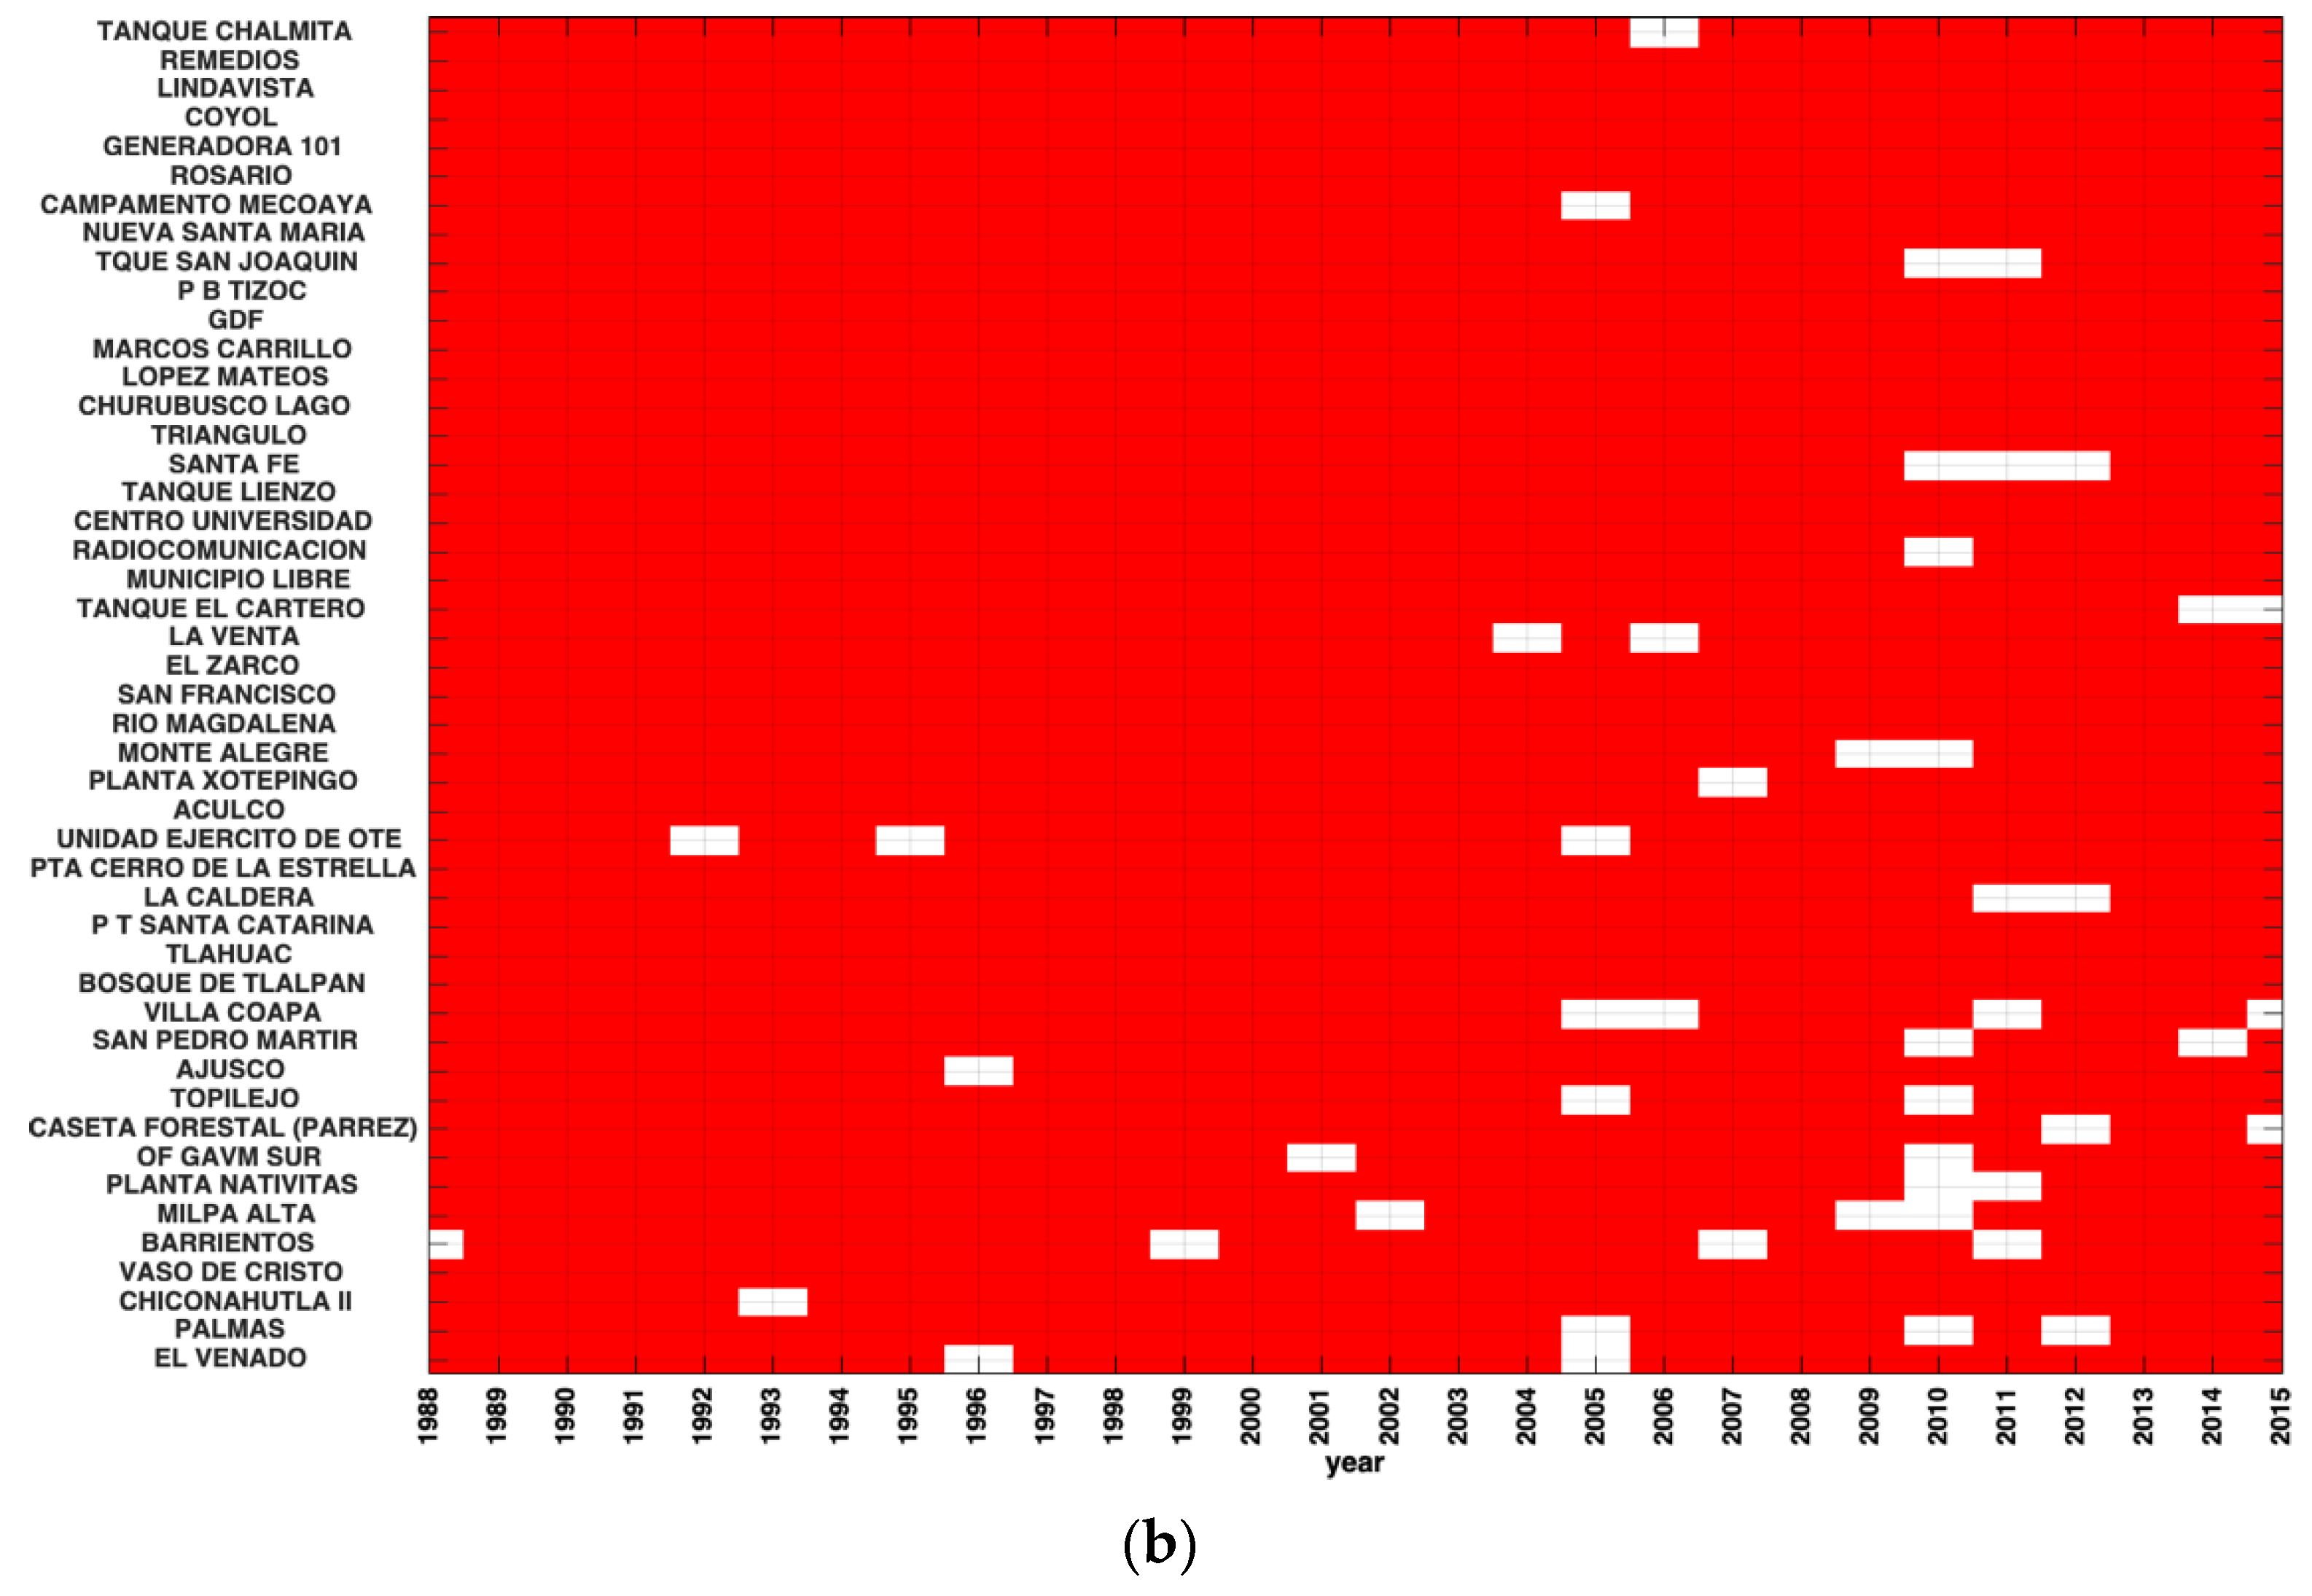
- Recording period: see Figure 2 (alphanumeric values);
- Altitude: vertical distance in meters (alphanumeric values);
- Source: observational network (CLICOM, SACMEX);
- Latitude: y-coordinate (decimal degrees);
- Longitude: x-coordinate (decimal degrees);
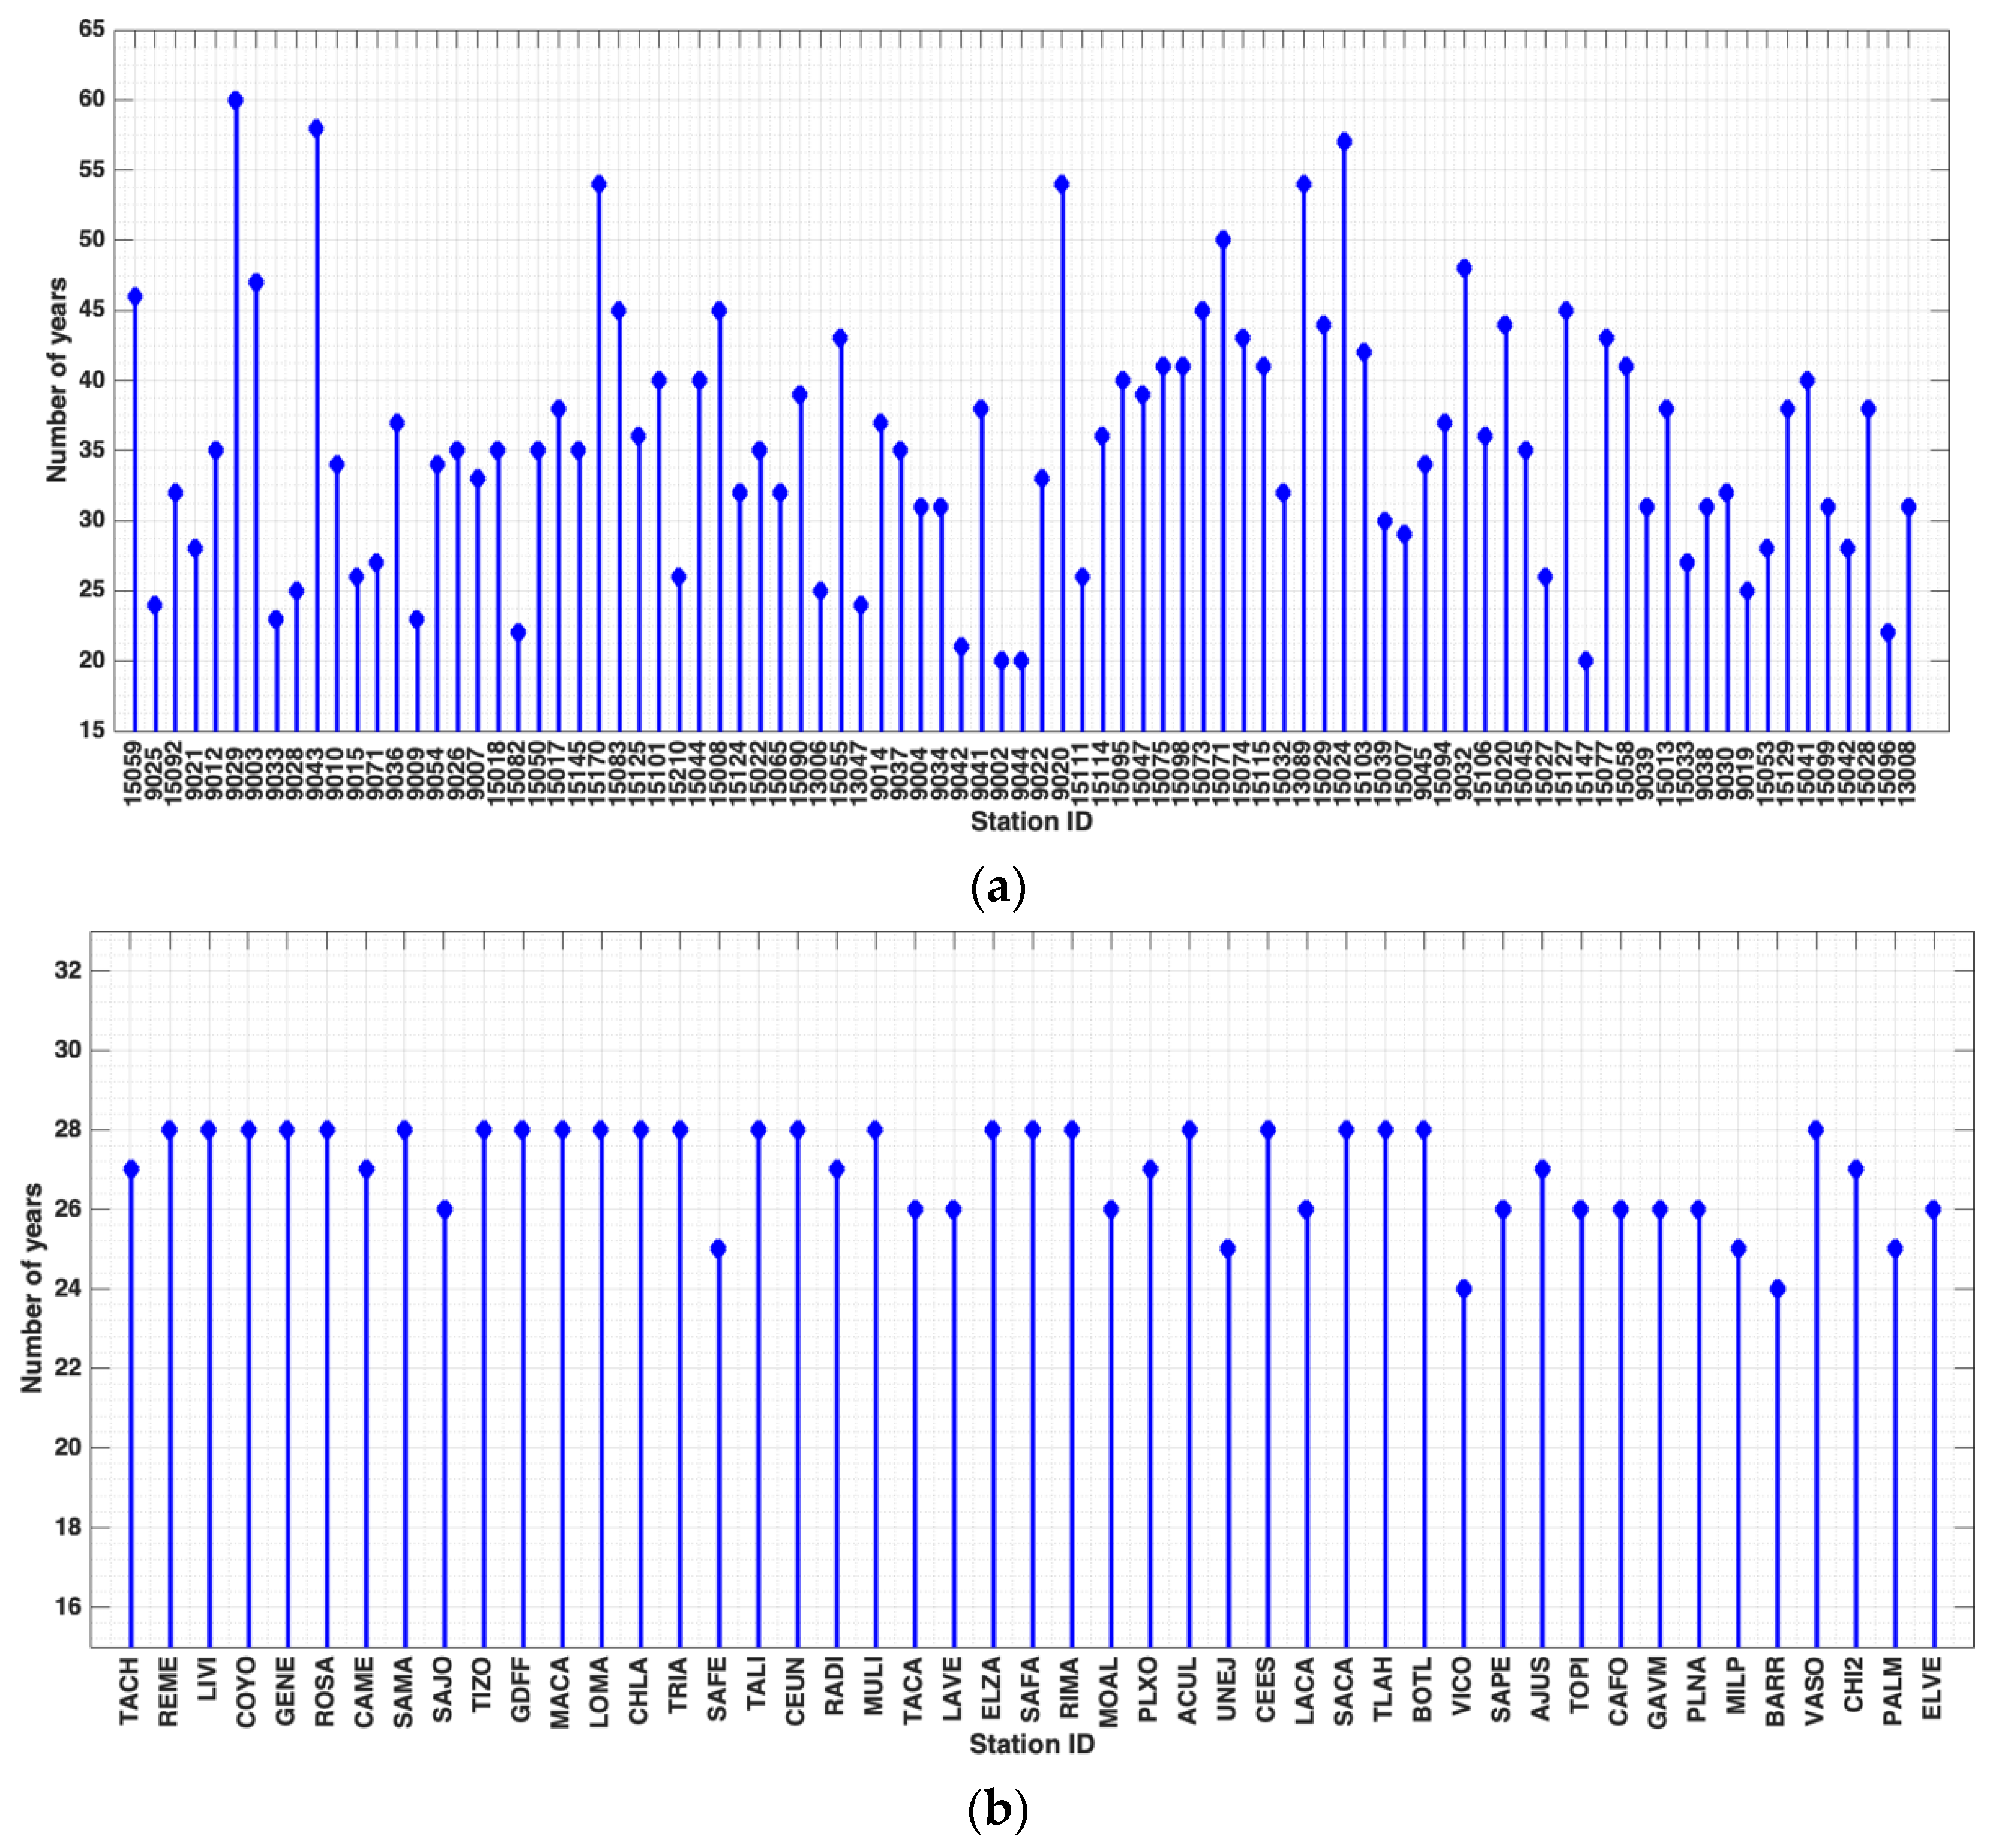
- Data includes observations from 89 CLICOM and 47 SACMEX stations (Figure 1).
- Day: identifies the day (values from 1 to 31);
- Month: identifies the month (values from 6 to 10);
- Year: identifies the year (values from 1930 to 2015);
- Station IDs: divided into two spreadsheets: one for the CLICOM and another for the SACMEX stations (numeric values indicating millimeters per day (mm day−1) or the NaN indicator).
3. Methodology
- An annual time series of daily precipitation was generated for each station. These series were plotted and examined to select only those stations with 100% data during the 5 months of the rainy season (June–October);
- To detect anomalous precipitation behavior, the automatically generated time series from the previous step were manually reviewed. In case of doubt in the behavior of the daily precipitation record, such as a very high value, this was verified by comparing the measurement with other data sources:
- The inventory of flood events that occurred in Mexico City during the 1920–2018 period [11];
- The information reported during the hurricane seasons (https://smn.conagua.gob.mx/es/, accessed on 22 March 2022);
- Data from the precipitation numerical forecast system (http://grupo-ioa.atmosfera.unam.mx/pronosticos/index.php, accessed on 22 March 2022).
- If the suspicious behavior was verified, then the station data was discarded. The discarded stations were those that did not meet the 100% data criterion or because they had less than 20 years of information. For the CLICOM data, 6 stations out of the 95 originally selected were removed, and for the SACMEX data, 31 stations were removed. With the information of the remaining 136 stations that met the criteria previously established, we generated the present database (daily_precipitation_database.xlsx).
4. User Notes
Author Contributions
Funding
Institutional Review Board Statement
Informed Consent Statement
Data Availability Statement
Acknowledgments
Conflicts of Interest
References
- INEGI. Censo de Población y Vivienda 2020. Available online: https://censo2020.mx (accessed on 22 March 2022).
- Citypopulation. Major Agglomerations of the World. 2020. Available online: https://www.citypopulation.de/en/world/agglomerations/ (accessed on 22 March 2022).
- Ruiz-Angulo, A.; López-Espinoza, E.D. Estimación de la respuesta térmica de la cuenca lacustre del Valle de México en el siglo XVI: Un experimento numérico. Bol. Soc. Geol. Mex. 2015, 67, 215–225. [Google Scholar] [CrossRef]
- López-Espinoza, E.D.; Ruiz-Angulo, A.; Zavala-Hidalgo, J.; Romero-Centeno, R.; Escamilla-Salazar, J. Impacts of the Desiccated Lake System on Precipitation in the Basin of Mexico City. Atmosphere 2019, 10, 628. [Google Scholar] [CrossRef] [Green Version]
- Hoegh-Guldberg, O.; Jacob, D.; Taylor, M.; Bindi, M.; Brown, S.; Camilloni, I.; Diedhiou, A.; Djalante, R.; Ebi, K.L.; Engelbrecht, F.; et al. Impacts of 1.5 °C Global Warming on Natural and Human Systems. In Global Warming of 1.5 °C.; An IPCC Special Report on the Impacts of Global Warming of 1.5 °C above Pre-Industrial Levels and Related Global Greenhouse Gas Emission Pathways, in the Context of Strengthening the Global Response to the Threat of Climate Change, Sustainable Development, and Efforts to Eradicate Poverty; Masson-Delmotte, V., Zhai, P., Pörtner, H.-O., Roberts, D., Skea, J., Shukla, P.R., Pirani, A., Moufouma-Okia, W., Péan, C., Pidcock, R., et al., Eds.; Cambridge University Press: Cambridge, UK; New York, NY, USA, 2018. [Google Scholar]
- García, E. Distribución de la Precipitación en la República Mexicana. Investig. Geogr. 1974, 5, 7–20. [Google Scholar]
- Jáuregui, E.; Romales, E. Urban effects on convective precipitation in Mexico City. Atmos Environ. 1996, 30, 3383–3389. [Google Scholar] [CrossRef]
- Álvarez-Olguín, G. Análisis de la Precipitación en el Distrito Federal. Master’s Thesis, Universidad Nacional Autónoma de México, Mexico City, México, 2004. [Google Scholar]
- Magaña, V.; López, L.C.; Vázquez, G. El pronóstico de lluvias intensas para la Ciudad de México. TIP. Rev. Espec. Cienc. Químico-Biológicas 2013, 16, 18–25. [Google Scholar]
- CLICOM. Datos Climáticos Diarios del CLICOM del SMN a Través de su Plataforma Web del CICESE. Available online: http://clicom-mex.cicese.mx (accessed on 22 March 2022).
- Novelo-Casanova, D.A.; Suárez, G.; Cabral-Cano, E.; Fernández-Torres, E.A.; Fuentes-Mariles, O.A.; Havazli, E.; Jaimes, M.; López-Espinoza, E.D.; Pozzo, A.L.M.-D.; Morales-Barrera, W.V.; et al. The Risk Atlas of Mexico City, Mexico: A tool for decision-making and disaster prevention. Nat. Hazards 2021, 111, 411–437. [Google Scholar] [CrossRef]
- Atlas del Comportamiento de la Precipitación para la ZMCM. Available online: http://atlas.atmosfera.unam.mx (accessed on 22 March 2022).
- Amaro-Loza, A.; Pedrozo-Acuña, A.; Sánchez-Huerta, A.; Sánchez-Vargas, C.; Vergara-Alcaraz, E.A. Evaluación de las mediciones de lluvia en la Ciudad de México utilizando la red de disdrómetros y su comparación con respecto a la red de pluviómetros de balancín. Ing. Agua 2022, 26, 91–105. [Google Scholar] [CrossRef]


Publisher’s Note: MDPI stays neutral with regard to jurisdictional claims in published maps and institutional affiliations. |
© 2022 by the authors. Licensee MDPI, Basel, Switzerland. This article is an open access article distributed under the terms and conditions of the Creative Commons Attribution (CC BY) license (https://creativecommons.org/licenses/by/4.0/).
Share and Cite
López-Espinoza, E.D.; Fuentes-Mariles, O.A.; Herrera-Moro, D.R.; Gómez-Ramos, O.; Novelo-Casanova, D.A.; Zavala-Hidalgo, J. Daily Precipitation Data for the Mexico City Metropolitan Area from 1930 to 2015. Data 2022, 7, 88. https://doi.org/10.3390/data7070088
López-Espinoza ED, Fuentes-Mariles OA, Herrera-Moro DR, Gómez-Ramos O, Novelo-Casanova DA, Zavala-Hidalgo J. Daily Precipitation Data for the Mexico City Metropolitan Area from 1930 to 2015. Data. 2022; 7(7):88. https://doi.org/10.3390/data7070088
Chicago/Turabian StyleLópez-Espinoza, Erika D., Oscar A. Fuentes-Mariles, Dulce R. Herrera-Moro, Octavio Gómez-Ramos, David A. Novelo-Casanova, and Jorge Zavala-Hidalgo. 2022. "Daily Precipitation Data for the Mexico City Metropolitan Area from 1930 to 2015" Data 7, no. 7: 88. https://doi.org/10.3390/data7070088