Scheme 1.
Naming, numbering, and structure benzophenones (1–9) and copper-2-hydroxyphenone complexes (10–19).
Scheme 1.
Naming, numbering, and structure benzophenones (1–9) and copper-2-hydroxyphenone complexes (10–19).
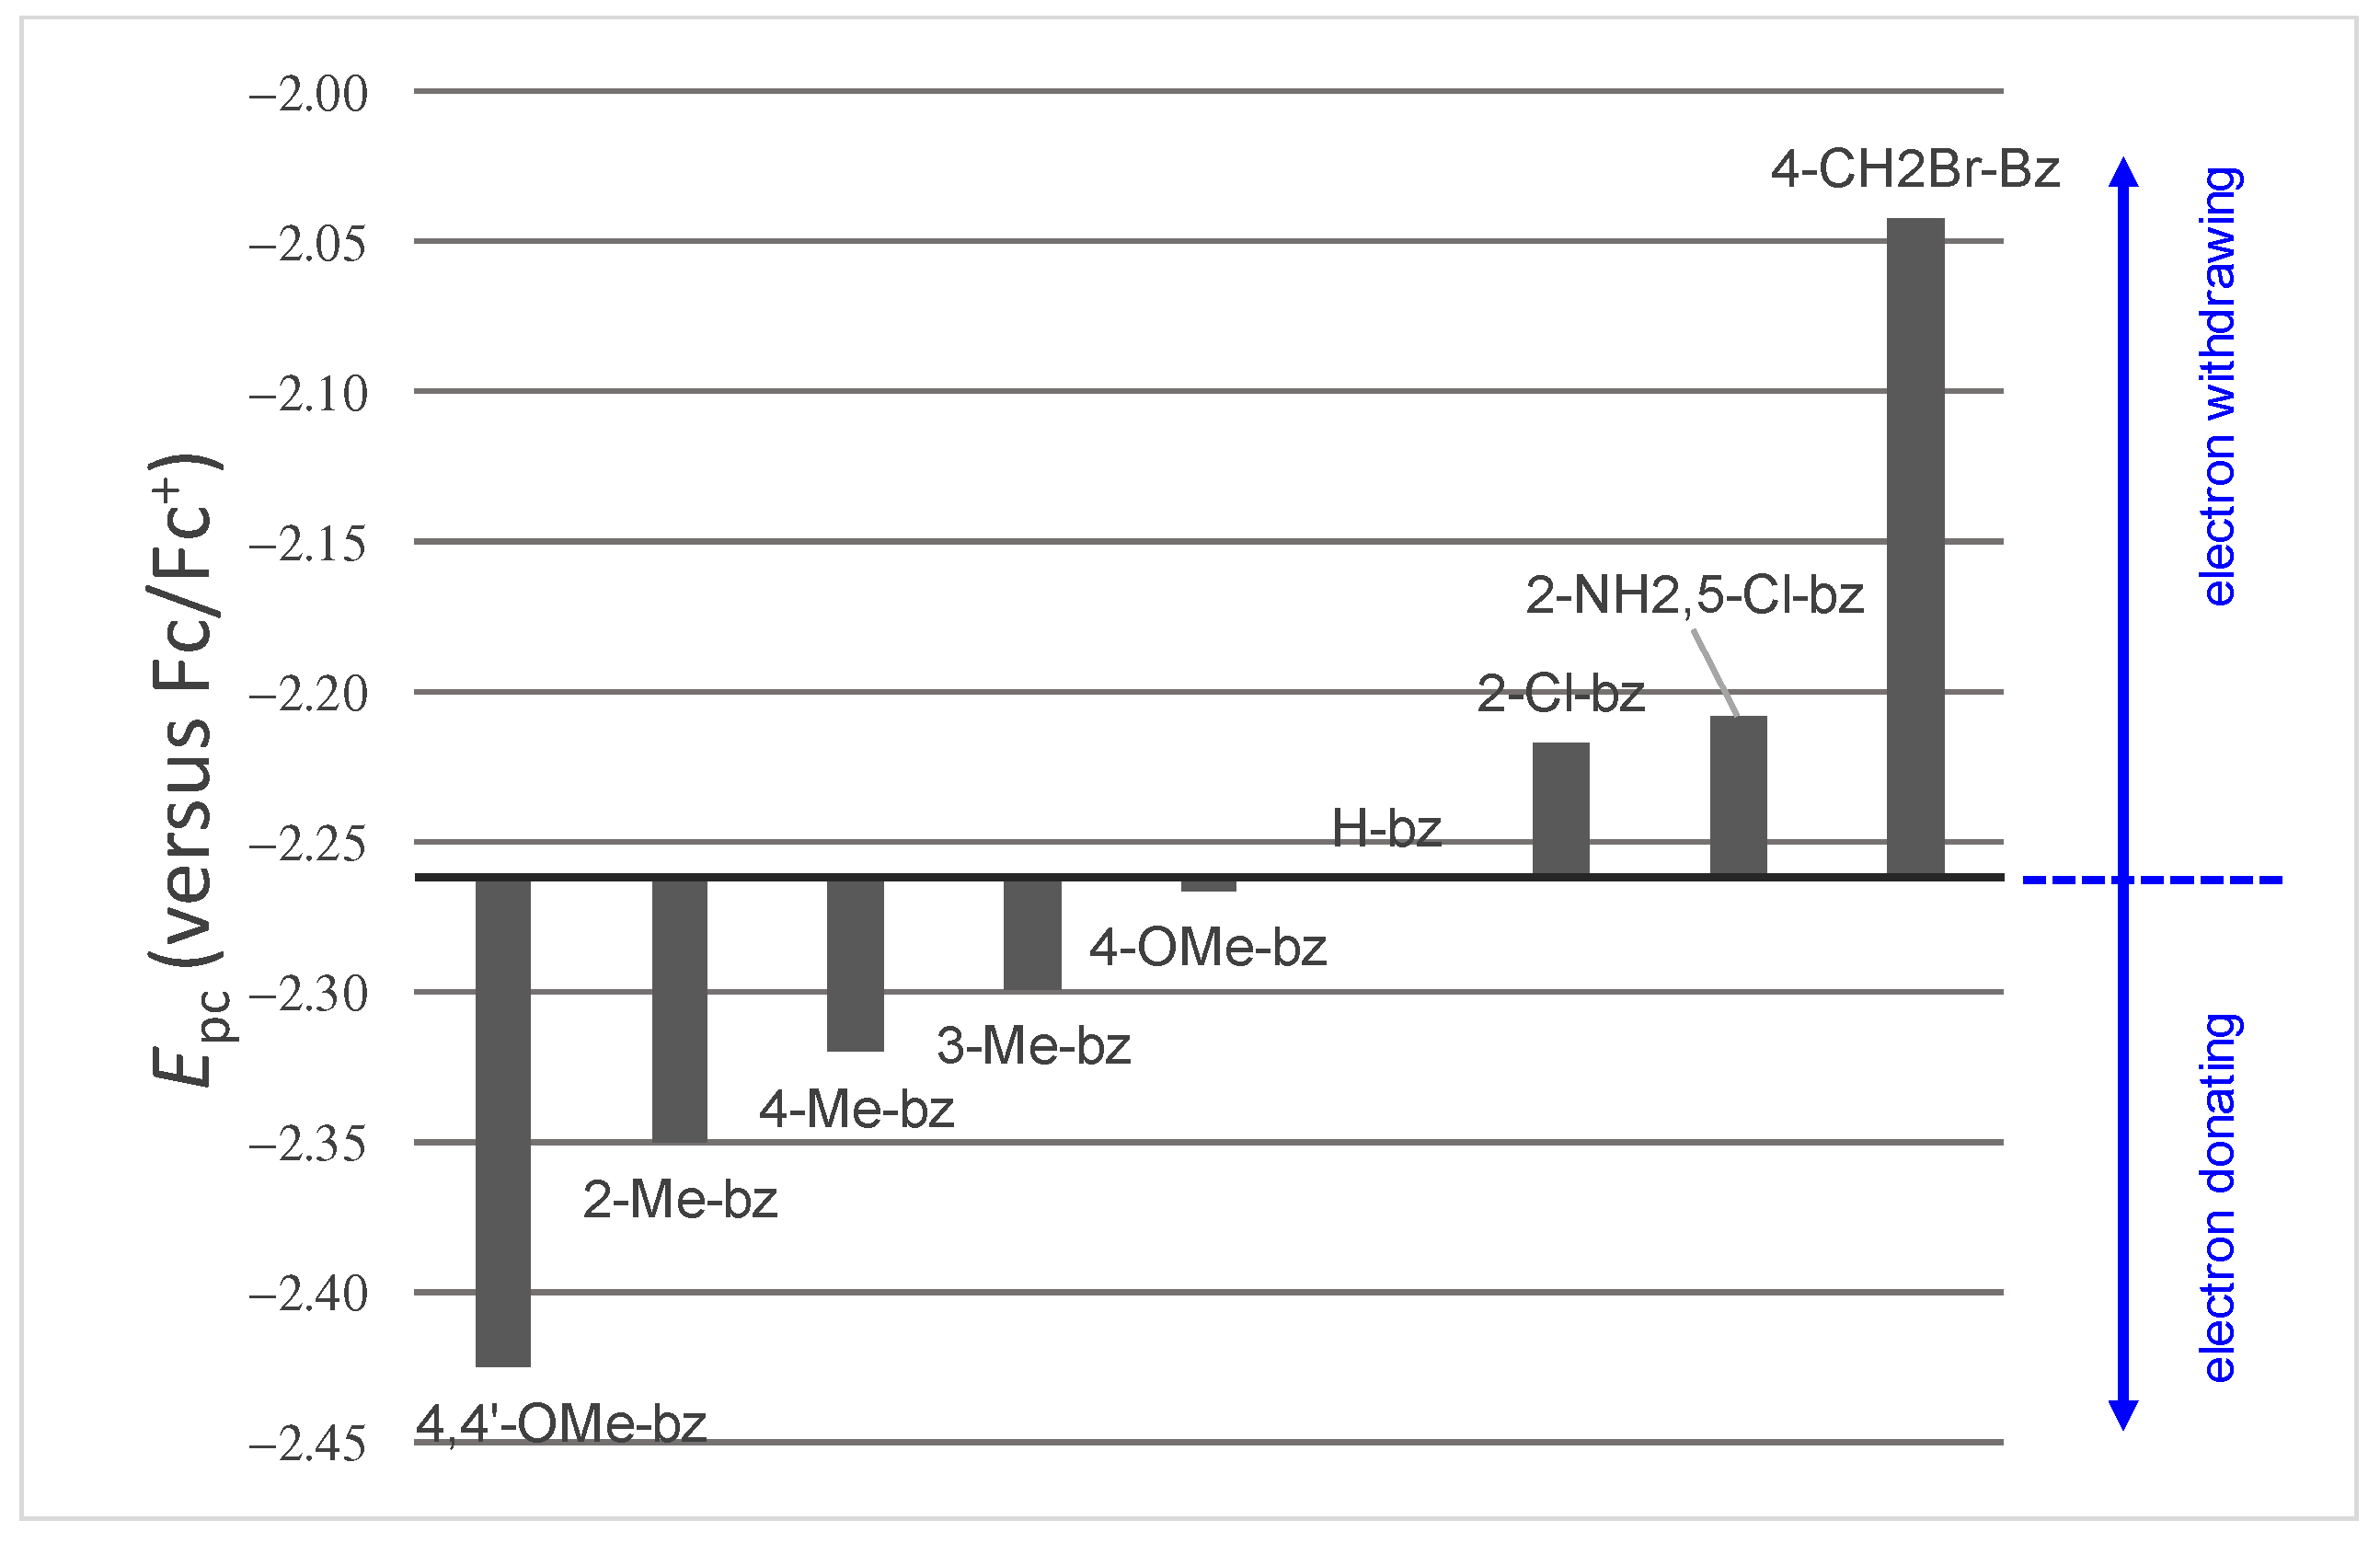
Figure 1.
Reduction potential of benzophenones (
1–
8) containing electron-donating (CH3, OCH3, NH2) and electron withdrawing (Cl, CH2Br) groups, relative to unsubstituted benzophenone (H-bz,
9). Data were obtained at a scan rate of 0.100 V s
−1 in dimethylformamide as solvent from the related research article [
1].
Figure 2.
Reduction potential of copper-2-hydroxyphenone complexes (
10–
19) containing electron-donating (OEt, OCH
3) and electron withdrawing (Cl, Br) groups, relative to the copper-2-hydroxybenzophenone containing unsubstituted 2-hydroxybenzophenone (
14). Data were obtained at a scan rate of 0.100 V s
−1 in dimethyl sulfoxide as solvent from the related research article [
8].
Figure 3.
(Left) Cyclic voltammograms of ca 0.002 mol dm
−3 2-methylbenzophenone, 2-Me-bz (
1) in dimethylformamide as solvent, 0.100 mol dm
−3 TBAPF
6 as supporting electrolyte, reported versus Fc/Fc
+. Scan rates are indicated. (Right) Linear relationship between the peak current (
ip) and the square root of the scan rate (
), as predicted by the Randles–Ševčík equation, for the oxidation (top graph) and reduction peak (bottom graph). (CV at 0.100 Vs
−1 from related research article [
7]).
Figure 4.
(Left) Cyclic voltammograms of ca 0.002 mol dm
−3 3-methylbenzophenone, 3-Me-bz (
2) in dimethylformamide as solvent, 0.100 mol dm
−3 TBAPF
6 as supporting electrolyte, reported versus Fc/Fc
+. Scan rates are indicated. (Right) Linear relationship between the peak current (
ip) and the square root of the scan rate (
), as predicted by the Randles–Ševčík equation, for the oxidation (top graph) and reduction peak (bottom graph). (CV at 0.100 Vs
−1 from related research article [
7]).
Figure 5.
(Left) Cyclic voltammograms of ca 0.002 mol dm
−3 4-methylbenzophenone, 4-Me-bz (
3) in dimethylformamide as solvent, 0.100 mol dm
−3 TBAPF
6 as supporting electrolyte, reported versus Fc/Fc
+. Scan rates are indicated. (Right) Linear relationship between the peak current (
ip) and the square root of the scan rate (
), as predicted by the Randles–Ševčík equation, for the oxidation (top graph) and reduction peak (bottom graph). (CV at 0.100 Vs
−1 from related research article [
7]).
Figure 6.
(Left) Cyclic voltammograms of ca 0.002 mol dm
−3 4-methoxybenzophenone, 4-OMe-bz (
4) in dimethylformamide as solvent, 0.100 mol dm
−3 TBAPF
6 as supporting electrolyte, reported versus Fc/Fc
+. Scan rates are indicated. (Right) Linear relationship between the peak current (
ip) and the square root of the scan rate (
), as predicted by the Randles–Ševčík equation, for the oxidation (top graph) and reduction peak (bottom graph). (CV at 0.100 Vs
−1 from related research article [
7]).
Figure 7.
(Left) Cyclic voltammograms of ca 0.002 mol dm
−3 4,4′-dimethoxybenzophenone, 4,4′-OMe-bz (
5) in dimethylformamide as solvent, 0.100 mol dm
−3 TBAPF
6 as supporting electrolyte, reported versus Fc/Fc
+. Scan rates are indicated. (Right) Linear relationship between the peak current (
ip) and the square root of the scan rate (
), as predicted by the Randles–Ševčík equation, for the oxidation (top graph) and reduction peak (bottom graph). (CV at 0.100 Vs
−1 from related research article [
7]).
Figure 8.
(Left) Cyclic voltammograms of ca 0.002 mol dm
−3 2-amino-5-chlorobenzophenone, 2-NH
2,5-Cl-bz (
6) in dimethylformamide as solvent, 0.100 mol dm
−3 TBAPF
6 as supporting electrolyte, reported versus Fc/Fc
+. Scan rates are indicated. (Right) Linear relationship between the peak current (
ip) and the square root of the scan rate (
), as predicted by the Randles–Ševčík equation, for the oxidation (top graph) and reduction peak (bottom graph). (CV at 0.100 Vs
−1 from related research article [
7]).
Figure 9.
(Left) Cyclic voltammograms of ca 0.002 mol dm
−3 2-chlorobenzophenone, 2-Cl-bz (
7) in dimethylformamide as solvent, 0.100 mol dm
−3 TBAPF
6 as supporting electrolyte, reported versus Fc/Fc
+. Scan rates are indicated. (Right) Linear relationship between the peak current (
ip) and the square root of the scan rate (
), for the second reduction peak, as predicted by the Randles–Ševčík equation for and reduction peak. (CV at 0.100 Vs
−1 from related research article [
7]).
Figure 10.
(Left) Cyclic voltammograms of ca 0.002 mol dm
−3 4-(Bromomethyl)benzophenone 4-CH
2Br-bz (
8) in dimethylformamide as solvent, 0.100 mol dm
−3 TBAPF
6 as supporting electrolyte reported versus Fc/Fc
+. Scan rates are indicated. (Right) Linear relationship between the peak current (
ip) and the square root of the scan rate (
), for the second reduction peak, as predicted by the Randles–Ševčík equation for and reduction peak. (CV at 0.100 Vs
−1 from related research article [
7]).
Figure 11.
(Left) Cyclic voltammograms of ca 0.002 mol dm
−3 benzophenone bz (
10) in dimethylformamide as solvent, 0.100 mol dm
−3 TBAPF
6 as supporting electrolyte, reported versus Fc/Fc
+. Scan rates are indicated. (CV at 0.01 Vs
−1 from related research article [
7]). (Right) Linear relationship between the peak current (
ip) and the square root of the scan rate (
), for the second reduction peak, as predicted by the Randles–Ševčík equation for and reduction peak. (CV at 0.100 Vs
−1 from related research article [
7]). Linear relationship between the peak current (
ip) and the square root of the scan rate (
), for the first reduction peak, is available in the related research article [
7].
Figure 12.
(Left) Cyclic voltammograms of ca 0.002 mol dm
−3 Cu(3,5-Cl-HBP)
2 (
10) in dimethyl sulfoxide as solvent, 0.100 mol dm
−3 TBAPF
6 as supporting electrolyte, reported versus Fc/Fc
+. Scan rates are indicated. (Right) Linear relationship between the peak reduction current (−
ipc) and the square root of the scan rate (
), as predicted by the Randles–Ševčík equation, for the reduction peak. CVs at scan rates 0.02–0.70 V/s from the related research article [
8]. The peak oxidation current,
ipa, did not follow the Randles–Ševčík equation.
Figure 13.
(Left) Cyclic voltammograms of ca 0.002 mol dm−3 Cu(5-Br-HBP)2 (11) in dimethyl sulfoxide as solvent, 0.100 mol dm−3 TBAPF6 as supporting electrolyte, reported versus Fc/Fc+. Scan rates are indicated. (Right) Linear relationship between the peak reduction current (−ipc) and the square root of the scan rate (), as predicted by the Randles–Ševčík equation, for the reduction peak. The peak oxidation current, ipa, did not follow the Randles–Ševčík equation.
Figure 14.
(Left) Cyclic voltammograms of ca 0.002 mol dm−3 Cu(4′,5-Cl-HBP)2 (12) in dimethyl sulfoxide as solvent, 0.100 mol dm−3 TBAPF6 as supporting electrolyte, reported versus Fc/Fc+. Scan rates are indicated. (Right) Linear relationship between the peak reduction current (−ipc) and the square root of the scan rate () (Randles–Ševčík equation), for the reduction peak.
Figure 15.
(Left) Cyclic voltammograms of ca 0.002 mol dm−3 Cu(5-Cl-HBP)2 (13) in dimethyl sulfoxide as solvent, 0.100 mol dm−3 TBAPF6 as supporting electrolyte, reported versus Fc/Fc+. Scan rates are indicated. (Right) Linear relationship between the peak reduction current (−ipc) and the square root of the scan rate (), as predicted by the Randles–Ševčík equation, for the reduction peak.
Figure 16.
(Left) Cyclic voltammograms of ca 0.002 mol dm−3 Cu(HBP)2 (14) in dimethyl sulfoxide as solvent, 0.100 mol dm−3 TBAPF6 as supporting electrolyte, reported versus Fc/Fc+. Scan rates are indicated. (Right) Linear relationship between the peak reduction current (−ipc) and the square root of the scan rate (), as predicted by the Randles–Ševčík equation, for the reduction peak.
Figure 17.
(Left) Cyclic voltammograms of ca 0.002 mol dm
−3 Cu(4-allyloxy-HBP)
2 (
15) in dimethyl sulfoxide as solvent, 0.100 mol dm
−3 TBAPF
6 as supporting electrolyte, reported versus Fc/Fc
+. Scan rates are indicated. (Right) Linear relationship between the peak reduction current (−
ipc) and the square root of the scan rate (
), as predicted by the Randles–Ševčík equation, for the reduction peak. CVs at scan rates 0.02–0.70 V/s from the related research article [
8].
Figure 18.
(Left) Cyclic voltammograms of ca 0.002 mol dm−3 Cu(4-OMe-HBP)2 (16) in dimethyl sulfoxide as solvent, 0.100 mol dm−3 TBAPF6 as supporting electrolyte, reported versus Fc/Fc+. Scan rates are indicated. (Right) Linear relationship between the peak reduction current (−ipc) and the square root of the scan rate (), as predicted by the Randles–Ševčík equation for the reduction peak.
Figure 19.
(Left) Cyclic voltammograms of ca 0.002 mol dm−3 Cu(HAP)2 (17) in dimethyl sulfoxide as solvent, 0.100 mol dm−3 TBAPF6 as supporting electrolyte, reported versus Fc/Fc+. Scan rates are indicated. (Right) Linear relationship between the peak reduction current (−ipc) and the square root of the scan rate (), as predicted by the Randles–Ševčík equation for the reduction peak.
Figure 20.
(Left) Cyclic voltammograms of ca 0.002 mol dm−3 Cu (HPP)2 (18) in dimethyl sulfoxide as solvent, 0.100 mol dm−3 TBAPF6 as supporting electrolyte, reported versus Fc/Fc+. Scan rates are indicated. (Right) Linear relationship between the peak reduction current (−ipc) and the square root of the scan rate (), as predicted by the Randles–Ševčík equation for the reduction peak.
Figure 21.
(Left) Cyclic voltammograms of ca 0.002 mol dm−3 Cu(4-Oct-HBP)2 (19) in dichloromethane as solvent, 0.100 mol dm−3 TBAPF6 as supporting electrolyte, reported versus Fc/Fc+. Scan rates are indicated. (Right) Linear relationship between the peak reduction current (−ipc) and the square root of the scan rate (), as predicted by the Randles–Ševčík equation for the reduction peak.
Figure 22.
Illustration of how to obtain ip and Ep data from a CV using CV of the reduction of ca 0.002 mol dm−3 2-amino-5-chlorobenzophenone, 2-NH2,5-Cl-bz (6) in dimethylformamide as solvent, 0.100 mol dm−3 TBAPF6 as supporting electrolyte, scan rate ν = 0.050 Vs−1. Epa = peak anodic potential, Epc = peak cathodic potential, ipa = anodic peak current, ipc = cathodic peak current. Peak potential separation ΔEp = Epa − Epc and half-wave potential E1/2 = (Epa − Epc)/2.
Table 1.
Electrochemical data obtained from the cyclic voltammograms of ca 0.002 mol dm
−3 2-methylbenzophenone, 2-Me-bz (
1) in dimethylformamide as solvent, 0.100 mol dm
−3 TBAPF
6 as supporting electrolyte, reported versus Fc/Fc
+, at indicated scan rates ν (Vs
−1). (Potential data of 0.100 Vs
−1 from related research article [
7]).
| ν (Vs−1) | Epc (V) | Epa (V) | E1/2 (V) | ∆E (V) | 106 ipc (A) | ipa/ipc |
|---|
| 0.05 | −2.342 | −2.269 | −2.306 | 0.073 | 32 | 0.875 |
| 0.10 | −2.350 | −2.260 | −2.305 | 0.090 | 44 | 0.841 |
| 0.15 | −2.350 | −2.260 | −2.305 | 0.090 | 52 | 0.885 |
| 0.20 | −2.350 | −2.260 | −2.305 | 0.090 | 60 | 0.900 |
| 0.25 | −2.353 | −2.258 | −2.306 | 0.095 | 66 | 0.894 |
| 0.30 | −2.356 | −2.252 | −2.304 | 0.104 | 72 | 0.903 |
| 0.50 | −2.362 | −2.244 | −2.303 | 0.118 | 95 | 0.895 |
| 1.00 | −2.366 | −2.241 | −2.304 | 0.125 | 120 | 0.933 |
| 5.12 | −2.414 | −2.195 | −2.305 | 0.219 | 238 | 0.916 |
Table 2.
Electrochemical data obtained from the cyclic voltammograms of ca 0.002 mol dm
−3 3-methylbenzophenone, 3-Me-bz (
2) in dimethylformamide as solvent, 0.100 mol dm
−3 TBAPF
6 as supporting electrolyte, reported versus Fc/Fc
+, at indicated scan rates ν (Vs
−1). (Potential data of 0.100 Vs
−1 from related research article [
7]).
| ν (Vs−1) | Epc (V) | Epa (V) | E1/2 (V) | ∆E (V) | 106 ipc (A) | ipa/ipc |
|---|
| 0.05 | −2.291 | −2.207 | −2.249 | 0.084 | 40 | 0.850 |
| 0.10 | −2.299 | −2.200 | −2.250 | 0.099 | 56 | 0.857 |
| 0.15 | −2.300 | −2.200 | −2.250 | 0.100 | 66 | 0.848 |
| 0.20 | −2.300 | −2.200 | −2.250 | 0.100 | 75 | 0.813 |
| 0.25 | −2.305 | −2.193 | −2.249 | 0.112 | 85 | 0.776 |
| 0.30 | −2.307 | −2.193 | −2.250 | 0.114 | 92 | 0.815 |
| 0.50 | −2.317 | −2.178 | −2.248 | 0.139 | 115 | 0.870 |
| 1.00 | −2.330 | −2.170 | −2.250 | 0.160 | 152 | 0.855 |
| 5.12 | −2.381 | −2.118 | −2.250 | 0.263 | 298 | 0.879 |
Table 3.
Electrochemical data obtained from the cyclic voltammograms of ca 0.002 mol dm
−3 4-methylbenzophenone, 4-Me-bz (
3) in dimethylformamide as solvent, 0.100 mol dm
−3 TBAPF
6 as supporting electrolyte, reported versus Fc/Fc
+, at indicated scan rates ν (Vs
−1). (Potential data of 0.100 Vs
−1 from related research article [
7]).
| ν (Vs−1) | Epc (V) | Epa (V) | E1/2 (V) | ∆E (V) | 106 ipc (A) | ipa/ipc |
|---|
| 0.05 | −2.309 | −2.233 | −2.271 | 0.076 | 28 | 0.750 |
| 0.10 | −2.320 | −2.229 | −2.275 | 0.091 | 39 | 0.769 |
| 0.15 | −2.320 | −2.226 | −2.273 | 0.094 | 44 | 0.795 |
| 0.20 | −2.320 | −2.226 | −2.273 | 0.094 | 50 | 0.800 |
| 0.25 | −2.323 | −2.223 | −2.273 | 0.100 | 54 | 0.833 |
| 0.30 | −2.324 | −2.221 | −2.273 | 0.103 | 59 | 0.831 |
| 0.50 | −2.327 | −2.219 | −2.273 | 0.108 | 67 | 0.866 |
| 1.00 | −2.335 | −2.215 | −2.275 | 0.120 | 90 | 0.867 |
| 5.12 | −2.379 | −2.164 | −2.272 | 0.215 | 200 | 0.860 |
Table 4.
Electrochemical data obtained from the cyclic voltammograms of ca 0.002 mol dm
−3 4-methoxybenzophenone, 4-Ome-bz (
4) in dimethylformamide as solvent, 0.100 mol dm
−3 TBAPF
6 as supporting electrolyte, reported versus Fc/Fc
+, at indicated scan rates ν (Vs
−1). (Potential data of 0.100 Vs
−1 from related research article [
7]).
| ν (Vs−1) | Epc (V) | Epa (V) | E1/2 (V) | ∆E (V) | 106 ipc (A) | ipa/ipc |
|---|
| 0.05 | −2.269 | −2.209 | −2.239 | 0.060 | 24 | 0.875 |
| 0.10 | −2.266 | −2.206 | −2.236 | 0.060 | 33 | 0.848 |
| 0.15 | −2.266 | −2.206 | −2.236 | 0.060 | 40 | 0.850 |
| 0.20 | −2.272 | −2.196 | −2.234 | 0.076 | 47 | 0.851 |
| 0.25 | −2.272 | −2.196 | −2.234 | 0.076 | 49 | 0.878 |
| 0.30 | −2.270 | −2.194 | −2.232 | 0.076 | 56 | 0.857 |
| 0.50 | −2.287 | −2.189 | −2.238 | 0.098 | 69 | 0.855 |
| 1.00 | −2.284 | −2.182 | −2.233 | 0.102 | 90 | 0.889 |
| 5.12 | −2.320 | −2.146 | −2.233 | 0.174 | 166 | 0.916 |
Table 5.
Electrochemical data obtained from the cyclic voltammograms of ca 0.002 mol dm
−3 4,4′-dimethoxybenzophenone, 4,4′-Ome-bz (
5) in dimethylformamide as solvent, 0.100 mol dm
−3 TBAPF
6 as supporting electrolyte, reported versus Fc/Fc
+, at indicated scan rates ν (Vs
−1). (Potential data of 0.100 Vs
−1 from related research article [
7]).
| ν (Vs−1) | Epc (V) | Epa (V) | E1/2 (V) | ∆E (V) | 106 ipc (A) | ipa/ipc |
|---|
| 0.05 | −2.425 | −2.356 | −2.391 | 0.069 | 21 | 0.762 |
| 0.10 | −2.425 | −2.356 | −2.391 | 0.069 | 26 | 0.769 |
| 0.15 | −2.425 | −2.356 | −2.391 | 0.069 | 32 | 0.813 |
| 0.20 | −2.433 | −2.356 | −2.395 | 0.077 | 38 | 0.737 |
| 0.25 | −2.438 | −2.354 | −2.396 | 0.084 | 43 | 0.744 |
| 0.30 | −2.440 | −2.352 | −2.396 | 0.088 | 46 | 0.783 |
| 0.50 | −2.440 | −2.336 | −2.388 | 0.104 | 56 | 0.750 |
| 1.00 | −2.447 | −2.339 | −2.393 | 0.108 | 80 | 0.775 |
| 5.00 | −2.475 | −2.301 | −2.388 | 0.174 | 138 | 0.768 |
Table 6.
Electrochemical data obtained from the cyclic voltammograms of ca 0.002 mol dm
−3 2-amino-5-chlorobenzophenone, 2-NH
2,5-Cl-bz (
6) in dimethylformamide as solvent, 0.100 mol dm
−3 TBAPF
6 as supporting electrolyte, reported versus Fc/Fc
+, at indicated scan rates ν (Vs
−1). (Potential data of 0.100 Vs
−1 from related research article [
7]).
| ν (Vs−1) | Epc (V) | Epa (V) | E1/2 (V) | ∆E (V) | 106 ipc (A) | ipa/ipc |
|---|
| 0.05 | −2.204 | −2.140 | −2.172 | 0.064 | 21 | 0.76 |
| 0.10 | −2.213 | −2.135 | −2.174 | 0.078 | 28 | 0.79 |
| 0.15 | −2.207 | −2.138 | −2.173 | 0.069 | 33 | 0.91 |
| 0.20 | −2.211 | −2.131 | −2.171 | 0.080 | 38 | 0.89 |
| 0.25 | −2.216 | −2.126 | −2.171 | 0.090 | 44 | 0.86 |
| 0.30 | −2.214 | −2.134 | −2.174 | 0.080 | 45 | 0.89 |
| 0.50 | −2.228 | −2.118 | −2.173 | 0.110 | 58 | 0.91 |
| 1.00 | −2.236 | −2.106 | −2.171 | 0.130 | 86 | 0.91 |
| 5.12 | −2.278 | −2.064 | −2.171 | 0.214 | 164 | 0.91 |
Table 7.
Electrochemical data obtained from the cyclic voltammograms of ca 0.002 mol dm
−3 2-chlorobenzophenone, 2-Cl-bz (
7) in dimethylformamide as solvent, 0.100 mol dm
−3 TBAPF
6 as supporting electrolyte, reported versus Fc/Fc
+, at indicated scan rates ν (Vs
−1). (Potential data of 0.100 Vs
−1 from related research article [
7]).
| ν (Vs−1) | Epc (V) | Epa (V) | E1/2 (V) | ∆E (V) | 106 ipc (A) | ipa/ipc |
|---|
| 0.05 | −2.200 | - | - | - | 29 | - |
| 0.10 | −2.217 | - | - | - | 39 | - |
| 0.15 | −2.223 | −2.166 | −2.195 | 0.057 | 45 | 0.244 |
| 0.20 | −2.224 | −2.166 | −2.195 | 0.058 | 52 | 0.240 |
| 0.25 | −2.225 | −2.166 | −2.196 | 0.059 | 58 | 0.241 |
| 0.30 | −2.231 | −2.165 | −2.198 | 0.066 | 63 | 0.254 |
| 0.50 | −2.254 | −2.164 | −2.209 | 0.090 | 78 | 0.256 |
| 1.00 | −2.257 | −2.163 | −2.210 | 0.094 | 105 | 0.267 |
| 5.12 | −2.332 | −2.158 | −2.245 | 0.174 | 180 | 0.361 |
Table 8.
Electrochemical data obtained from the cyclic voltammograms of ca 0.002 mol dm
−3 4-(Bromomethyl)benzophenone 4-CH
2Br-bz (
8) in dimethylformamide as solvent, 0.100 mol dm
−3 TBAPF
6 as supporting electrolyte, reported versus Fc/Fc
+, at indicated scan rates ν (Vs
−1). (Potential data of 0.100 Vs
−1 from related research article [
7]).
| ν (Vs−1) | Epc (V) | 106 ipc (A) |
|---|
| 0.05 | −2.023 | 29 |
| 0.10 | −2.042 | 40 |
| 0.15 | −2.043 | 47 |
| 0.20 | −2.049 | 54 |
| 0.25 | −2.053 | 59 |
| 0.30 | −2.057 | 64 |
| 0.50 | −2.062 | 81 |
| 1.00 | −2.093 | 111 |
| 5.12 | −2.154 | 222 |
Table 9.
Electrochemical data obtained from the cyclic voltammograms of ca 0.002 mol dm
−3 benzophenone bz (
10) in dimethylformamide as solvent, 0.100 mol dm
−3 TBAPF
6 as supporting electrolyte, reported versus Fc/Fc
+, at indicated scan rates ν (Vs
−1). (Potential data of 0.100 Vs
−1 from related research article [
7]).
| Peak | 1st | 2nd |
|---|
| ν (Vs−1) | Epc (V) | Epa (V) | E1/2 (V) | ∆E (V) | 106 ipc (A) | ipa/ipc | Epc (V) | 106 ipc (A) |
|---|
| 0.05 | −2.256 | −2.192 | −2.224 | 0.064 | 27 | 0.89 | −2.725 | 18 |
| 0.10 | −2.262 | −2.185 | −2.224 | 0.077 | 39 | 0.81 | −2.748 | 24 |
| 0.15 | −2.262 | −2.184 | −2.223 | 0.078 | 45 | 0.90 | −2.75 | 30 |
| 0.20 | −2.263 | −2.184 | −2.224 | 0.079 | 53 | 0.90 | −2.767 | 33 |
| 0.25 | −2.265 | −2.180 | −2.223 | 0.085 | 56 | 0.93 | −2.777 | 38 |
| 0.30 | −2.266 | −2.175 | −2.221 | 0.091 | 61 | 0.95 | −2.780 | 41 |
| 0.50 | −2.276 | −2.169 | −2.223 | 0.107 | 80 | 0.93 | −2.818 | 52 |
| 1.00 | −2.287 | −2.159 | −2.223 | 0.128 | 108 | 0.95 | −2.838 | 72 |
| 5.12 | −2.345 | −2.105 | −2.225 | 0.240 | 218 | 0.96 | −2.932 | 150 |
Table 10.
Electrochemical data obtained from the cyclic voltammograms of ca 0.002 mol dm−3 Cu(3,5-Cl-HBP)2 (10) in dimethyl sulfoxide as solvent, 0.100 mol dm−3 TBAPF6 as supporting electrolyte, reported versus Fc/Fc+, at indicated scan rates ν (Vs−1).
Table 10.
Electrochemical data obtained from the cyclic voltammograms of ca 0.002 mol dm−3 Cu(3,5-Cl-HBP)2 (10) in dimethyl sulfoxide as solvent, 0.100 mol dm−3 TBAPF6 as supporting electrolyte, reported versus Fc/Fc+, at indicated scan rates ν (Vs−1).
| ν (Vs−1) | Epc (V) | Epa (V) | E1/2 (V) | ∆E (V) | 106 ipc (A) | ipa/ipc |
|---|
| 0.020 | −0.695 | −0.605 | −0.650 | 0.090 | 2 | 0.500 |
| 0.050 | −0.681 | −0.600 | −0.641 | 0.081 | 3 | 0.500 |
| 0.100 | −0.684 | −0.605 | −0.645 | 0.079 | 4 | 0.500 |
| 0.200 | −0.695 | −0.592 | −0.644 | 0.103 | 6 | 0.333 |
| 0.300 | −0.700 | −0.587 | −0.644 | 0.113 | 8 | 0.333 |
| 0.500 | −0.708 | −0.571 | −0.640 | 0.137 | 10 | 0.211 |
| 0.700 | −0.714 | −0.574 | −0.644 | 0.140 | 12 | 0.125 |
| 1.000 | −0.756 | −0.548 | −0.652 | 0.208 | 15 | 0.533 |
| 2.007 | −0.778 | −0.547 | −0.663 | 0.231 | 22 | 0.318 |
| 5.120 | −0.790 | −0.578 | −0.106 | 1.368 | 36 | 0.083 |
| 10.240 | −0.859 | −0.514 | −0.687 | 0.345 | 52 | - |
Table 11.
Electrochemical data obtained from the cyclic voltammograms of ca 0.002 mol dm−3 Cu(5-Br-HBP)2 (11) in dimethyl sulfoxide as solvent, 0.100 mol dm−3 TBAPF6 as supporting electrolyte, reported versus Fc/Fc+, at indicated scan rates ν (Vs−1). (Potential data of 0.100 Vs−1 from related research article).
| ν (Vs−1) | Epc (V) | Epa (V) | E1/2 (V) | ∆E (V) | 106 ipc (A) | ipa/ipc |
|---|
| 0.020 | –0.787 | –0.728 | –0.758 | 0.059 | 2 | 0.667 |
| 0.050 | –0.796 | –0.728 | –0.762 | 0.068 | 3 | 0.800 |
| 0.100 | –0.800 | −0.728 | –0.764 | 0.072 | 3 | 0.667 |
| 0.200 | –0.802 | –0.720 | –0.761 | 0.082 | 5 | 0.600 |
| 0.300 | –0.811 | –0.715 | –0.763 | 0.096 | 6 | 0.667 |
| 0.500 | –0.818 | –0.711 | –0.765 | 0.107 | 8 | 0.625 |
| 0.700 | –0.818 | –0.706 | –0.762 | 0.112 | 9 | 0.556 |
| 1.000 | –0.830 | –0.698 | –0.764 | 0.132 | 12 | 0.500 |
| 2.007 | –0.851 | –0.676 | –0.764 | 0.175 | 18 | – |
| 5.120 | –0.886 | –0.643 | –0.765 | 0.243 | 30 | – |
| 10.240 | –0.916 | –0.626 | –0.771 | 0.290 | 42 | – |
Table 12.
E Electrochemical data obtained from the cyclic voltammograms of ca 0.002 mol dm−3 Cu(4′,5–Cl–HBP)2 (12) in dimethyl sulfoxide as solvent, 0.100 mol dm−3 TBAPF6 as supporting electrolyte, reported versus Fc/Fc+, at indicated scan rates ν (Vs−1).
Table 12.
E Electrochemical data obtained from the cyclic voltammograms of ca 0.002 mol dm−3 Cu(4′,5–Cl–HBP)2 (12) in dimethyl sulfoxide as solvent, 0.100 mol dm−3 TBAPF6 as supporting electrolyte, reported versus Fc/Fc+, at indicated scan rates ν (Vs−1).
| ν (Vs−1) | Epc (V) | Epa (V) | E1/2 (V) | ∆E (V) | 106 ipc (A) | ipa/ipc |
|---|
| 0.020 | –0.778 | –0.685 | –0.732 | 0.093 | 3 | 0.667 |
| 0.050 | –0.791 | –0.680 | –0.736 | 0.111 | 5 | 0.600 |
| 0.100 | –0.803 | –0.667 | –0.735 | 0.136 | 8 | 0.625 |
| 0.200 | –0.809 | –0.662 | –0.736 | 0.147 | 10 | 0.300 |
| 0.300 | –0.827 | –0.658 | –0.743 | 0.169 | 12 | 0.250 |
| 0.500 | –0.849 | –0.671 | –0.760 | 0.178 | 15 | 0.133 |
| 0.700 | –0.853 | –0.645 | –0.749 | 0.208 | 18 | 0.111 |
| 1.000 | –0.883 | –0.631 | –0.757 | 0.252 | 22 | 0.045 |
| 2.007 | –0.906 | –0.618 | –0.762 | 0.288 | 30 | – |
| 5.120 | –0.913 | –0.620 | –0.767 | 0.293 | 46 | – |
| 10.240 | –0.940 | –0.600 | –0.770 | 0.340 | 64 | – |
Table 13.
Electrochemical data obtained from the cyclic voltammograms of ca 0.002 mol dm−3 Cu(5-Cl-HBP)2 (13) in dimethyl sulfoxide as solvent, 0.100 mol dm−3 TBAPF6 as supporting electrolyte, reported versus Fc/Fc+, at indicated scan rates ν (Vs−1). (Potential data of 0.100 Vs−1 from related research article).
| ν (Vs−1) | Epc (V) | Epa (V) | E1/2 (V) | ∆E (V) | 106ipc (A) | ipa/ipc |
|---|
| 0.020 | –0.821 | –0.73 | –0.776 | 0.091 | 5 | 0.800 |
| 0.050 | –0.827 | –0.72 | –0.774 | 0.107 | 8 | 0.625 |
| 0.100 | –0.827 | –0.715 | –0.771 | 0.112 | 12 | 0.500 |
| 0.200 | –0.831 | –0.714 | –0.773 | 0.117 | 15 | 0.533 |
| 0.300 | –0.841 | –0.714 | –0.778 | 0.127 | 18 | 0.444 |
| 0.500 | –0.846 | –0.714 | –0.780 | 0.132 | 24 | 0.333 |
| 0.700 | –0.861 | –0.714 | –0.788 | 0.147 | 29 | 0.276 |
| 1.000 | –0.877 | –0.711 | –0.794 | 0.166 | 36 | 0.222 |
| 2.007 | –0.909 | –0.693 | –0.801 | 0.216 | 50 | – |
| 5.120 | −0.941 | −0.658 | −0.800 | 0.283 | 78 | – |
| 10.240 | –0.950 | –0.635 | –0.793 | 0.315 | 106 | – |
Table 14.
Electrochemical data obtained from the cyclic voltammograms of ca 0.002 mol dm−3 Cu(HBP)2 (14) in dimethyl sulfoxide as solvent, 0.100 mol dm−3 TBAPF6 as supporting electrolyte, reported versus Fc/Fc+, at indicated scan rates ν (Vs−1). (Potential data of 0.100 Vs−1 from related research article).
| ν (Vs−1) | Epc (V) | Epa (V) | E1/2 (V) | ∆E (V) | 106 ipc (A) | ipa/ipc |
|---|
| 0.020 | −0.979 | –0.839 | –0.909 | 0.140 | 2 | 0.750 |
| 0.050 | –0.979 | –0.817 | –0.898 | 0.162 | 3 | 0.500 |
| 0.100 | –0.985 | –0.825 | –0.905 | 0.160 | 4 | 0.500 |
| 0.200 | –0.977 | –0.822 | –0.900 | 0.155 | 5 | 0.600 |
| 0.300 | –1.014 | –0.764 | –0.889 | 0.250 | 6 | 0.500 |
| 0.500 | –1.043 | –0.751 | –0.897 | 0.292 | 8 | 0.188 |
| 0.700 | –1.087 | –0.777 | –0.932 | 0.310 | 9.5 | – |
| 1.000 | –1.074 | –0.728 | –0.901 | 0.346 | 11 | – |
| 2.007 | −1.137 | −0.693 | −0.915 | 0.444 | 16 | - |
| 5.120 | −1.179 | −0.675 | −0.927 | 0.504 | 25 | - |
| 10.240 | −1.150 | −0.631 | −0.891 | 0.519 | 35 | - |
Table 15.
Electrochemical data obtained from the cyclic voltammograms of ca 0.002 mol dm−3 Cu(4-OMe-HBP)2 (15) in dimethyl sulfoxide as solvent, 0.100 mol dm−3 TBAPF6 as supporting electrolyte, reported versus Fc/Fc+, at indicated scan rates ν (Vs−1). (Potential data of 0.100 Vs−1 from related research article).
| ν (Vs−1) | Epc (V) | Epa (V) | E1/2 (V) | ∆E (V) | 106 ipc (A) | ipa/ipc |
|---|
| 0.020 | –1.052 | –0.963 | –1.008 | 0.089 | 5 | 0.60 |
| 0.050 | –1.065 | –0.958 | –1.012 | 0.107 | 8 | 0.63 |
| 0.100 | –1.075 | –0.941 | –1.008 | 0.134 | 10 | 0.50 |
| 0.200 | –1.087 | –0.932 | –1.010 | 0.155 | 13 | 0.38 |
| 0.300 | –1.105 | –0.914 | –1.010 | 0.191 | 16 | 0.25 |
| 0.500 | –1.123 | –0.901 | –1.012 | 0.222 | 20 | 0.10 |
| 0.700 | –1.131 | –0.901 | –1.016 | 0.230 | 24 | – |
| 1.000 | –1.140 | – | –0.570 | 1.140 | 29 | – |
| 2.007 | –1.180 | – | –0.590 | 1.180 | 42 | – |
| 5.120 | –1.226 | – | –0.613 | 1.226 | 69 | – |
| 10.240 | –1.307 | – | –0.654 | 1.307 | – | – |
Table 16.
Electrochemical data obtained from the cyclic voltammograms of ca 0.002 mol dm−3 Cu(4-allyloxy-HBP)2 (16), Cu(HAP)2 (17), Cu(HPP)2 (18), and Cu(4-Oct-HBP)2 (19) in the indicated solvent (dimethyl sulfoxide DMSO or dichloromethane DCM), 0.100 mol dm−3 TBAPF6 as supporting electrolyte, reported versus Fc/Fc+, at indicated scan rates ν (Vs−1). (Potential data of 0.100 Vs−1 from related research article).
| | Cu(4-Allyloxy-HBP)2 (16) in DMSO | Cu(HAP)2 (17) in DMSO | Cu(HPP)2 (18) in DMSO | Cu(4-Oct-HBP)2 (19) in DCM |
|---|
| ν (Vs−1) | Epc (V) | 106 ipc (A) | Epc (V) | 106 ipc (A) | Epc (V) | 106 ipc (A) | Epc (V) | 106 ipc (A) |
|---|
| 0.020 | –1.101 | 2.5 | –1.013 | 2 | –1.044 | 4 | –1.233 | 5 |
| 0.050 | –1.036 | 4 | –1.063 | 4 | –1.108 | 6 | –1.251 | 7 |
| 0.100 | –1.043 | 5 | –1.109 | 6 | –1.118 | 9 | –1.260 | 9 |
| 0.200 | –1.065 | 7 | –1.111 | 9 | –1.123 | 13 | –1.277 | 13 |
| 0.300 | –1.109 | 9 | –1.127 | 11 | –1.132 | 16 | –1.282 | 16 |
| 0.500 | –1.118 | 11 | –1.149 | 14 | –1.154 | 20 | –1.293 | 20 |
| 0.700 | –1.123 | 14 | –1.167 | 18 | –1.158 | 24 | –1.327 | 24 |
| 1.000 | –1.127 | 16 | –1.190 | 23 | –1.174 | 35 | –1.328 | 28 |
| 2.007 | –1.170 | 23 | –1.234 | 33 | –1.213 | 55 | –1.376 | 44 |
| 5.120 | –1.202 | 37 | –1.308 | 60 | –1.272 | 100 | –1.494 | 104 |
| 10.240 | –1.241 | 53 | –1.306 | 84 | –1.320 | 155 | –1.233 | – |


