Article

Comparison of Two Commercially Available Strains, Saccharomycodes ludwigii and Torulaspora delbrueckii, for the Production of Low-Alcohol Beer

1
Department of Micro, Nano and Bioprocess Engineering, Faculty of Chemistry, Wrocław University of Science and Technology, 50-373 Wrocław, Poland
2
Faculty of Chemistry, Wrocław University of Science and Technology, 50-373 Wrocław, Poland
*
Author to whom correspondence should be addressed.
Beverages 2023, 9(3), 66; https://doi.org/10.3390/beverages9030066
Submission received: 14 June 2023 / Revised: 6 August 2023 / Accepted: 8 August 2023 / Published: 10 August 2023

Abstract

:
Due to current trends in beer consumption, as well as social aspects, such as the education of society on combining drinking and driving, intensive research and development efforts have been recently focused on producing low-alcohol beers and non-alcoholic beers with a sensory profile appealing to consumers. There are plenty of methods for obtaining such beverages; one of these methods involves utilizing non-conventional yeasts for wort fermentation. In this work, the production of low-alcohol beer using commercially available Saccharomycodes ludwigii and Torulaspora delbrueckii strains were compared. The results showed that Torulaspora delbrueckii achieved the lowest level of attenuation, producing beer with an ethanol concentration of 2.58% vol. Saccharomycodes ludwigii displayed a slightly higher level of attenuation; however, its alcohol concentration was slightly lower than in the case of Torulaspora delbrueckii and reached 2.50% vol. Fully fermented beers produced using Saccharomycodes ludwigii and Torulaspora delbrueckii represented reduced ethanol concentrations by 12% and 15%, respectively, in comparison to Saccharomyces cerevisiae. Nevertheless, in order to produce non-alcoholic beers, arrested fermentation is necessary. In such a case, Saccharomycodes ludwigii reached the highest level of attenuation among non-alcoholic beers.

1. Introduction

Beer is a popular drink across the world; its consumption continues to grow in OECD countries [1,2]. Moreover, beer is strongly influencing mental health and social life [3]. Nevertheless, observed changes in health policies in European countries and the growing popularity of a healthy lifestyle has increased the demand for low-alcohol beers and non-alcoholic beers [3,4]. In Europe, the alcohol content of non-alcoholic beers and low-alcoholic beers ranges from 0.05% to 1.2% vol. [5]. There are plenty of methods that have been utilized for the production of beers with a reduced alcohol content. Generally, these methods may be included into one of two groups: physical methods and biological methods. Physical methods are focused on removing ethanol from standard beer; biological methods aim to interrupt ethanol fermentation in order to create a beer with a decreased ethanol level in comparison to beer produced in a classical manner [6,7,8,9]. One of the biological methods is the utilization of non-Saccharomyces yeasts. This work has been focused on the comparison of Saccharomycodes ludwigii and Torulaspora delbrueckii for the production of low-alcohol beer. So far, this work is the only one that compares these strains in the same fermentation medium, thus giving a valuable comparison of the abovementioned microorganisms. This work may be useful for companies in the brewing sector in providing preliminary results for the creation of new, low-alcoholic beers.
In the brewing process, the most important ingredients are water, malt, hops, and yeast. Malt is a raw material that provides starch and enzymes, which produce the sugars necessary for yeast metabolism. Moreover, proper composition of the malt types used in brewing may inflict the quality of low-alcoholic beer production [10,11].
The crucial step in beer brewing is mashing, wherein ground malt grains are mixed with water. This mixture is heated to temperatures between 40 °C and 77 °C and controlling the temperature during this process is an essential part of brewing expertise. Typically, mashing takes one to two hours and triggers natural enzymes in the malt to break down starch into simpler sugars, like glucose and maltose.
The degree of enzymatic hydrolysis depends on the pH and temperature. α-amylase is most active at 68–72 °C (at pH = 5.1–5.9), while ß-amylase works optimally at 55–66 °C (at pH = 5.3), respectively [10]. By adjusting the mashing procedure, it is possible to reduce the ethanol content in the final beer. This can be achieved using specific types and amounts of malt to create wort with lower extracts or by mashing at temperatures below or above the optimal range for malt enzymes. These actions lead to reduced enzyme activity and fewer fermentable sugars in the wort [6,12,13].
The final step of beer production is fermentation, which is usually performed at 10–25 °C; the standard fermentation time is up to 14 days. The main products of this process are ethanol and carbon dioxide. However, there are also side products, which include glycerol, higher alcohols, and esters [14,15]. This step may be modified to achieve low-alcoholic beer. The first modification that could be applied is to stop fermentation before the content of ethanol reaches the limits for non-alcoholic beers; another approach could be to use different strains of microorganisms to limit the formation of ethanol. Several examples of useful strains for low-alcoholic beer production include Saccharomyces, Mrakia, Saccharomycodes, and Torulaspora [16,17,18].
Fresh beer (green beer) is typically maturated at around 0–5 °C ranging from a few weeks to a few months. During this step, the last remnants of yeast, proteins, and resins fall away so that the beer clarifies. After lagering, the beer may be filtered, pasteurized, carbonated, and packed [14,19].
Finished beer may also be dealcoholized; the most ubiquitous methods that have been employed for the removal of ethanol from beer are vacuum rectification and reverse osmosis. Such methods are widely used in the industry allowing to achieve non-alcoholic beer with an ethanol content of 0% vol. Other physical methods used in laboratory scale for beer dealcoholization are pervaporation, membrane distillation, and dialysis. Although such methods allow for the production of non-alcoholic beer, they are not used in the industry due to the high costs or worse efficiency than reverse osmosis or vacuum rectification [5,20,21,22].
Yeasts are the workhorses of fermentation; the most ubiquitous yeasts in the brewing industry are Saccharomyces cerevisiae. This large group of yeasts encompasses bread yeast, distillers yeast, and laboratory yeast. Considered the top fermentation yeasts, Saccharomyces cerevisiae belongs to the phylum Ascomycota, subphylum Saccharomycotina, class Saccharomycetes, order Saccharomycetales, and family Saccharomycetaceae.
Saccharomycodes ludwigii are a bipolar budding yeast and a spoilage factor in wine making. They are rarely found in grapes but are most likely a typical contaminant of sulfite-preserved musts. They owe their durability to their high tolerance to ethanol and sulfur dioxide. However, Saccharomycodes ludwigii often appears in wines either at the end of fermentation or during storage; it causes sedimentation or solution turbidity. Thanks to its high fermentability, this strain is able to create a rich aroma profile. Therefore, it is often used in the production of fruit wines, where organic acids and various aromatic compounds are desired [23,24].
Torulaspora delbrueckii occurrence was reported in fruits, insects, soils, plants, seawater, spoiled food, malt environments, and even in a clinical isolate [25]. T. delbrueckii belongs to the phylum Ascomycota, subphylum Saccharomycotina, class Saccharomycetes, order Saccharomycetales, and family Saccharomycetacea. Nowadays, there are six accepted species of the Torulaspora genus, namely Torulaspora delbrueckii, Torulaspora globosa, Torulaspora franciscae, Torulaspora microellipsoides, Torulaspora maleeae, and Torulaspora pretoriensi [26]. Studies showed that Torulaspora delbrueckii has been domesticated by humans for almost 4000 years. Most cells of Torulaspora are spherical; however, ovoid and ellipsoidal shapes are also present. The size of the cell is between 2–6 × 3–7 µm. This strain typically reproduces asexually through mitosis, although sexual reproduction is possible in sporulation media through asci that contain one to four spherical ascospores [27].
The main purpose of this research was to investigate the fermentation profile of a low-alcohol beer using the commercially available Saccharomycodes ludwigii and Torulaspora delbrueckii strains. This experiment began with the brewing of wort and fermenting it with the selected strains of yeast.

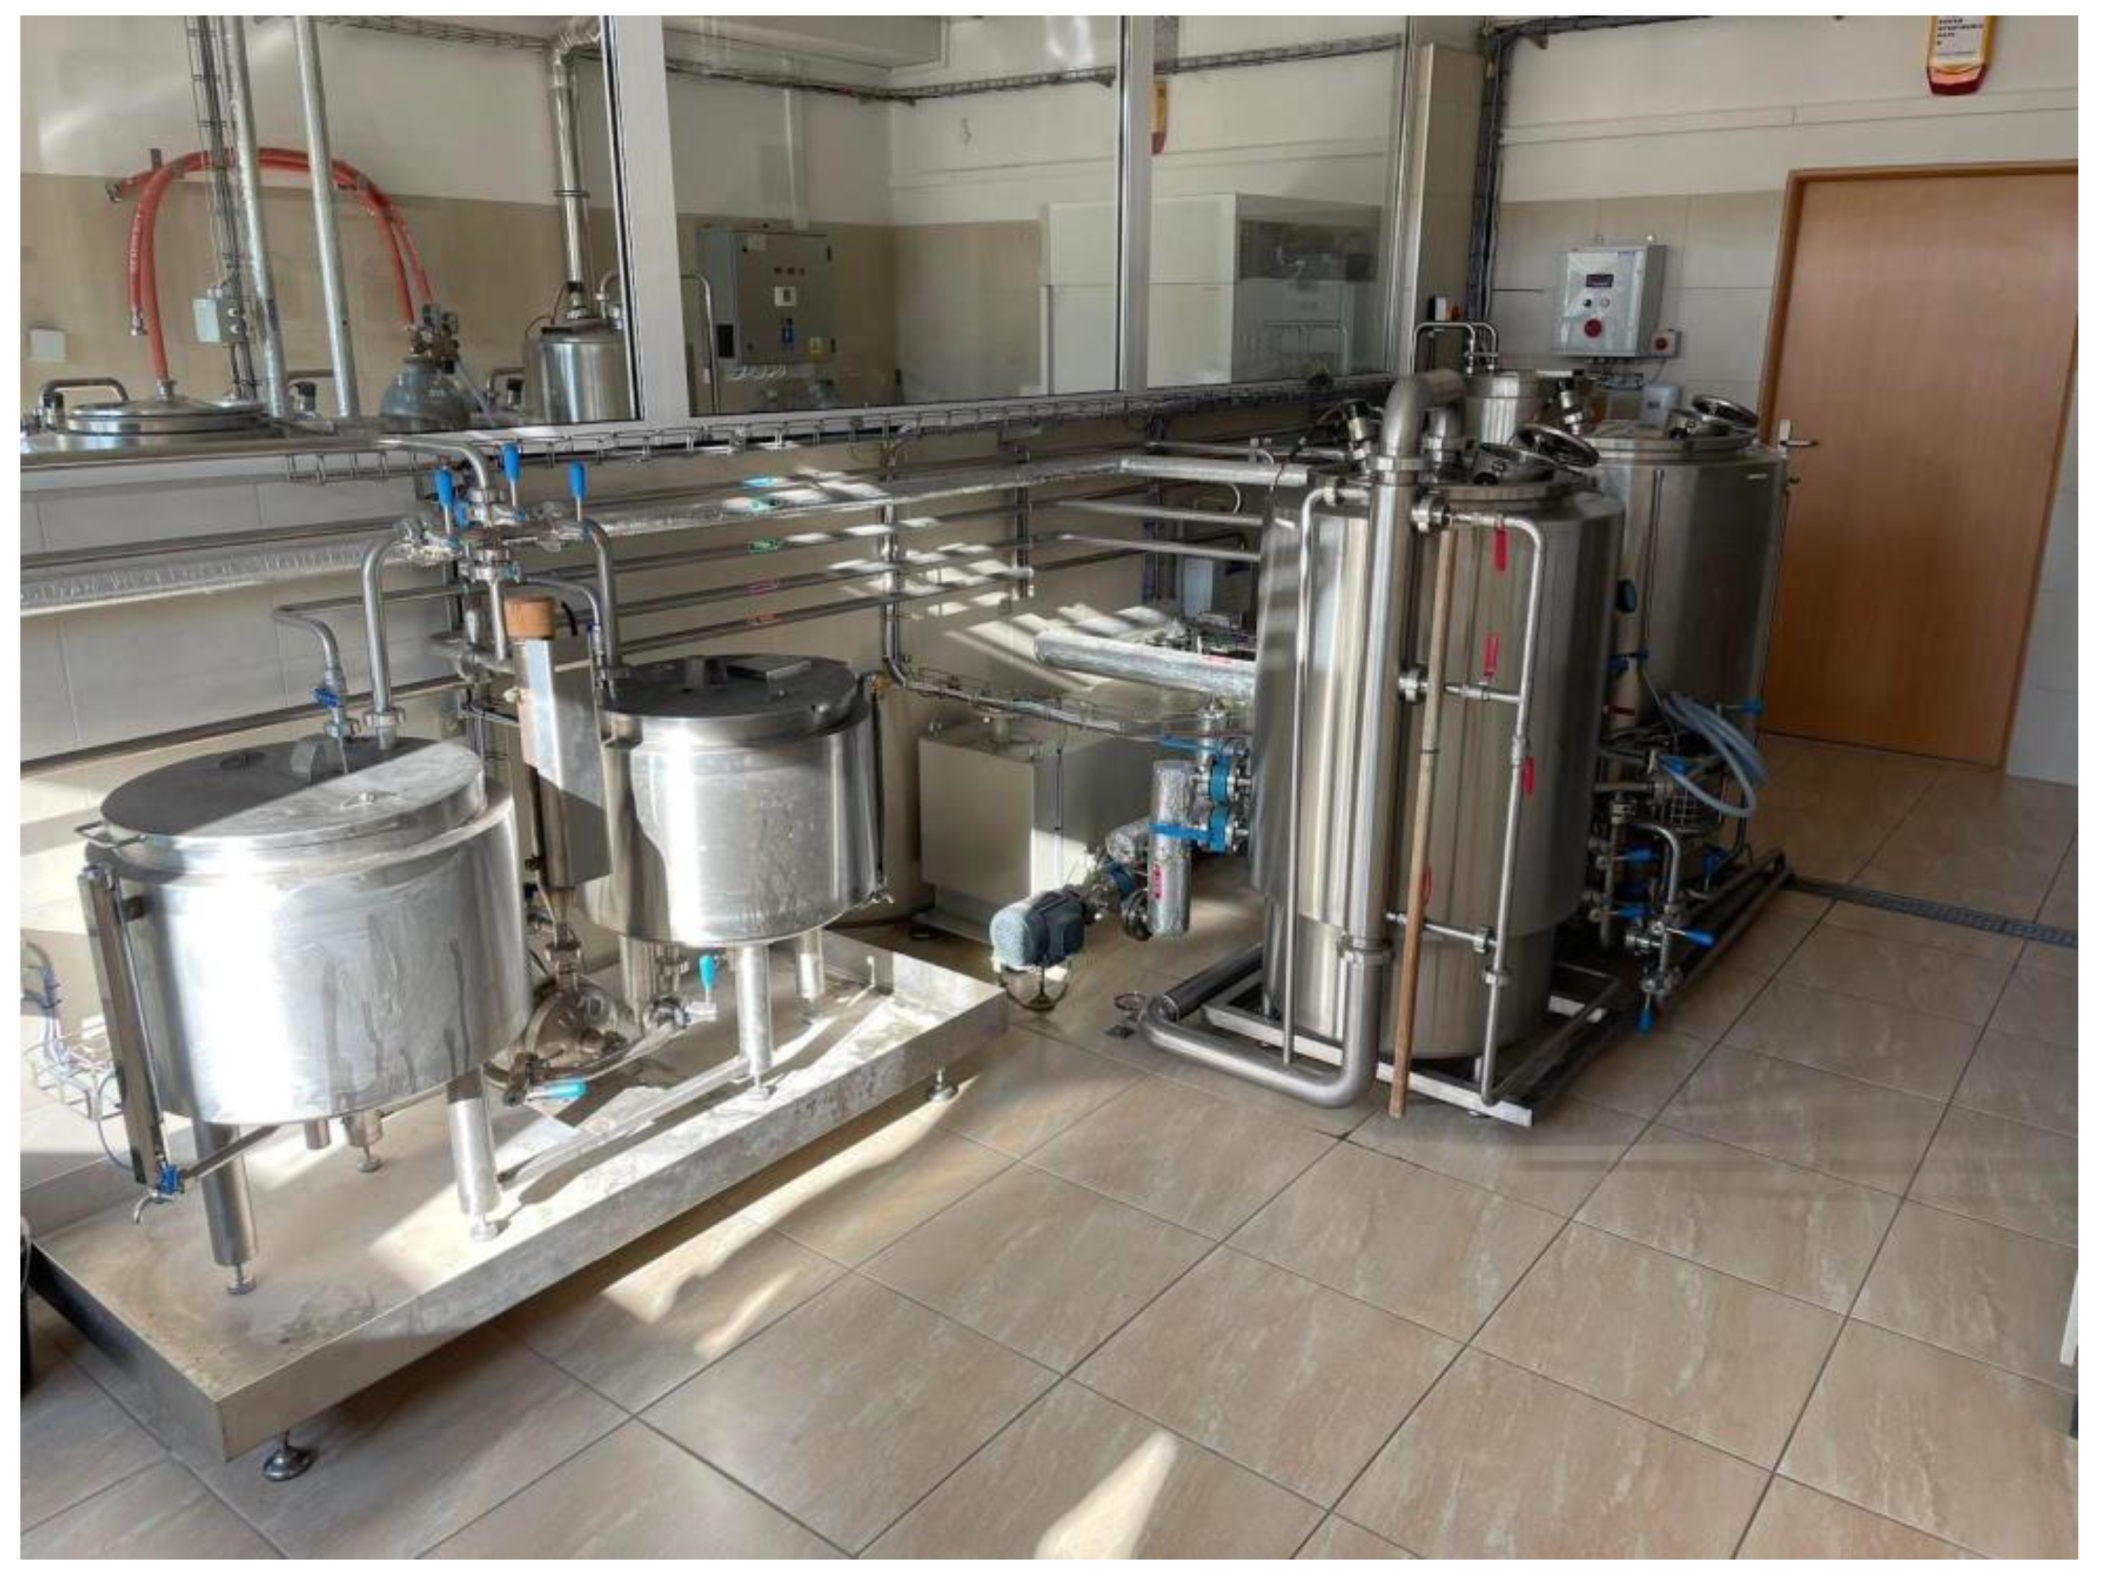
2. Materials and Methods

2.1. Yeast Preparation

For yeast cultivation, three flasks with 400 mL of sterile YPG growth medium were prepared. Medium composition was as follows: yeast extract 10 g/L (BTL, Łódź, Poland), peptone 10 g/L (Sigma-Aldrich, St Louis, MO, USA), and glucose 70 g/L (POCH, Gliwice, Poland). Approximately 3 g of the following dried yeasts were added into each flask: Saccharomyces cerevisiae (Fermentis T-58, Lesaffre, Marcq-en-Baroeul, France), Saccharomycodes ludwigii (Fermentum Mobile FM58, Fermentum Mobile, Gdańsk, Poland), and Torulaspora delbrueckii (Biodiva TD291, Lallemand Polska, Józefów, Poland). The corresponding stocks were given the following abbreviations, which were used throughout this article: T-58 for Saccharomyces cerevisiae, SL for Saccharomycodes ludwigii, and TD for Torulaspora delbrueckii. Each flask was sealed with a microbiological seal and left to rise in a temperature of 23 °C in the shaker for a week. The optical density of the inoculum measured spectrophotometrically using a wavelength of 550 nm was found to be in the range from 0.521 to 0.579 for the 10-times diluted samples.

2.2. Wort Preparation

Wort was prepared using Wrocław University of Science and Technology’s brewing installation (Destila, Brno, Czech Republic) (as shown in Figure 1). At the beginning, 60 dm3 of water under a temperature of 68.5 °C was mixed with 8.00 kg of Pilsner malt (Viking malt, Strzegom, Poland) and 5.45 kg of Munich malt (Viking malt, Strzegom, Poland). Such proportions were chosen due to the lower enzyme activity of Munich malt compared to Pilsner malt, which should lower the fermentability of wort. The mashing regime was as follows: 20 min at 73 °C, followed by 10 min at 78 °C to stop the activity of malt enzymes. Such a temperature regime was chosen in order to lower the maltose content in the wort. After gravity filtration and sparging (25 dm3 of water in a temperature of 78 °C), the true extract content in the wort was 7.5 °Brix.
In the next step, the wort was boiled and then hopped. Sixty minutes before the end of boiling, 60 g of ‘Marynka’ hop (Browamator, Strzyżów, Poland) was added, and then 15 min before the end of boiling, 100 g of ‘Sterling’ hop (Twój browar, Wrocław, Poland) was added. After boiling, 72 dm3 of wort was obtained with true extract of 9.2 °Brix. The resulting solution was centrifugated, cooled down to 25 °C, and divided into five sterile fermenters. Each of them contained 14 L of wort. The previously prepared yeasts: Saccharomyces cerevisiae (T-58), Saccharomycodes ludwigii (SL), and Torulaspora delbruecki (TD) were added into the fermenters. All of the microorganisms were pitched as 10 mL of liquid culture using sterile pipettes. For the last two types of yeast, tests were performed in two repetitions, which were named as follows: SL-1 and SL-2, and TD-1 and TD-2, respectively.
The prepared solution was left for fermentation for 12 days under 23 °C, a temperature suitable for top fermentation. Samples were retrieved each day and frozen. After the experiment, each sample was unfrozen and analyzed.
Two ways of fermentation were considered for this experiment; the first, called full fermentation, was a standard fermentation process that was conducted for 11 days until the wort was completely fermented. The second fermentation process, called arrested fermentation, was considered after the beer reached the maximal ethanol content allowed by most regulations, which is 0.5% vol.

2.3. Analysis Methods and Analytical Equipment

2.3.1. Determination of Ethanol

The alcohol content was measured using a Shimadzu 2010 gas chromatograph (Shimadzu, Japan) equipped with an FID detector. Samples were filtrated using 0.45 μm RC syringe filters in order to remove solid particles that may cause problems with injecting port. Next, 0.5 µL of samples were injected into the injector using an AOC-20i autosampler. The injector temperature was set to 140 °C; the detector temperature was 200 °C; the split ratio was set at 30:1. Analysis was performed using the ZB-WAXplus column (L = 30 m, I.D. = 0.25 mm, and df = 0.25 μm) with helium as a carrier gas. Flow through the column was set to 0.98 mL/min. The temperature program was set from 35 °C for 5 min, then raised up to 85 °C (at 10 °C/min), and in the next step raised up to 200 °C (at 25 °C/min). The procedure ended with a hold at 200 °C for 1 min. The retention time of ethanol (Pol-Aura, Poland) was 2.78 min. Results were quantified using a calibration curve obtained from ethanol solutions in known concentrations. Data were processed using the program Chromax (Pol-Lab, Wilkowice, Poland).

2.3.2. Color Measurement

Beer color was measured according to the MEBAK 2.12.2 [28] using a Hitachi U-1900 spectrophotometer (Hitachi, Tokyo, Japan) at a wavelength of 430 nm. Measurements were performed using a 1 cm quartz cuvette. Color, in EBC units, was calculated using the formula below:
E B C = ( 25 × A 430 ) ( 25 × A 700 )
where A 430 —absorbance using a wavelength of 430 nm, and A 700 —absorbance using a wavelength of 700 nm, respectively.

2.3.3. Density

The density of each sample was measured according to MEBAK 2.9.2.3 using an Anton Paar DMA-38 density meter [28]. Measurements of density were used in order to calculate sugar concentrations in wort and beer.
The degree of attenuation was calculated using formula [29]:
A = ( E i E f ) E i × 100 %
where A—attenuation [%], Ei—initial extract [°Brix], and Ef—final extract [°Brix].

2.3.4. Bitterness and pH

Bitterness was measured according to EBC 2.17.1 [28]. This method is based on the isooctane extraction of bitter substances from beer. Results were obtained through absorbance using a wavelength of 275 nm. pH was measured with the Crison pH meter Basic 20+.

2.3.5. Semiquantitative Analysis of Volatile Compounds

Semiquantitative analysis of volatile compounds was performed using a Shimadzu 2010 gas chromatograph (Shimadzu, Kyoto, Japan) equipped with an FID detector. Samples were filtrated using 0.45 μm RC syringe filters in order to remove solid particles that may cause problems with injecting port. Next, 0.5 µL of samples were injected into the injector using an AOC-20i autosampler. The injector temperature was set to 200 °C; the detector temperature was 250 °C; the split ratio was set at 2:1. Analysis was performed using the ZB-WAXplus column (L = 30 m, I.D. = 0.25 mm, and df = 0.25 μm) with helium as a carrier gas. Flow through the column was set to 2 mL/min. The temperature program was set from 20 °C for 2 min, then raised up to 60 °C (at 5 °C/min), and in the next step raised up to 240 °C (at 15 °C/min). The procedure ended with a hold at 240 °C for 5 min. Analysis was performed through a comparison of the retention times with the standards listed below (Table 1).

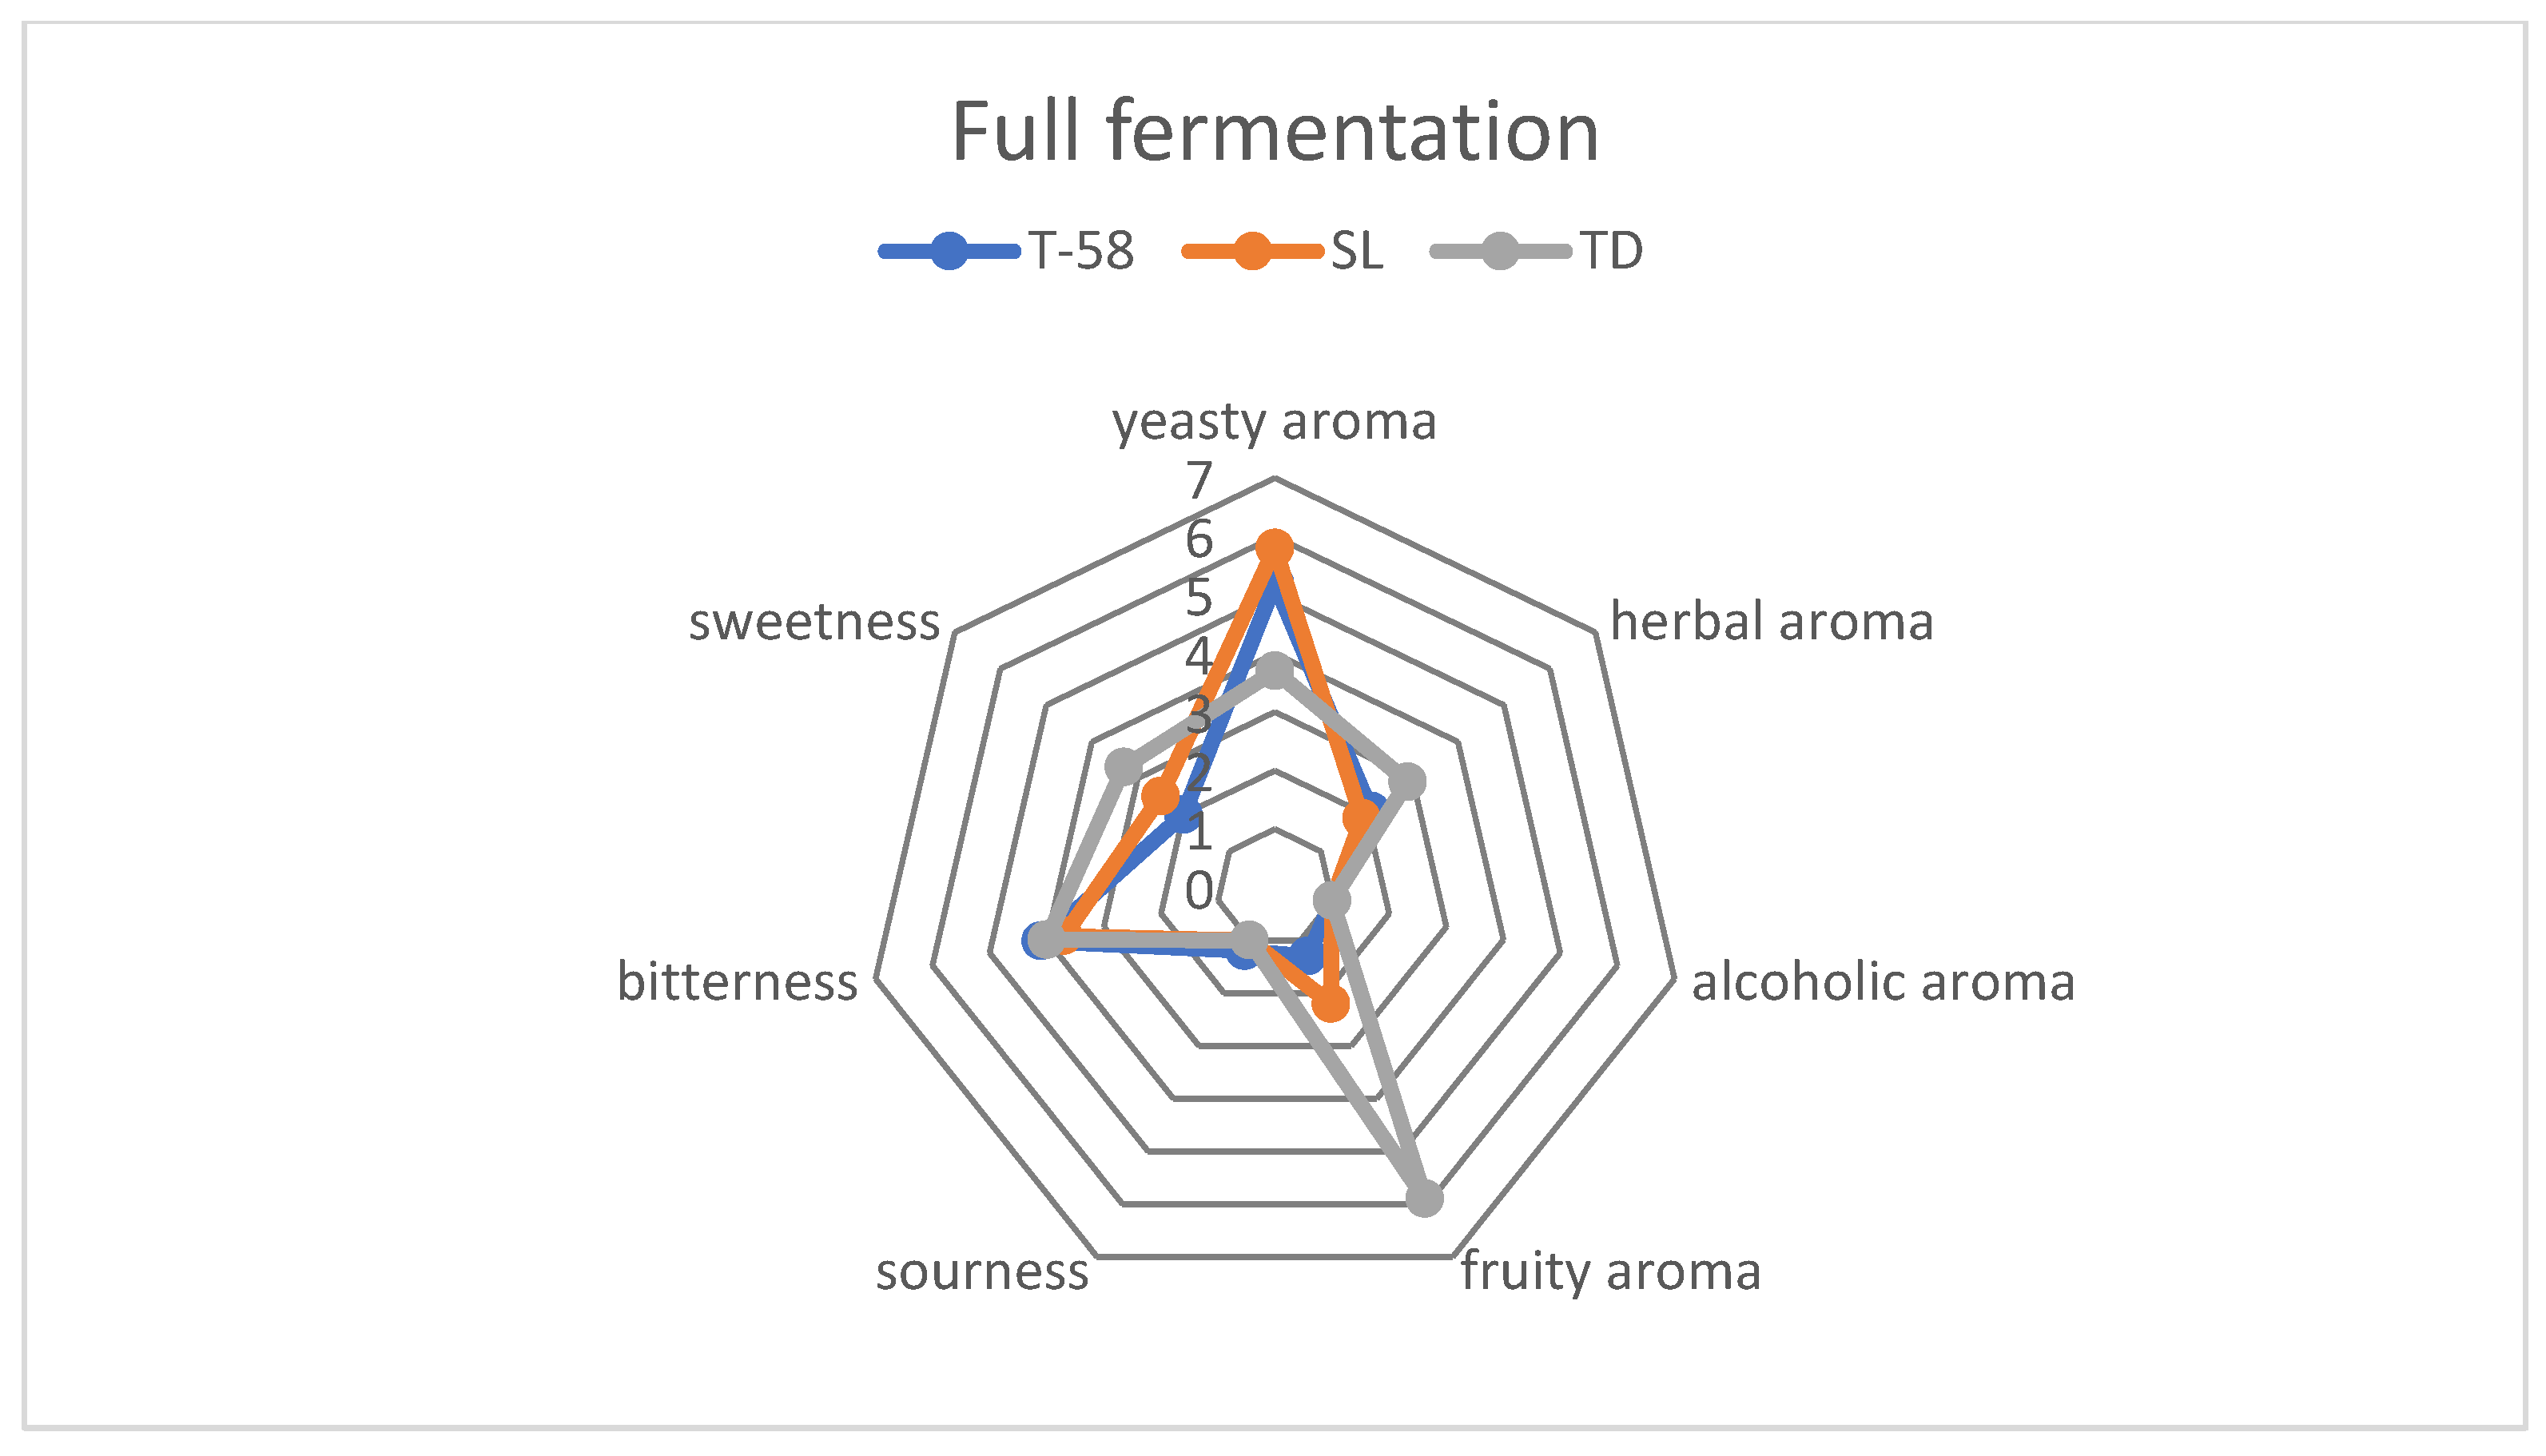
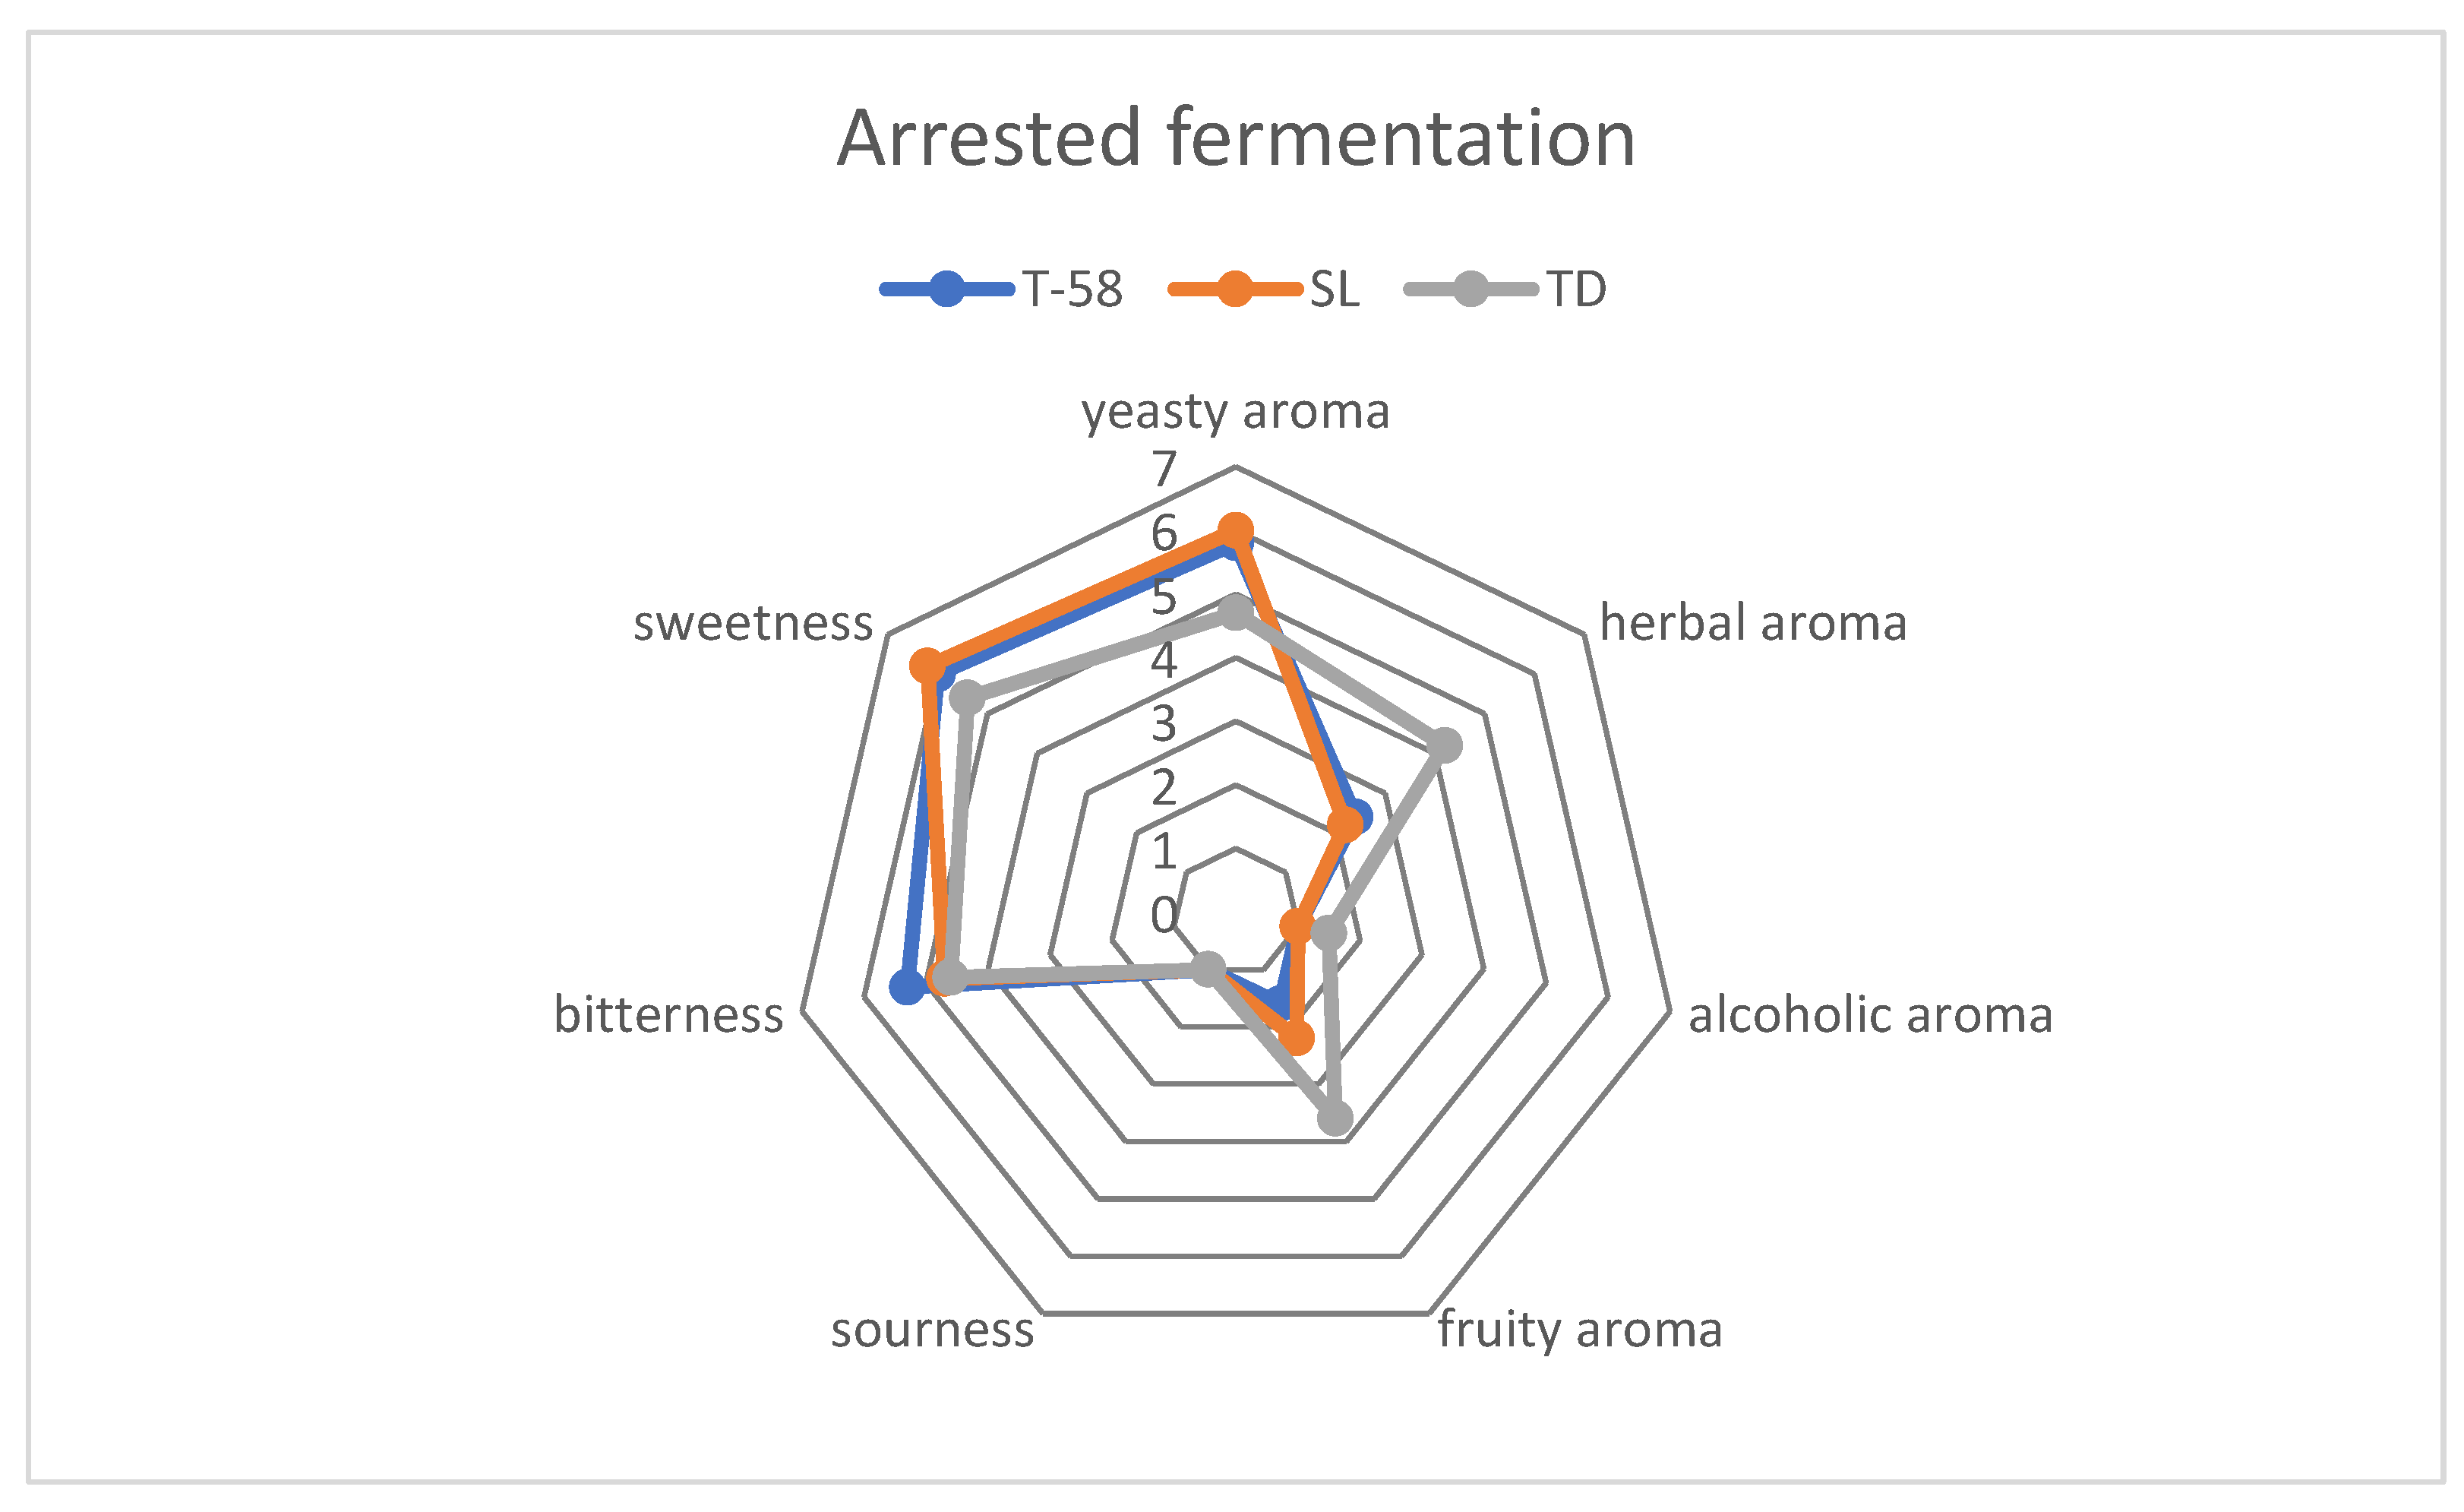
2.3.6. Organoleptic Tests

Organoleptic analyses were conducted following the guidelines provided in the book by Babicz-Zielińska et al. [30]. Organoleptic tests were conducted by 22 respondents who evaluated the following parameters: yeasty aroma, alcoholic aroma, herbal aroma, fruity aroma, bitterness, sourness, and sweetness, giving them notes ranging from one for parameter not perceived to seven for parameter strongly perceived.

2.3.7. Statistical Analysis

Statistical analysis was performed using Minitab. For these experiments, a linear model was employed with a level of significance (p-value) > 0.05.

3. Results and Discussion

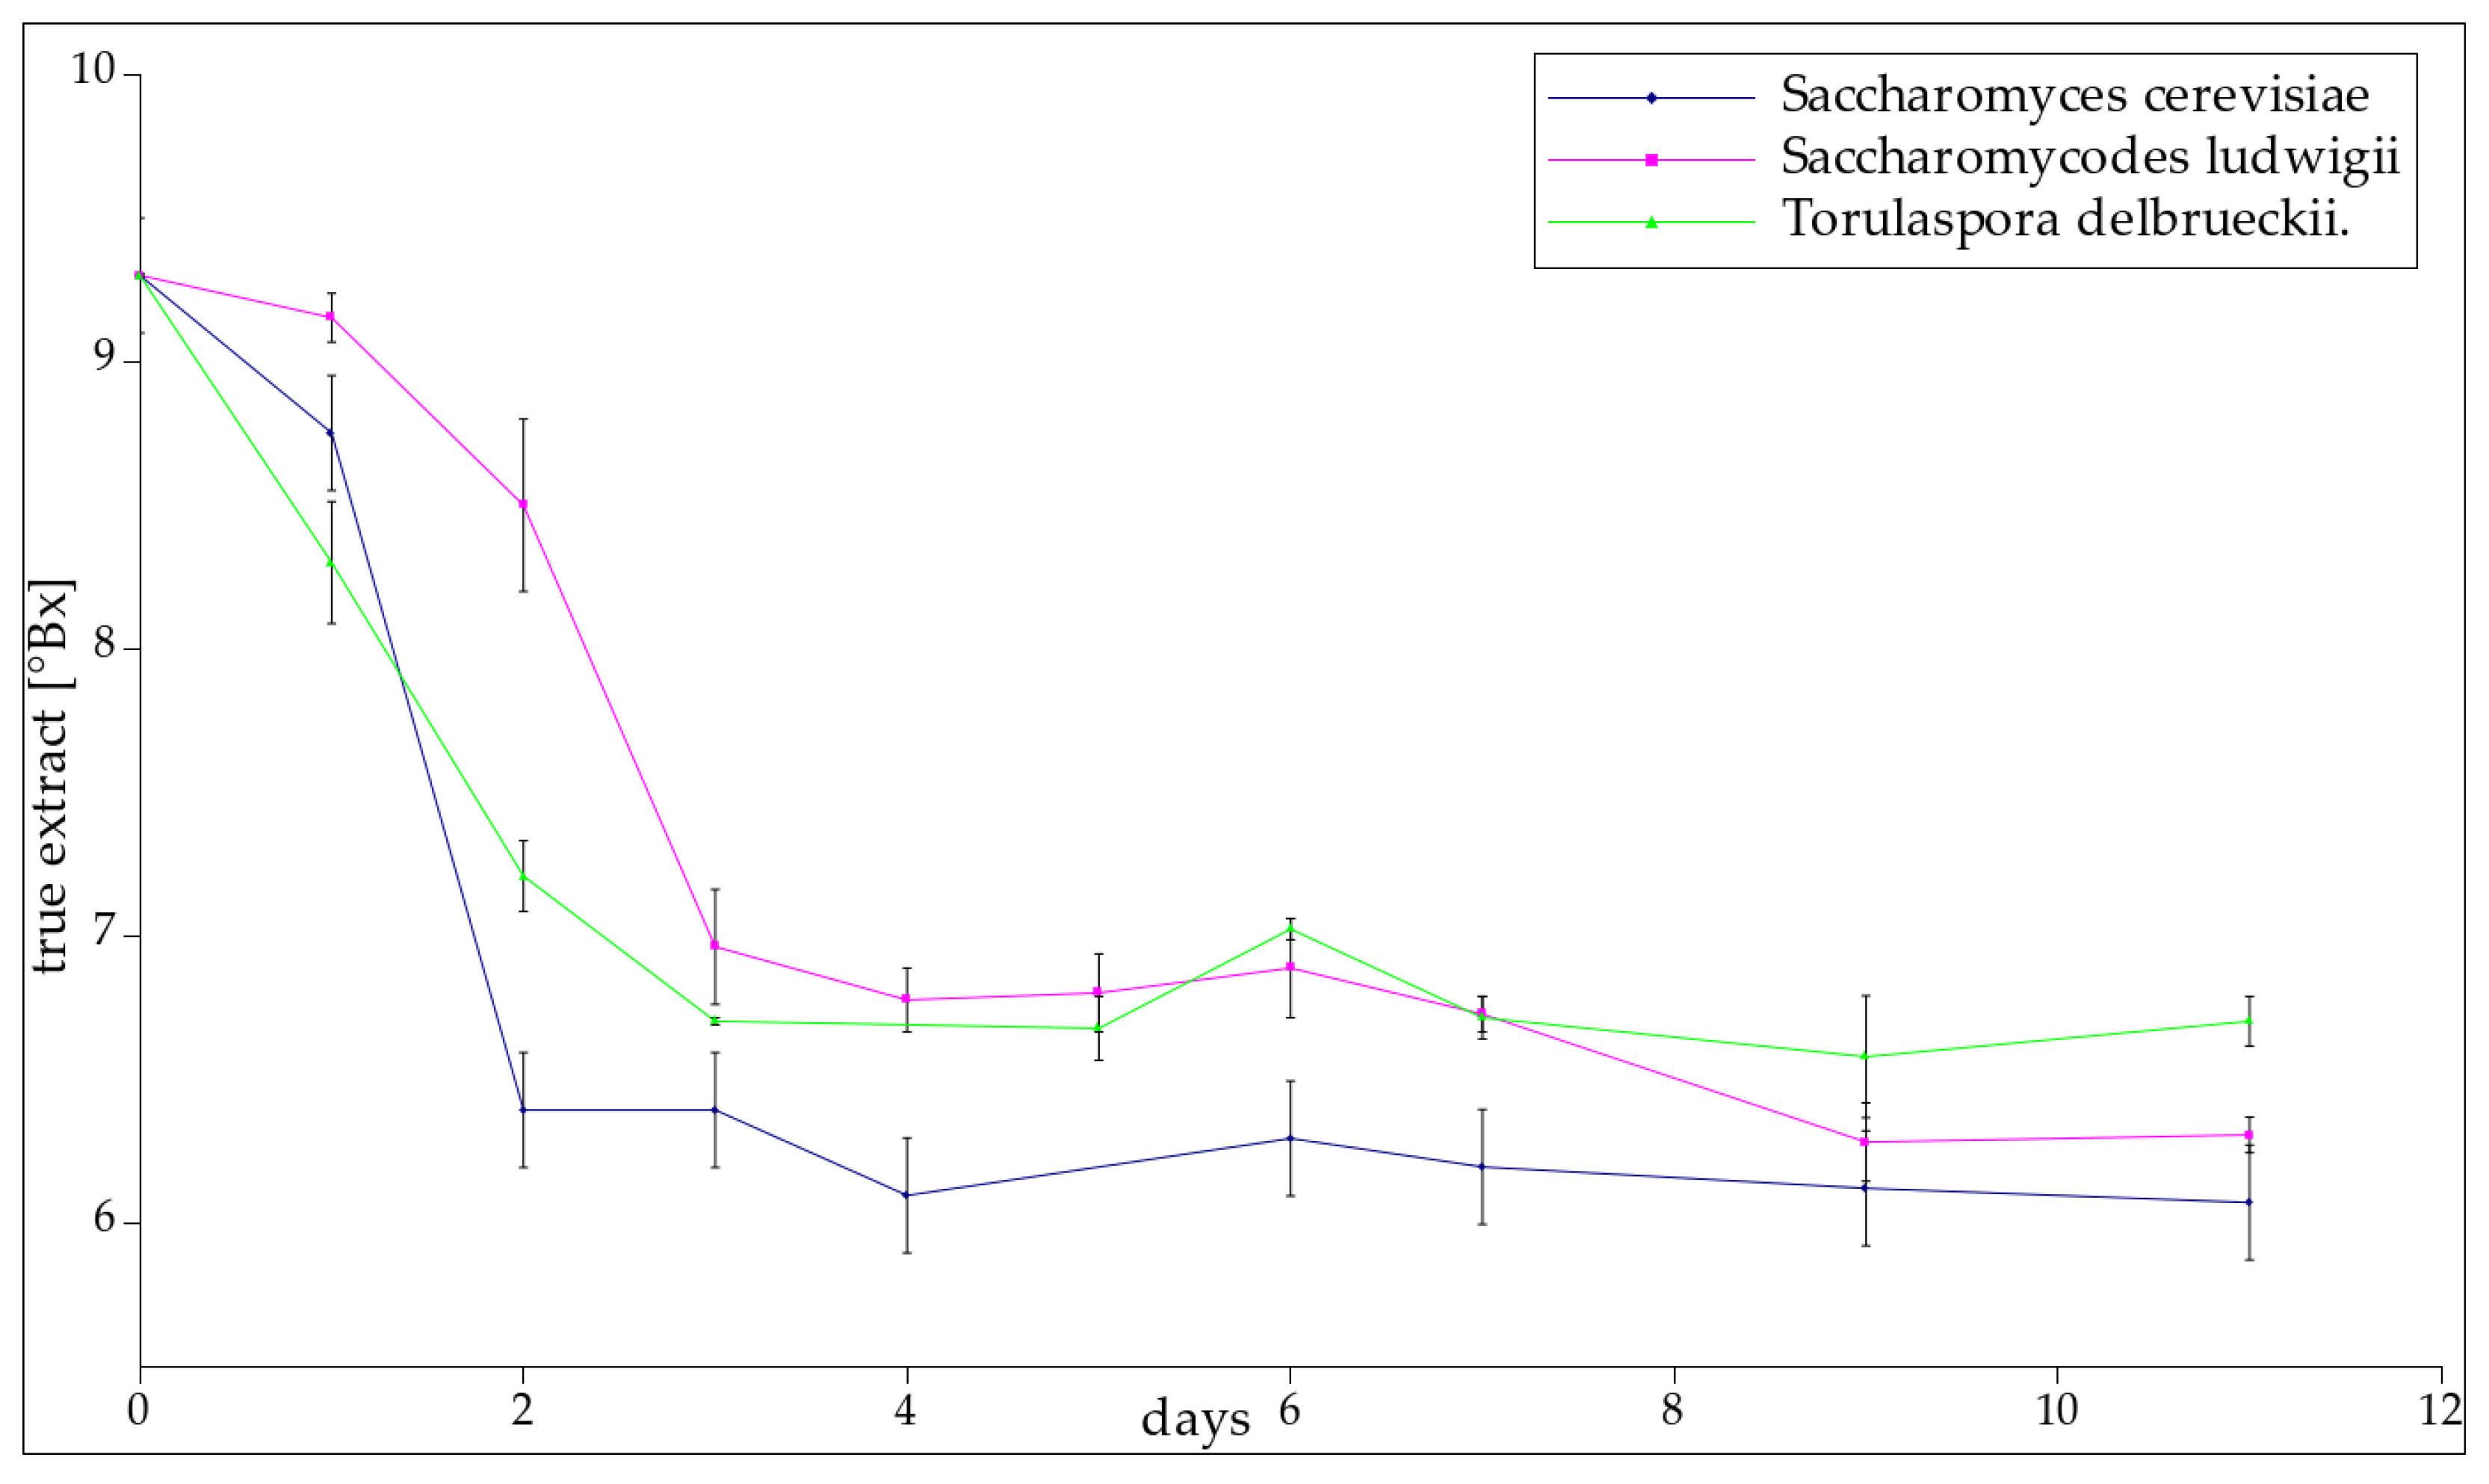
3.1. True Extract Content

Fermentation exhibited its highest rate during the initial days (Figure 2). The T-58 yeast efficiently converted 31% of the sugar in the solution within a span of two days. Notably, the most intense fermentation occurred during this initial two-day period. On the other hand, using Saccharomycodes ludwigii yeast, both repetitions achieved similar attenuation after the third day, with 25% of the initial sugars being fermented. Differences between these two samples showed up in the earlier days. The decrease in gravity for trial number 2 over the first two days was negligible, while the first trial had fermented 15.6% of the initial sugar content. SL-2 accelerated the fermentation process between days two and three; this was deemed as one of the two most intense daily decreases in attenuation in all samples. Later, changes in sugar concentration were slow. For Torulaspora delbrueckii, both samples fermented at a similar rate, and the differences were within the inaccuracy of the method. The greatest reductions in sugar concentration were observed during the first and second days of the process. After day three, the true extract concentration stabilized at a constant level for all yeast strains and the true extract content was similar for each sample. The highest average true extract content was 6.9 °Brix for sample TD1, and the lowest for T-58 was 6.2 °Brix (Table 2). This information indicates that the sugar concentration dropped rapidly within the first few days of fermentation having been established at constant level between 6 and 7 °Brix. Statistical analysis revealed that the final concentration of sugars was significantly dependent on the utilized yeast strain (p-value = 0.02).

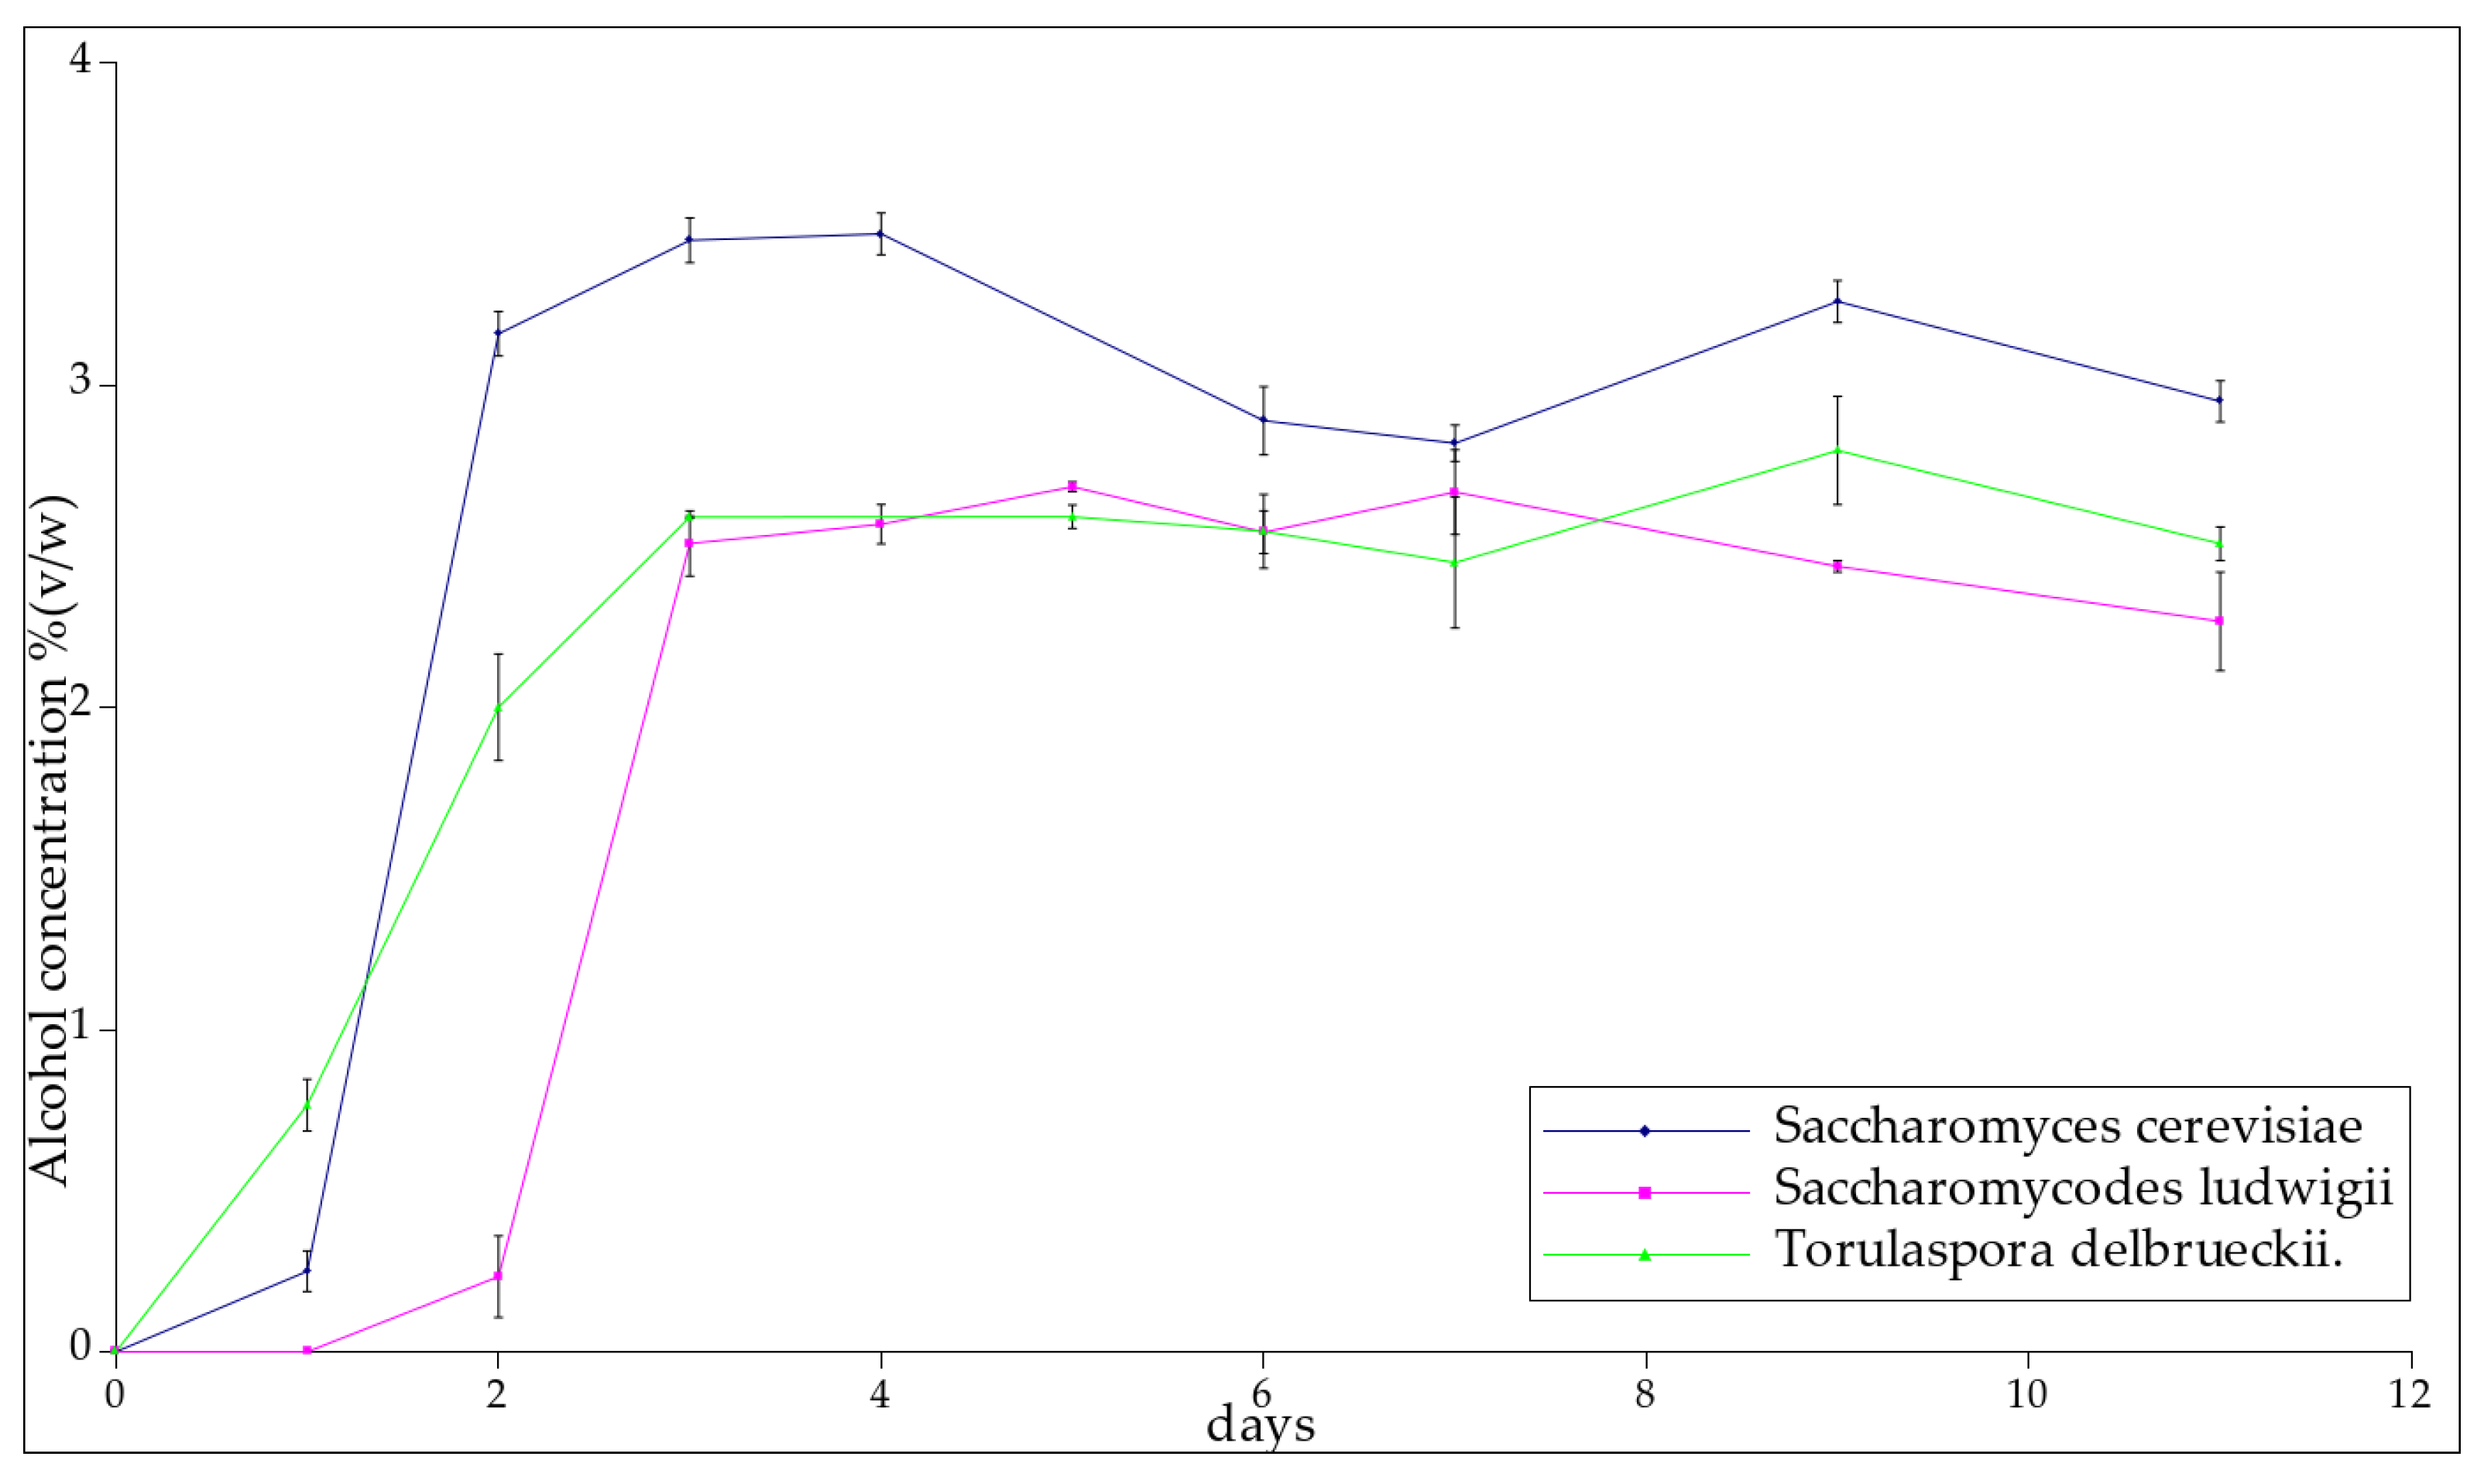
3.2. Alcohol Concentration

On the first day, the T-58 yeast produced a small amount of alcohol, but on the following day, the yield of the fermentation reaction was the highest during the whole process. The total alcohol concentration, in this case, was the highest among all the samples, and this was found to correspond to the degree of attenuation. Samples SL-1 and SL-2 fermented at a similar rate and the amounts of alcohol produced were very similar. The average degree of attenuation was 32.16. Yeast Torulaspora delbrueckii samples 1 and 2 also fermented at a similar rate and achieved their greatest increases in alcohol concentration during day three. They also obtained the lowest average degree of attenuation, which is highly desirable when producing low-alcohol beers. Once the alcohol levels had stabilized, the following average values were obtained: T-58 3.14 ± 0.23% (v/w), SL-2.50 ± 0.31% (v/w), and TD-2.58 ± 0.16% (v/w) (Figure 3). Statistical analysis indicated that the low-alcoholic yeast strains used in this experiment did not significantly affect the final ethanol concentration of the product (p-value for the hypothesis that the strain influences the concentration of ethanol = 0.56).
In the research conducted by Esteves et al., a strain of Saccharomyces cerevisiae was used for the production of wine. The resulting beverage had an ethanol content of 10.391 ± 0.025%. Fermentations were carried out for 72 h in 100 mL flasks at the temperature of 25 °C [23].
As this study shows, the resulting beverage definitely does not fit into the group of low-alcohol beers. However, new strains of Saccharomyces cerevisiae produced by means of adaptive evolution or gene modification show a reduced ability to form ethanol [8].
Navratil et al. showed that five mutant strains of Saccharomyces cerevisiae (JS 10-3C, JS 164, W303∆KGD1, EF2, and E2) deficient in the synthesis of tricarboxylic acid cycle enzymes were able to produce beer with an ethanol content of less than 0.5% vol. The batch fermentation process was conducted in 500 mL containers filled with 400 mL of wort and Saccharomyces cerevisiae yeast in an amount of 3 g (dry weight). The fermentation process took an average of 3–4 days, and the ethanol content ranged from 0.31% to 0.09%. The lowest concentration of ethanol among the low-alcohol beers was obtained using the strain with the W303∆KGD mutation [31].
In comparison with the abovementioned S cerevisiae strains, the reference strain T-58 produced beer with a higher ethanol concentration, reaching 2.95 ± 0.23% vol. after two days of fermentation. Nevertheless, after one day of fermentation, beer fermented with the T-58 strain revealed an ethanol concentration of 0.25 ± 0.07% vol., but displayed a sugar concentration that was too high, which caused the worty flavor of the resulting product (Figure 3).
Saccharomycodes ludwigii is a strain that has been widely used in the production of low-alcohol beer and wine. Thanks to this yeast, it is possible to create a beer with a very low alcohol concentration (of up to 0.1% v/v). Moreover, the large amount of esters gives the beverage a fruity character [8]. Saccharomycodes ludwigii represent a complete or an almost complete inability to ferment maltose, which is the main fermentable sugar in wort. Saccharomycodes ludwigii is an alcohol-lowering yeast present in mixed fermentations. This strain can produce up to 12% v/v acetic acid and ethanol, in most cases, at concentrations below 1.0 g/dm3. Several strains showed an acetic acid yield of 0.3–0.5 g/dm3. [24,32]. Studies conducted by Adamenko et al. showed that non-alcoholic beer produced using Sacccharomycodes ludwigii had an ethanol concentration of 0.41% vol. and that the extract change between wort and finished beer was 0.57 °Brix [33]. After full fermentation, the concentration of ethanol in the conducted experiment was 2.58 ± 0.31% vol., while the extract change was 2.3 °Brix. In the case of arrested fermentation, the concentration of ethanol reached 0.23 ± 0.03% vol. with an extract change of 1.3 °Brix, reaching a degree of attenuation equivalent to 14%, which was deemed to be relatively high in comparison to other experiments (Figure 3) [33,34].
Torulaspora delbrueckii cultures have been mostly used in the wine sector due to their improvement in quality parameters, such as ethanol reduction, glycerol content, aromatic complexity, anthocyanin content, polysaccharides, and mannoproteins [25,27,35]. According to Canonico et al., usage of pure Torulaspora delbrueckii cultures in beer fermentation results in a low alcohol content. The final product is characterized by a pleasant and aromatic taste and lighter color, along with a compact and persistent foam [36]. As in wines, beers made using a pure culture of Torulaspora delbrueckii show fruity flavors. In studies carried out by Canonico et. al., their ethanol concentration was equal to a 2.66% vol, while their wort’s sugars content was 130.01 g/L, and their degree of attenuation was 45% [36]. Their concentration of ethanol is comparable with our conducted experiment, where Torulaspora delbrueckii reached a 2.56 ± 0.16% vol. However, our degree of attenuation was lower, reaching 27% (Figure 3); such change was affected by the difference in the wort composition used in both experiments. In another study, carried out by Michel et. al., the alcohol content was between 0.83% and 4.00% vol, while the wort’s sugars concentration was 12 Brix [37].
Yeasts prefer a slightly acidic environment, and the optimum working conditions are provided by a pH range between 4.5 and 5.5 [38]. The initial pH of the wort was 5.4. The measured pH of the beverages was between 4.0 and 5.4, which is close to the range that has been reported in the literature. The initial environment of the Saccharomycodes ludwigii yeast was characterized by a higher pH than that of the Torulaspora delbrueckii and T-58 environments. The pH of the Saccharomycodes ludwigii yeast environment decreased during the first three days to stabilize at 4.31 (SL-1) and 4.04 (SL-2). The T-58 and Torulaspora delbrueckii yeast environments showed a slight decrease in pH during the first three days and, as with SL, the pH stabilized (Figure 4). The average pH values from day 3 onwards for all samples are given in Table 3. Statistical analysis revealed that the yeast strains used in this experiment did not significantly affect the final pH of the beer (p-value for the hypothesis that the strain influences the pH = 0.41).
After eleven days of fermentation, the bitterness was measured in the last samples. For all of the experiments, no significant difference was observed. Bitterness was measured at a level from 31 to 35 IBU (Table 4).
The color of the samples did not change during the experiment and was equal, depending on the used strain, from 30 to 34 EBC (Table 4). These values are within the range of pale ale beers.
Qualitative analysis using GC showed that the number of detected compounds decreased during fermentation. Diacetyl was detected in all fully fermented and low alcoholic beers produced using Torulaspora delbrueckii and Saccharomycodes ludwigii. Acetoin was only present in fully fermented beers. In low alcoholic samples, ethyl acetate, acetic acid, and phenylethyl alcohol were observed.
Organoleptic tests revealed differences between the tested strains (Figure 5). For all of the strains, alcoholic aroma was not perceived as well as sourness. For Saccharomycodes ludwigii and Saccharomyces cerevisiae, herbal aromas were perceived on the same level, while respondents detected a more intense herbal aroma for Torulaspora delbrueckii. A fruity aroma was dominant for beer fermented with Torulaspora delbrueckii. Such observations are similar to data reported in the literature [27]. Regarding the other samples, fruity aromas were far less felt. Yeasty aroma was the most perceptible in samples fermented using Saccharomycodes ludwigii and Saccharomyces cerevisiae. Sweetness was slightly higher in the sample fermented by Torulaspora delbrueckii; such observation may be caused by the relatively high concentration of sugars in fermented beer (Table 4) along with its fruity flavor that may enhance the feeling of sweetness.
Low alcoholic beer created using arrested fermentation represented different organoleptic properties than fully fermented beer (Figure 6). In all of the beers examined, a yeasty aroma was noticed on a slightly higher level than in fermented beer; such observation is typical for fermenting beers [39]. Sweetness was more noticeable in all samples; this is caused by higher sugar concentration in samples (Table 3). Bitterness was perceived on a higher level than in fully fermented beer; such observation may have been inflicted by the harsh bitter taste of freshly hopped beer [39,40]. An interesting change in organoleptic properties was observed in the batch fermented using Torulaspora delbrueckii in arrested fermentation beer, wherein herbal and fruity aromas were perceived on the similar level, while in fully fermented beer herbal aroma decreased in favor of fruity aroma (Figure 5 and Figure 6).

4. Conclusions

During the 11 days of fermentation, it was possible to achieve beer with a reduced ethanol content. All of the beers presented different organoleptic properties. In comparison to the reference strain, Saccharomycodes ludwigii was able to lower the ethanol content by 12%, reaching an average ethanol content of 2.58% vol. Torulaspora delbrueckii reduced ethanol concentration by 15%, reaching 2.50% vol. Such results were obtained for uninterrupted fermentation. These results show that both strains are suitable for the production of beer with a reduced ethanol content. Pasteurization could stop the fermentation at the moment when the ethanol concentration is at the desired level. For Saccharomyces cerevisiae, such a level was achieved after the first day of fermentation, where the ethanol content reached 0.25% vol. along with a degree of attenuation of 0.05. Saccharomycodes ludwigii reached a level of 0.23% vol. after the second day of fermentation. Moreover, this strain lowered the true extract of beer to 7.9 °Brix, which was deemed to be the most fermented among all the low alcohol beers examined, reaching a degree of attenuation of 0.14. This level of attenuation is comparable with the data reported in the literature [33]. Torulaspora delbrueckii produced a level of 0.76% vol. after the first day, which is too high for non-alcoholic beer in most European countries and achieved a degree of attenuation of 0.10.
Both commercially available strains showed potential for the production of beer with a reduced ethanol content. Although uninterrupted fermentation of non-alcoholic beer was not produced in this experiment, further improvements in the mashing regime and fermentation conditions may lead to fully fermented, low-alcohol beer.

Author Contributions

Conceptualization, M.J.; methodology, M.J.; validation, M.J., W.C. and T.D.; formal analysis, T.D. and W.Ż.; investigation, T.D., W.C., L.H., W.Ż. and M.J.; resources, W.C., M.J.; data curation, T.D. and W.Ż.; writing—original draft preparation, M.J., W.C., T.D., W.Ż. and L.H.; writing—review and editing, M.J., W.C. and A.T.; visualization, T.D. and W.Ż.; supervision, A.T.; project administration, W.C., T.D. and M.J.; funding acquisition, W.C. All authors have read and agreed to the published version of the manuscript.

Funding

This research received no external funding.

Conflicts of Interest

The authors declare no conflict of interest.

References

  1. Bentzen, J.; Smith, V. Structural Changes in the Consumption of Beer, Wine and Spirits in OECD Countries from 1961 to 2014. Beverages 2018, 4, 8. [Google Scholar] [CrossRef] [Green Version]
  2. The Brewers of Europe European Beer Trends—Statistics Report|2020 Edition; Brewers of Europe: Brussels, Belgium, 2021; pp. 1–36.
  3. Hernández-Mora, Y.N.; Verde-Calvo, J.R.; Malpica-Sánchez, F.P.; Escalona-Buendía, H.B. Consumer Studies: Beyond Acceptability—A Case Study with Beer. Beverages 2022, 8, 80. [Google Scholar] [CrossRef]
  4. Schulz, F.N.; Richter, B.; Hanf, J.H. Current Developments in European Alcohol Policy: An Analysis of Possible Impacts on the German Wine Industry. Beverages 2022, 8, 75. [Google Scholar] [CrossRef]
  5. Müller, M.; Bellut, K.; Tippmann, J.; Becker, T. Physical Methods for Dealcoholization of Beverage Matrices and their Impact on Quality Attributes. ChemBioEng Rev. 2017, 4, 310–326. [Google Scholar] [CrossRef]
  6. Strejc, J.; Siristova, L.; Karabin, M.; Almeida e Silva, J.B.; Branyik, T. Production of alcohol-free beer with elevated amounts of flavouring compounds using lager yeast mutants. J. Inst. Brew. 2013, 119, 149–155. [Google Scholar] [CrossRef]
  7. Jackowski, M.; Trusek, A. Non-alcoholic beer production—An overview. Polish J. Chem. Technol. 2018, 20, 32–38. [Google Scholar] [CrossRef] [Green Version]
  8. Varela, J.; Varela, C. Microbiological strategies to produce beer and wine with reduced ethanol concentration. Curr. Opin. Biotechnol. 2019, 56, 88–96. [Google Scholar] [CrossRef] [PubMed]
  9. Güzel, N.; Güzel, M.; Savaş Bahçeci, K. Nonalcoholic Beer; Academic Press: London, UK, 2019; ISBN 9780128169384. [Google Scholar]
  10. Mallet, J. Malt A Practical Guide from Field to Brewhouse; Brewers Publications: Boulder, CO, USA, 2014; ISBN 978-1-938469-12-1. [Google Scholar]
  11. Briggs, D.E.; Boulton, C.; Brookes, P.A.; Stevens, R. Brewing: Science and Practice; Woodhead Publishing: Sawston, UK, 2004; pp. 1–881. [Google Scholar]
  12. Jackowski, M. Piwo bezalkoholowe-jakie to proste. Przem. Spożywczy 2021, 75, 45–47. [Google Scholar] [CrossRef]
  13. Ivanov, K.; Petelkov, I.; Shopska, V.; Denkova, R.; Gochev, V.; Kostov, G. Investigation of mashing regimes for low-alcohol beer production. J. Inst. Brew. 2016, 122, 508–516. [Google Scholar] [CrossRef] [Green Version]
  14. Ian, S. Hornsey Brewing, 2nd ed.; The Royal Society of Chemistry: Cambridge, UK, 2013; ISBN 978-1-84973-602-2. [Google Scholar]
  15. Pazera, T.; Rzemieniuk, T. Browarnictwo; Wydawnictwa Szkolne i Pedagogiczne: Warszawa, Poland, 1998. [Google Scholar]
  16. Catarino, M.; Mendes, A. Non-alcoholic beer—A new industrial process. Sep. Purif. Technol. 2011, 79, 342–351. [Google Scholar] [CrossRef]
  17. Mortazavian, A.M.; Razavi, S.H.; Mousavi, S.M.; Malganji, S.; Sohrabvandi, S. The effect of Saccharomyces strain and fermentation conditions on quality prameters of non-alcoholic beer. J. Paramed. Sci. 2014, 5, 21–26. [Google Scholar]
  18. De Francesco, G.; Sannino, C.; Sileoni, V.; Marconi, O.; Filippucci, S.; Tasselli, G.; Turchetti, B. Mrakia gelida in brewing process: An innovative production of low alcohol beer using a psychrophilic yeast strain. Food Microbiol. 2018, 76, 354–362. [Google Scholar] [CrossRef] [PubMed]
  19. Kunze, W. Technologia Piwa i Słodu; Piwochmiel: Warszawa, Poland, 1999; ISBN 8391084515. [Google Scholar]
  20. Liguori, L.; De Francesco, G.; Russo, P.; Perretti, G.; Albanese, D.; Di Matteo, M. Production and characterization of alcohol-free beer by membrane process. Food Bioprod. Process. 2015, 94, 158–168. [Google Scholar] [CrossRef]
  21. Catarino, M.; Mendes, A.; Madeira, L.M.; Ferreira, A. Alcohol removal from beer by reverse osmosis. Sep. Sci. Technol. 2007, 42, 3011–3027. [Google Scholar] [CrossRef]
  22. Krebs, G.; Müller, M.; Becker, T.; Gastl, M. Characterization of the macromolecular and sensory profile of non-alcoholic beers produced with various methods. Food Res. Int. 2019, 116, 508–517. [Google Scholar] [CrossRef] [PubMed]
  23. Esteves, M.; Barbosa, C.; Vasconcelos, I.; Tavares, M.J.; Mendes-faia, A.; Mira, N.P.; Mendes-ferreira, A. Characterizing the potential of the non-conventional yeast saccharomycodes ludwigii utad17 in winemaking. Microorganisms 2019, 7, 478. [Google Scholar] [CrossRef] [Green Version]
  24. De Francesco, G.; Turchetti, B.; Sileoni, V.; Marconi, O.; Perretti, G. Screening of new strains of Saccharomycodes ludwigii and Zygosaccharomyces rouxii to produce low-alcohol beer. J. Inst. Brew. 2015, 121, 113–121. [Google Scholar] [CrossRef]
  25. Silva-Sousa, F.; Fernandes, T.; Pereira, F.; Rodrigues, D.; Rito, T.; Camarasa, C.; Franco-Duarte, R.; Sousa, M.J. Torulaspora delbrueckii Phenotypic and Metabolic Profiling towards Its Biotechnological Exploitation. J. Fungi 2022, 8, 569. [Google Scholar] [CrossRef]
  26. van Breda, V.; Jolly, N.; van Wyk, J. Characterisation of commercial and natural Torulaspora delbrueckii wine yeast strains. Int. J. Food Microbiol. 2013, 163, 80–88. [Google Scholar] [CrossRef]
  27. Ramírez, M.; Velázquez, R. The yeast Torulaspora delbrueckii: An interesting but difficult-to-use tool for winemaking. Fermentation 2018, 4, 94. [Google Scholar] [CrossRef] [Green Version]
  28. Jacob, F. MEBAK Wort, Beer, Beer-Based Beverages; Weihenstephan: Freising, Germany, 2013; ISBN 978-3-9805814-7-9. [Google Scholar]
  29. Bonin, S. Technologia produkcji piwa i ocena jego jakości. In Wybrane Zagadnienia z Technologii Przemysłu Fermentacyjnego; Wydawnictwo SGGW: Warszawa, Poland, 2014; pp. 35–52. ISBN 978-83-7583-567-0. [Google Scholar]
  30. Babicz-Zielińska, E.; Agnieszka Rybowska, W.O. Sensoryczna Ocena Jakości Żywności, 2nd ed.; Akademia Morska w Gdyni: Gdynia, Poland, 2008; ISBN 978-83-7421-259-5. [Google Scholar]
  31. Navrátil, M.; Dömény, Z.; Šturdík, E.; Šmogrovičová, D.; Gemeiner, P. Production of non-alcoholic beer using free and immobilized cells of Saccharomyces cerevisiae deficient in the tricarboxylic acid cycle. Biotechnol. Appl. Biochem. 2002, 35, 133. [Google Scholar] [CrossRef] [PubMed]
  32. Vejarano, R. Saccharomycodes ludwigii, control and potential uses in winemaking processes. Fermentation 2018, 4, 71. [Google Scholar] [CrossRef] [Green Version]
  33. Adamenko, K.; Kawa-Rygielska, J.; Kucharska, A.Z. Characteristics of Cornelian cherry sour non-alcoholic beers brewed with the special yeast Saccharomycodes ludwigii. Food Chem. 2020, 312, 125968. [Google Scholar] [CrossRef]
  34. Jiang, Z.; Yang, B.; Liu, X.; Zhang, S.; Shan, J.; Liu, J.; Wang, X. A novel approach for the production of a non-alcohol beer (≤0.5% abv) by a combination of limited fermentation and vacuum distillation. J. Inst. Brew. 2017, 123, 533–536. [Google Scholar] [CrossRef] [Green Version]
  35. Fernandes, T.; Silva-Sousa, F.; Pereira, F.; Rito, T.; Soares, P.; Franco-Duarte, R.; Sousa, M.J. Biotechnological importance of torulaspora delbrueckii: From the obscurity to the spotlight. J. Fungi 2021, 7, 712. [Google Scholar] [CrossRef]
  36. Canonico, L.; Agarbati, A.; Comitini, F.; Ciani, M. Torulaspora delbrueckii in the brewing process: A new approach to enhance bioflavour and to reduce ethanol content. Food Microbiol. 2016, 56, 45–51. [Google Scholar] [CrossRef] [PubMed]
  37. Michel, M.; Kopecká, J.; Meier-Dörnberg, T.; Zarnkow, M.; Jacob, F.; Hutzler, M. Screening for new brewing yeasts in the non-Saccharomyces sector with Torulaspora delbrueckii as model. Yeast 2016, 33, 129–144. [Google Scholar] [CrossRef] [Green Version]
  38. White, C.; Zainasheff, J. Yeast The Practical Guide to Beer Fermentation; Brewers Publications: Boulder, CO, USA, 2010; ISBN 0-937-381-96-9. [Google Scholar]
  39. McGregor, C.; McGregor, N. The Beer Brewing Guide EBC Qualiy Handbook for Small Breweries, 1st ed.; Lannoo: Tielt, Belgium, 2021; ISBN 9789401479790. [Google Scholar]
  40. Hieronymus, S. For the Love of hops The Practical Guide to Aroma, Bitterness and the Culture of Hops; Brewers Association: Boulder, CO, USA, 2012; ISBN 1-938-469-01-1. [Google Scholar]
Figure 1. Brewing installation used for wort preparation.
Beverages 09 00066 g001
Figure 2. The true extract content of samples with the passage of days.
Beverages 09 00066 g002
Figure 3. The alcohol content of samples with the passage of days.
Beverages 09 00066 g003
Figure 4. Graph of pH change during the fermentation process.
Beverages 09 00066 g004
Figure 5. Graph showing comparison between the organoleptic properties of fully fermented beers.
Beverages 09 00066 g005
Figure 6. Graph showing comparison between the organoleptic properties of low-alcoholic beers produced using arrested fermentation.
Beverages 09 00066 g006
Table 1. Compounds used for the qualitative analysis of the beer samples.
CompoundRetention Time (min)
Ethyl acetate2.47
Methanol2.66
2-propanol3.08
Diacetyl3.54
Isobutyl acetate4.01
2-butanol4.67
1-propanol4.90
Isobutanol6.27
1-butanol7.56
2-methyl-1-butanol8.43
3-methyl-1-butanol8.50
Acetoin9.84
Ethyl lactate10.21
Acetic acid11.09
Phenylethyl alcohol15.34
Table 2. Average and final true extract content between days 3 and 11, where T-58 is the reference, SL-1 and SL-2 are repetitions of Saccharomycodes ludwigii, and TD-1 and TD-2 are repetitions of Torulaspora delbrueckii fermentation.
SampleT-58SL-1SL-2TD-1TD-2
Average [°Brix]6.2 ± 0.26.6 ± 0.46.8 ± 0.36.9 ± 0.16.7 ± 0.3
Final [°Brix]6.16.36.56.86.9
Table 3. Average pH of the environment after the third day of fermentation. The abbreviations are as follows: T-58 is the reference Saccharomyces cerevisiae strain, SL is Saccharomycodes ludwigii, and TD is Torulaspora delbrueckii. Numbers 1 and 2 describe repetitions of the experiment.
SampleT-58SL-1SL-2TD-1TD-2
pH4.22 ± 0.034.31 ± 0.104.04 ± 0.034.36 ± 0.144.28 ± 0.03
Table 4. Average values for beers at the end of fermentation and in arrested fermentation with the alcohol concentration in the range acceptable in EU countries. The abbreviations are as follows T-58 is reference Saccharomyces cerevisiae strain, SL is Saccharomycodes ludwigii and TD is Torulaspora delbrueckii.
Full FermentationArrested Fermentation
T-58SLTDT-58SLTD
pH4.24 ± 0.034.11 ± 0.124.26 ± 0.024.36 ± 0.034.84 ± 0.054.49 ± 0.07
Color [EBC]30 ± 133 ± 131 ± 130 ± 131 ± 130 ± 1
Bitterness [IBU]31 ± 135 ± 134 ± 131 ± 134 ± 134 ± 1
Density [g/cm]1.02401.02501.02661.03491.03141.0331
Ethanol [% vol.]2.95 ± 0.232.58 ± 0.462.51 ± 0.050.25 ± 0.050.23 ± 0.030.77 ± 0.08
True extract [°Brix]6.1 ± 0.16.3 ± 0.16.7 ± 0.18.8 ± 0.17.9 ± 0.18.3 ± 0.1
Degree of attenuation [%]34312751410
Number of peaks161714182016
Identified compoundsAcetoinDiacetyl and acetoinDiacetyl, acetic acid, ethyl lactate, and acetoinAcetic acid and ethyl acetateDiacetylDiacetyl and phenylethyl alcohol
Disclaimer/Publisher’s Note: The statements, opinions and data contained in all publications are solely those of the individual author(s) and contributor(s) and not of MDPI and/or the editor(s). MDPI and/or the editor(s) disclaim responsibility for any injury to people or property resulting from any ideas, methods, instructions or products referred to in the content.

