Article

Transcriptome-Wide Analysis Revealed the Potential of the High-Affinity Potassium Transporter (HKT) Gene Family in Rice Salinity Tolerance via Ion Homeostasis

1
Jiangsu Key Laboratory of Crop Genetics and Physiology/Jiangsu Key Laboratory of Crop Cultivation and Physiology/Jiangsu Co-Innovation Center for Modern Production Technology of Grain Crops/Research Institute of Rice Industrial Engineering Technology/Key Laboratory of Saline-alkali Soil Improvement and Utilization (Coastal Saline-Alkali Lands)/Ministry of Agriculture and Rural Affairs, Yangzhou University, Yangzhou 225009, China
2
Yibang Agriculture Technology Development Co., Ltd., Dongying 257000, China
*
Author to whom correspondence should be addressed.
Bioengineering 2022, 9(9), 410; https://doi.org/10.3390/bioengineering9090410
Submission received: 3 August 2022 / Accepted: 15 August 2022 / Published: 23 August 2022

Abstract

:
The high-affinity potassium transporter (HKT) genes are key ions transporters, regulating the plant response to salt stress via sodium (Na+) and potassium (K+) homeostasis. The main goal of this research was to find and understand the HKT genes in rice and their potential biological activities in response to brassinosteroids (BRs), jasmonic acid (JA), seawater, and NaCl stress. The in silico analyses of seven OsHKT genes involved their evolutionary tree, gene structures, conserved motifs, and chemical properties, highlighting the key aspects of OsHKT genes. The Gene Ontology (GO) analysis of HKT genes revealed their roles in growth and stress responses. Promoter analysis showed that the majority of the HKT genes participate in abiotic stress responses. Tissue-specific expression analysis showed higher transcriptional activity of OsHKT genes in roots and leaves. Under NaCl, BR, and JA application, OsHKT1 was expressed differentially in roots and shoots. Similarly, the induced expression pattern of OsHKT1 was recorded in the seawater resistant (SWR) cultivar. Additionally, the Na+ to K+ ratio under different concentrations of NaCl stress has been evaluated. Our data highlighted the important role of the OsHKT gene family in regulating the JA and BR mediated rice salinity tolerance and could be useful for rice future breeding programs.

Graphical Abstract

1. Introduction

Rice is a major agronomic crop, providing energy to nearly 2.7 billion people [1]. China is the leading rice producer, followed by India, Indonesia, Bangladesh, and Vietnam. Since it is grown in different agro-zones, variations in size, color, and gene pool are common [2]. However, the looming threat of climate change has hampered rice productivity greatly in the last decade. Among the various environmental stresses, salinity is the most important and concerning abiotic stress impacting the livelihoods of rice growers around the globe [3,4]. The International Oryza Map Alignment Project, a wild rice genomic resource, provided a cultivated rice (O. sativa) genomes (3K-RG) dataset aiming to catalog natural variations that exist in cultivated and wild rice. The information can be utilized to identify genes and genomic regions that can be used to drive the next generation of crops in the era of climate change [4,5].
About 45 million hectares of the total arable land have been affected by salinity stress (http://www.fao.org/soils-portal/en/) (accessed on 5 April 2022). Salinity damages the rice plant at the seedling and vegetative stages; and salt’s occurrence during the reproductive phase can significantly limit the rice yield [6]. Rice plants respond to salinity stress by adjusting the balance of Na+ ions in roots and shoots [7,8]. These sodium ions are regulated by an ion transporter family called the high-affinity HKT gene family [9]. Based on gene organization, protein structure, and ion specificity, HKT transporters are divided into two sub-types: sodium uniporters (type I) and sodium/potassium symporters (type II). The selectivity filter of type I and II HKTs differs significantly [10], providing ion specificity. The key differentiating feature of the HKT protein’s first pore domain (PD) is an amino acid [11]. The SF of type I members has a serine residue, whereas the remaining three amino acid residues are glycine (S–G–G–G motif). At all points in the SF, type II HKTs exhibit the G–G–G–G motif. However, this rule has exceptions, and extra residues are implicated in providing cation selectivity [12]. In Arabidopsis, there is just one gene, AtHKT1 [13]. Both dicot and monocot species have large numbers of HKT genes [14]. In both A. thaliana and cereal crops (particularly type I HKT1; 5 s), allelic variants related to amino acid changes and/or expression differences have been linked to conferring salt tolerance [15]. HKT1; 5 transports Na+ across the plasma membranes, decreasing xylem sap (loaded/transferred to neighboring parenchyma cells) and Na loading, and transporting Na+ to the shoot. Introduction of Triticum monococcum Nax2 (TmHKT1; 5-A) into salt-sensitive durum wheat (lacking HKT1; 5-A) reduces leaf Na salty soils and increases the grain yield [16]. In bread wheat, the KNA1 locus (which contains TaHKT1; 5-D) is linked to salinity tolerance, and RNAi silencing of TaHKT1; 5-D in transgenic bread wheat causes leaf Na+ accumulation [17]. Salinity tolerance is linked to allelic variation in OsHKT1; 5 at the Saltol locus in rice, and four amino acid variations in the OsHKT1; 5 sequences impart differential Na+ transport characteristics [18]. Variations in OsHKT1; 5 expression levels in rice landrace roots are also linked to salinity tolerance [19]. Two SNPs in the coding region ZmHKT1; 5 in maize are strongly linked to salt tolerance variants [9]. Natural variation in HvHKT1; 5 expression levels has recently been linked to salt exclusion from barley shoots. They researchers found that functionally compromised alleles of HvHKT1; 5 (owing to miss localization and/or altered Na+ transport activity) increase shoot and grain Na+ content. As a result, allelic variation in HKT1; 5 may influence shoot Na+ content, and as a result, plant fitness in salinity [20,21,22]. Rice crops’ evolutionary diversity allows them to adapt to harsh environmental conditions through specialized molecular mechanisms. However, the exact molecular mechanisms of those adaptations are poorly understood.
Herein, we identify the HKT gene family in Oryza sativa. Bioinformatic analysis, including of the phylogenetic tree, conserved motifs, gene structures, gene ontologies, cis-acting elements, and microarray expression, was performed. Their expression levels in different organs and tissue were also investigated. Expression analysis of the HKT gene family under jasmonic acid, brassinosteroids, seawater, and salinity stress was evaluated. The results might be helpful for understanding the role of HTK in plant development and elucidating its regulatory mechanisms that are involved in abiotic stress responses.

2. Materials and Methods

2.1. HKT Genes Family Identification

We used the hidden Markov model (HMM) to retrieve the protein sequences of HKT genes from Arabidopsis thaliana [23] and Triticum aestivum [24]. CD-search NCBI (http://www.ncbi.nlm.nih.gov/Structure/cdd/wrpsb.cgi) (accessed on 6 February 2022) was used to analyze the extracted Oryza sativa protein sequences.

2.2. Phylogenetic Tree and Digital Expression

The Mega (version 7.0) (Bellingham Research Institute, Bellingham, WA, USA) program created the maximum likelihood phylogenetic tree [25]. The gene expression levels were determined at various stages in all available tissues. The RNA-seq data were retrieved in transcripts per million (TPM) from the expVIP rice Expression Browser (http://www.rice-expression.com/) (accessed on 8 February 2022) [26,27]. The abiotic stress comprises salinity stress, whereas hormonal treatment comprised jasmonic acid (JA) and brassinosteroids (BRs) application. The ratios of the expression levels under different treatments compared to the control level were calculated to determine the regulation patterns of a given gene subjected to stress. Ratios greater than or less than 1.0 under a given treatment indicated that the stress treatment had altered gene expression. In contrast, a ratio of 1.0 showed that the treatment did not affect gene expression [27]. The heatmap was created using the Heml 1.0 software tool (http://hemi.biocuckoo.org/faq.php) (accessed on 8 February 2022) [28].

2.3. Chromosomal Locations and Protein–Protein Interactions of OsHKT Genes

The chromosomal locations of the OsHKT genes were determined using plants from the Ensemble Genomes (http://www.ensemblegenomes.org/pub/plants/release-31/fasta/oryzasatviam/) (accessed on 10 February 2022) [27]. The MAPD raw was also used to map the physical locations of OsHKT genes, and nomenclature was assigned according to the order in which they appeared on the chromosomes. Investigations into rice protein–protein interactions were conducted using the STRING online server (http://string.embl.de) (accessed on 10 February 2022) (version. 10) [28].

2.4. Gene Structure and Conserved Motif Analysis

For the Gene structure analysis, Gene Display (http://gsds.cbi.pku.edu.cn/) was utilized by using the genomic and CDS sequences of OsHKT genes [29]. The conserved motifs in the OsHKT proteins were discovered using the online server MEME 4.11.3 (http://meme-suite.org/tools/meme) (accessed on 10 February 2022) [30].

2.5. Gene Ontology and Cis-Elements Analysis of HKT Family Genes

A 1.5 Kb genomic DNA sequence upstream of each identified OsHKT gene’s start codon was obtained from the Ensemble Plants database (http://plants.ensemble.org/Oryzasativa) (accessed on 11 March 2022) [31]. The online Plant CARE (http://bioinformatics.psb.ugent.be/webtools/plantcare/html/) (accessed on 11 March 2022) database was used to identify cis-regulatory elements for all the OsHKT genes. Ontology analysis of the OsHKT protein sequences was performed using Blast2GO version 2.7.2 (http://www.blast2go.com) (accessed on 11 March 2022), and the groups of GO classification (molecular functions, biological process, and cellular components) were documented [28].

2.6. RNA Isolation and cDNA Synthesis

From the stress-exposed seedlings at selected time points, including 0 (control), the roots, leaves, and stems had their total RNA extracted using Trizol reagent (Invitrogen, Carlsbad, CA, USA). First, the DNA was removed using DNase I. The concentration and purity were measured with a NanoDrop 1000 spectrophotometer (Thermo Fisher Scientific, Rockford, IL, USA), and the integrity was checked using 1.5% agarose gel electrophoresis. Following the manufacturer’s instructions, 1 μg of total RNA was reverse-transcribed on a thermocycler programmed at 37 °C for 15 min using the PrimeScriptTM RT Master Mix (TaKaRa, Dalian, China) containing oligo dT primer [28].

2.7. Expression Profiling of HKT Genes in Oryza sativa

Two μL aliquots of cDNA were amplified by qPCR in 20 μL reaction volumes using the SYBR Premix Ex TaqTM II (TaKaRa, Dalian, China). The cDNAs were amplified at 95 °C for 2 min, followed by 35 cycles of 10 s at 95 °C, 30 s, and 72 °C for 30 s; and a final extension step of 72 °C for 10 min in a CFX96 real-time PCR system (Bio-Rad Co., Ltd., Hercules, CA, USA). mRNA amounts of all genes were separately quantified with the stable expression of the constitutive reference gene, actin. The specific primers are detailed in (Supplementary Materials, Table S1). After amplification, target gene cycle threshold (Ct) values were normalized to the reference gene by the 2−ΔΔCT method [32]. The data mean values of three biologically independent replicates were used for the final graphs, following the protocol of Ahmad et al. [28].

2.8. Na+, K+, and Their Ratio in Tolerant (3Y9H) and Sensitive (JLY252) Cultivars

2.8.1. Experimental Method

The experiment was conducted in 2021 at the hydroponic test base in the College of Agriculture, Yangzhou University. The hydroponic pond is 580 cm long, 142 cm wide, and 45 cm deep. Each board has 14 planting holes, each with an aperture of 4 cm and a hole spacing of 10 cm. The hole spacing between the two boards is 16 cm. Field seedlings were sown on May 16 and transplanted on June 16. When transplanting, select seedlings of the same size were transplanted: 2 plants per hole, and 5 holes for each variety. A total of 5 salt concentration treatments were set up for this test (0, 25, 50, 75, and 100 mM); this ratio is the quality ratio), and the salt used for testing was industrial salt. The whole nutrient solution of the hydroponic pool consisted of Epsino nutrient mixed with an Arnon traces nutrient solution. The whole nutrient solution was used during transplanting, 1/2 of the whole nutrient solution was used 20 d after transplanting, and 1/4 of the whole nutrient solution was used after ear extraction. A canopy at the top of the pool was fully enclosed to avoid the rain. We adjusted the pH value with dilute sulfuric acid daily to keep it at about 5.5. Pumps were used to oxygenate, to maintain the uninterrupted flow of the nutrient solution. Each hydroponic pool site’s nutrients, salt, and pH were maintained simultaneously, and disease and pest control were carried out at the appropriate times [33].

2.8.2. Measurements of Na+, K+ Ratio

Plant roots, leaves, and stems were selected for the experiment, and three replicates were picked of each treatment. The samples were dried at 85 °C in the oven for 48 h. Then, the dried samples were ground into a fine powder, and three replicates of 0.445 to 0.460 g were weighted from each sample. Then, the weighted dry powder was digested using the MARS-6 microwave digestion system (applied to each sample 5 mL HNO3, 3 mL double-distilled water, and two drops of H2O2) and prepared for the micro and macronutrient analysis following the methods described by [34,35]. Each sample was filtered with Whatman filter paper (0.45 µm) and then stored in 10 mL plastic tubes before we used it for further analysis. The digested filtrate was used to measure the total Na+, K+, and their ratio through inductively coupled plasma atomic emission-spectrometry (Model iCAP 6300, Thermo fisher scientific, ICP Spectrometer, Waltham, MA, USA).

2.9. Statistical Analysis

The data presented in this paper were analyzed using SPSS software (version 25.0, SPSS Inc., Chicago, IL, USA) for statistical analysis (ANOVA) and statistical significance, and we used the 95% confidence interval (p ≤ 0.05). The data are expressed in the form of mean ± standard deviation (SD) of three biologically independent replicates for all measured parameters; and finally, GraphPad Prism (version 8.0.2) (GraphPad Software, Inc., LA Jolla, CA, USA) was used for graphical representations.

3. Results

This in the current study, seven OsHKT genes from rice were retrieved using the Ensemble Plants database (http://plants.ensemble.org/Oryzasativa) (accessed on 20 April 2022) and were named according to their chromosomal positions, namely, OsHKT1, OsHKT3, OsHKT4, OsHKT6, OsHKT7, OsHKT8, and OsHKT9 (Table 1). Additionally, various other features of Oryza sativa OsHKT proteins were identified, such as chromosomal coordinates, molecular weights, chemical properties, and isoelectric points (PI), which are listed in Table 1.

3.1. Phylogenetic Analysis of OsHKT

We used the maximum likelihood method to construct a phylogenetic tree that included Oryza Sativa OsHKT, Triticum aestivum TaHKT, and Zea maize ZmHKT to investigate their phylogenetic relationship, and the final tree was programmed using Interactive Tree Of Life (iTOL) (version 5) (accessed on 25 April 2022) [36] (Figure 1). The results showed that 7 Oryza sativa OsHKT, 3 Zea maize ZmHKT, and 7 Triticum aestivum TraesHKT are clustered; and they were further divided into five groups, namely, group I, group II, group III, group IV, and group V. Furthermore, group IV is the largest group containing 2 OsHKT, (OsHKT4 and OsHKT6), 2 TraesHKT, and 1 AtHKT. Group V is the smallest group, containing 1 OsHKT (OsHKT1) and 1 TraesHKT. Group I contains 2 OsHKT, (OsHKT3 and OsHKT9), 1 ZmHKT, and 1 TraesHKT. Similarly, group III contains 1 OsHKT (OsHKT8), 1 ZmHKT, and 2 TraesHKT. Group II contains 1 OsHKT, (OsHKT7), 1 ZmHKT, and 1 TraesHKT. These results confirm that evolutionarily, Zea maize, Triticum aestivum, and O. sativa are closest.

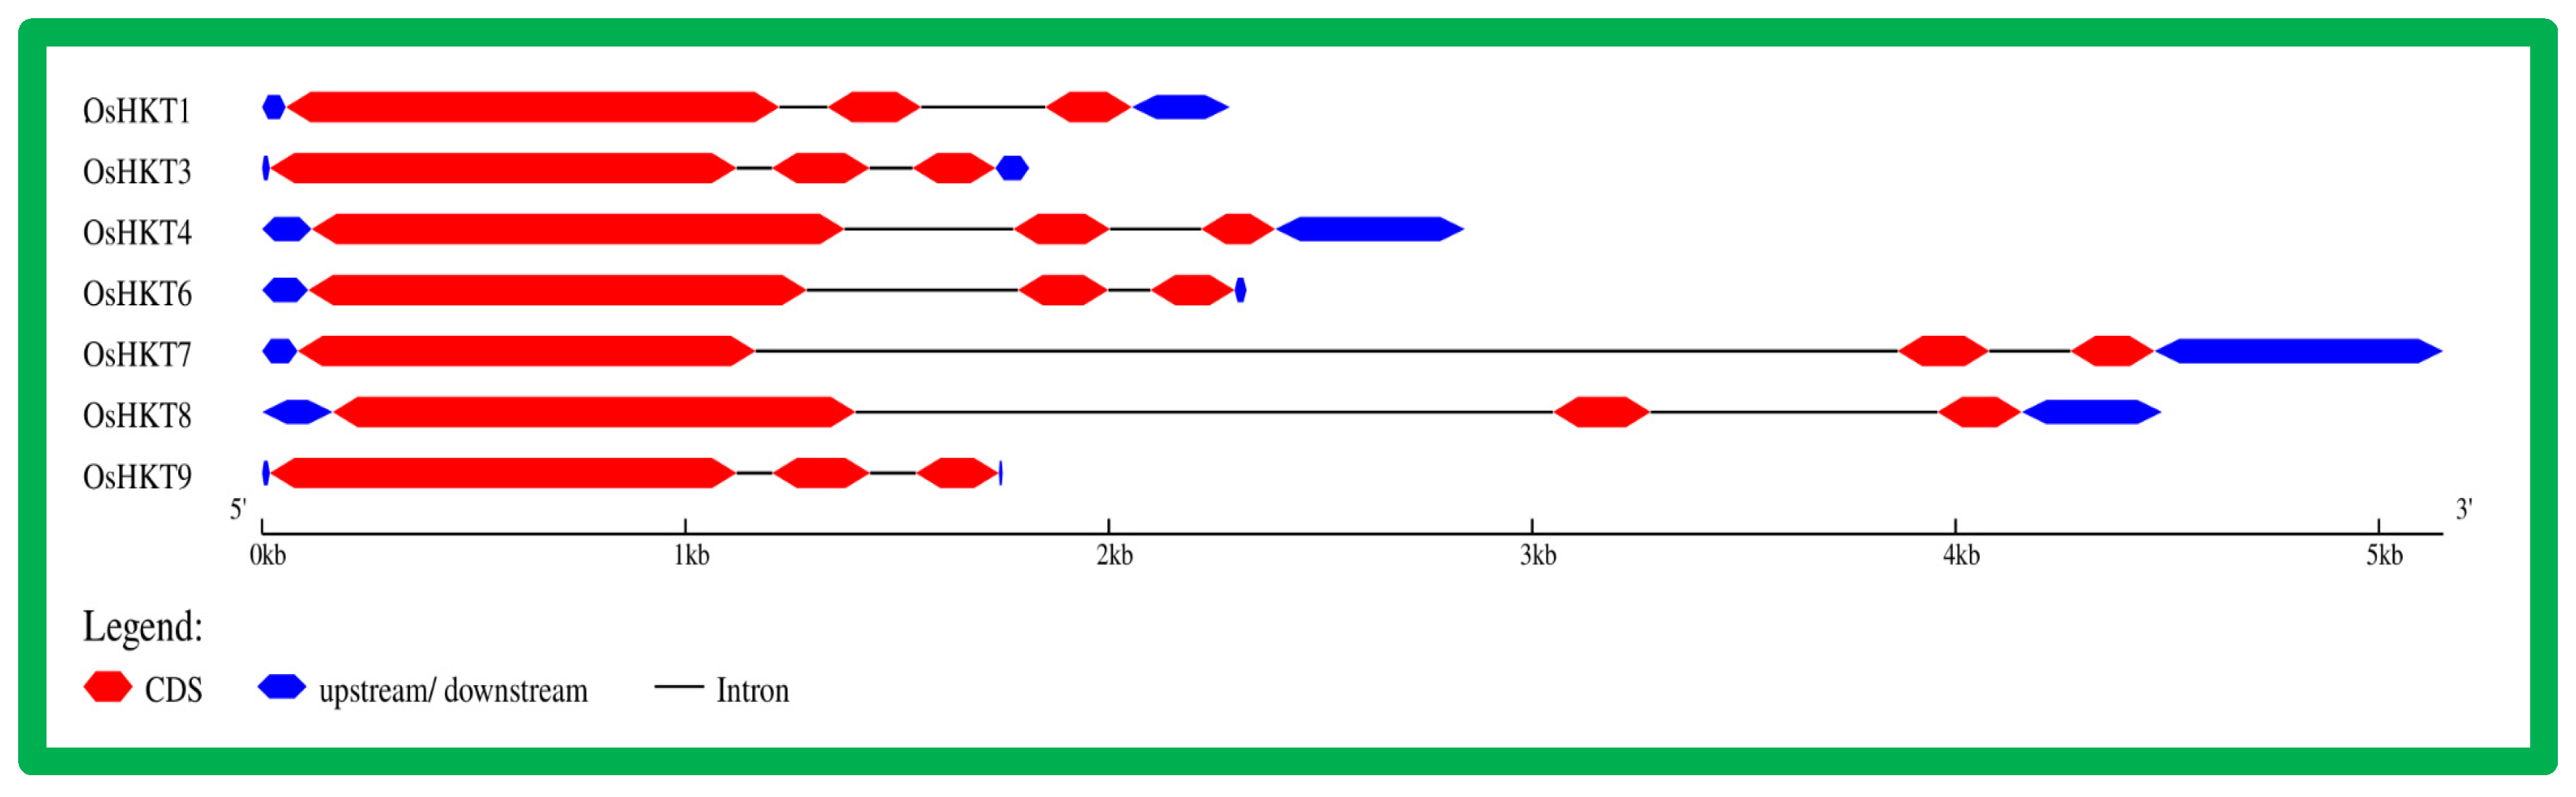
3.2. Gene Structure and Conserved Motif Analysis of OsHKT Genes

A total of five conserved motifs were discovered using the MEME online server (accessed on 5 May 2022), and they were found to be appropriate for explaining the HKTs structure (Figure 2). All seven OsHKT genes contained all six conserved motifs, motif 1 to motif 6. This result indicates that all motifs are conserved and might play important roles in regulating the expression of the HKT gene family. All HKTs contained five motifs, and the E-value was <b12 for all identified HKTs.
The genes OsHKT7 and OsHKT8 contain more introns as compared to other HKTs. In molecular biology, the intron distribution plays a significant role in the phylogenetic relationship among members of the gene family. Our results indicated that Oryza sativa is relatively complex, and each HKTs gene contains an intron. From the perspective of gene length, OsHKT 7 and OsHKT8 are longer than other genes (Figure 3).

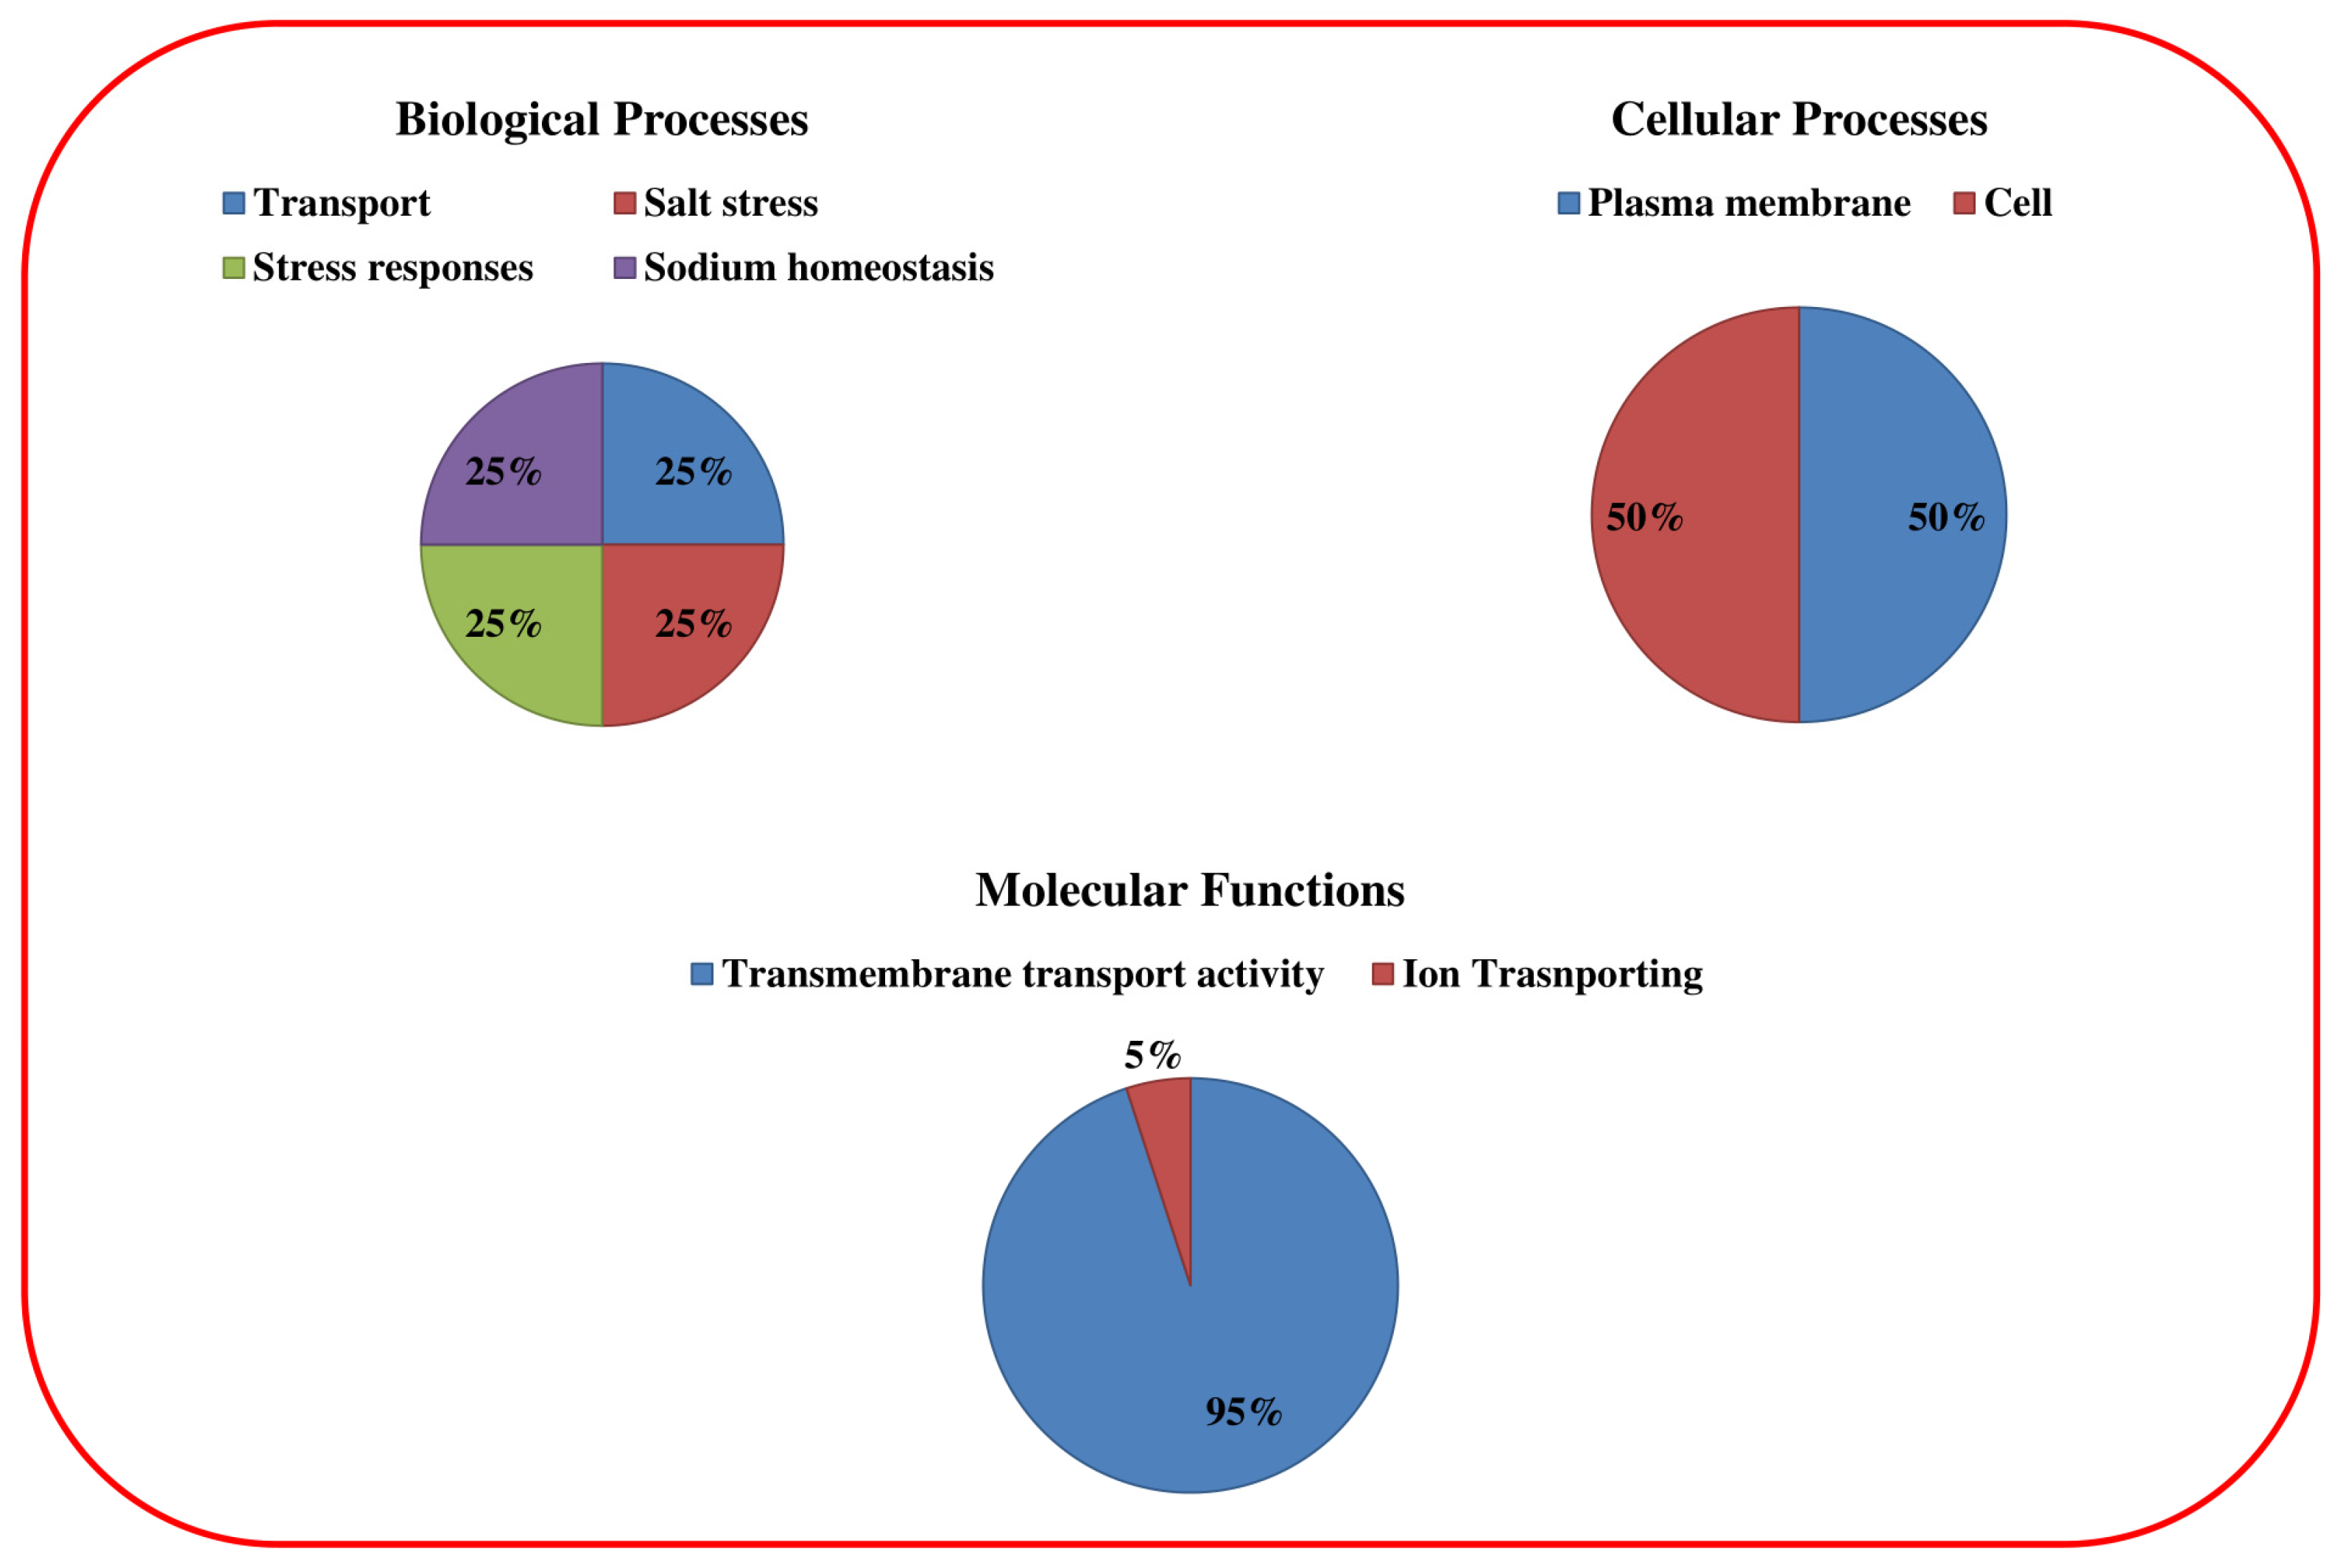
3.3. Gene Ontology of OsHKT Genes in Rice

Gene Ontology (GO) analysis was performed to explore the putative (biological, molecular, and cellular) functions of the OsHKT gene family (Figure 4). According to their molecular functions, HKT genes modulate the transmembrane and ion transport activity. Responses to salt stress and sodium homeostasis were revealed by the biological function category. Most of the OsHKT genes reside in the nucleus and plasma membrane, revealing their central roles in functional cellular activities.

3.4. Cis-Elements of OsHKT Genes in Rice

The 1.5 kb upstream regions of the OHKT genes were Blasted in the Plant CARE database to identify the cis-acting elements. Stress-responsive elements (MYC, MYB, and MBS) were recorded in abundance in OsHKT genes (Figure 5). The abscisic acid responsiveness elements (ABRE), gibberellin-responsive elements (TATC box), and MeJA responsive elements (CGTCA and TGACG) were richly represented. Additionally, the CAT box, MSA-like, Ry, and AT rich elements, which are mainly involved in growth-related activities, were identified. Based on these results, it can be assumed that OsHKT genes are not only involved in stress biology but also regulate plant growth by fine-tuning the hormonal accumulation.

3.5. Protein–Protein Interactions of OsHKT

The OsHKT protein prediction analysis showed an array of other proteins that have interactions with OsHKT1 (Figure 6 and Table 2). NHX2, which plays a vital role in the putative Na+/H+ antiporter, a sodium/hydrogen exchanger, showed interaction with our reference gene. Similarly, our gene interacted with NHX1, which plays a vital role in sodium/hydrogen exchange; it belongs to the monovalent cation: proton antiporter 1 (CPA1) transporter (TC 2.A.36) family. It also interacted with: P5CS1, which plays a vital role in delta-1-pyrroline-5-carboxylate synthase glutamate 5-kinase gamma-glutamyl phosphate reductase; P5CS which plays a key role in proline biosynthesis, leading to osmoregulation in plants; HAK1, which is potassium transporter 1 and high-affinity potassium transporter, and also transports rubidium with the same affinity. It transports cesium with a lower affinity and belongs to the HAK/KUP transporter (TC 2.A.72.3) family. Moreover, our reference gene OsHKT1 interacts with OsJ_04382, which is a putative BTB and TAZ domain protein, and TPKC, which is two-pore potassium channel c-containing protein. As an inward-rectifying potassium channel, it belongs to the two-pore domain potassium channel (TC 1.A.1.7) family. The OsJ_30786 Hsp20/alpha crystallin family protein belongs to the small heat shock protein (HSP20) family and also interacts with our reference gene OsHKT1.

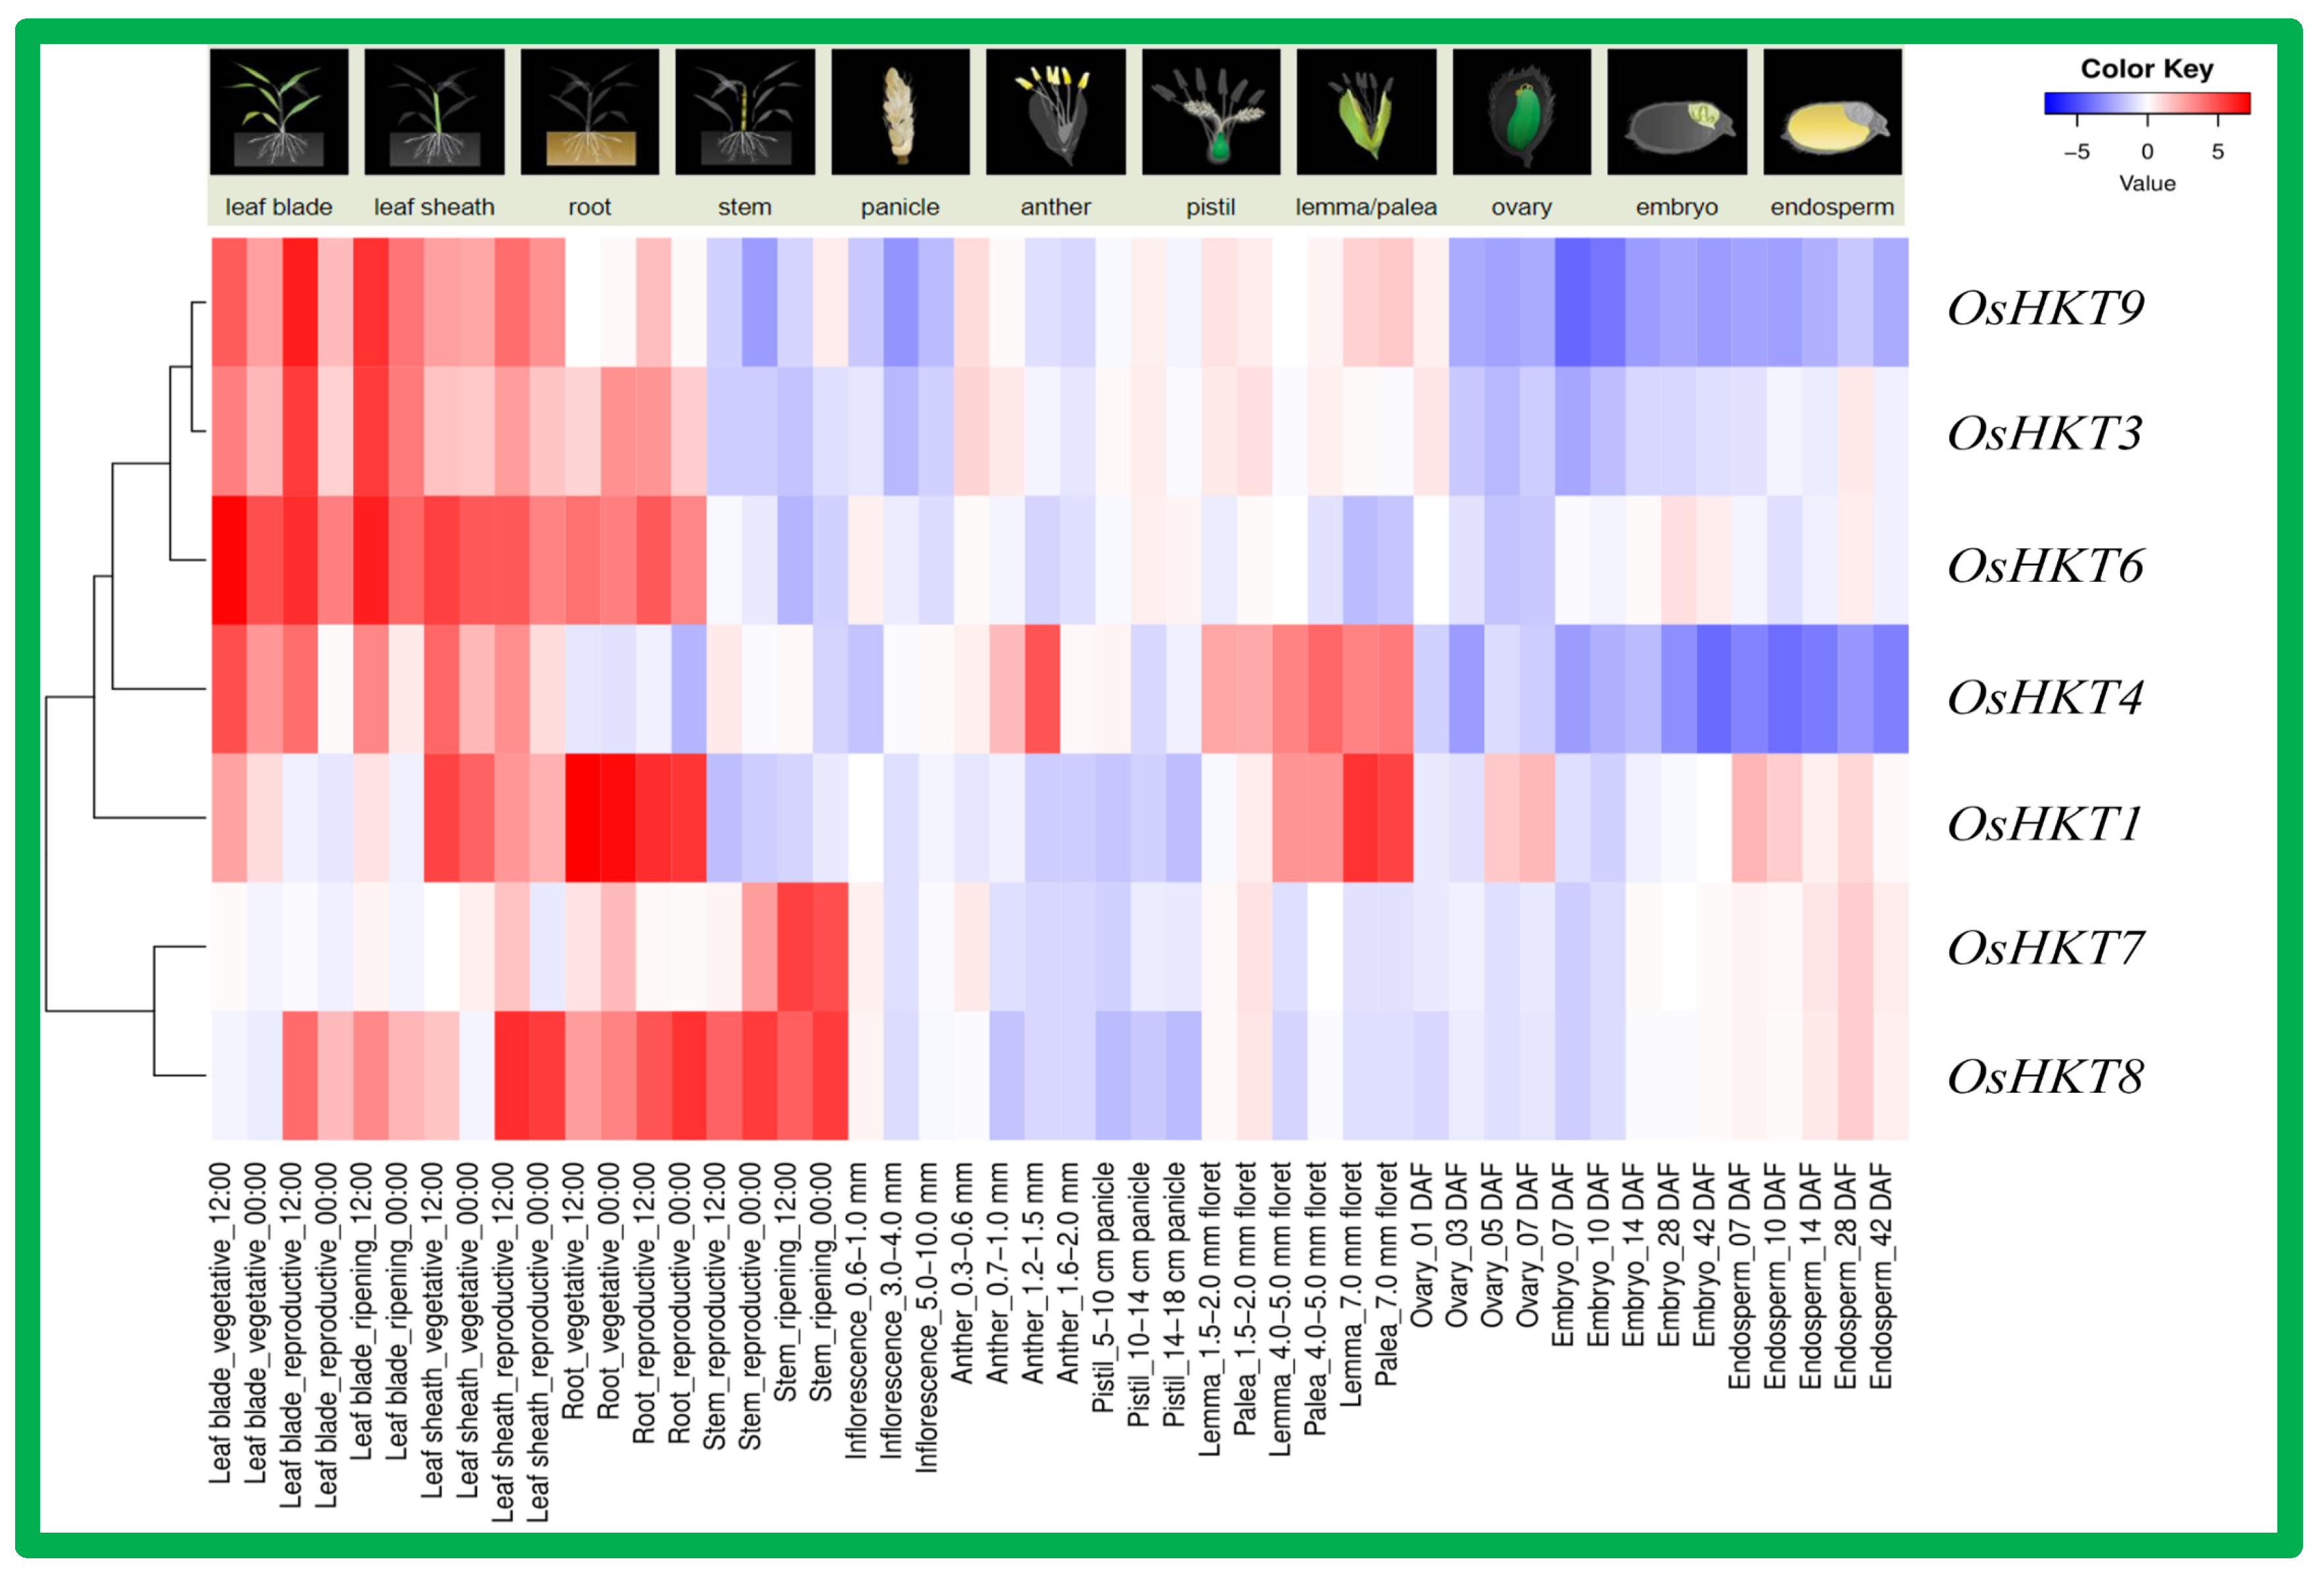
3.6. Tissue-Specific Expression Analysis of OsHKT Genes in Rice

Tissue-specific expression is important to understand the functional role of a particular gene family. We analyzed the expression of OsHKT genes in different rice tissues by using the RiceXPro expression database (version 3.0, National Institute of Agrobiological Sciences, Tsukuba, Ibaraki, Japan) (accessed on 28 May 2022) [37]. Gene expression patterns in different tissues of rice were drawn on a heatmap, as shown in Figure 7. OsHKT3, OsHKT6, and OsHKT9 showed dominant expression in roots, leaf sheaths, and leaf blades. OsHKT1 displayed higher transcriptional activity mainly in roots. The OsHKT4 gene was recorded in lamma/palea with higher mRNA accumulation in leaf sheaths, anther, and lamma/palea. The OsHKT7 exhibited dominant expression in the stem only, whereas OsHKT8 showed dominant expression in leaf sheaths, roots, and stem tissues.

3.7. Expression Analysis of OsHKT Genes in Rice Roots under Brassinosteroids Application

Brassinosteroids (BRs) are important hormones that regulate plant growth and development. Herein, we show the heatmap of the OsHKT gene expression pattern in response to the application of brassinosteroids (Figure 8). Among the OsHKTs, OsHKT3, OsHKT4, and OsHKT7 showed dominant expression under brassinosteroids application after 6 h of treatment. In comparison, OsHKT9 expression was lower under various durations brassinosteroid treatment. OsHKT1 showed lower expression in response to 30 min and 1 h treatments, but higher expression after 3 and 6 h treatments. OsHKT8 showed high expression initially, (0 min), and as the duration of treatment increased, the expression level also decreased, whereas OsHKT6 showed dominant expression consistently.

3.8. Expression Analysis of OsHKT Genes in Rice Root under Jasmonic Acid Application

Gene expression pattern in rice subjected to the jasmonic acid application was drawn on the heatmap shown in Figure 9. The results show that only OsHKT1 had high expression in response to jasmonic acid treatment after the 3 h duration, and after 6 h duration. OsHKT8 also displayed relatively high expression as compared to other genes. OsHKT3, OsHKT4, OsHKT6, OsHKT7, and OsHKT9 expression was relatively low as compared to OsHKT1 and OsHKT4.

3.9. Expression Analysis of OsHKT Genes in Rice Roots and Stems under Saline Conditions

Based on the bioinformatically predicted data, we further studied the response of OsHKT genes in rice roots and stems under saline conditions (Figure 10). OsHKT1 is down regulated, and no expression was recorded in NaCl roots, whereas control CK roots showed high expression. Similarly, in stems, OsHKT1 transcript level was low under NaCl treatment compared to CK stems. The OsHKT3 transcript level was lower in roots. High expression was recorded in the stems, and as compared to CK stems, the NaCl treatment showed a lower mRNA level. The OsHKT4 transcript showed normal expression in roots for both control and treatment, whereas in the stems, the expression level was higher under NaCl treatment as compared to control. The OsHKT6, OsHKT7, OsHKT8, and OsHKT9 transcript levels were also lower than in the control in both stems and roots.

3.10. Expression Analysis of OsHKT Genes in Salinity Resistant Cultivar Subjected to Seawater Stress

Based on the bioinformatically predicted data, we further studied the response of the OsHKT gene family in the salinity resistant cultivar subjected to seawater stress (Figure 11). The results showed that OsHKT1 was highly expressed in SWR-NaCl as compared to SWR-CK and CK control. The OsHKT3 and OsHKT4 transcript levels were low in SWR-NaCl and SWR-CK and high in the CK control cultivar. The OsHKT6 transcript level was higher in SWR-NaCl and CK cultivars as compared to SWR-CK cultivars under stress. The OsHKT7 and OsHKT8 transcripts showed higher expression levels in SWR-CK and SWR-NaCl cultivars compared to the CK control. The OsHKT9 transcript level was lower than in the control in both SWR-CK and SWR-NaCl cultivars.

3.11. Na+, K+ Ratio in Tolerant Cultivar 3Y9H

Based on our results and the functions of OsKHT genes, we further tested the 3Y9H cultivar under five salt concentration treatments (25, 50, 75, 100 mM). The tissues tested were the root, leaf, and stem tissues (Figure 12). The results indicate that K+ ratio was higher under control and 25 mM conditions, whereas suppression was observed at 50, 75, and 100 mM. In contrast, the ratio of Na+ increased under 50, 75, and 100 mM treatments of salt as compared to the control conditions. Similarly, in leaf tissues, the ratio of K+ was higher under control conditions as compared to 25, 50, 75, and 100 mM salt treatment. In contrast, the ratio of Na+ in leaves increased in 50, 75, and 100 mM treatments of salt as compared to control conditions. In stem tissues, the ratio of K+ was higher under control, 25, and 50 mM treatments; however, it declined under 75 and 100 mM treatments. In contrast, the ratio of Na+ in leaves increased in 50, 75, and 100 mM treated stem tissues as compared to control tissues.

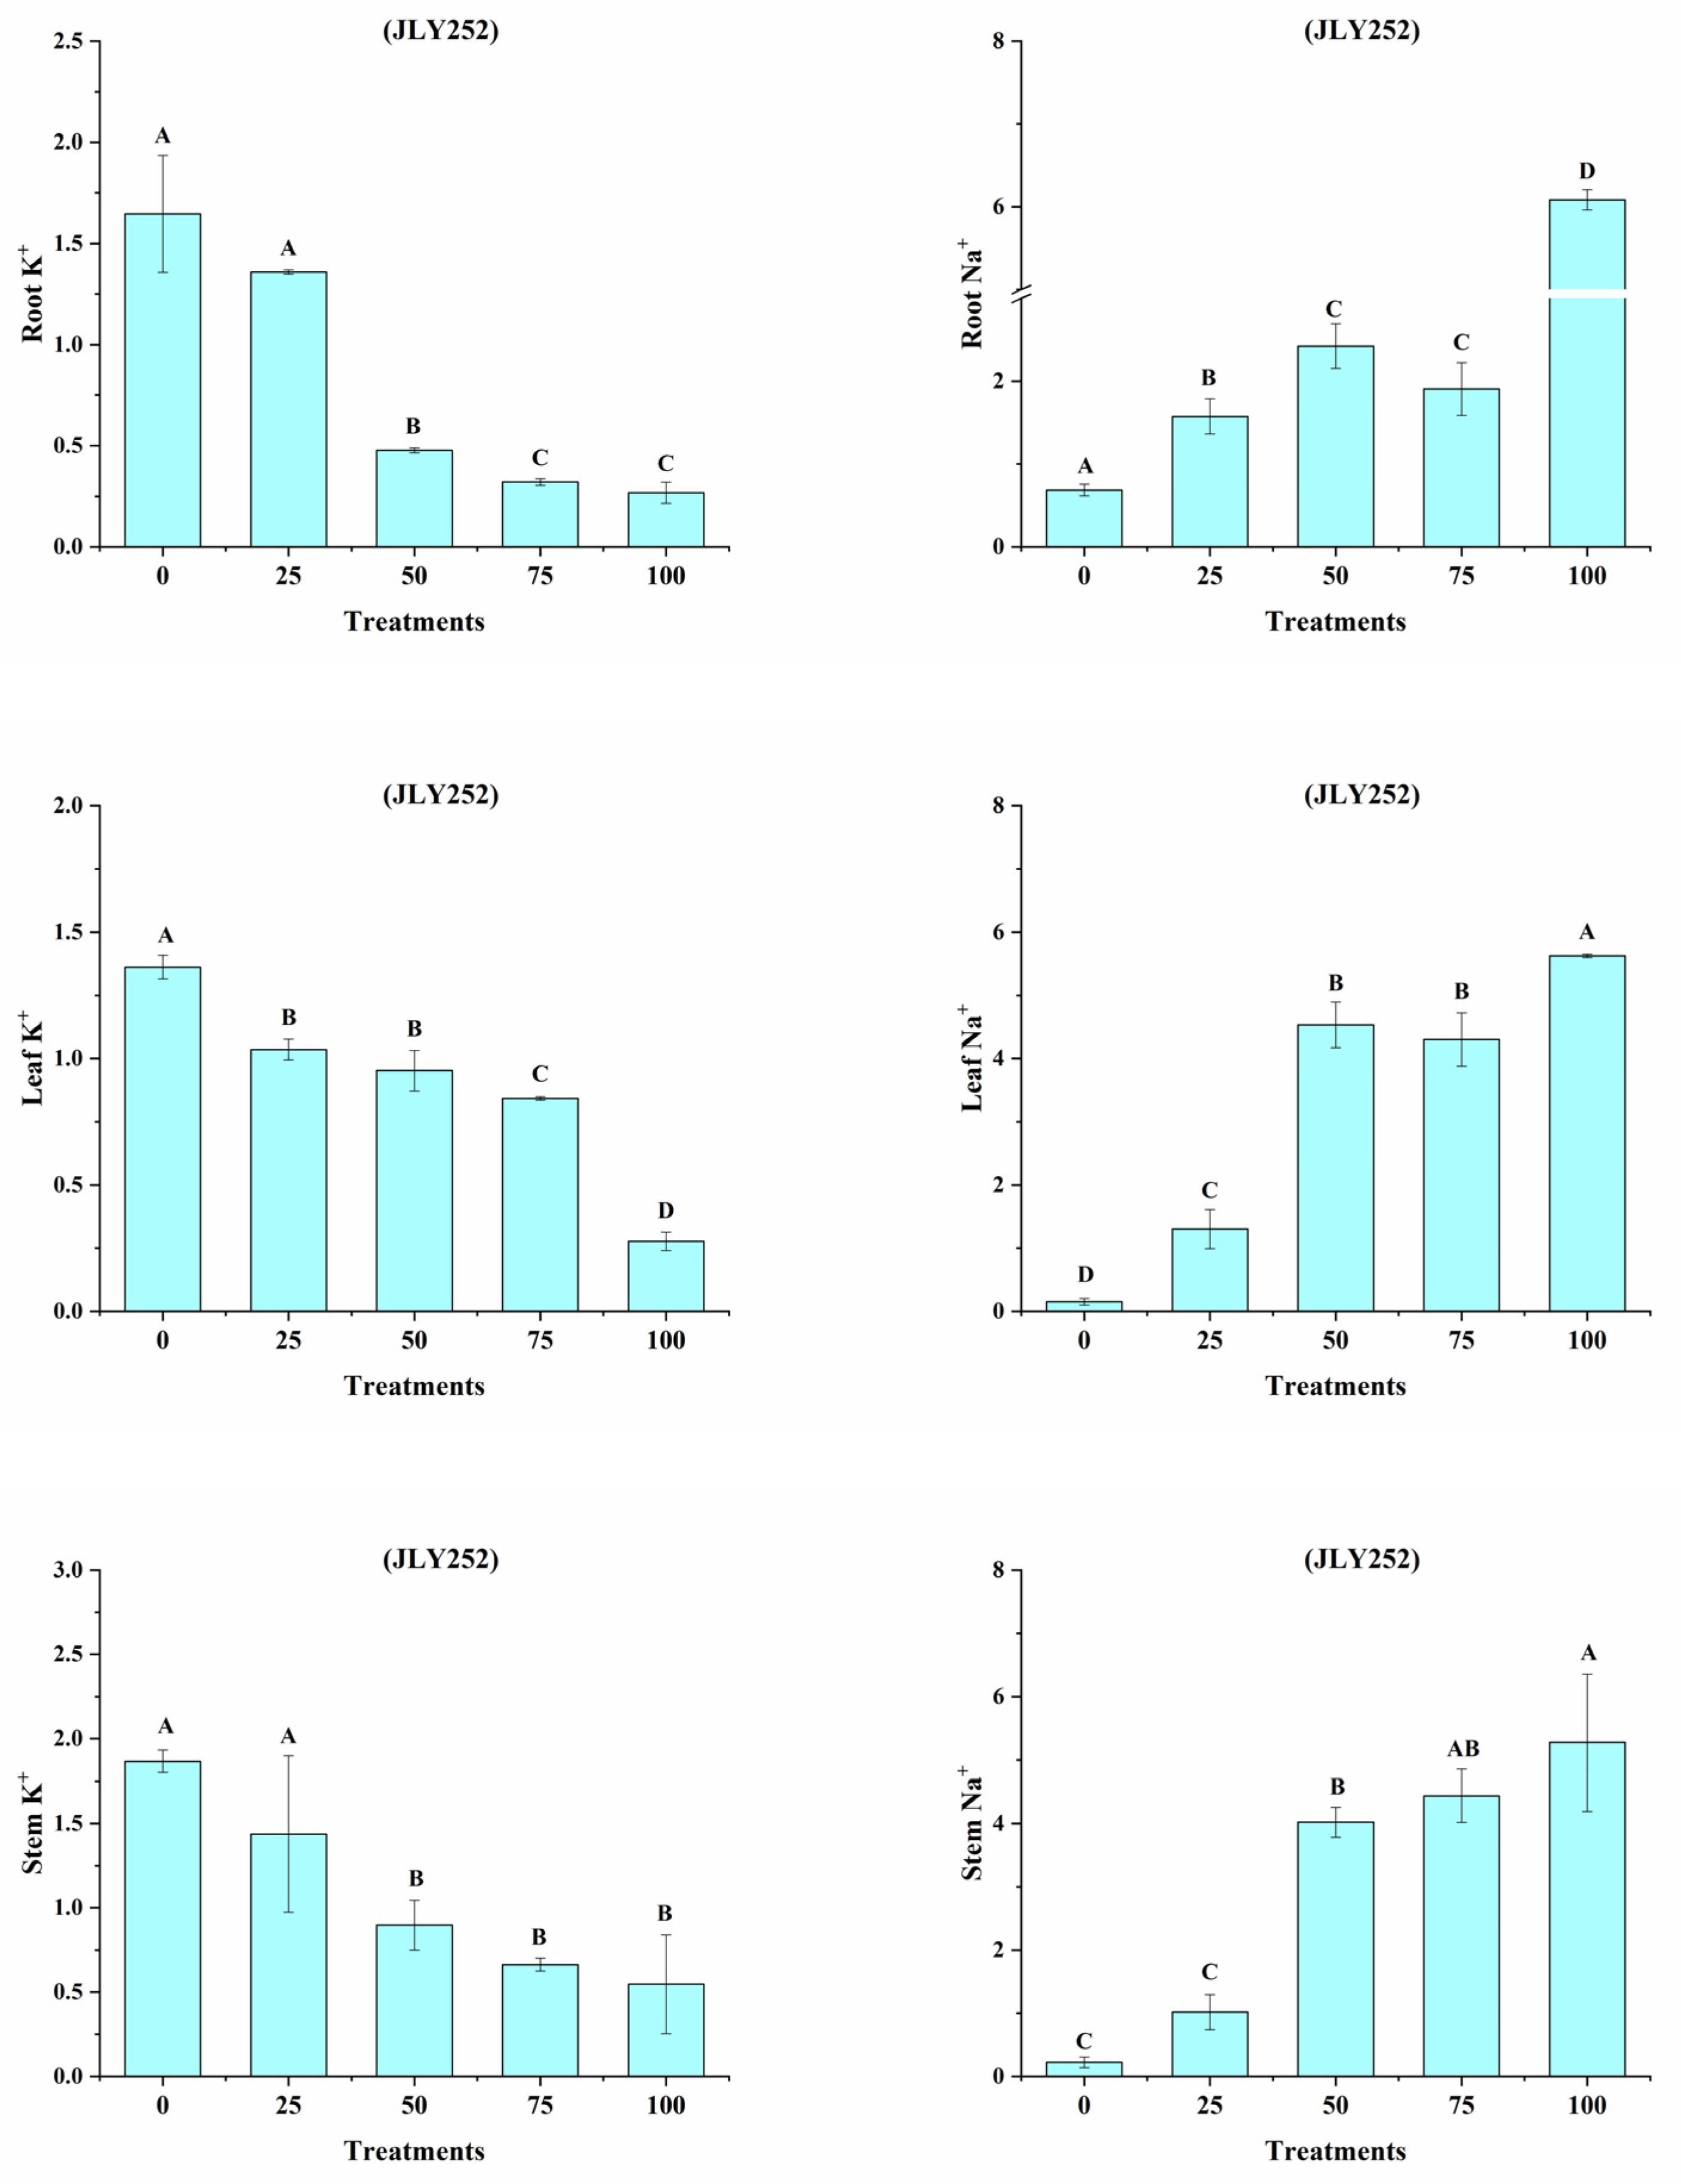
3.12. Na+, K+ Ratio in the Sensitive Cultivar (JLY252)

The JLY252 cultivar was subjected to five different salt concentrations (25, 50, 75, 100 mM). The tissues tested were the roots, leaves, and stems (Figure 13). The results indicated that the K+ ratio in root tissues was higher under control and 25 mM conditions, and lower under 50, 75, and 100 mM treatments with salt. In contrast, the ratio of Na+ in 50 and 100 mM salt treated tissues was higher as compared to 25, 75 mM, and control conditions. Similarly, in leaf tissues, the ratio of K+ was higher under control, 25, 50, and 75 mM treatments as compared to 100 mM salt treatment. In contrast, the ratio of Na+ in leaves increased under 50, 75, and 100 mM as compared to the control tissues. In stem tissues, the ratio of K+ was higher under control, 25 50, and 75 mM treatments, whereas a decreasing trend was recorded for 100 mM. In contrast, the ratio of Na+ in leaves increased under 50, 75, and 100 mM conditions as compared to the control.

4. Discussion

Most studies on the functional analysis of HKT genes have been carried out in model plants, mainly A. thaliana [38], and in crops such as wheat [16], barley [39], sorghum [40], and maize [41]. However, a comprehensive study of the rice HKT gene family was missing.

4.1. OsHKT Genes Are Distributed Widely in the Rice Genome

We identified eight HKT genes from the Oryza sativa genome database. The HKT genes’ classification in different species was confirmed by using the HMM and CD online servers. The absence of a single amino acid residue from the domain indicated the HKT genes as main transporters of ions [42]. Based on these results, it can be suggested that these HKT genes do not affect the plant’s resistance to salinity in a direct manner. These HKT genes could increase plant resistance to salt via balancing the ions’ accumulation in the roots and shoots.
The HKT genes in rice are divided in to five subgroups, as showed by the phylogenetic tree analysis (Figure 1). Further, shared homology between the HKT genes from each subgroup displays their evolutionarily unchanged cladding. Given the obtained results, the HKT genes could be highly conserved and may participate in several other functions (Figure 3). The division of each subfamily also highlighted the diverse functions of these myriad biomolecules in maintaining plant fitness against salinity stress [42,43]. Instead of the series of evolutionary events, the highly conserved grouping of HKT genes confirmed that they possess similar functions [44].
We noted that the intron–exon, motif distribution, and physiochemical properties of all HKT proteins were quite similar in each subfamily. For instance, we noted that HKT proteins with more than one intron are classified into subfamily V, and one or intron-less HKT proteins were divided into subfamilies I, II, and IV (Figure 2). Similarly, we also noted that a maximum number of HKT proteins that consisted of five or less motifs were found in subfamily V. The results further noted that the physicochemical properties of all HKT proteins were similar in each subfamily. These results suggest that HKT proteins shared a close evolutionary relationship during biological evolution in plants [45,46]. The intron–exon distribution revealed that most HKT genes possessed two exons and one intron (Figure 2), further confirming that the HKT genes may have close evolutionary relationships in plants [47]. Furthermore, the motif analysis also noted that all HKT proteins consisted of a total of five to seven motifs (Figure 3), indicating the strong evolutionary relationship of the HKT proteins [48,49]. In addition, the in silico analysis found that the HKT proteins interact with other proteins to regulate the development of different aspects of plant growth (Figure 6).

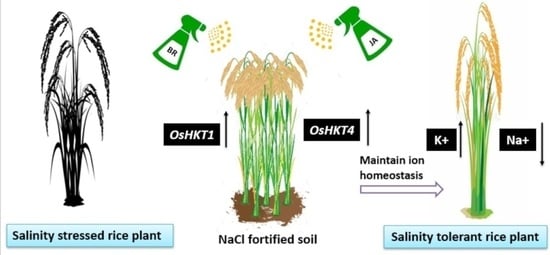
4.2. OsHKT Genes Control Plant Response to Salt Stress, Brassinosteroids, and JA Treatments

Studies have shown that OsHKT1 is mainly expressed in the shoots, and OsHKT1;5 is mostly expressed in roots [50]. Our results also confirmed that OsHKT4 and OsHKT9 are highly expressed in stem tissues under salt stress (Figure 11). Results have shown that OsHKT1 is mainly expressed in roots; in contrast, our results showed that OsHKT1 is mostly expressed in the stem. OsHKT3, OsHKT6, and OsHKT9 are mainly expressed in stem cells, and their expression significantly affects ABA induction. This result is in line with previous studies [50,51]. Studies have shown that HKT1; 5 can take much Na from xylem offloading into surrounding parenchyma cells, reducing xylem SAP. The Na+ content prevents transport to the aboveground part of the plant, indirectly raising the content of K+ aboveground [52]. OsHKT1, OsHKT6, and OsHKT8 are highly expressed in SWR-NaCl. The results confirmed that these genes play a significant role in salinity stress management.
Previous studies highlighted that HKT genes work in concert with other transcription factors. These transcription factors, including MYBc and BHLH, alter the transcriptional activity of HKT genes, and thus regulate the plant’s response to salinity stress [53,54,55,56]. For instance, the expression of OsHKT1 was decreased significantly in the OsMYBc antisense lines and in the process compromised the response of rice plants to salinity stress [57]. These multiple lines of evidence suggest the prominent role of OsHKT genes in rice tolerance to salinity stress by complex genetic and epigenetic machinery.
Excessive Na+ in plants could result in ion toxicity, which causes an imbalance in ion uptake and nutritional disorders and leads to growth inhibition and even plant death [58,59]. Maintaining K+ and Na+ ion homeostasis is important for a series of physiological and biochemical processes in plants, and for resistance to salinity [60]. In the present study, the concentration of Na+ ions was significantly lower in the tolerant line than that in the sensitive line in both leaves and roots. Furthermore, the concentration of K+ ions in the tolerant line was significantly higher than in the sensitive line. These results indicate that tolerant lines may have a more selective absorption and transportation capacity for K+ and Na+ and could maintain a higher concentration of K+ under saline conditions.

5. Conclusions

We conducted comprehensive bioinformatics and functional analysis of the OsHKT gene family in rice. The in silico analysis revealed the potential biological and molecular roles of the OsHKT genes in rice growth and stress biology. Expression analysis of OsHKT genes revealed their putative role in regulating the rice plant growth under normal and salinity stress conditions. Additionally, OsHKT genes showed sensitivity to different hormones, highlighting their importance in hormonal-mediated stress responses and growth regulation. The hydroponic experiment of the two cultivars clearly indicated that the 3Y9H cultivar performed well under the saline condition compared to the sensitive cultivar (JLY252). Higher Na+ and low K+ content in the sensitive and tolerant cultivars, respectively, further highlighted the potential of HKT transporters in rice’s tolerance against salinity.

Supplementary Materials

The following supporting information can be downloaded at: https://www.mdpi.com/article/10.3390/bioengineering9090410/s1, Table S1: Primers information of OsHKT genes for qRT-PCR expression analysis in rice.

Author Contributions

Q.D. and Y.C., supervision and funding acquisition. S.H., Q.D. and Y.C. conceived and designed the study. S.H. wrote the manuscript. S.H. and S.L. collected plant and soil samples. S.H. and R.Z., analyzed the soil properties and analyzed other samples. R.L., H.H. and Y.Z., resources S.H., writing—review and editing. All authors have read and agreed to the published version of the manuscript.

Funding

This work was funded by National Natural Science Foundation of China (32101817), Jiangsu Agriculture Science and Technology Innovation Fund (CX(21)3111), the Natural Science Foundation of the Jiangsu Higher Education Institutions (21KJD210001), the Postgraduate Research and Practice Innovation Program of Jiangsu Province (SJCX22_1781), and a Project Funded by the Priority Academic Program Development of Jiangsu Higher Education Institutions (PAPD).

Institutional Review Board Statement

Not applicable.

Informed Consent Statement

Not applicable.

Data Availability Statement

Data available on the request of the corresponding author.

Acknowledgments

This work was financially supported by National Natural Science Foundation of China (32101817), Jiangsu Agriculture Science and Technology Innovation Fund (CX(21)3111), the Natural Science Foundation of the Jiangsu Higher Education Institutions (21KJD210001), the Postgraduate Research and Practice Innovation Program of Jiangsu Province (SJCX22_1781), and the Project Funded by the Priority Academic Program Development of Jiangsu Higher Education Institutions (PAPD. We are thankful to Sheraz Ahmad (College of Horticulture and Plant Protection, Yangzhou University) for critically revising the manuscript.

Conflicts of Interest

The authors declare that they have no conflict of interest.

References

  1. Muthayya, S.; Sugimoto, J.D.; Montgomery, S.; Maberly, G.F. An overview of global rice production, supply, trade, and consumption. Ann. N. Y. Acad. Sci. 2014, 1324, 7–14. [Google Scholar] [CrossRef] [PubMed]
  2. Menguer, P.K.; Sperotto, R.A.; Ricachenevsky, F.K. A walk on the wild side: Oryza species as source for rice abiotic stress tolerance. Genet. Mol. Biol. 2017, 40, 238–252. [Google Scholar] [CrossRef] [PubMed] [Green Version]
  3. Chang, L.; Hu, M.; Ning, J.; He, W.; Gao, J.; Ndjiondjop, M.-N.; Fu, Y.; Liu, F.; Sun, H.; Gu, P.; et al. The genetic control of glabrous glume during African rice domestication. J. Genet. Genom. 2022, 49, 427–436. [Google Scholar] [CrossRef] [PubMed]
  4. Wang, W.; Mauleon, R.; Hu, Z.; Chebotarov, D.; Tai, S.; Wu, Z.; Li, M.; Zheng, T.; Fuentes, R.R.; Zhang, F.; et al. Genomic variation in 3010 diverse accessions of Asian cultivated rice. Nature 2018, 557, 43–49. [Google Scholar] [CrossRef]
  5. Ammiraju, J.S.; Luo, M.; Goicoechea, J.L.; Wang, W.; Kudrna, D.; Mueller, C.; Talag, J.; Kim, H.; Sisneros, N.B.; Blackmon, B.; et al. The Oryza bacterial artificial chromosome library resource: Construction and analysis of 12 deep-coverage large-insert BAC libraries that represent the 10 genome types of the genus Oryza. Genome Res. 2006, 16, 140–147. [Google Scholar] [CrossRef] [Green Version]
  6. Moradi, F.; Ismail, A.; Egdane, J.; Gregorio, G. Salinity tolerance of rice during reproductive development and association with tolerance at the seedling stage. Indian J. Plant Physiol. 2003, 8, 105–116. [Google Scholar]
  7. Hoang, T.M.L.; Tran, T.N.; Nguyen, T.K.T.; Williams, B.; Wurm, P.; Bellairs, S.; Mundree, S. Improvement of salinity stress tolerance in rice: Challenges and opportunities. Agronomy 2016, 6, 54. [Google Scholar] [CrossRef]
  8. Kumar, V.; Singh, A.; Mithra, S.A.; Krishnamurthy, S.; Parida, S.K.; Jain, S.; Tiwari, K.K.; Kumar, P.; Rao, A.R.; Sharma, S.K.; et al. Genome-wide association mapping of salinity tolerance in rice (Oryza sativa). DNA Res. 2015, 22, 133–145. [Google Scholar] [CrossRef] [Green Version]
  9. Jiang, Z.; Song, G.; Shan, X.; Wei, Z.; Liu, Y.; Jiang, C.; Jiang, Y.; Jin, F.; Li, Y. Association analysis and identification of ZmHKT1; 5 variation with salt-stress tolerance. Front. Plant Sci. 2018, 9, 1485. [Google Scholar] [CrossRef]
  10. Gadisa, N.; Wakgari, T. Nitrogen Uptake and Use Efficiency of Wheat (Triticum aestivum L.) Varieties as Influenced by Combined Application of Vermicompost and Nitrogen Fertilizer Rate. Am. J. Biosci. Bioeng. 2021, 9, 169–178. [Google Scholar] [CrossRef]
  11. Platten, J.D.; Egdane, J.A.; Ismail, A.M. Salinity tolerance, Na+ exclusion and allele mining of HKT1; 5 in Oryza sativa and O. glaberrima: Many sources, many genes, one mechanism? BMC Plant Biol. 2013, 13, 32. [Google Scholar] [CrossRef] [PubMed] [Green Version]
  12. Ali, A.; Raddatz, N.; Aman, R.; Kim, S.; Park, H.C.; Jan, M.; Baek, D.; Khan, I.U.; Oh, D.-H.; Lee, S.Y.; et al. A single amino-acid substitution in the sodium transporter HKT1 associated with plant salt tolerance. Plant Physiol. 2016, 171, 2112–2126. [Google Scholar] [CrossRef] [PubMed] [Green Version]
  13. An, D.; Chen, J.-G.; Gao, Y.-Q.; Li, X.; Chao, Z.-F.; Chen, Z.-R.; Li, Q.-Q.; Han, M.-L.; Wang, Y.-L.; Wang, Y.-F.; et al. AtHKT1 drives adaptation of Arabidopsis thaliana to salinity by reducing floral sodium content. PLoS Genet. 2017, 13, e1007086. [Google Scholar] [CrossRef] [PubMed] [Green Version]
  14. Almeida, P.M.; de Boer, G.-J.; de Boer, A.H. Assessment of natural variation in the first pore domain of the tomato HKT1; 2 transporter and characterization of mutated versions of SlHKT1; 2 expressed in Xenopus laevis oocytes and via complementation of the salt sensitive athkt1; 1 mutant. Front. Plant Sci. 2014, 5, 600. [Google Scholar] [CrossRef] [Green Version]
  15. Busoms, S.; Paajanen, P.; Marburger, S.; Bray, S.; Huang, X.-Y.; Poschenrieder, C.; Yant, L.; Salt, D.E. Fluctuating selection on migrant adaptive sodium transporter alleles in coastal Arabidopsis thaliana. Proc. Natl. Acad. Sci. USA 2018, 115, E12443–E12452. [Google Scholar] [CrossRef] [Green Version]
  16. Munns, R.; James, R.A.; Xu, B.; Athman, A.; Conn, S.J.; Jordans, C.; Byrt, C.S.; Hare, R.A.; Tyerman, S.D.; Tester, M.; et al. Wheat grain yield on saline soils is improved by an ancestral Na+ transporter gene. Nat. Biotechnol. 2012, 30, 360–364. [Google Scholar] [CrossRef]
  17. Byrt, C.S.; Xu, B.; Krishnan, M.; Lightfoot, D.J.; Athman, A.; Jacobs, A.K.; Watson-Haigh, N.S.; Plett, D.; Munns, R.; Tester, M.; et al. The Na+ transporter, Ta hkt 1; 5-d, limits shoot Na+ accumulation in bread wheat. Plant J. 2014, 80, 516–526. [Google Scholar] [CrossRef] [Green Version]
  18. Thomson, M.J.; de Ocampo, M.; Egdane, J.; Rahman, M.A.; Sajise, A.G.; Adorada, D.L.; Tumimbang-Raiz, E.; Blumwald, E.; Seraj, Z.I.; Singh, R.K.; et al. Characterizing the Saltol quantitative trait locus for salinity tolerance in rice. Rice 2010, 3, 148–160. [Google Scholar] [CrossRef] [Green Version]
  19. Cotsaftis, O.; Plett, D.; Shirley, N.; Tester, M.; Hrmova, M. A two-staged model of Na+ exclusion in rice explained by 3D modeling of HKT transporters and alternative splicing. PLoS ONE 2012, 7, e39865. [Google Scholar]
  20. van Bezouw, R.F.; Janssen, E.M.; Ashrafuzzaman, M.; Ghahramanzadeh, R.; Kilian, B.; Graner, A.; Visser, R.G.; van der Linden, C.G. Shoot sodium exclusion in salt stressed barley (Hordeum vulgare L.) is determined by allele specific increased expression of HKT1; 5. J. Plant Physiol. 2019, 241, 153029. [Google Scholar] [CrossRef]
  21. Pulipati, S.; Somasundaram, S.; Rana, N.; Kumaresan, K.; Shafi, M.; Civáň, P.; Sellamuthu, G.; Jaganathan, D.; Ramaravi, P.V.; Punitha, S.; et al. Diversity of Sodium Transporter HKT1; 5 in Genus Oryza. Rice Sci. 2022, 29, 31–46. [Google Scholar] [CrossRef]
  22. Houston, R.D.; Bean, T.P.; Macqueen, D.J.; Gundappa, M.K.; Jin, Y.H.; Jenkins, T.L.; Selly, S.L.C.; Martin, S.A.; Stevens, J.R.; Santos, E.M.; et al. Harnessing genomics to fast-track genetic improvement in aquaculture. Nat. Rev. Genet. 2020, 21, 389–409. [Google Scholar] [CrossRef] [PubMed]
  23. Lamesch, P.; Berardini, T.Z.; Li, D.; Swarbreck, D.; Wilks, C.; Sasidharan, R.; Muller, R.; Dreher, K.; Alexander, D.L.; Garcia-Hernandez, M.; et al. The Arabidopsis Information Resource (TAIR): Improved gene annotation and new tools. Nucleic Acids Res. 2012, 40, D1202–D1210. [Google Scholar] [CrossRef] [PubMed]
  24. Lukaszewski, A.J.; Alberti, A.; Sharpe, A.; Kilian, A.; Stanca, A.M.; Keller, B.; Clavijo, B.J.; Friebe, B.; Gill, B.; Wulff, B.; et al. A chromosome-based draft sequence of the hexaploid bread wheat (Triticum aestivum L.) genome. Science 2014, 345, 1251788. [Google Scholar]
  25. Kumar, S.; Stecher, G.; Tamura, K. MEGA7: Molecular evolutionary genetics analysis version 7.0 for bigger datasets. Mol. Biol. Evol. 2016, 33, 1870–1874. [Google Scholar] [CrossRef] [PubMed] [Green Version]
  26. Borrill, P.; Ramirez-Gonzalez, R.; Uauy, C. expVIP: A customizable RNA-seq data analysis and visualization platform. Plant Physiol. 2016, 170, 2172–2186. [Google Scholar] [CrossRef] [PubMed] [Green Version]
  27. Ma, J.; Yang, Y.; Luo, W.; Yang, C.; Ding, P.; Liu, Y.; Qiao, L.; Chang, Z.; Geng, H.; Wang, P.; et al. Genome-wide identification and analysis of the MADS-box gene family in bread wheat (Triticum aestivum L.). PLoS ONE 2017, 12, e0181443. [Google Scholar] [CrossRef] [Green Version]
  28. Ahmad, S.; Zhu, H.; Chen, Y.; Xi, C.; Shah, A.Z.; Ge, L. Comprehensive Bioinformatics and Expression Analysis of the TLP Gene Family Revealed Its Role in Regulating the Response of Oryza sativa to Nilaparvata lugens, Laodelphax striatellus, and Jinggangmycin. Agronomy 2022, 12, 1297. [Google Scholar] [CrossRef]
  29. Guo, A.-Y.; Zhu, Q.-H.; Chen, X.; Luo, J.-C. GSDS: A gene structure display server. Hereditas 2007, 29, 1023–1026. [Google Scholar] [CrossRef]
  30. Bailey, T.L.; Boden, M.; Buske, F.A.; Frith, M.; Grant, C.E.; Clementi, L.; Ren, J.; Li, W.W.; Noble, W.S. MEME SUITE: Tools for motif discovery and searching. Nucleic Acids Res. 2009, 37, W202–W208. [Google Scholar] [CrossRef]
  31. Somasundaram, S.; Véry, A.-A.; Vinekar, R.S.; Ishikawa, T.; Kumari, K.; Pulipati, S.; Kumaresan, K.; Corratgé-Faillie, C.; Sowdhamini, R.; Parida, A.; et al. Homology modeling identifies crucial amino-acid residues that confer higher Na+ transport capacity of OcHKT1; 5 from Oryza coarctata Roxb. Plant Cell Physiol. 2020, 61, 1321–1334. [Google Scholar] [CrossRef] [PubMed]
  32. Livak, K.J.; Schmittgen, T.D. Analysis of relative gene expression data using real-time quantitative PCR and the 2−ΔΔCT method. Methods 2001, 25, 402–408. [Google Scholar] [CrossRef] [PubMed]
  33. Chen, Z.; Cao, X.-L.; Niu, J.-P. Effects of exogenous ascorbic acid on seed germination and seedling salt-tolerance of alfalfa. PLoS ONE 2021, 16, e0250926. [Google Scholar] [CrossRef] [PubMed]
  34. Bartha, C.; Fodorpataki, L.; Martinez-Ballesta, M.d.C.; Popescu, O.; Carvajal, M. Sodium accumulation contributes to salt stress tolerance in lettuce cultivars. J. Appl. Bot. Food Qual. 2015, 88, 42–48. [Google Scholar]
  35. Khan, N.; Choi, J.Y.; Nho, E.Y.; Jamila, N.; Habte, G.; Hong, J.H.; Hwang, I.M.; Kim, K.S. Determination of minor and trace elements in aromatic spices by micro-wave assisted digestion and inductively coupled plasma-mass spectrometry. Food Chem. 2014, 158, 200–206. [Google Scholar] [CrossRef]
  36. Letunic, I.; Bork, P. Interactive Tree Of Life (iTOL) v5: An online tool for phylogenetic tree display and annotation. Nucleic Acids Res. 2021, 49, W293–W296. [Google Scholar] [CrossRef]
  37. Sato, Y.; Takehisa, H.; Kamatsuki, K.; Minami, H.; Namiki, N.; Ikawa, H.; Ohyanagi, H.; Sugimoto, K.; Antonio, B.A.; Nagamura, Y. RiceXPro version 3.0: Expanding the informatics resource for rice transcriptome. Nucleic Acids Res. 2013, 41, D1206–D1213. [Google Scholar] [CrossRef] [Green Version]
  38. Rus, A.; Yokoi, S.; Sharkhuu, A.; Reddy, M.; Lee, B.-H.; Matsumoto, T.K.; Koiwa, H.; Zhu, J.-K.; Bressan, R.A.; Hasegawa, P.M. AtHKT1 is a salt tolerance determinant that controls Na+ entry into plant roots. Proc. Natl. Acad. Sci. USA 2001, 98, 14150–14155. [Google Scholar] [CrossRef] [Green Version]
  39. Wang, T.-B.; Gassmann, W.; Rubio, F.; Schroeder, J.I.; Glass, A.D. Rapid up-regulation of HKT1, a high-affinity potassium transporter gene, in roots of barley and wheat following withdrawal of potassium. Plant Physiol. 1998, 118, 651–659. [Google Scholar] [CrossRef] [Green Version]
  40. Wang, M.; Vannozzi, A.; Wang, G.; Liang, Y.-H.; Tornielli, G.B.; Zenoni, S.; Cavallini, E.; Pezzotti, M.; Cheng, Z.-M. Genome and transcriptome analysis of the grapevine (Vitis vinifera L.) WRKY gene family. Hortic. Res. 2014, 1, 14016. [Google Scholar] [CrossRef] [Green Version]
  41. Ren, Z.; Liu, Y.; Kang, D.; Fan, K.; Wang, C.; Wang, G.; Liu, Y. Two alternative splicing variants of maize HKT1; 1 confer salt tolerance in transgenic tobacco plants. Plant Cell Tissue Organ Cult. (PCTOC) 2015, 123, 569–578. [Google Scholar] [CrossRef]
  42. Chen, W.; Provart, N.J.; Glazebrook, J.; Katagiri, F.; Chang, H.-S.; Eulgem, T.; Mauch, F.; Luan, S.; Zou, G.; Whitham, S.A.; et al. Expression profile matrix of Arabidopsis transcription factor genes suggests their putative functions in response to environmental stresses. Plant Cell 2002, 14, 559–574. [Google Scholar] [CrossRef] [PubMed]
  43. Li, H.; Xu, G.; Yang, C.; Yang, L.; Liang, Z. Genome-wide identification and expression analysis of HKT transcription factor under salt stress in nine plant species. Ecotoxicol. Environ. Saf. 2019, 171, 435–442. [Google Scholar] [CrossRef] [PubMed]
  44. Zhang, J.; Xie, P.; Lascoux, M.; Meagher, T.R.; Liu, J. Rapidly evolving genes and stress adaptation of two desert poplars, Populus euphratica and P. pruinosa. PLoS ONE 2013, 8, e66370. [Google Scholar] [CrossRef] [Green Version]
  45. Azeem, F.; Zameer, R.; Rehman Rashid, M.A.; Rasul, I.; Ul-Allah, S.; Siddique, M.H.; Fiaz, S.; Raza, A.; Younas, A.; Rasool, A.; et al. Genome-wide analysis of potassium transport genes in Gossypium Raimondi suggest a role of GrHAK/KUP/KT8, GrAKT2.1 and GrAKT1.1 in response to abiotic stress. Plant Physiol. Biochem. 2022, 170, 110–122. [Google Scholar] [CrossRef]
  46. Riedelsberger, J.; Miller, J.K.; Valdebenito-Maturana, B.; Piñeros, M.A.; González, W.; Dreyer, I. Plant HKT Channels: An Updated View on Structure, Function and Gene Regulation. Int. J. Mol. Sci. 2021, 22, 1892. [Google Scholar] [CrossRef]
  47. Scherf, M.; Klingenhoff, A.; Werner, T. Highly specific localization of promoter regions in large genomic sequences by PromoterInspector: A novel context analysis approach. J. Mol. Biol. 2000, 297, 599–606. [Google Scholar] [CrossRef] [Green Version]
  48. Durrant, W.E.; Rowland, O.; Piedras, P.; Hammond-Kosack, K.E.; Jones, J.D. cDNA-AFLP reveals a striking overlap in race-specific resistance and wound response gene expression profiles. Plant Cell 2000, 12, 963–977. [Google Scholar] [CrossRef]
  49. Singh, K.B.; Foley, R.C.; Oñate-Sánchez, L. Transcription factors in plant defense and stress responses. Curr. Opin. Plant Biol. 2002, 5, 430–436. [Google Scholar] [CrossRef]
  50. Ren, Z.-H.; Gao, J.-P.; Li, L.-G.; Cai, X.-L.; Huang, W.; Chao, D.-Y.; Zhu, M.-Z.; Wang, Z.-Y.; Luan, S.; Lin, H.-X. A rice quantitative trait locus for salt tolerance encodes a sodium transporter. Nat. Genet. 2005, 37, 1141–1146. [Google Scholar] [CrossRef]
  51. Horie, T.; Yoshida, K.; Nakayama, H.; Yamada, K.; Oiki, S.; Shinmyo, A. Two types of HKT transporters with different properties of Na+ and K+ transport in Oryza sativa. Plant J. 2001, 27, 129–138. [Google Scholar] [CrossRef]
  52. Lin, H.; Zhu, M.; Yano, M.; Gao, J.; Liang, Z.; Su, W.; Hu, X.; Ren, Z.; Chao, D.Y. QTLs for Na+ and K+ uptake of the shoots and roots controlling rice salt tolerance. Theor. Appl. Genet. 2004, 108, 253–260. [Google Scholar] [CrossRef] [PubMed]
  53. Imran, S.; Horie, T.; Katsuhara, M. Expression and Ion Transport Activity of Rice OsHKT1;1 Variants. Plants 2019, 9, 16. [Google Scholar] [CrossRef] [PubMed] [Green Version]
  54. Wang, J.; Nan, N.; Li, N.; Liu, Y.; Wang, T.J.; Hwang, I.; Liu, B.; Xu, Z.Y. A DNA Methylation Reader-Chaperone Regulator-Transcription Factor Complex Activates OsHKT1;5 Expression during Salinity Stress. Plant Cell 2020, 32, 3535–3558. [Google Scholar] [CrossRef]
  55. Chen, N.; Tong, S.; Tang, H.; Zhang, Z.; Liu, B.; Lou, S.; Liu, J.; Liu, H.; Ma, T.; Jiang, Y. The PalERF109 transcription factor positively regulates salt tolerance via PalHKT1;2 in Populus alba var. pyramidalis. Tree Physiol. 2020, 40, 717–730. [Google Scholar] [CrossRef] [PubMed]
  56. Raza, A.; Tabassum, J.; Fakhar, A.Z.; Sharif, R.; Chen, H.; Zhang, C.; Ju, L.; Fotopoulos, V.; Siddique, K.H.M.; Singh, R.K.; et al. Smart reprograming of plants against salinity stress using modern biotechnological tools. Crit. Rev. Biotechnol. 2022, 15, 1–28. [Google Scholar] [CrossRef]
  57. Wang, R.; Jing, W.; Xiao, L.; Jin, Y.; Shen, L.; Zhang, W. The Rice High-Affinity Potassium Transporter1;1 Is Involved in Salt Tolerance and Regulated by an MYB-Type Transcription Factor. Plant Physiol. 2015, 168, 1076–1090. [Google Scholar] [CrossRef] [Green Version]
  58. Wu, H.; Shabala, L.; Zhou, M.; Su, N.; Wu, Q.; Ul-Haq, T.; Zhu, J.; Mancuso, S.; Azzarello, E.; Shabala, S. Root vacuolar Na+ sequestration but not exclusion from uptake correlates with barley salt tolerance. Plant J. 2019, 100, 55–67. [Google Scholar] [CrossRef]
  59. Zhang, H.; Feng, H.; Zhang, J.; Ge, R.; Zhang, L.; Wang, Y.; Li, L.; Wei, J.; Li, R. Emerging crosstalk between two signaling pathways coordinates K+ and Na+ homeostasis in the halophyte Hordeum brevisubulatum. J. Exp. Bot. 2020, 71, 4345–4358. [Google Scholar] [CrossRef]
  60. Ma, Q.; Hu, J.; Zhou, X.R.; Yuan, H.J.; Kumar, T.; Luan, S.; Wang, S.M. ZxAKT1 is essential for K+ uptake and K+/Na+ homeostasis in the succulent xerophyte Zygophyllum xanthoxylum. Plant J. 2017, 90, 48–60. [Google Scholar] [CrossRef] [Green Version]
Figure 1. HKT protein phylogeny in three plants: T. aestivum, Zea maize, and O. sativa. MEGA 7 was used for the phylogenetic tree using the following parameters: Bootstrap D 1000 replicates, maximum likelihood method, and Poisson correction. All group members were divided into five groups, each represented by an assorted color. Different labels were used to identify members of various species.
Bioengineering 09 00410 g001
Figure 2. Conserved motifs analysis of OsHKT genes in rice. The motif locations and logo are presented separately. The sequences of 5 conserved motifs are presented in the box called Motif Consensus.
Bioengineering 09 00410 g002
Figure 3. Gene structure analysis of OsHKT genes in rice. The red bars show CDS regions, whereas the grey lines represent introns. The blue bars at both ends display upstream/downstream regions.
Bioengineering 09 00410 g003
Figure 4. Gene ontology of the OsHKT gene family in rice. The figure displays the predicted biological, molecular, and cellular functions of OsHKT genes.
Bioengineering 09 00410 g004
Figure 5. Cis-acting elements presented in the 1.5 kb upstream regions of OsHKT genes. The figure shows hormonal, stress, and growth responsive cis-regulatory elements of the OsHKT gene family in rice.
Bioengineering 09 00410 g005
Figure 6. Predictive protein interaction analysis of OsHKT1 genes in rice. Our reference protein is in the middle in red.
Bioengineering 09 00410 g006
Figure 7. Tissue-specific expression analysis of the OsHKT gene family in rice. Data were obtained from a publicly available database. Rows represent OsHKT members, and columns show different developmental stages and tissues. The expression level of OsHKT [log2 (FPKM  +  1)] is shown by the intensity of color; red represents high expression and blue represents low expression.
Bioengineering 09 00410 g007
Figure 8. Expression analysis of the OsHKT gene family in rice roots under brassinosteroids application. Rows represent OsHKT members, and columns show different time points. The expression level of OsHKT [log2 (FPKM + 1)] is shown by the intensity of color: red represents high expression, and blue represents low expression.
Bioengineering 09 00410 g008
Figure 9. Expression analysis of OsHKT genes in rice roots under Jasmonic acid application. Rows represent OsHKT members, and columns show different time points. The expression level of OsHKT [log2 (FPKM  +  1)] is indicated by the intensity of color: red represents high expression and blue represents low expression.
Bioengineering 09 00410 g009
Figure 10. Expression analysis of the OsHKT gene family in rice roots and stems under saline conditions. Different treatments were represented with different colors. ANOVA was used to test significance. p  <  0.05. Error bars represent standard deviation.
Bioengineering 09 00410 g010
Figure 11. Expression analysis of the OsHKT gene family in the salinity resistant cultivar subjected to sea water stress. Control (CK) and seawater resistant (SWR). Different treatments are represented with different colors. ANOVA was used to test significance at p < 0.05 probability level. Error bars represent standard deviation.
Bioengineering 09 00410 g011
Figure 12. Na+, K+, and ratio in tolerant cultivar (3Y9H) and five salt concentration treatments (0, 25, 50, 75, and 100 mM). Different letters showed the significant variance at p < 0.05.
Bioengineering 09 00410 g012
Figure 13. Na+, K+, and ratio in sensitive cultivar (JLY252) and five salt concentration treatments (0, 25, 50, 75, and 100 mM). Different letters showed the significant variance at p < 0.05.
Bioengineering 09 00410 g013
Table 1. Genomic information of OsHKT gene family in rice.
Gene NameLocus IDCDSChr. PositionAAMWPISL
OsHKT1LOC_Os06g48,8101593Chr6- 29,541,219-29,538,93453159,295.07819.82610035PM
OsHKT3LOC_Os01g34,8501530Chr1- 19,242,042-19,243,85351056,374.37899.11009979PM
OsHKT4LOC_Os04g51,8201659Chr4- 30,727,084-30,724,24455361,862.44928.86629963PM
OsHKT6LOC_Os02g07,8301596Chr2- 4,103,333-4,105,65753259,304.53129.78820038PM
OsHKT7LOC_Os04g51,8301503Chr4- 30,739,334-30,734,18350154,239.30088.87370014PM
OsHKT8LOC_Os01g20,1601665Chr1- 11,463,442-11,458,95555560,218.28128.68159962PM
OsHKT9LOC_Os06g48,8001530Chr6- 29,536,553-29,534,80551056,116.71888.54440022PM
AA: amino acid, MW: molecular weight, PI: isoelectric point, SL: subcellular location, PM: plasma membrane.
Table 2. Predicted function partners of OsHKT1 in Oryza Sativa.
Reference ProteinPredicted Interactive PartnerAnnotation and Putative Function
OsHKT1NHX2Putative Na+/H+ antiporter; Sodium/hydrogen exchanger.
NHX1Sodium/hydrogen exchanger; Belongs to the monovalent cation: proton antiporter 1 (CPA1) transporter (TC 2.A.36) family.
P5CS1Delta-1-pyrroline-5-carboxylate synthase Glutamate 5-kinase Gamma-glutamyl phosphate reductase; P5CS plays a key role in proline biosynthesis, leading to osmoregulation in plants. Involved in abiotic stress tolerance.
HAK1Potassium transporter 1; High-affinity potassium transporter. Additionally, transport rubidium, with the same affinity and cesium, with a lower affinity; which belongs to the HAK/KUP transporter (TC 2.A.72.3) family.
OsJ_04382Putative BTB and TAZ domain protein.
TPKCTwo pore potassium channel c; Inward-rectifying potassium channel; Belongs to the two-pore domain potassium channel (TC 1.A.1.7) family.
OsJ_30786Hsp20/alpha crystalline family protein expressed; Belongs to the small heat shock protein (HSP20) family.
Publisher’s Note: MDPI stays neutral with regard to jurisdictional claims in published maps and institutional affiliations.

