
A Population-Based 3D Atlas of the Pathological Lumbar Spine Segment


Abstract
:1. Introduction
2. Materials and Methods
2.1. Patient Study Population
2.2. Lumbar Spine Segmentation
2.3. Geometrical and Anatomical Measurements
2.4. Pathological Issues
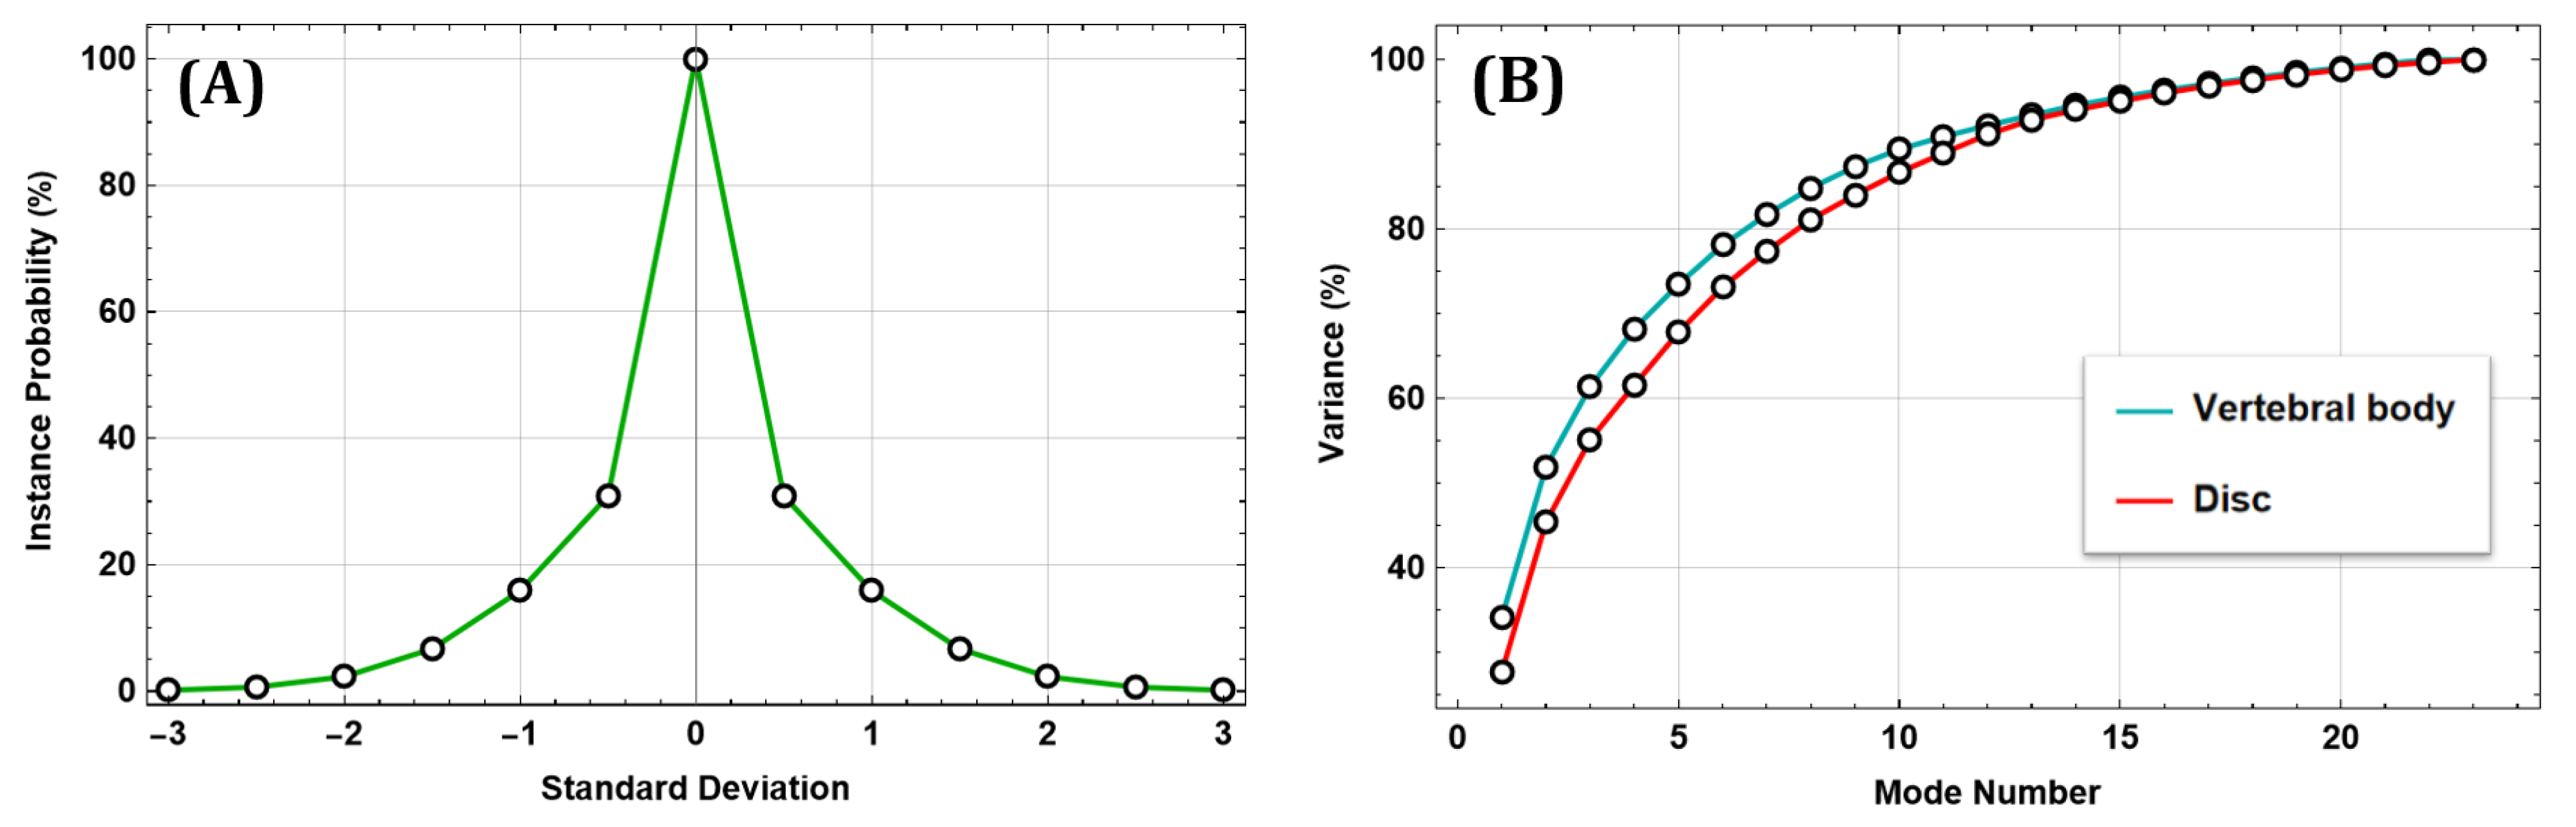
2.5. SSM Approach
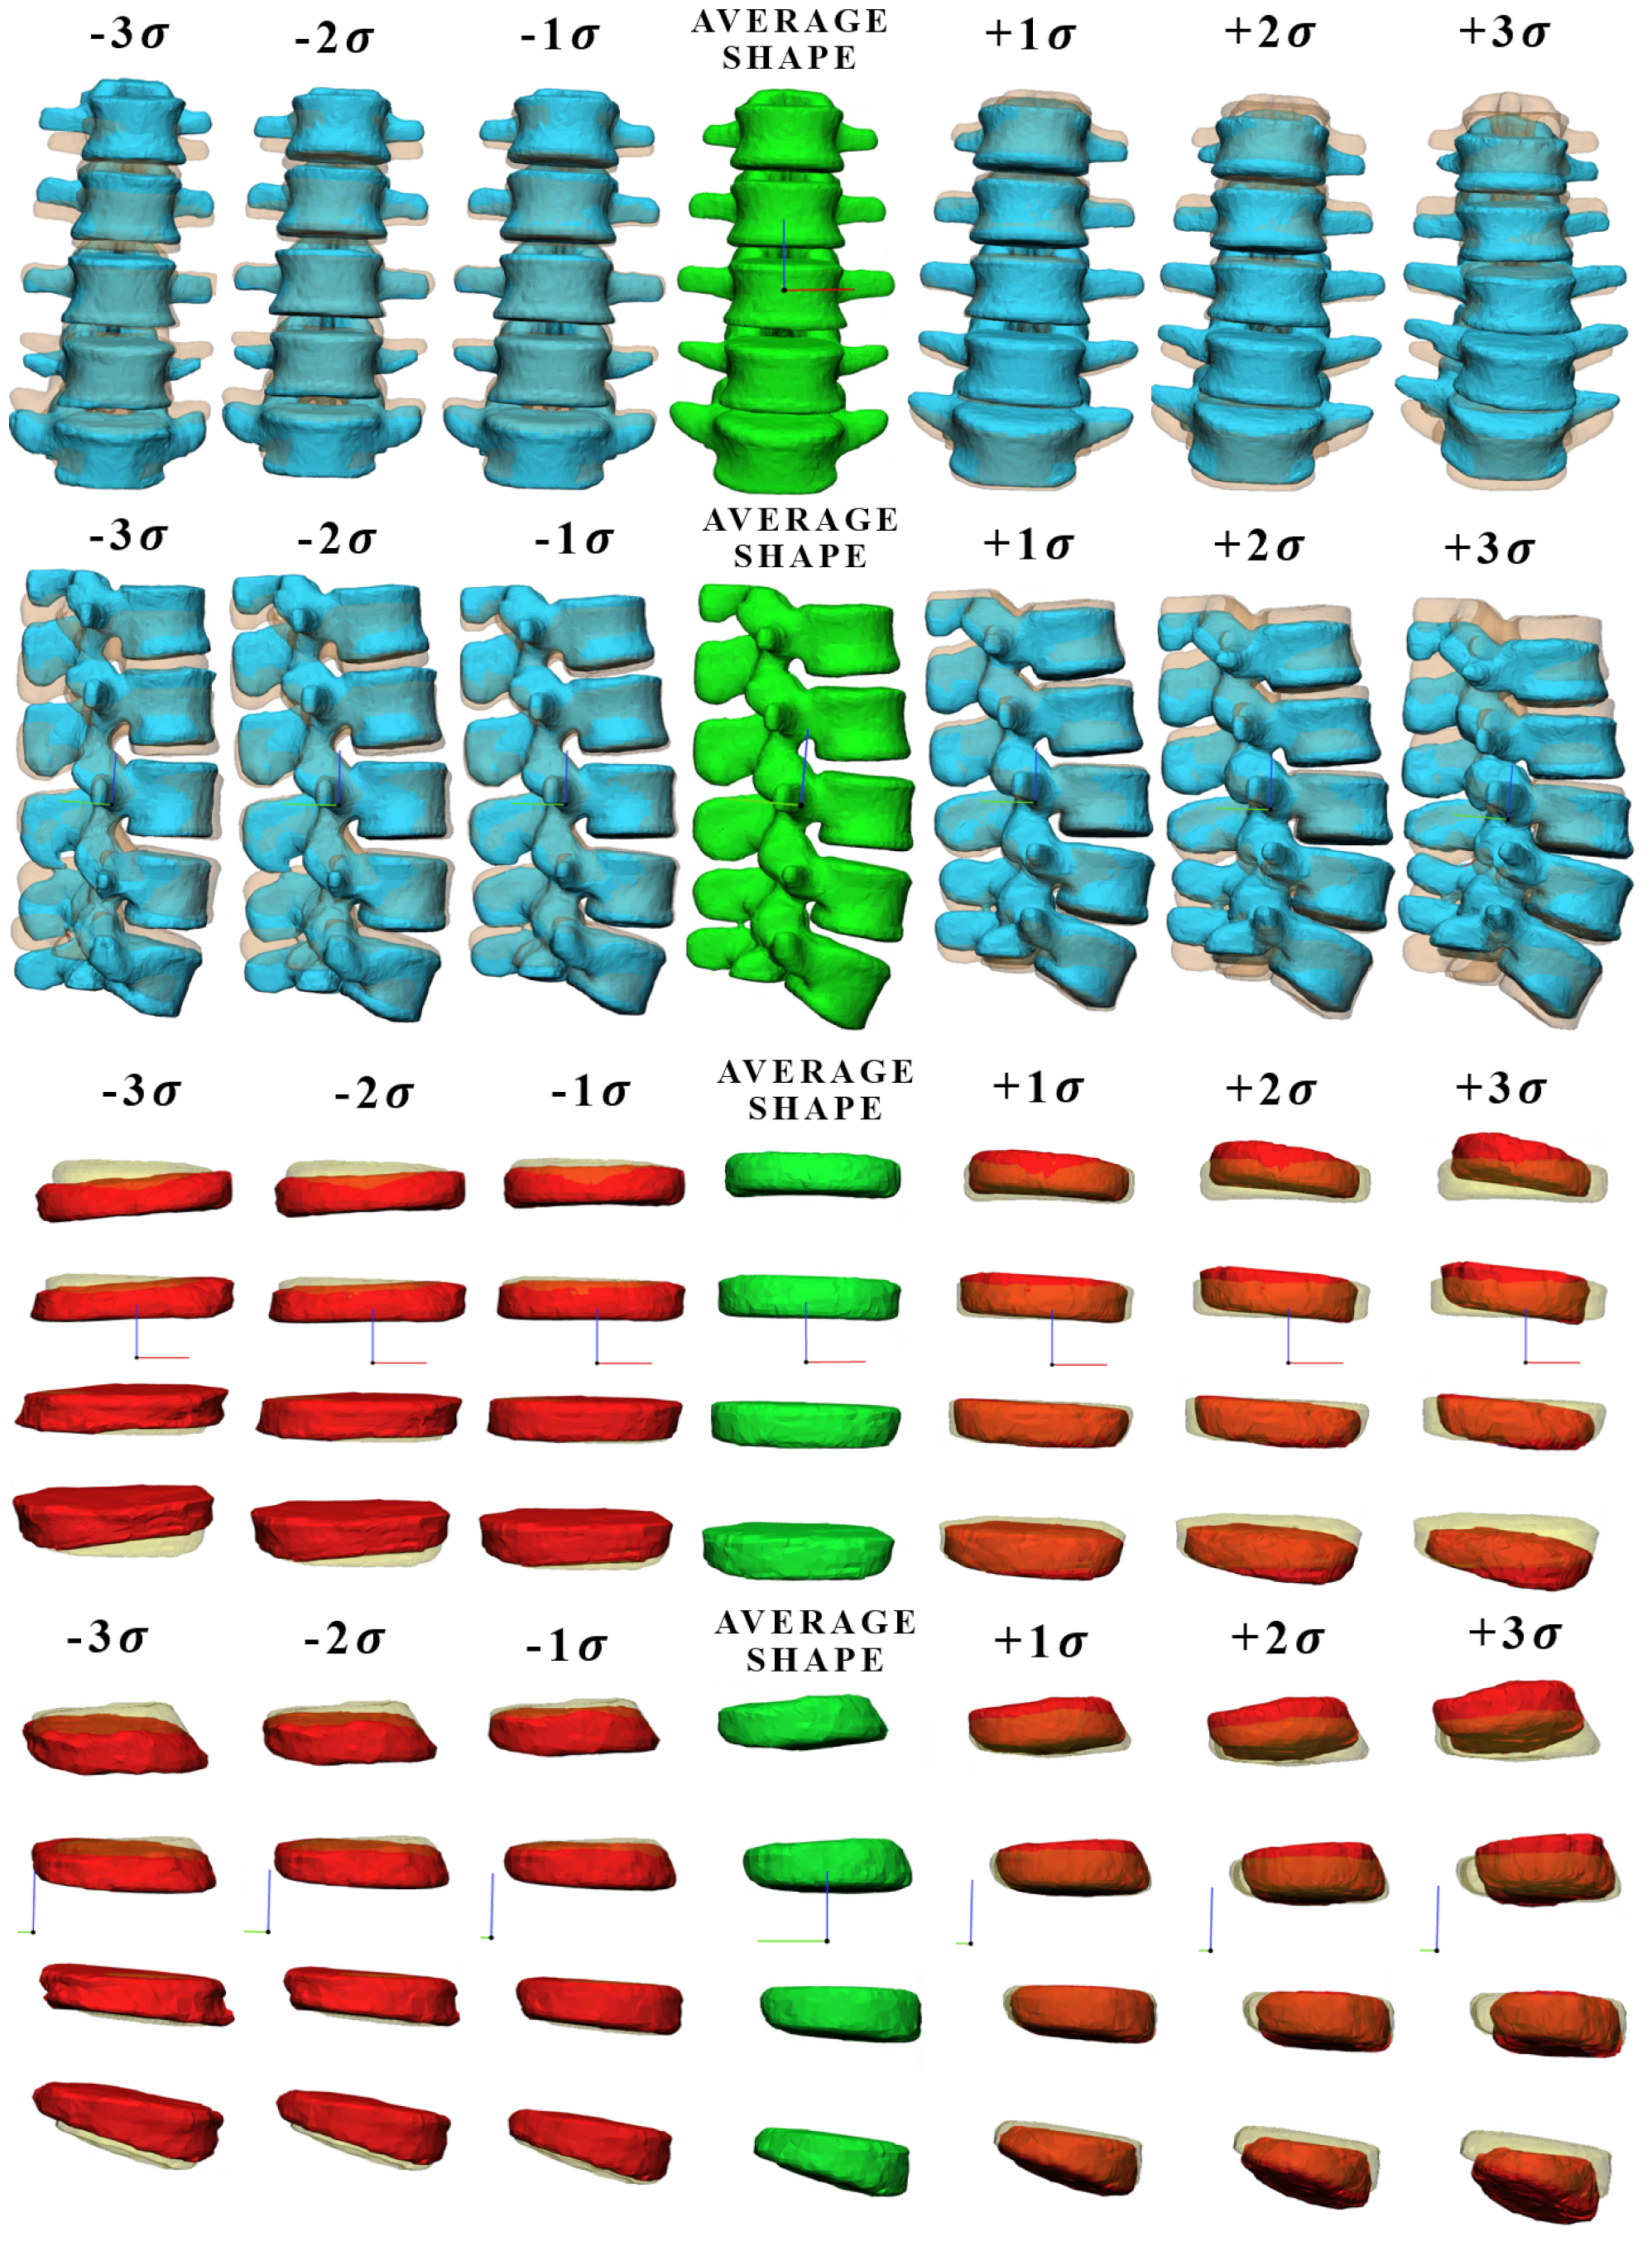
3. Results
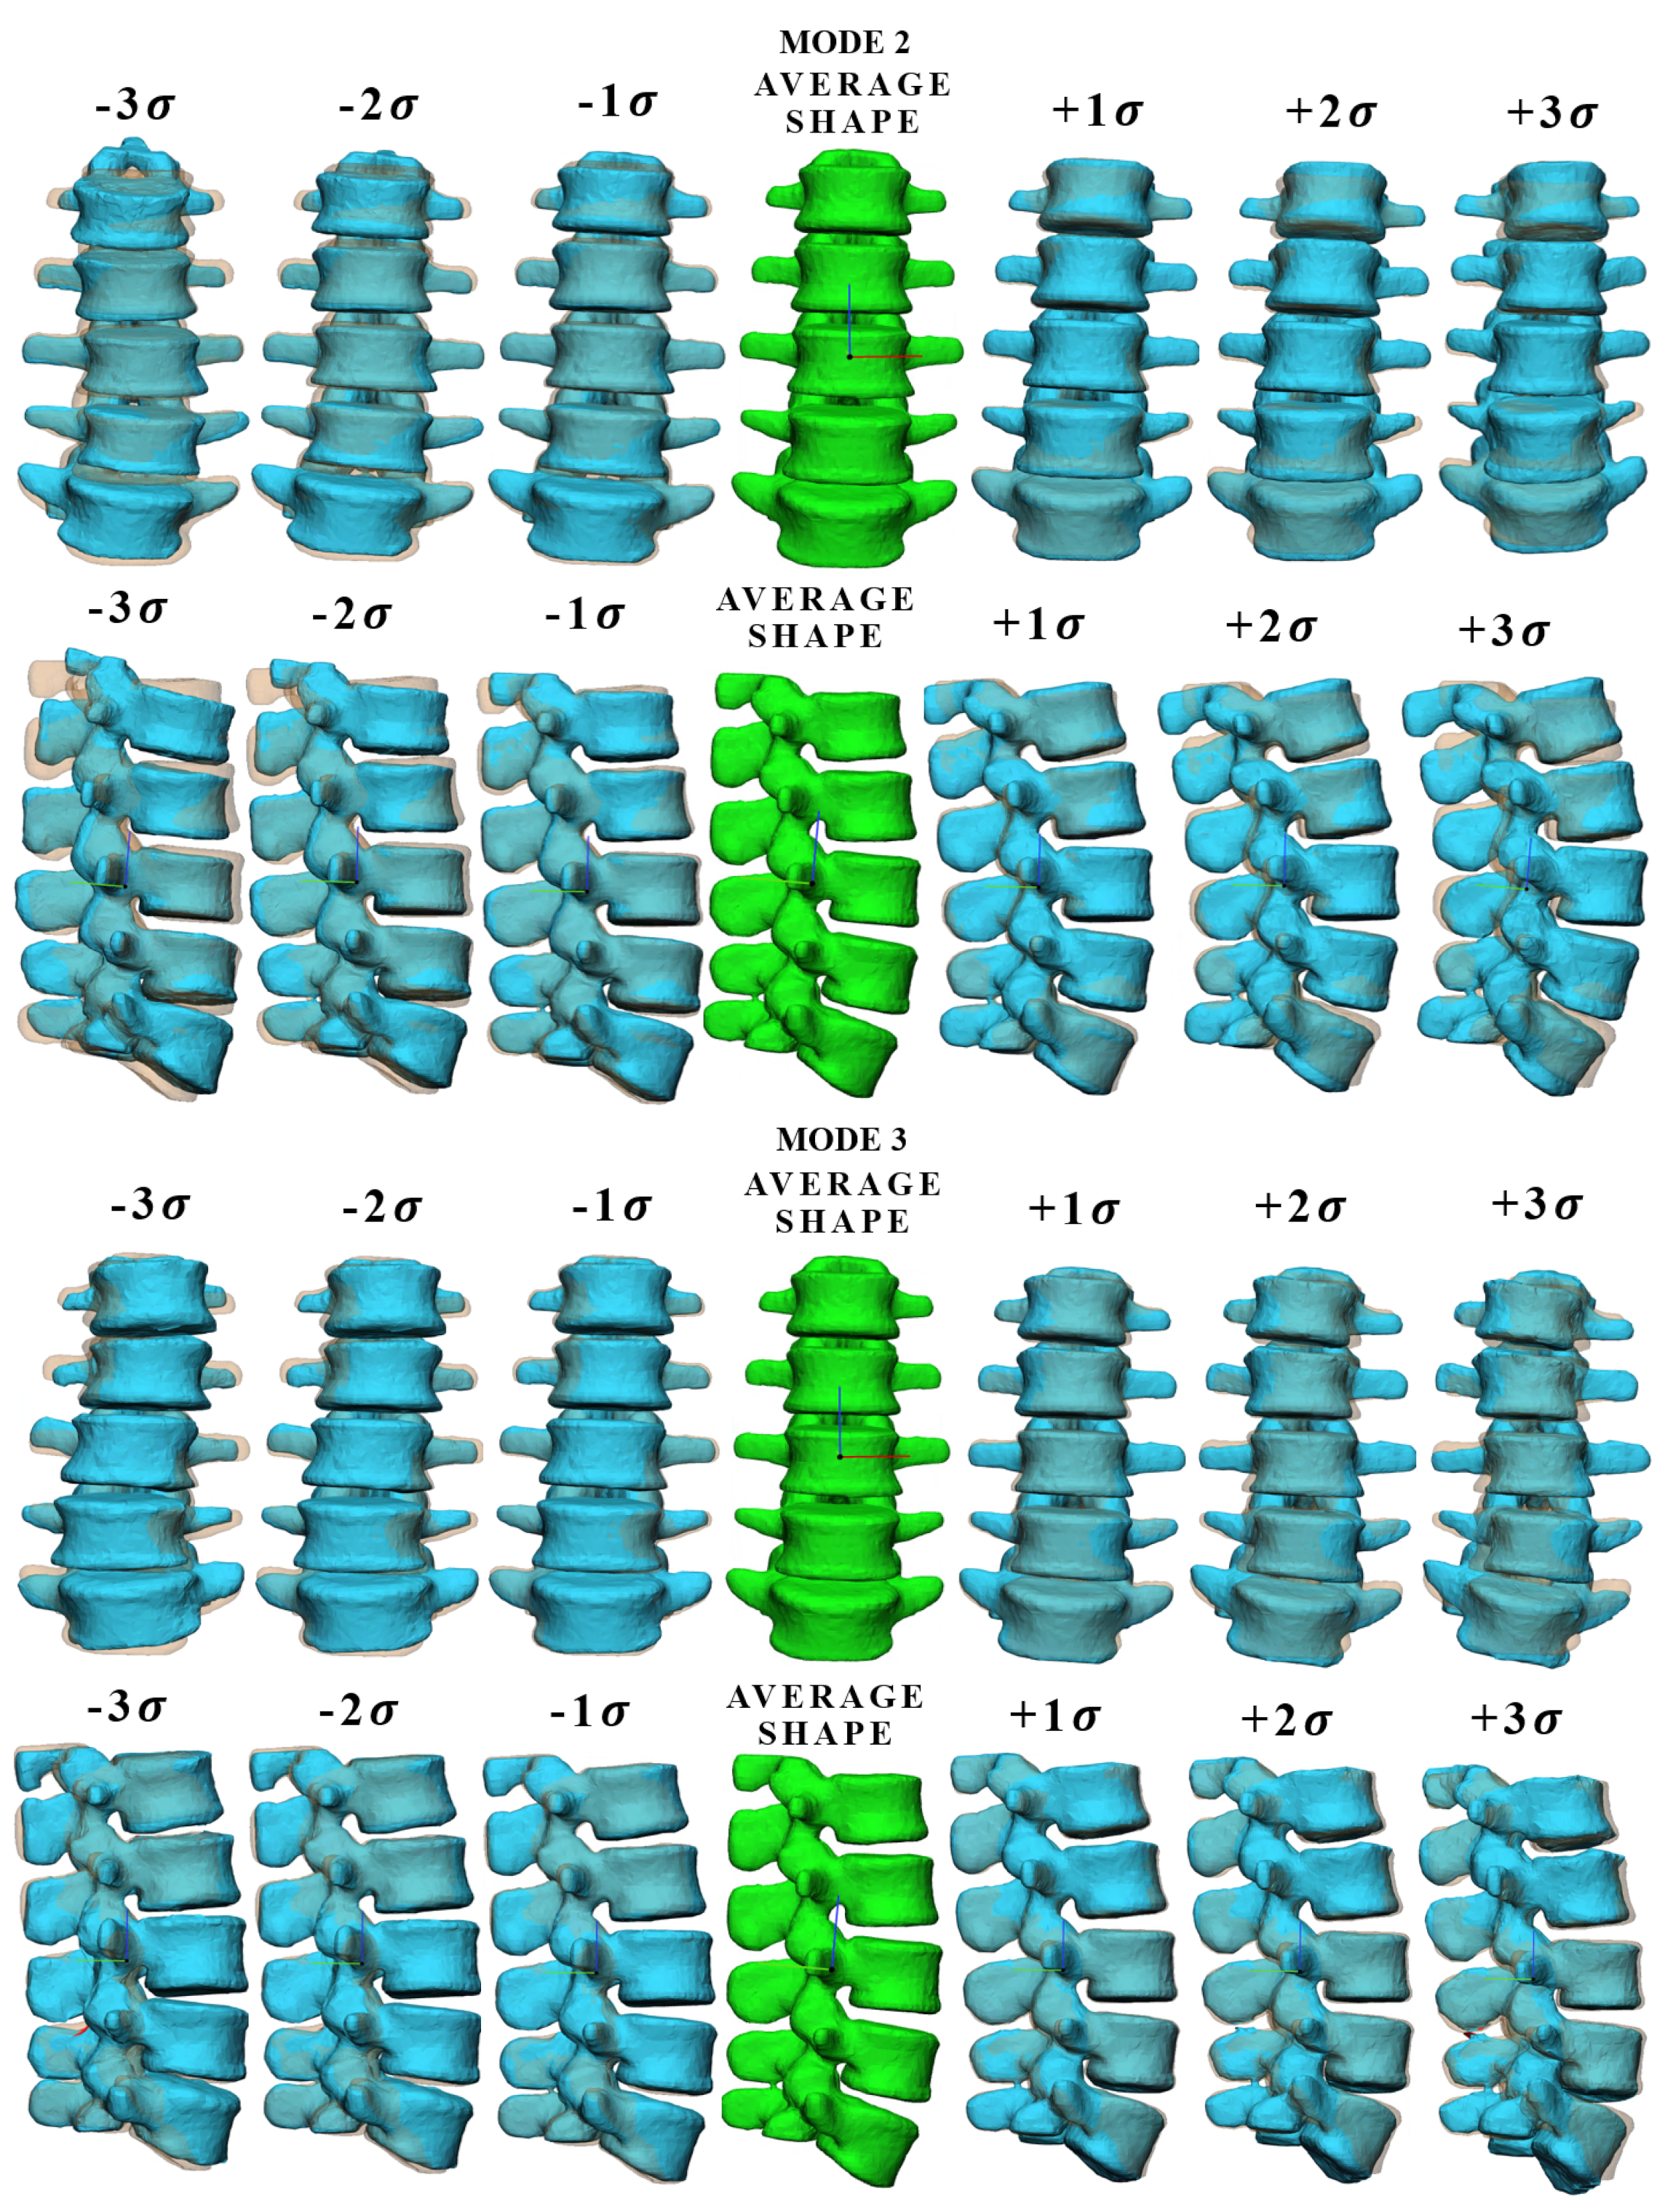
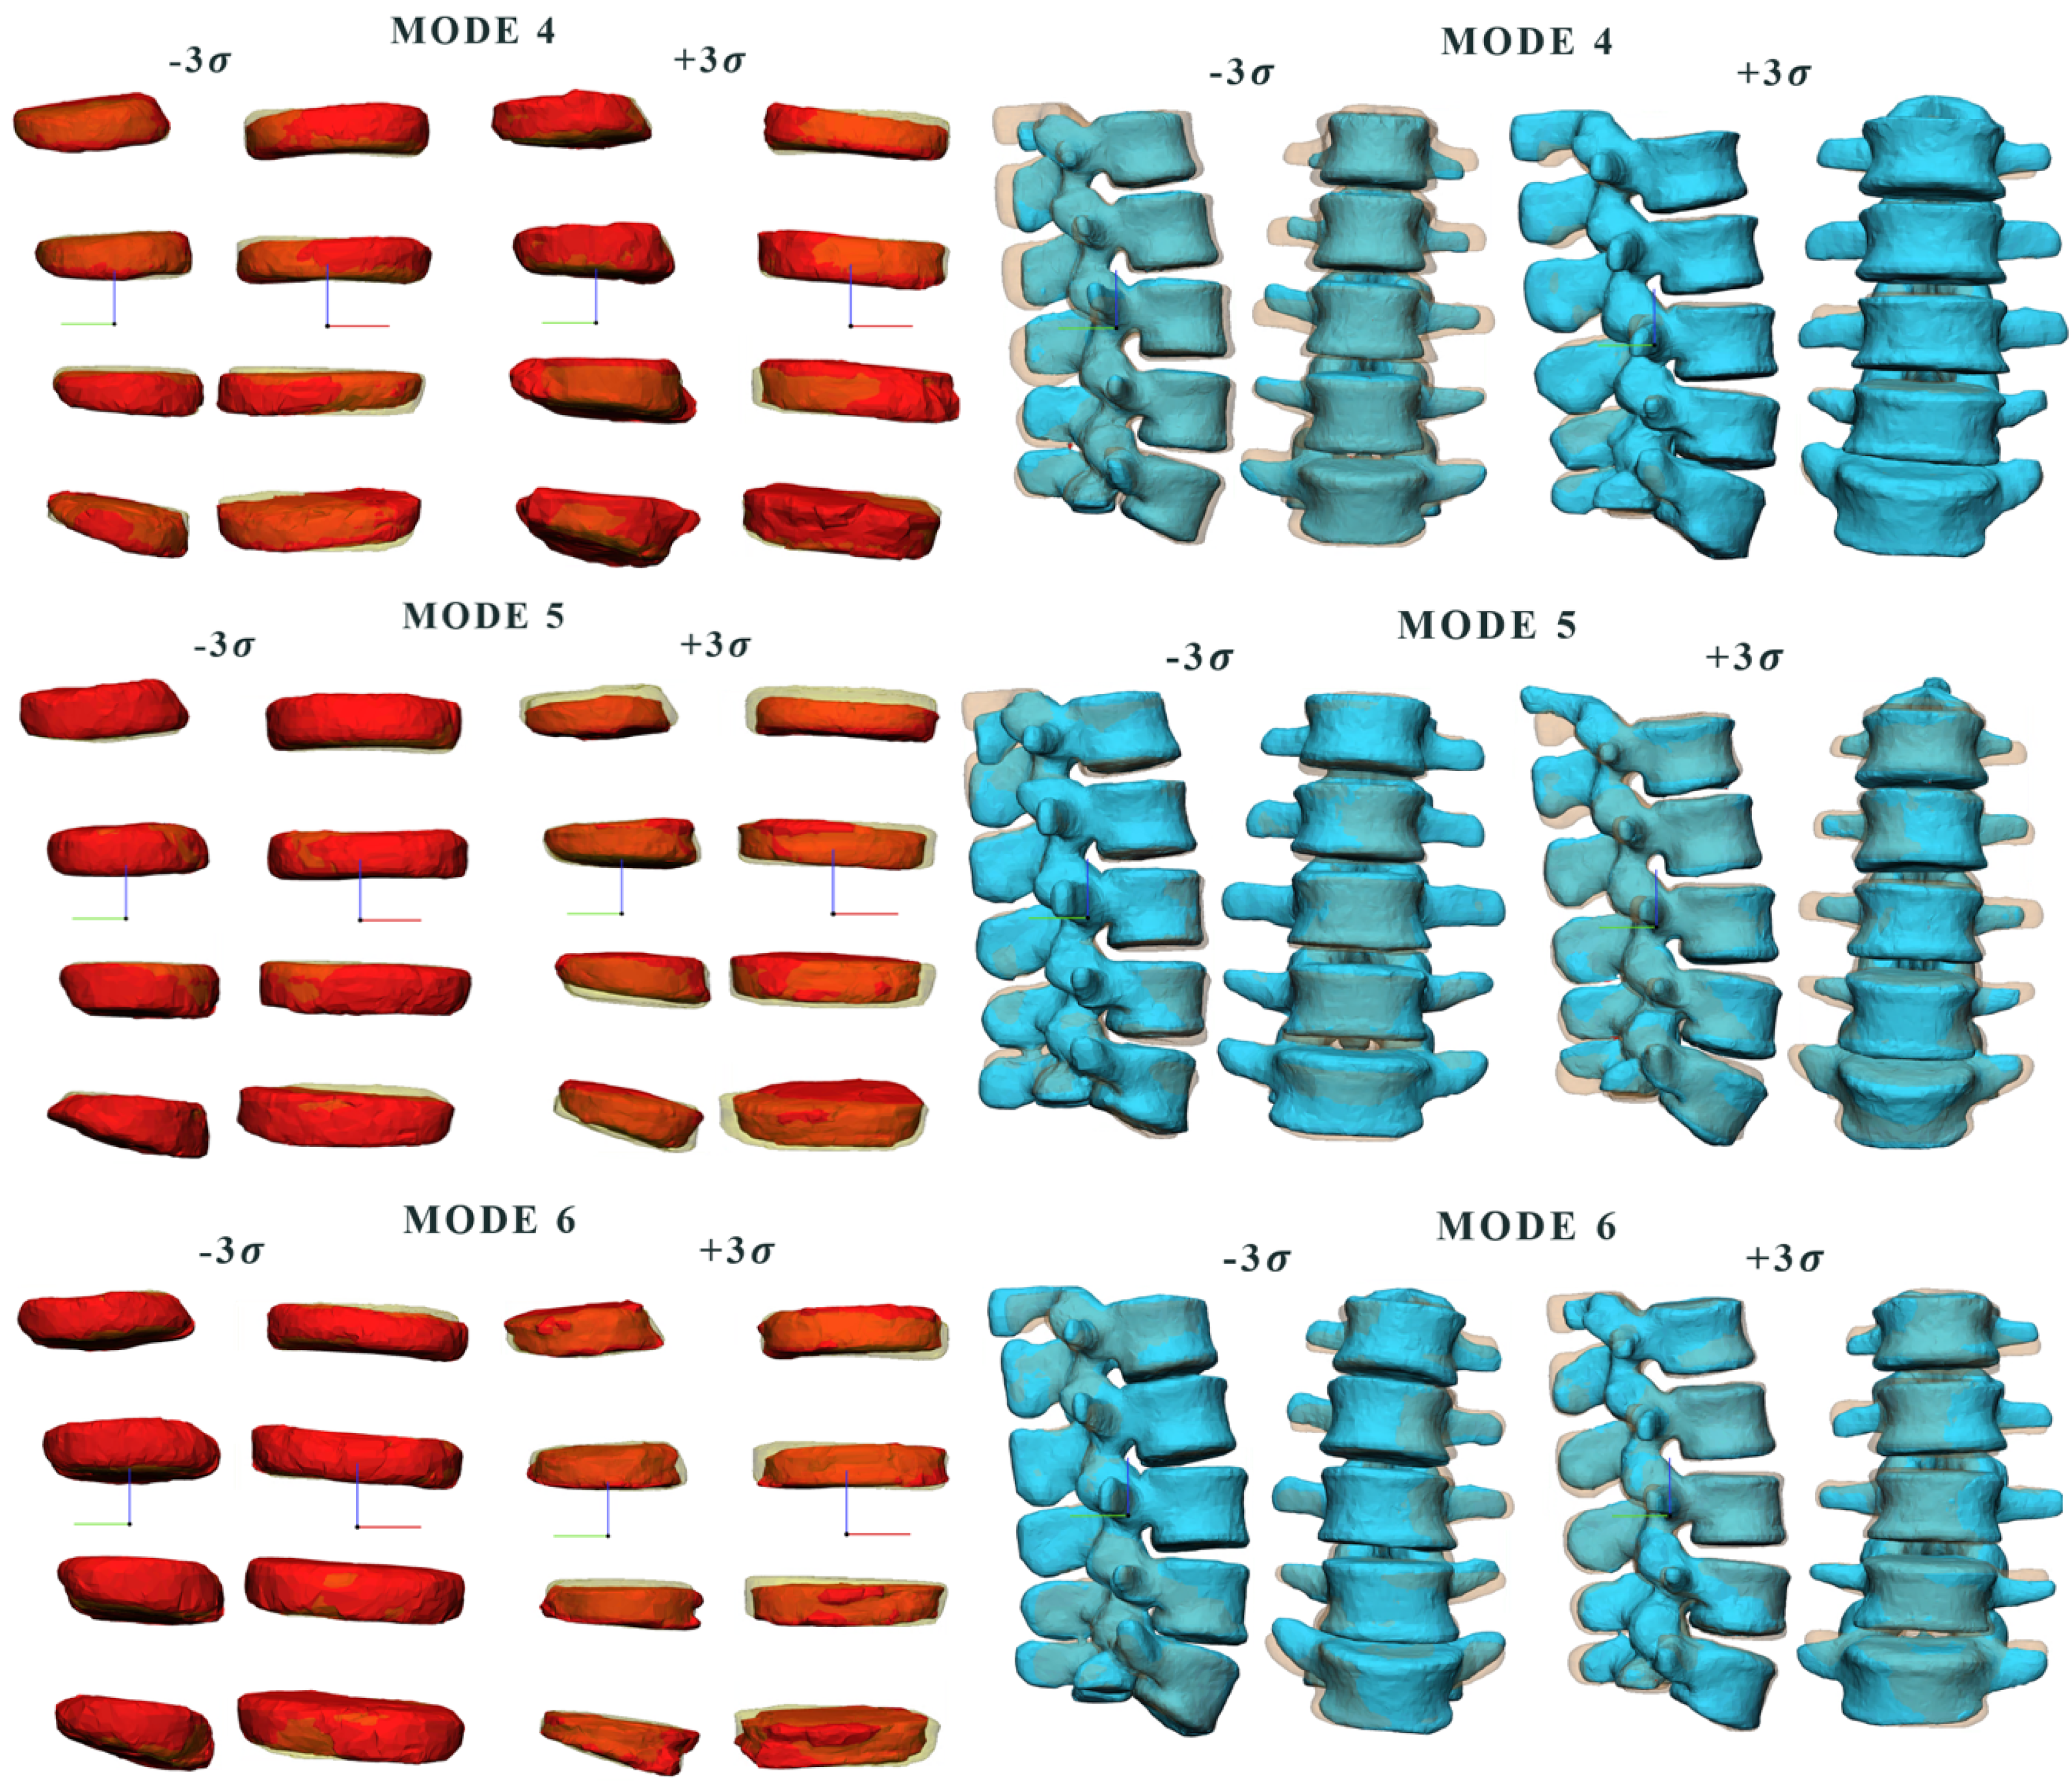
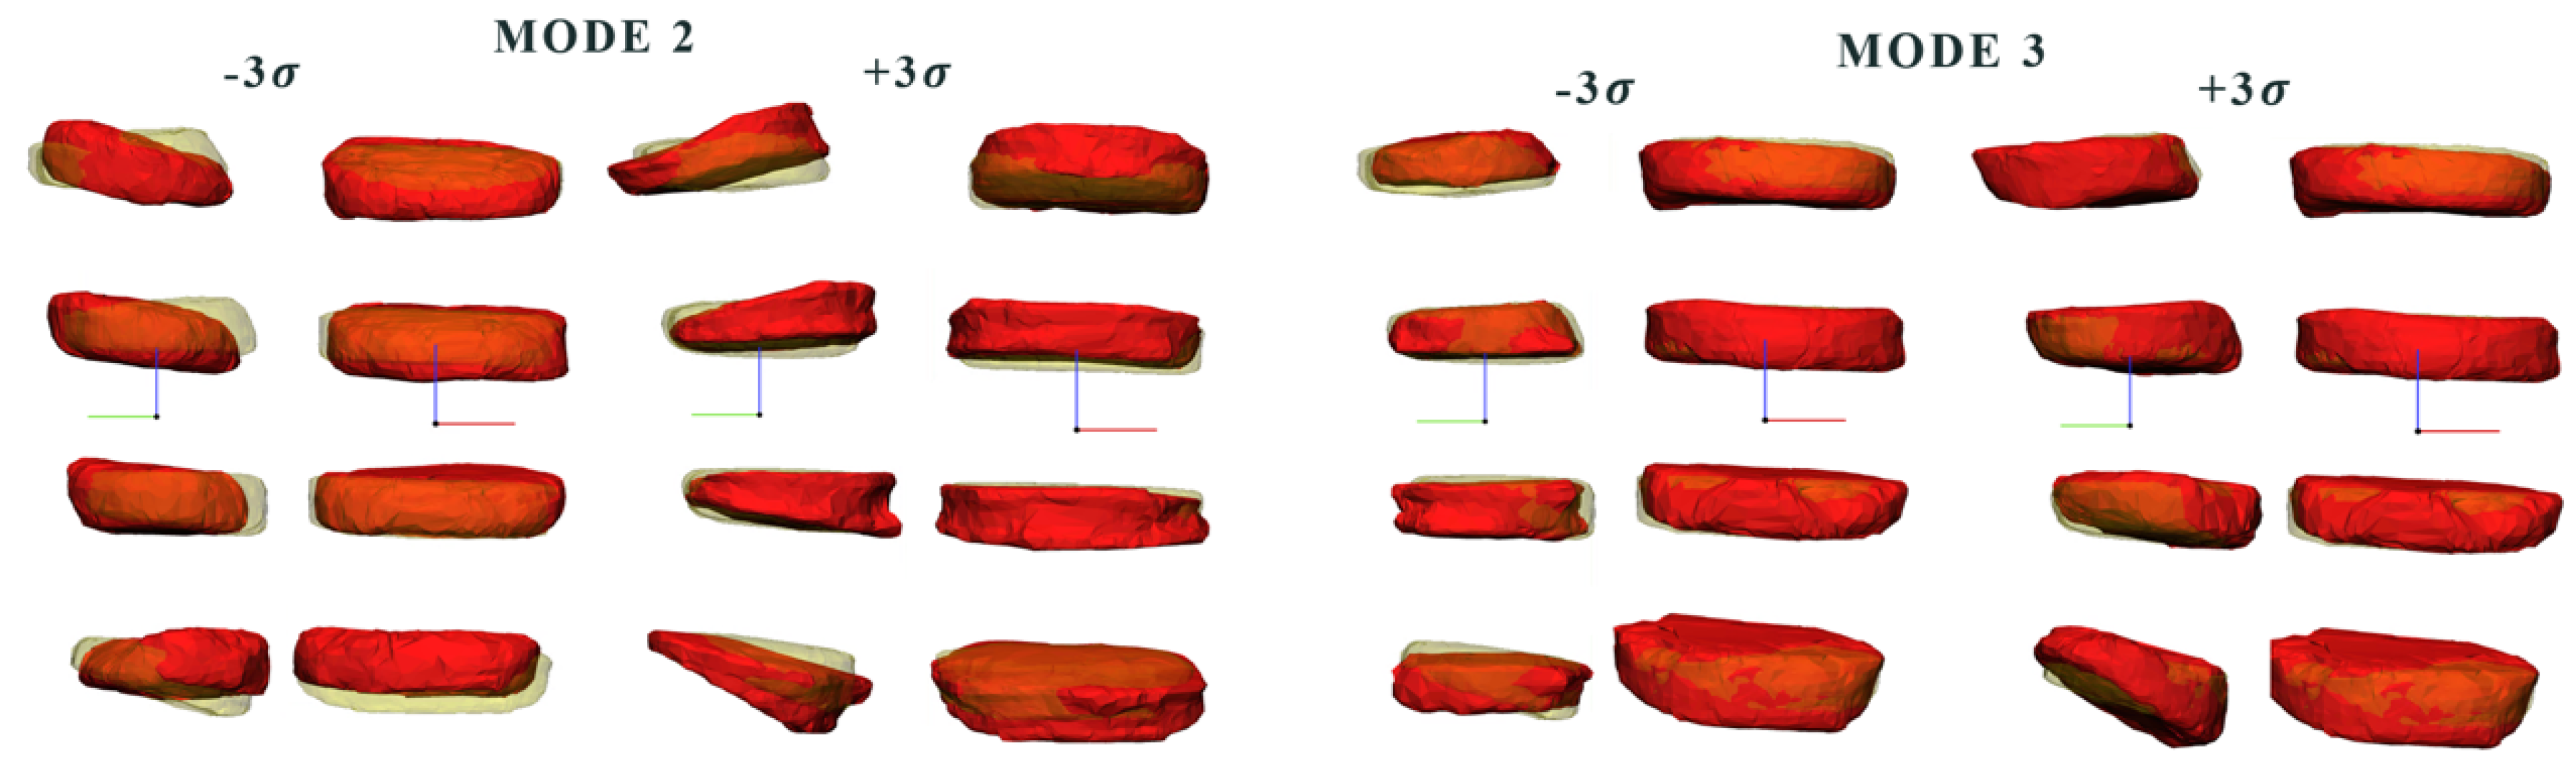
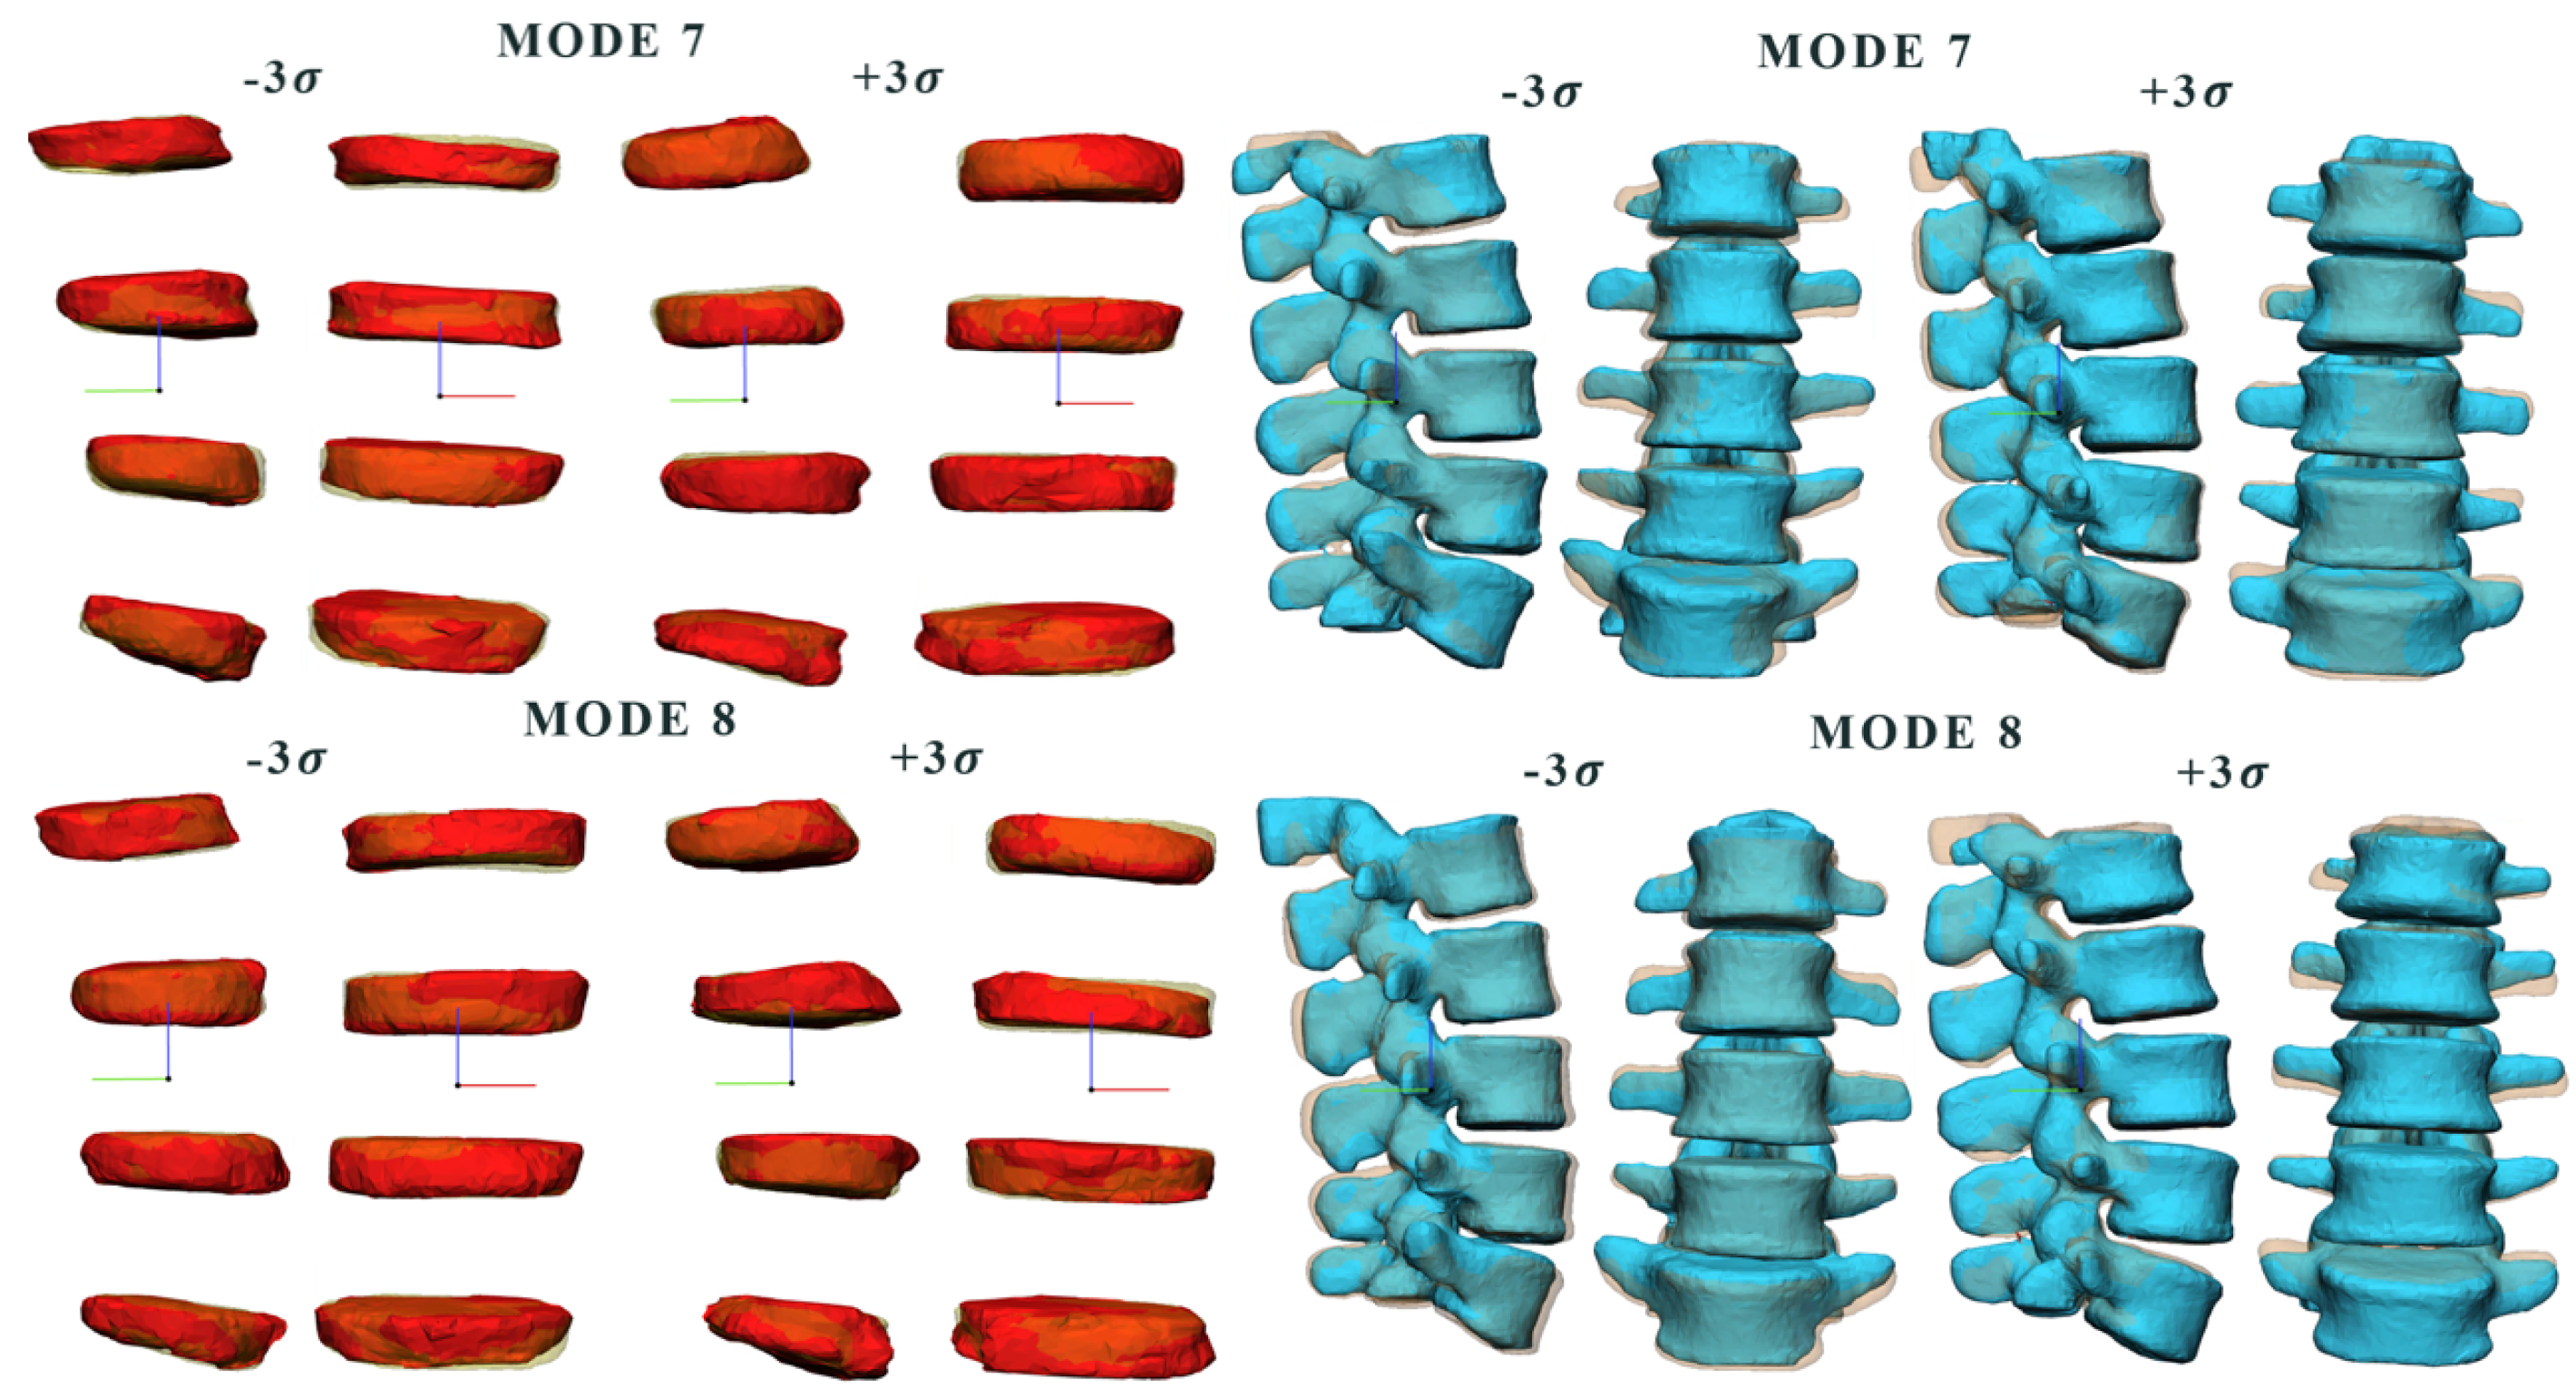
3.1. Comparison between Modes
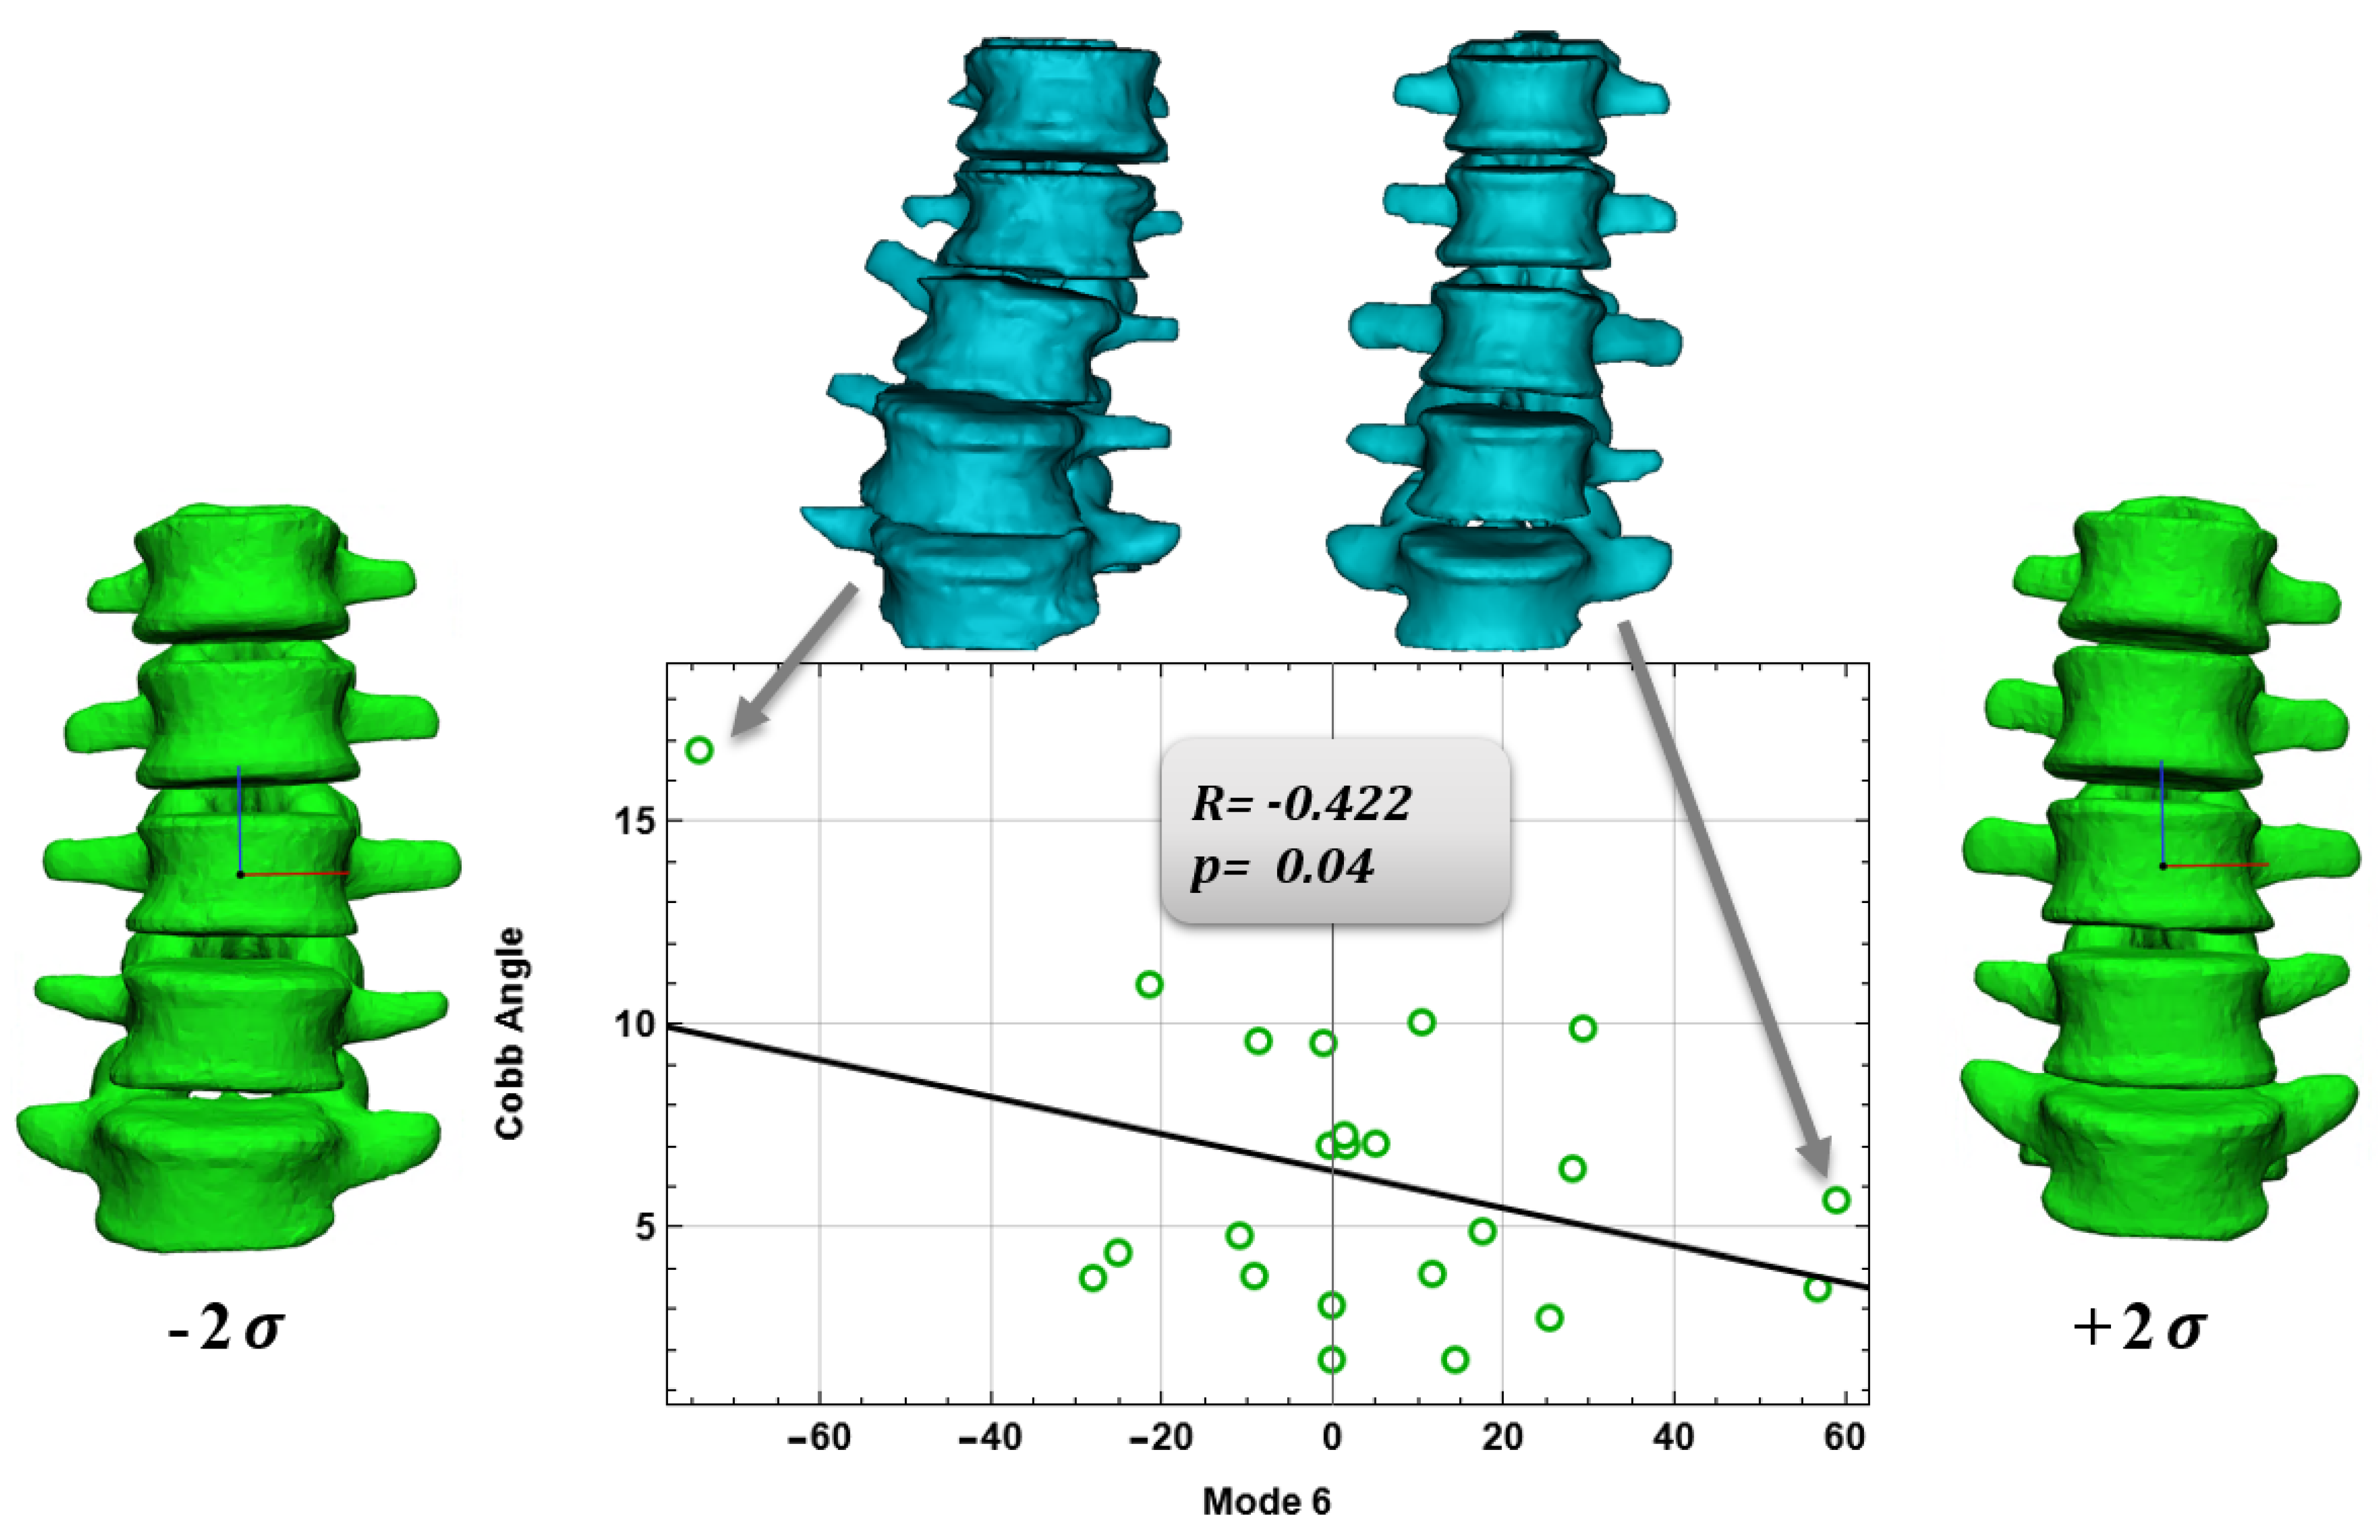
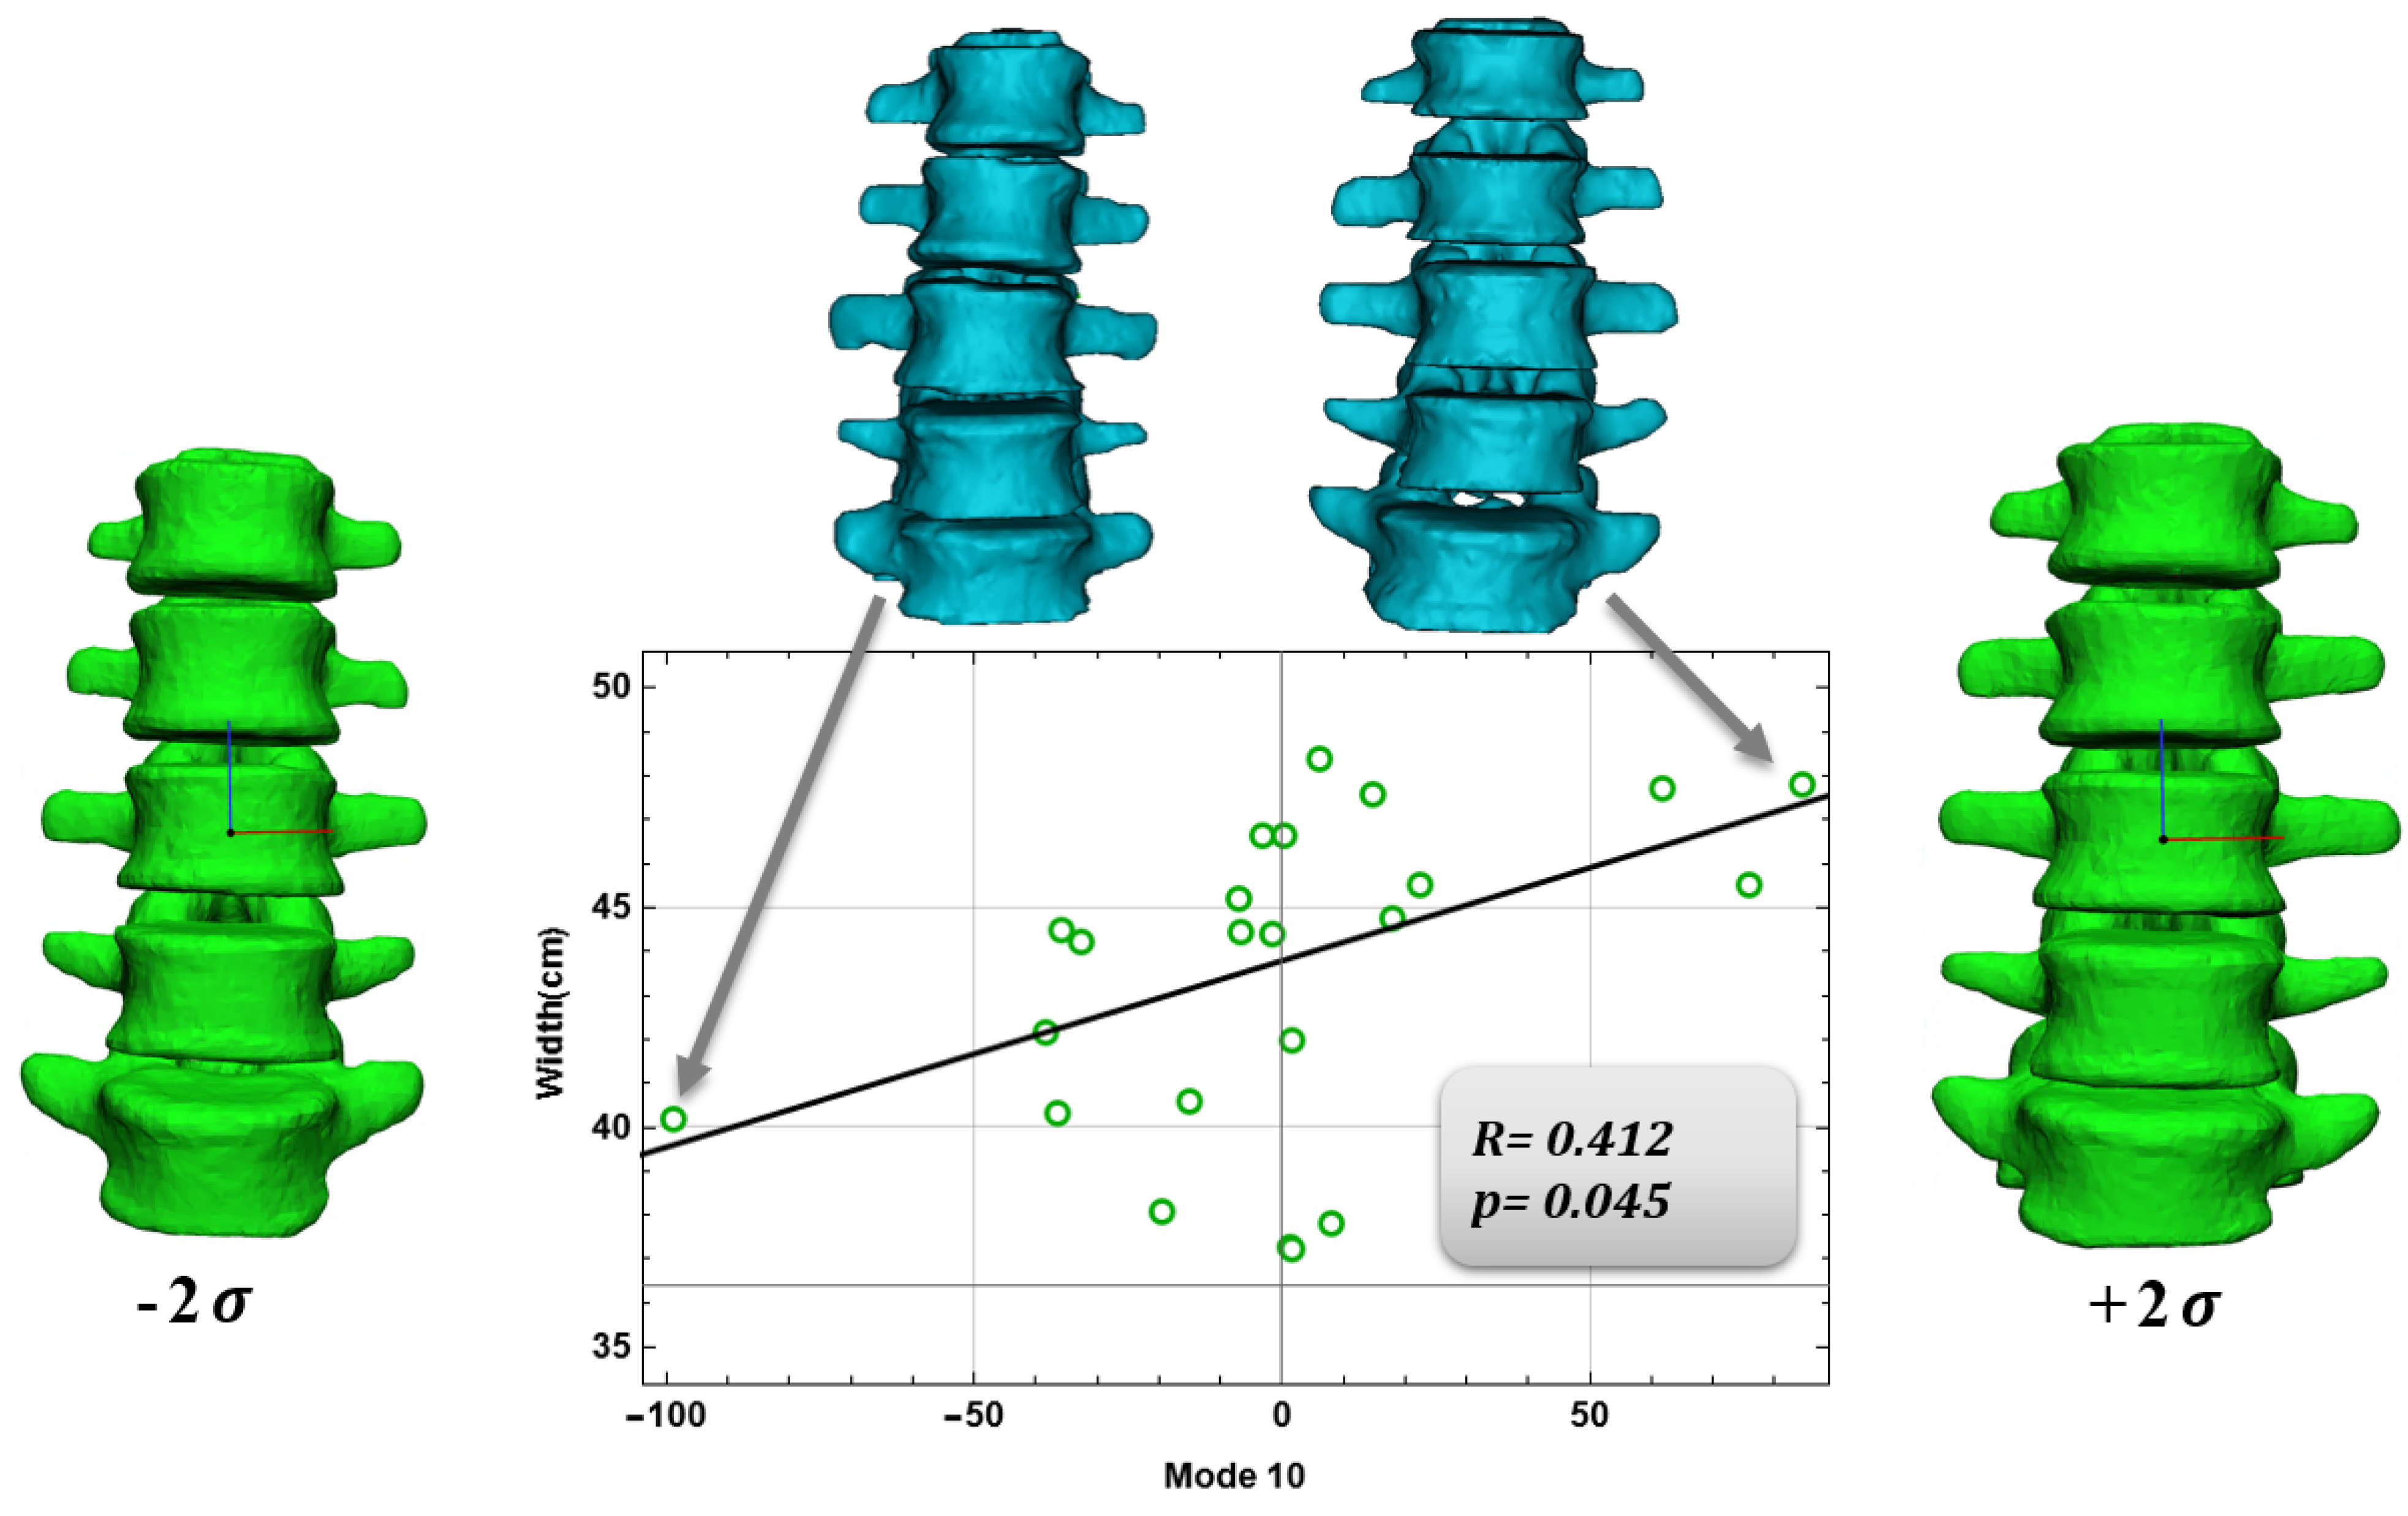
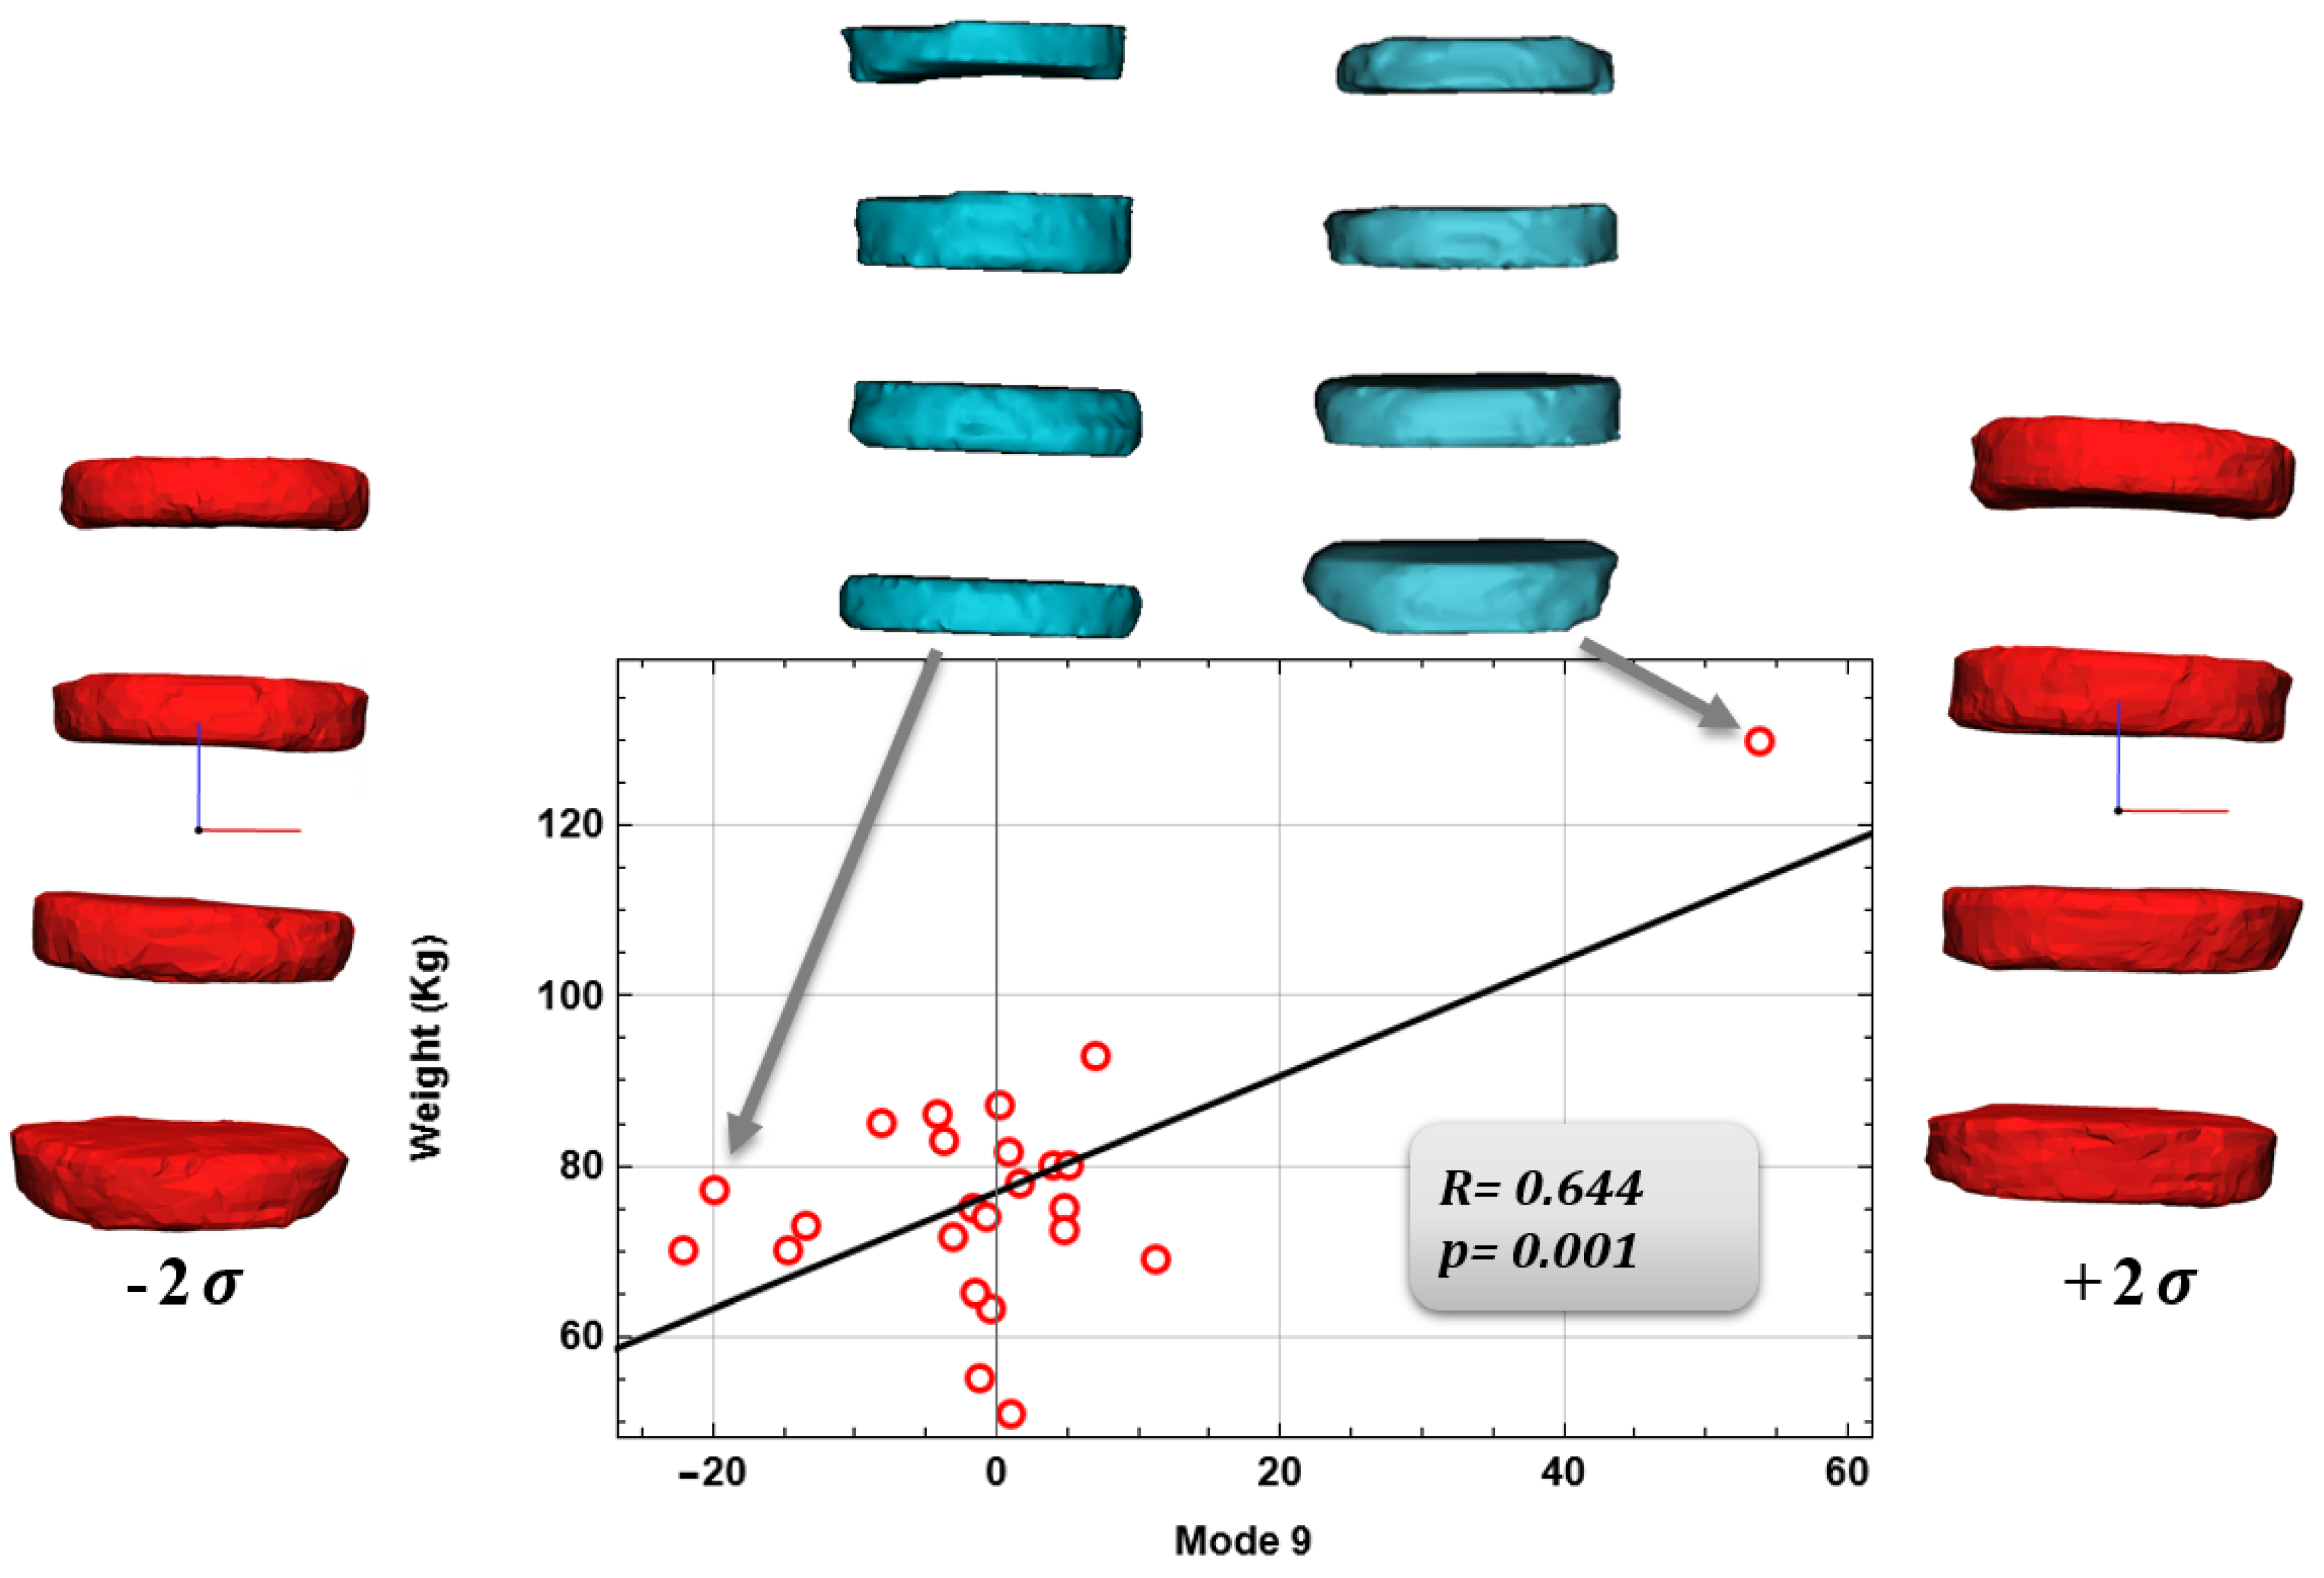
3.2. Relationship between Anatomical Aspects and Shape Modes
4. Discussion
5. Conclusions
Supplementary Materials
Author Contributions
Funding
Institutional Review Board Statement
Informed Consent Statement
Data Availability Statement
Conflicts of Interest
Appendix A


| Medium Shape (mm) | Medium Surface (mm) | Height (mm) | Medium Perimeter( mm) |
|---|---|---|---|
| L1-L2 | 1395.88 | 9.99 | 152.17 |
| L2-L3 | 1732.14 | 9.99 | 155.08 |
| L3-L4 | 1733.20 | 8.24 | 156.51 |
| L4-L5 | 1846.57 | 10.00 | 159.95 |
| Medium Shape (mm) | Medium Surface (mm) | Height | Medium Perimeter (mm) | Width (mm) |
|---|---|---|---|---|
| L1 | 1556.57 | 27.97 | 152.07 | 45.13 |
| L2 | 1644.28 | 26.13 | 152.51 | 47.50 |
| L3 | 1705.84 | 28.06 | 159.51 | 46.62 |
| L4 | 1600.47 | 26.22 | 151.27 | 47.48 |
| L5 | 1528.99 | 28.20 | 153.79 | 48.34 |
References
- Benzel, E.C. Deformity Prevention and Correction: Component Strategies; Biomechanics of Spine Stablization; AANS Publications: Rolling Meadows, IL, USA, 2001; pp. 437–440. [Google Scholar]
- Gadd, M.J.; Shepherd, D.E.T. Viscoelastic properties of the intervertebral disc and the effect of nucleus pulposus removal. Proc. Inst. Mech. Eng. Part J. Eng. Med. 2011, 225, 335–341. [Google Scholar] [CrossRef]
- Langensiepen, S.; Semler, O.; Sobottke, R.; Fricke, O.; Franklin, J.; Schönau, E.; Eysel, P. Measuring procedures to determine the Cobb angle in idiopathic scoliosis: A systematic review. Eur. Spine J. 2013, 22, 2360–2371. [Google Scholar] [CrossRef] [PubMed] [Green Version]
- Patwardhan, A.G.; Havey, R.M.; Meade, K.P.; Lee, B.; Dunlap, B. A follower load increases the load-carrying capacity of the lumbar spine in compression. Spine 1999, 24, 1003–1009. [Google Scholar] [CrossRef] [PubMed]
- Patwardhan, A.G.; Havey, R.M.; Carandang, G.; Simonds, J.; Voronov, L.I.; Ghanayem, A.J.; Paxinos, O. Effect of compressive follower preload on the flexion–extension response of the human lumbar spine. J. Orthop. Res. 2003, 21, 540–546. [Google Scholar] [CrossRef]
- Kim, Y.H.; Kim, K. Computational modeling of spine and trunk muscles subjected to follower force. J. Mech. Sci. Technol. 2007, 21, 568–574. [Google Scholar] [CrossRef]
- Lidar, Z.; Behrbalk, E.; Regev, G.J.; Salame, K.; Keynan, O.; Schweiger, C.; Appelbaum, L.; Levy, Y.; Keidar, A. Intervertebral disc height changes after weight reduction in morbidly obese patients and its effect on quality of life and radicular and low back pain. Spine 2012, 37, 1947–1952. [Google Scholar] [CrossRef] [Green Version]
- Patwardhan, A.G.; Bunch, W.H.; Meade, K.P.; Vanderby, R., Jr.; Knight, G.W. A biomechanical analog of curve progression and orthotic stabilization in idiopathic scoliosis. J. Biomech. 1986, 19, 103–117. [Google Scholar] [CrossRef]
- White, A.A.; Panjabi, M.M. Clinical Biomechanics of the Spine, 2nd ed.; Lippincott: Philadelphia, PA, USA, 1990. [Google Scholar]
- Hwang, D.; Gabai, A.S.; Yu, M.; Yew, A.G.; Hsieh, A.H. Role of load history in intervertebral disc mechanics and intradiscal pressure generation. Biomech. Model. Mechanobiol. 2012, 11, 95–106. [Google Scholar] [CrossRef]
- O’Connell, J.E. Protrusions of the lumbar intervertebral discs. J. Bone Jt. Surgery. Br. 1951, 33, 8–30. [Google Scholar] [CrossRef]
- Tsutsui, S.; Yoshimura, N.; Watanuki, A.; Yamada, H.; Nagata, K.; Ishimoto, Y.; Enyo, Y.; Yoshida, M. Risk factors and natural history of de novo degenerative lumbar scoliosis in a community-based cohort: The Miyama study. Spine Deform. 2013, 1, 287–292. [Google Scholar] [CrossRef]
- Wang, H.; Zhang, T.; Cheung, K.M.C.; Shea, G.K.H. Application of deep learning upon spinal radiographs to predict progression in adolescent idiopathic scoliosis at first clinic visit. EClinicalMedicine 2021, 42, 101220. [Google Scholar] [CrossRef] [PubMed]
- Will, R.E.; Stokes, I.A.; Qiu, X.; Walker, M.R.; Sanders, J.O. Cobb angle progression in adolescent scoliosis begins at the intervertebral disc. Spine 2009, 34, 2782. [Google Scholar] [CrossRef] [PubMed]
- Catalano, C.; Agnese, V.; Gentile, G.; Raffa, G.M.; Pilato, M.; Pasta, S. Atlas-based evaluation of hemodynamic in ascending thoracic aortic aneurysms. Appl. Sci. 2021, 12, 394. [Google Scholar] [CrossRef]
- Benameur, S.; Mignotte, M.; Labelle, H.; De Guise, J.A. A hierarchical statistical modeling approach for the unsupervised 3-D biplanar reconstruction of the scoliotic spine. IEEE Trans. Biomed. Eng. 2005, 52, 2041–2057. [Google Scholar] [CrossRef]
- Nandi, D.; Ashour, A.S.; Samanta, S.; Chakraborty, S.; Salem, M.A.; Dey, N. Principal component analysis in medical image processing: A study. Int. J. Image Min. 2015, 1, 65–86. [Google Scholar] [CrossRef]
- Frangi, A.F.; Rueckert, D.; Schnabel, J.A.; Niessen, W.J. Automatic construction of multiple-object three-dimensional statistical shape models: Application to cardiac modeling. IEEE Trans. Med. Imaging 2002, 21, 1151–1166. [Google Scholar] [CrossRef]
- Rasmus Broa, A.K.S. Principal component analysis tutorial review. Anal Methods 2014, 6, 1–16. [Google Scholar]
- Wold, S.; Esbensen, K.; Geladi, P. Principal component analysis. Chemom. Intell. Lab. Syst. 1987, 2, 37–52. [Google Scholar] [CrossRef]
- Williams, L.J.; Abdi, H. Principal component analysis. Wiley Interdiscip. Rev. Comput. Stat. 2010, 2, 433–459. [Google Scholar]
- Cutugno, S.; Ingrassia, T.; Nigrelli, V.; Pasta, S. On the left ventricular remodeling of patients with stenotic aortic valve: A statistical shape analysis. Bioengineering 2021, 8, 66. [Google Scholar] [CrossRef]
- Klop, C. A three-dimensional statistical shape model of the growing mandible. Sci. Rep. 2021, 11, 1–10. [Google Scholar] [CrossRef] [PubMed]
- Rodero, C.; Strocchi, M.; Marciniak, M.; Longobardi, S.; Whitaker, J.; O’Neill, M.D.; Gillette, K.; Augustin, C.; Plank, G.; Vigmond, E.J.; et al. Linking statistical shape models and simulated function in the healthy adult human heart. PLoS Comput. Biol. 2021, 17, e1008851. [Google Scholar] [CrossRef] [PubMed]
- Farrar, G.; Suinesiaputra, A.; Gilbert, K.; Perry, J.C.; Hegde, S.; Marsden, A.; Young, A.A.; Omens, J.H.; McCulloch, A.D. Atlas-based ventricular shape analysis for understanding congenital heart disease. Prog. Pediatr. Cardiol. 2016, 43, 61–69. [Google Scholar] [CrossRef] [PubMed] [Green Version]
- Boisvert, J.; Cheriet, F.; Pennec, X.; Labelle, H.; Ayache, N. Principal deformations modes of articulated models for the analysis of 3D spine deformities. Electron. Lett. Comput. Vis. Image Anal. 2008, 7, 13–31. [Google Scholar] [CrossRef] [Green Version]
- Campbell, J.Q.; Petrella, A.J. Automated finite element modeling of the lumbar spine: Using a statistical shape model to generate a virtual population of models. J. Biomech. 2016, 49, 2593–2599. [Google Scholar] [CrossRef] [Green Version]
- Dai, J.; Yu, B.; Wang, Y. Statistic Model of the Spine in Three-Dimension Geometry. In Proceedings of the 2010 Third International Symposium on Information Science and Engineering, Shanghai, China, 24–26 December 2010; pp. 66–70. [Google Scholar]
- Yong, R.; Ranjitkar, S.; Lekkas, D.; Halazonetis, D.; Evans, A.; Brook, A.; Townsend, G. Three-dimensional (3D) geometric morphometric analysis of human premolars to assess sexual dimorphism and biological ancestry in Australian populations. Am. J. Phys. Anthropol. 2018, 166, 373–385. [Google Scholar] [CrossRef]
- Divya, V.; Anburajan, M. Finite element analysis of human lumbar spine. In Proceedings of the 2011 3rd International Conference on Electronics Computer Technology, Kanyakumari, India, 8–10 April 2011; Volume 3, pp. 350–354. [Google Scholar]
- Chernukha, K.V.; Daffner, R.H.; Reigel, D.H. Lumbar lordosis measurement: A new method: Versus: Cobb technique. Spine 1998, 23, 74–79. [Google Scholar] [CrossRef]
- Paroli, C.; Monticone, M.; Ferraro, C.; Negrini, S. Capitolo 1 Alterazioni della postura sagittale in età evolutiva. 2003. Available online: https://isico.it/images/uploads/ricerca/ID00039c.pdf (accessed on 18 August 2022).
- Fern, R.; Fox, D.E. Evaluation of lumbar lordosis. A prospective and retrospective study. Spine 1985, 10, 799–803. [Google Scholar] [CrossRef]
- Shea, K.G.; Stevens, P.M.; Nelson, M.; Smith, J.T.; Masters, K.S.; Yandow, S. A comparison of manual versus computer-assisted radiographic measurement: Intraobserver measurement variability for Cobb angles. Spine 1998, 23, 551–555. [Google Scholar] [CrossRef]
- Cleophas, T.J.; Zwinderman, A.H. Bayesian Pearson correlation analysis. In Modern Bayesian Statistics in Clinical Research; Springer: Cham, Switzerland, 2018; pp. 111–118. [Google Scholar]
- Morrissy, R.T.; Goldsmith, G.S.; Hall, E.C.; Kehl, D.; Cowie, G.H. Measurement of the Cobb angle on radiographs of patients who have. J. Bone Joint Surg. Am. 1990, 72, 320–327. [Google Scholar] [CrossRef] [Green Version]
- Brown, D.C.; Conzemius, M.G.; Shofer, F.S. Body weight as a predisposing factor for humeral condylar fractures, cranial cruciate rupture and intervertebral disc disease in Cocker Spaniels. Vet. Comp. Orthop. Traumatol. 1996, 9, 75–78. [Google Scholar]
- Bibby, S.R.; Jones, D.A.; Lee, R.B.; Yu, J.; Urban, J.P. The pathophysiology of the intervertebral disc. Jt. Bone Spine 2001, 68, 537–542. [Google Scholar] [CrossRef]
- Stokes, I.A.; McBride, C.A.; Aronsson, D.D.; Roughley, P.J. Metabolic effects of angulation, compression, and reduced mobility on annulus fibrosis in a model of altered mechanical environment in scoliosis. Spine Deform. 2013, 1, 161–170. [Google Scholar] [CrossRef] [PubMed] [Green Version]
- Hristova, G.I.; Jarzem, P.; Ouellet, J.A.; Roughley, P.J.; Epure, L.M.; Antoniou, J.; Mwale, F. Calcification in human intervertebral disc degeneration and scoliosis. J. Orthop. Res. 2011, 29, 1888–1895. [Google Scholar] [CrossRef] [PubMed]


| Characteristics | Patients |
|---|---|
| Age (Years) | 55.9 |
| Male (%) | 79.2 |
| Weight (Kg) | 76.9 |
| Height (m) | 1.70 |
| BMI 1 | 26.6 |
| BSA 1 | 1.90 |
| Herniatic Disc (%) | 91.7 |
| Scoliosis (%) | 54.2 |
| Medium Shape | Medium Surface (mm) | Height (mm) | Medium Perimeter (mm) |
|---|---|---|---|
| L1-L2 | 1470.21 | 10.01 | 147.56 |
| L2-L3 | 1964.22 | 10.84 | 151.19 |
| L3-L4 | 1629.95 | 11.28 | 152.85 |
| L4-L5 | 1401.37 | 10.30 | 149.47 |
| Medium Shape | Medium Surface (mm) | Height (mm) | Medium Perimeter (mm) | Width (mm) |
|---|---|---|---|---|
| L1 | 1407.3 | 27.8 | 143.9 | 40.4 |
| L2 | 1473.9 | 27.7 | 145.2 | 41.7 |
| L3 | 1555.9 | 28.1 | 148.4 | 43.8 |
| L4 | 1534.6 | 27.7 | 149.2 | 44.7 |
| L5 | 1479.5 | 30.1 | 149.0 | 45.2 |
Publisher’s Note: MDPI stays neutral with regard to jurisdictional claims in published maps and institutional affiliations. |
© 2022 by the authors. Licensee MDPI, Basel, Switzerland. This article is an open access article distributed under the terms and conditions of the Creative Commons Attribution (CC BY) license (https://creativecommons.org/licenses/by/4.0/).
Share and Cite
Sciortino, V.; Pasta, S.; Ingrassia, T.; Cerniglia, D. A Population-Based 3D Atlas of the Pathological Lumbar Spine Segment. Bioengineering 2022, 9, 408. https://doi.org/10.3390/bioengineering9080408
Sciortino V, Pasta S, Ingrassia T, Cerniglia D. A Population-Based 3D Atlas of the Pathological Lumbar Spine Segment. Bioengineering. 2022; 9(8):408. https://doi.org/10.3390/bioengineering9080408
Chicago/Turabian StyleSciortino, Vincenza, Salvatore Pasta, Tommaso Ingrassia, and Donatella Cerniglia. 2022. "A Population-Based 3D Atlas of the Pathological Lumbar Spine Segment" Bioengineering 9, no. 8: 408. https://doi.org/10.3390/bioengineering9080408