
Brimonidine Modulates the ROCK1 Signaling Effects on Adipogenic Differentiation in 2D and 3D 3T3-L1 Cells


 , , , , and
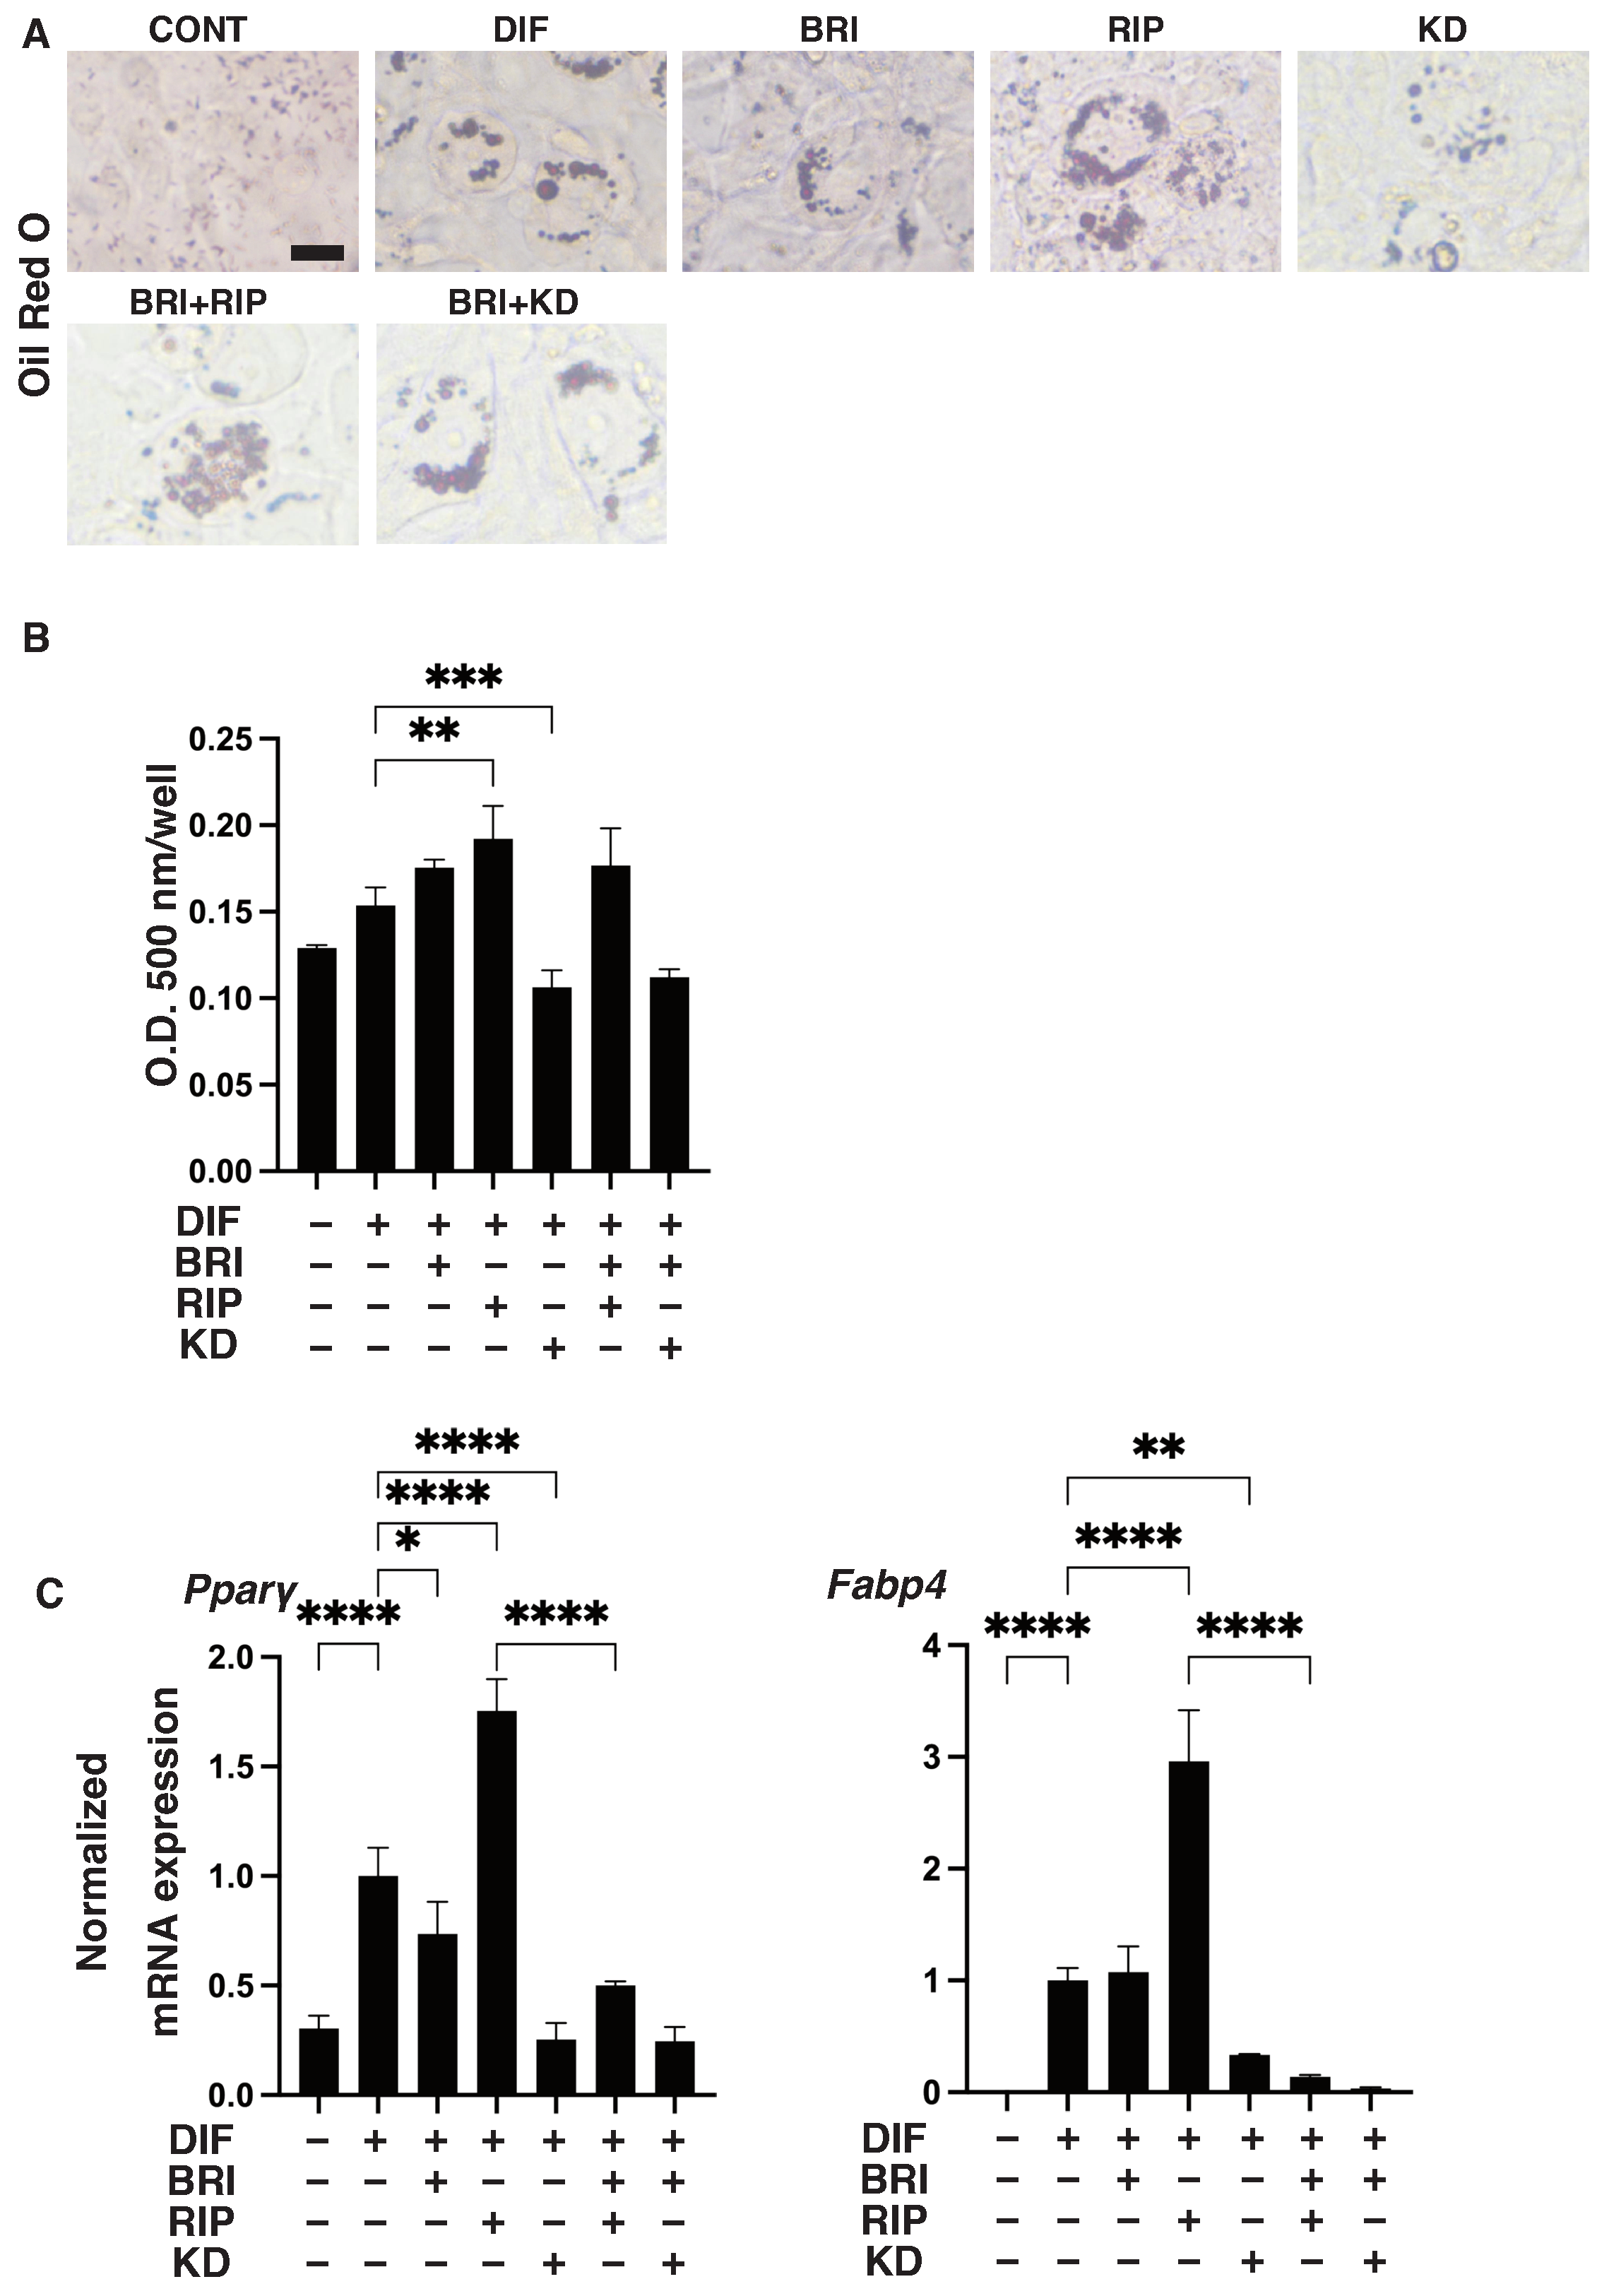
Abstract
:1. Introduction
2. Materials and Methods
2.1. 2D and 3D Cultures and DIF+ (Adipogenic Differentiation) of 3T3-L1 Cells
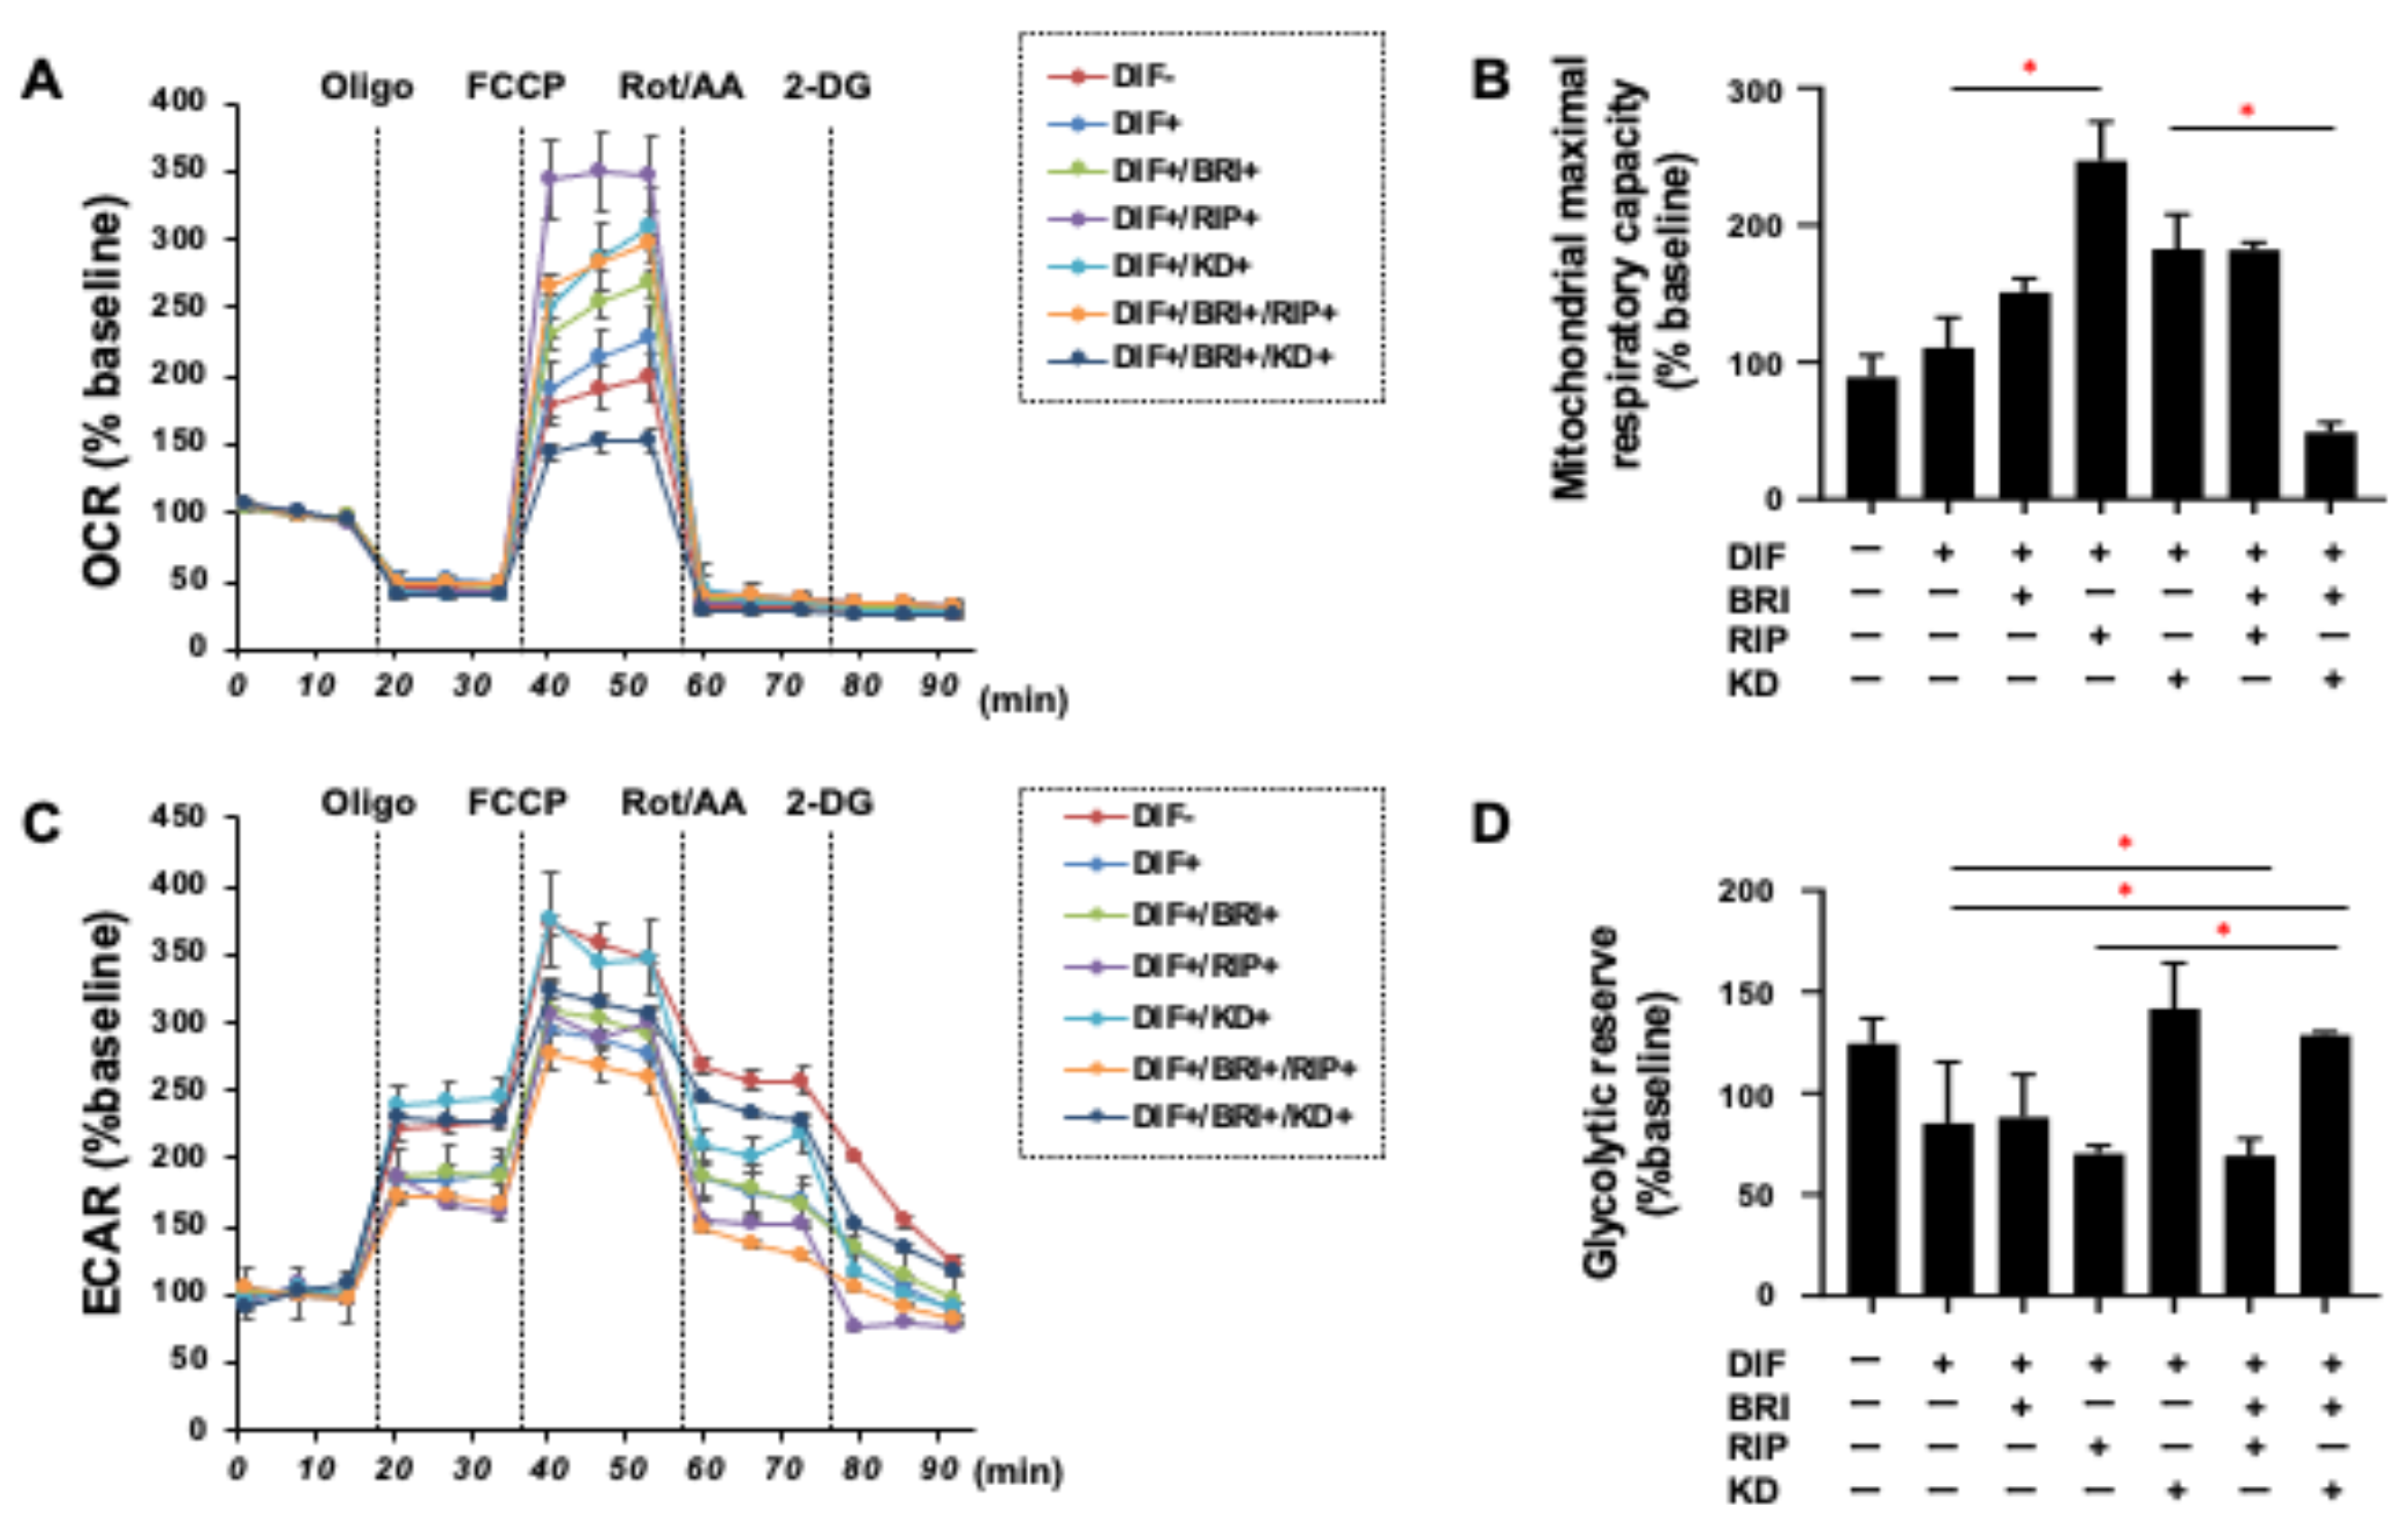
2.2. Measurement of Real-Time Cellular Metabolic Functions
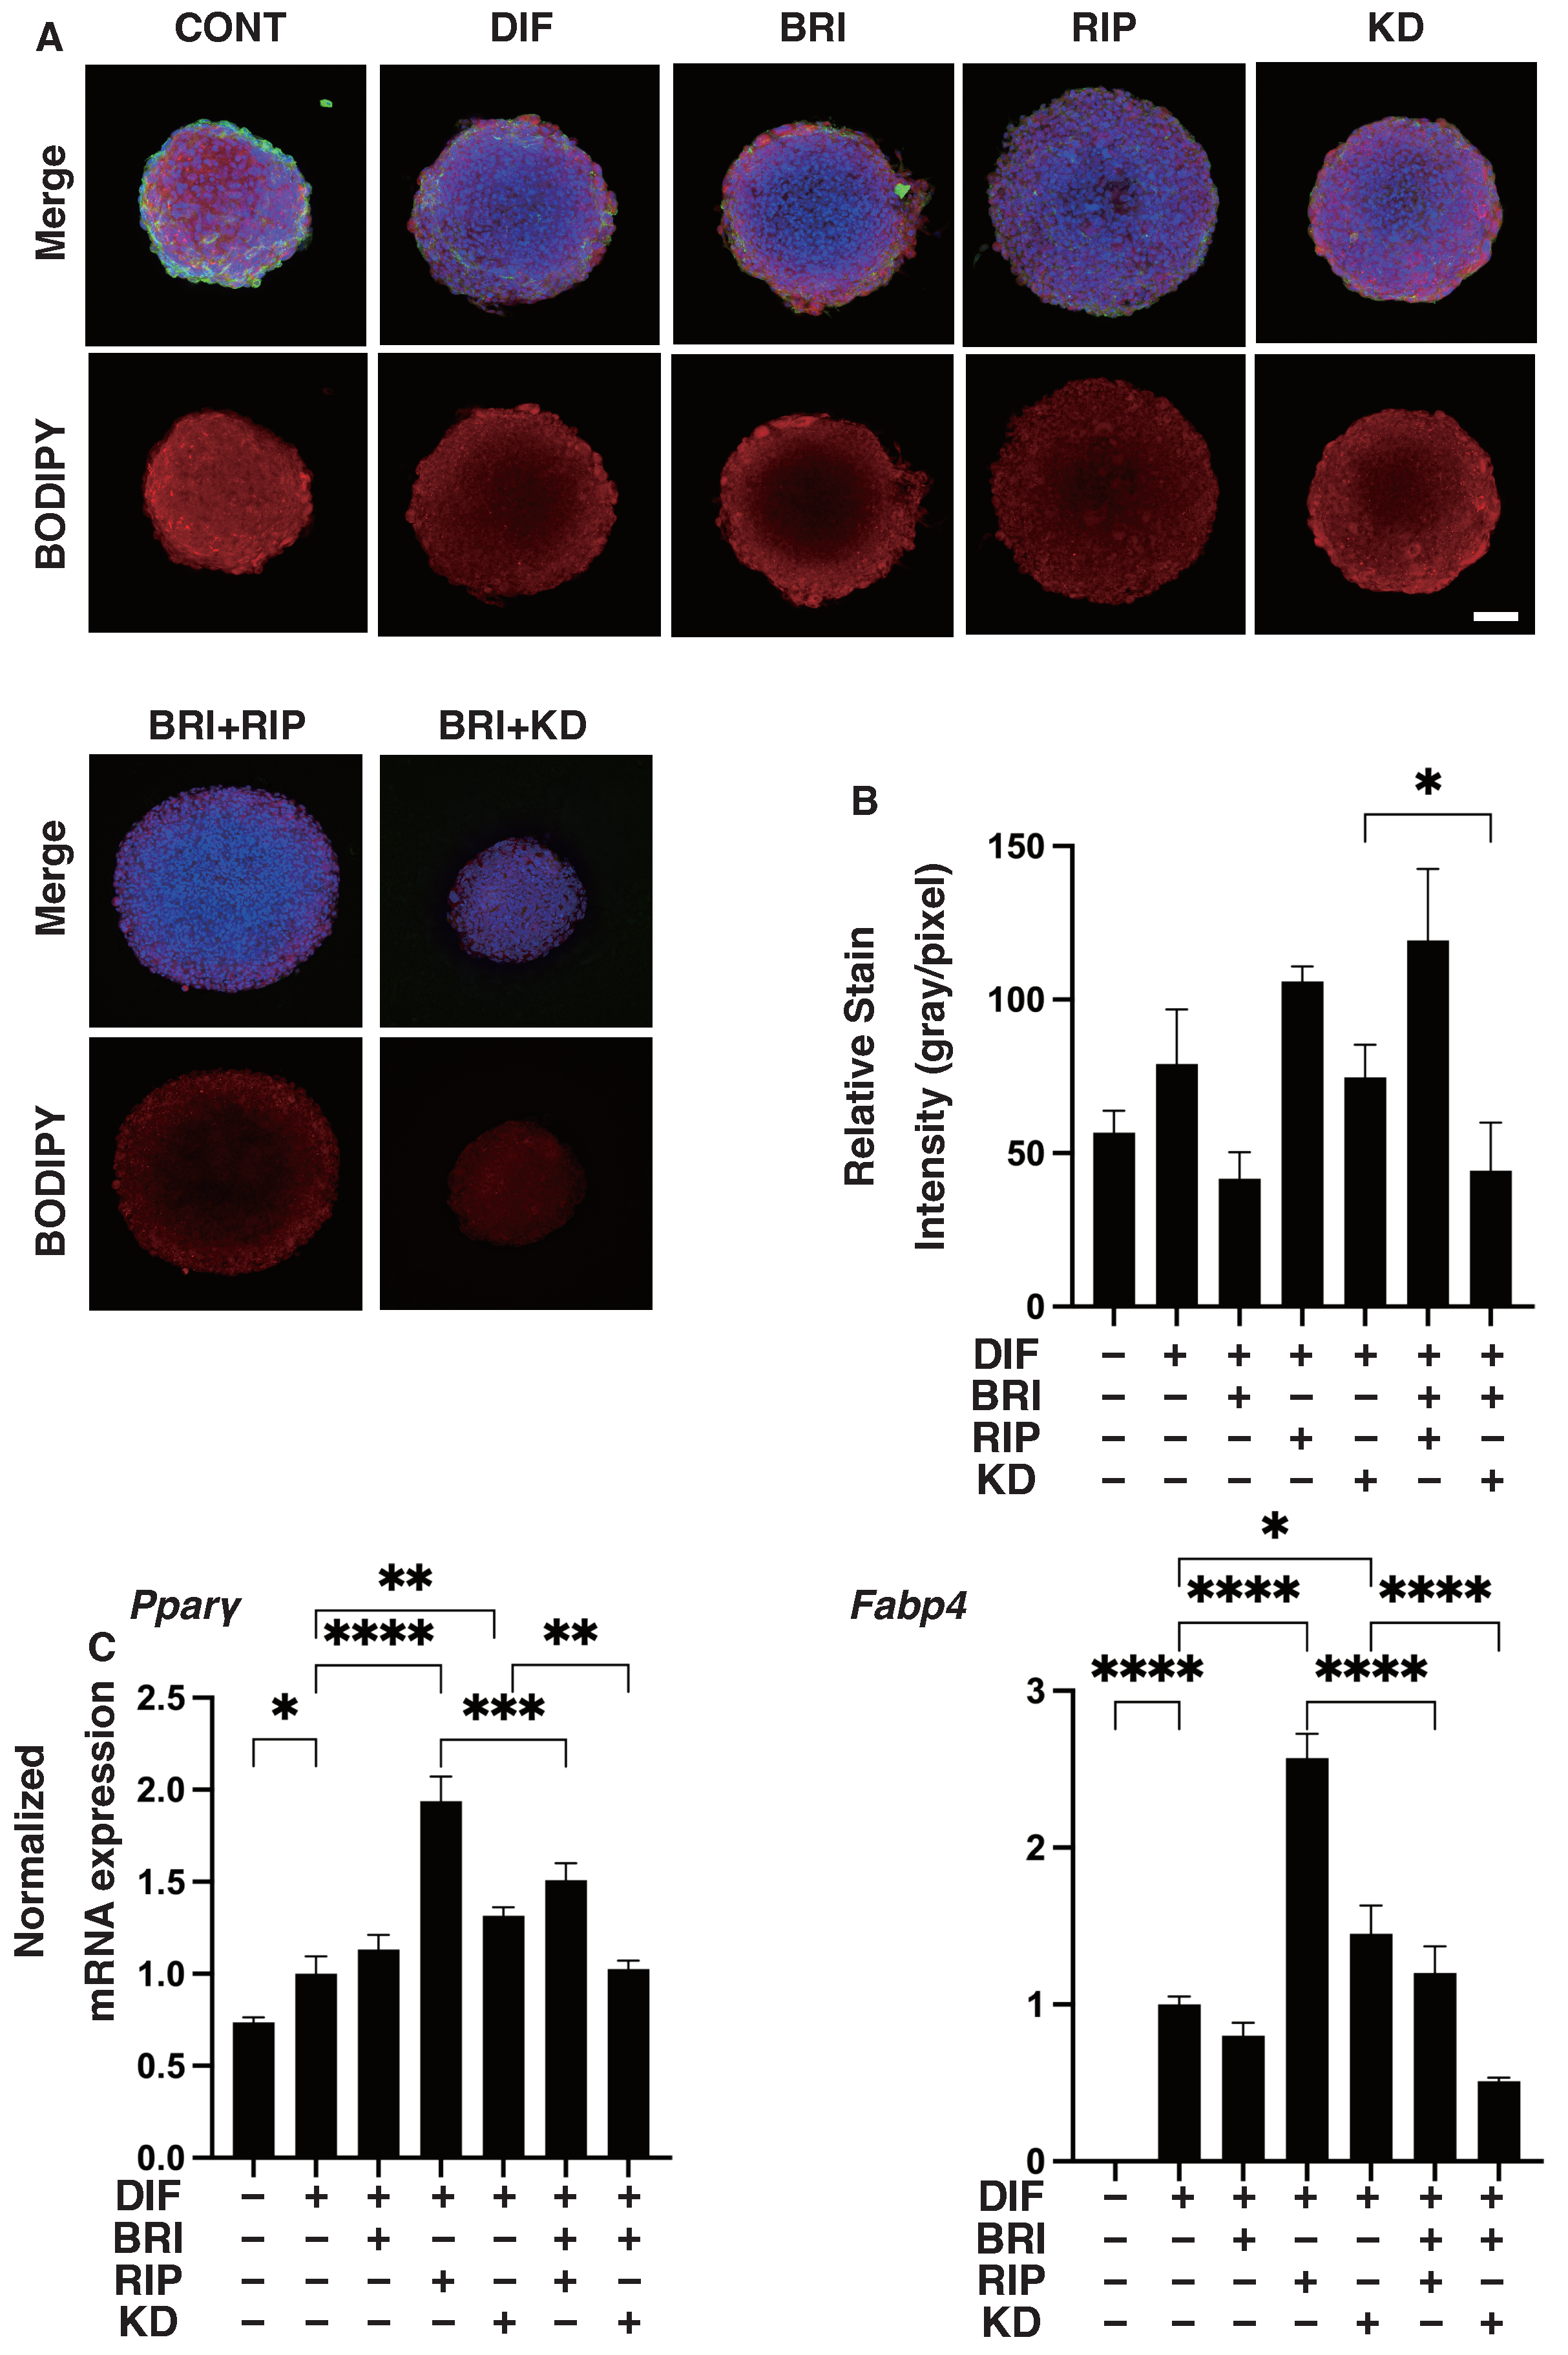
2.3. Lipid Staining of the 2D and 3D 3T3-L1 Cells
2.4. Physical Property (Size and Stiffness) Measurements of the 3D 3T3-L1 Spheroids
2.5. Immunocytechemictry of 3T3-L1 Cells
2.6. Other Analytical Methods
3. Results
4. Discussion
Supplementary Materials
Author Contributions
Funding
Institutional Review Board Statement
Informed Consent Statement
Data Availability Statement
Conflicts of Interest
References
- Weinreb, R.N.; Khaw, P.T. Primary open-angle glaucoma. Lancet 2004, 363, 1711–1720. [Google Scholar] [CrossRef]
- Quigley, H.A.; Broman, A.T. The number of people with glaucoma worldwide in 2010 and 2020. Br. J. Ophthalmol. 2006, 90, 262–267. [Google Scholar] [CrossRef] [Green Version]
- Caprioli, J.; Coleman, A.L. Blood Pressure, Perfusion Pressure, and Glaucoma. Am. J. Ophthalmol. 2010, 149, 704–712. [Google Scholar] [CrossRef]
- van der Valk, R.; Webers, C.A.; Schouten, J.S.; Zeegers, M.P.; Hendrikse, F.; Prins, M.H. Intraocular Pressure–Lowering Effects of All Commonly Used Glaucoma Drugs: A Meta-analysis of Randomized Clinical Trials. Ophthalmology 2005, 112, 1177–1185. [Google Scholar] [CrossRef]
- Li, T.; Lindsley, K.; Rouse, B.; Hong, H.; Shi, Q.; Friedman, D.S.; Wormald, R.; Dickersin, K. Comparative Effectiveness of First-Line Medications for Primary Open-Angle Glaucoma: A Systematic Review and Network Meta-analysis. Ophthalmology 2016, 123, 129–140. [Google Scholar] [CrossRef] [Green Version]
- Filippopoulos, T.; Paula, J.; Torun, N.; Hatton, M.P.; Pasquale, L.R.; Grosskreutz, C.L. Periorbital Changes Associated with Topical Bimatoprost. Ophthalmic Plast. Reconstr. Surg. 2008, 24, 302–307. [Google Scholar] [CrossRef]
- Park, J.; Cho, H.K.; Moon, J.-I. Changes to upper eyelid orbital fat from use of topical bimatoprost, travoprost, and latanoprost. Jpn. J. Ophthalmol. 2011, 55, 22–27. [Google Scholar] [CrossRef]
- Tappeiner, C.; Perren, B.; Iliev, M.E.; Frueh, B.E.; Goldblum, D. Orbital fat atrophy in glaucoma patients treated with topical bimatoprost—Can bimatoprost cause enophthalmos? Klin. Monbl. Augenheilkd. 2008, 225, 443–445. [Google Scholar] [CrossRef]
- Inoue, K.; Shiokawa, M.; Wakakura, M.; Tomita, G. Deepening of the Upper Eyelid Sulcus Caused by 5 Types of Prostaglandin Analogs. J. Glaucoma 2013, 22, 626–631. [Google Scholar] [CrossRef]
- Jayaprakasam, A.; Ghazi-Nouri, S. Periorbital Fat Atrophy—An Unfamiliar Side Effect of Prostaglandin Analogues. Orbit 2010, 29, 357–359. [Google Scholar] [CrossRef]
- Miller, C.W.; Casimir, D.A.; Ntambi, J.M. The mechanism of inhibition of 3T3-L1 preadipocyte differentiation by prostaglandin F2alpha. Endocrinology 1996, 137, 5641–5650. [Google Scholar] [CrossRef]
- Tung, Y.C.; Hsiao, A.Y.; Allen, S.G.; Torisawa, Y.S.; Ho, M.; Takayama, S. High-throughput 3D spheroid culture and drug testing using a 384 hanging drop array. Analyst 2010, 136, 473–478. [Google Scholar] [CrossRef]
- Ida, Y.; Hikage, F.; Itoh, K.; Ida, H.; Ohguro, H. Prostaglandin F2alpha agonist-induced suppression of 3T3-L1 cell adipogenesis affects spatial formation of extra-cellular matrix. Sci. Rep. 2020, 10, 7958. [Google Scholar] [CrossRef]
- Itoh, K.; Hikage, F.; Ida, Y.; Ohguro, H. Prostaglandin F2alpha Agonists Negatively Modulate the Size of 3D Organoids from Primary Human Orbital Fibroblasts. Investig. Opthalmol. Vis. Sci. 2020, 61, 13. [Google Scholar] [CrossRef]
- Sarjeant, K.; Stephens, J.M. Adipogenesis. Cold Spring Harb. Perspect. Biol. 2012, 4, a008417. [Google Scholar] [CrossRef] [Green Version]
- Rahman, M.S. Prostacyclin: A major prostaglandin in the regulation of adipose tissue development. J. Cell. Physiol. 2019, 234, 3254–3262. [Google Scholar] [CrossRef]
- Cowherd, R.M.; Lyle, R.E.; McGehee, R.E., Jr. Molecular regulation of adipocyte differentiation. Semin. Cell Dev. Biol. 1999, 10, 3–10. [Google Scholar] [CrossRef]
- Kameda, T.; Inoue, T.; Inatani, M.; Fujimoto, T.; Honjo, M.; Kasaoka, N.; Inoue-Mochita, M.; Yoshimura, N.; Tanihara, H. The Effect of Rho-Associated Protein Kinase Inhibitor on Monkey Schlemm’s Canal Endothelial Cells. Investig. Opthalmol. Vis. Sci. 2012, 53, 3092–3103. [Google Scholar] [CrossRef]
- Van de Velde, S.; Van Bergen, T.; Sijnave, D.; Hollanders, K.; Castermans, K.; Defert, O.; Leysen, D.; Vandewalle, E.; Moons, L.; Stalmans, I. AMA0076, a Novel, Locally Acting Rho Kinase Inhibitor, Potently Lowers Intraocular Pressure in New Zealand White Rabbits with Minimal Hyperemia. Investig. Opthalmol. Vis. Sci. 2014, 55, 1006–1016. [Google Scholar] [CrossRef] [Green Version]
- Inoue, T.; Tanihara, H. Rho-associated kinase inhibitors: A novel glaucoma therapy. Prog. Retin. Eye Res. 2013, 37, 1–12. [Google Scholar] [CrossRef]
- Tanihara, H.; Inoue, T.; Yamamoto, T.; Kuwayama, Y.; Abe, H.; Suganami, H.; Araie, M.; K-115 Clinical Study Group. Intra-ocular pressure-lowering effects of a Rho kinase inhibitor, ripasudil (K-115), over 24 h in primary open-angle glaucoma and ocular hypertension: A randomized, open-label, crossover study. Acta Ophthalmol. 2015, 93, e254–e260. [Google Scholar] [CrossRef] [PubMed]
- Ida, Y.; Hikage, F.; Ohguro, H. ROCK inhibitors enhance the production of large lipid-enriched 3D organoids of 3T3-L1 cells. Sci. Rep. 2021, 11, 5479. [Google Scholar] [CrossRef] [PubMed]
- Leung, T.; Chen, X.Q.; Manser, E.; Lim, L. The p160 RhoA-binding kinase ROK alpha is a member of a kinase family and is involved in the reorganization of the cytoskeleton. Mol. Cell. Biol. 1996, 16, 5313–5327. [Google Scholar] [CrossRef] [PubMed] [Green Version]
- Nakagawa, O.; Fujisawa, K.; Ishizaki, T.; Saito, Y.; Nakao, K.; Narumiya, S. ROCK-I and ROCK-II, two isoforms of Rho-associated coiled-coil forming protein serine/threonine kinase in mice. FEBS Lett. 1996, 392, 189–193. [Google Scholar] [CrossRef] [Green Version]
- Ramírez, C.; Cáceres-del-Carpio, J.; Chu, J.; Chu, J.; Moustafa, M.T.; Chwa, M.; Limb, G.A.; Kuppermann, B.D.; Kenney, M.C. Brimonidine Can Prevent In Vitro Hydroquinone Damage on Retinal Pigment Epithelium Cells and Retinal Müller Cells. J. Ocul. Pharmacol. Ther. 2016, 32, 102–108. [Google Scholar] [CrossRef]
- Hikage, F.; Atkins, S.; Kahana, A.; Smith, T.J.; Chun, T.-H. HIF2A–LOX Pathway Promotes Fibrotic Tissue Remodeling in Thyroid-Associated Orbitopathy. Endocrinology 2019, 160, 20–35. [Google Scholar] [CrossRef] [Green Version]
- Itoh, K.; Ida, Y.; Ohguro, H.; Hikage, F. Prostaglandin F2α agonists induced enhancement in collagen1 expression is involved in the pathogenesis of the deepening of upper eyelid sulcus. Sci. Rep. 2021, 11, 9002. [Google Scholar] [CrossRef]
- Ota, C.; Ida, Y.; Ohguro, H.; Hikage, F. ROCK inhibitors beneficially alter the spatial configuration of TGFβ2-treated 3D organoids from a human trabecular meshwork (HTM). Sci. Rep. 2020, 10, 20292. [Google Scholar] [CrossRef]
- Gregoire, F.M.; Smas, C.M.; Sul, H.S. Understanding Adipocyte Differentiation. Physiol. Rev. 1998, 78, 783–809. [Google Scholar] [CrossRef] [Green Version]
- Grigoras, A.; Amalinei, C.; Balan, R.A.; Giusca, S.E.; Avadanei, E.R.; Lozneanu, L.; Caruntu, I.D. Adipocytes spectrum—From homeostasia to obesity and its associated pathology. Ann. Anat. 2018, 219, 102–120. [Google Scholar] [CrossRef]
- Choi, J.H.; Gimble, J.M.; Lee, K.; Marra, K.; Rubin, J.P.; Yoo, J.J.; Vunjak-Novakovic, G.; Kaplan, D.L. Adipose Tissue Engineering for Soft Tissue Regeneration. Tissue Eng. Part B Rev. 2010, 16, 413–426. [Google Scholar] [CrossRef] [PubMed]
- Fujimori, K.; Aritake, K.; Urade, Y. A Novel Pathway to Enhance Adipocyte Differentiation of 3T3-L1 Cells by Up-regulation of Lipocalin-type Prostaglandin D Synthase Mediated by Liver X Receptor-activated Sterol Regulatory Element-binding Protein-1c. J. Biol. Chem. 2007, 282, 18458–18466. [Google Scholar] [CrossRef] [Green Version]
- Rosen, E.D.; Spiegelman, B.M. Molecular Regulation of Adipogenesis. Annu. Rev. Cell Dev. Biol. 2000, 16, 145–171. [Google Scholar] [CrossRef] [PubMed]
- Taketani, Y.; Yamagishi, R.; Fujishiro, T.; Igarashi, M.; Sakata, R.; Aihara, M. Activation of the Prostanoid FP Receptor Inhibits Adipogenesis Leading to Deepening of the Upper Eyelid Sulcus in Prostaglandin-Associated Periorbitopathy. Investig. Ophthalmol. Vis. Sci. 2014, 55, 1269–1276. [Google Scholar] [CrossRef] [Green Version]
- Ida, Y.; Watanabe, M.; Umetsu, A.; Ohguro, H.; Hikage, F. Addition of EP2 agonists to an FP agonist additively and synergistically modulates adipogenesis and the physical properties of 3D 3T3-L1 sphenoids. Prostaglandins Leukot. Essent. Fat. Acids 2021, 171, 102315. [Google Scholar] [CrossRef]
- Ichioka, H.; Ida, Y.; Watanabe, M.; Ohguro, H.; Hikage, F. Prostaglandin F2α and EP2 agonists, and a ROCK inhibitor modulate the formation of 3D organoids of Grave’s orbitopathy related human orbital fibroblasts. Exp. Eye Res. 2021, 205, 108489. [Google Scholar] [CrossRef] [PubMed]
- Diep, D.T.V.; Hong, K.; Khun, T.; Zheng, M.; Ul-Haq, A.; Jun, H.-S.; Kim, Y.-B.; Chun, K.-H. Anti-adipogenic effects of KD025 (SLx-2119), a ROCK2-specific inhibitor, in 3T3-L1 cells. Sci. Rep. 2018, 8, 2477. [Google Scholar] [CrossRef] [Green Version]
- Julian, L.; Olson, M.F. Rho-associated coiled-coil containing kinases (ROCK): Structure, regulation, and functions. Small GTPases 2014, 5, e29846. [Google Scholar] [CrossRef]
- Lafontan, M.; Berlan, M. Fat Cell alpha2-Adrenoceptors: The Regulation of Fat CellFunction and Lipolysis. Endocr. Rev. 1995, 16, 716–738. [Google Scholar] [CrossRef]
- Lafontan, M.; Berlan, M. Characterization of physiological agonist selectivity of human fat cell alpha2-adrenoceptors: Adrenaline is the major stimulant of the alpha2-adrenoceptors. Eur. J. Pharmacol. 1982, 82, 107–111. [Google Scholar] [CrossRef]
- Berlan, M.; Lafontan, M. The alpha 2-adrenergic receptor of human fat cells: Comparative study of alpha 2-adrenergic radi-oligand binding and biological response. J. Physiol. 1982, 78, 279–287. [Google Scholar]
- Polak, J.; Moro, C.; Bessière, D.; Hejnova, J.; Marquès, M.A.; Bajzova, M.; Lafontan, M.; Crampes, F.; Berlan, M.; Stich, V. Acute exposure to long-chain fatty acids impairs alpha2-adrenergic receptor-mediated antilipolysis in human adipose tissue. J. Lipid Res. 2007, 48, 2236–2246. [Google Scholar] [CrossRef] [PubMed] [Green Version]
- Gesta, S.; Hejnova, J.; Berlan, M.; Daviaud, D.; Crampes, F.; Stich, V.; Valet, P.; Saulnier-Blache, J.-S. In Vitro and In Vivo Impairment of alpha2-Adrenergic Receptor-Dependent Antilipolysis by Fatty Acids in Human Adipose Tissue. Horm. Metab. Res. 2001, 33, 701–707. [Google Scholar] [CrossRef] [PubMed] [Green Version]
- Valet, P.; Pages, C.; Jeanneton, O.; Daviaud, D.; Barbe, P.; Record, M.; Saulnier-Blache, J.S.; Lafontan, M. Alpha2-adrenergic receptor-mediated release of lysophosphatidic acid by adipocytes. A paracrine signal for preadipocyte growth. J. Clin. Investig. 1998, 101, 1431–1438. [Google Scholar] [CrossRef]
- Goupil, E.; Tassy, D.; Bourguet, C.; Quiniou, C.; Wisehart, V.; Pétrin, D.; Le Gouill, C.; Devost, D.; Zingg, H.H.; Bouvier, M.; et al. A Novel Biased Allosteric Compound Inhibitor of Parturition Selectively Impedes the Prostaglandin F2alpha-mediated Rho/ROCK Signaling Pathway. J. Biol. Chem. 2010, 285, 25624–25636. [Google Scholar] [CrossRef] [Green Version]
- Kurokawa, K.; Matsuda, M. Localized RhoA Activation as a Requirement for the Induction of Membrane Ruffling. Mol. Biol. Cell 2005, 16, 4294–4303. [Google Scholar] [CrossRef] [Green Version]
- Panta, C.R.; Ruisanchez, E.; Móré, D.; Dancs, P.T.; Balogh, A.; Fülöp, A.; Kerék, M.; Proia, R.L.; Offermanns, S.; Tigyi, G.J.; et al. Sphingosine-1-Phosphate Enhances α(1)-Adrenergic Vasoconstriction via S1P2-G(12/13)-ROCK Mediated Signaling. Int. J. Mol. Sci. 2019, 20, 6361. [Google Scholar] [CrossRef] [Green Version]
- Hikage, F.; Ichioka, H.; Watanabe, M.; Umetsu, A.; Ohguro, H.; Ida, Y. Addition of ROCK inhibitors to prostaglandin derivative (PG) synergistically affects adipogenesis of the 3D spheroids of human orbital fibroblasts (HOFs). Hum. Cell 2022, 35, 125–132. [Google Scholar] [CrossRef]
- Riento, K.; Ridley, A.J. Rocks: Multifunctional kinases in cell behaviour. Nat. Rev. Mol. Cell Biol. 2003, 4, 446–456. [Google Scholar] [CrossRef]
- Heymsfield, S.B.; Wadden, T.A. Mechanisms, Pathophysiology, and Management of Obesity. N. Engl. J. Med. 2017, 376, 254–266. [Google Scholar] [CrossRef]
- Elia, G.; Fallahi, P.; Ragusa, F.; Paparo, S.R.; Mazzi, V.; Benvenga, S.; Antonelli, A.; Ferrari, S.M. Precision Medicine in Graves’ Disease and Ophthalmopathy. Front. Pharmacol. 2021, 12, 754386. [Google Scholar] [CrossRef] [PubMed]
- Ohguro, H.; Ida, Y.; Hikage, F.; Umetsu, A.; Ichioka, H.; Watanabe, M.; Furuhashi, M. STAT3 Is the Master Regulator for the Forming of 3D Spheroids of 3T3-L1 Preadipocytes. Cells 2022, 11, 300. [Google Scholar] [CrossRef] [PubMed]


Publisher’s Note: MDPI stays neutral with regard to jurisdictional claims in published maps and institutional affiliations. |
© 2022 by the authors. Licensee MDPI, Basel, Switzerland. This article is an open access article distributed under the terms and conditions of the Creative Commons Attribution (CC BY) license (https://creativecommons.org/licenses/by/4.0/).
Share and Cite
Umetsu, A.; Ida, Y.; Sato, T.; Watanabe, M.; Tsugeno, Y.; Furuhashi, M.; Hikage, F.; Ohguro, H. Brimonidine Modulates the ROCK1 Signaling Effects on Adipogenic Differentiation in 2D and 3D 3T3-L1 Cells. Bioengineering 2022, 9, 327. https://doi.org/10.3390/bioengineering9070327
Umetsu A, Ida Y, Sato T, Watanabe M, Tsugeno Y, Furuhashi M, Hikage F, Ohguro H. Brimonidine Modulates the ROCK1 Signaling Effects on Adipogenic Differentiation in 2D and 3D 3T3-L1 Cells. Bioengineering. 2022; 9(7):327. https://doi.org/10.3390/bioengineering9070327
Chicago/Turabian StyleUmetsu, Araya, Yosuke Ida, Tatsuya Sato, Megumi Watanabe, Yuri Tsugeno, Masato Furuhashi, Fumihito Hikage, and Hiroshi Ohguro. 2022. "Brimonidine Modulates the ROCK1 Signaling Effects on Adipogenic Differentiation in 2D and 3D 3T3-L1 Cells" Bioengineering 9, no. 7: 327. https://doi.org/10.3390/bioengineering9070327