
An α2-Adrenergic Agonist, Brimonidine, Beneficially Affects the TGF-β2-Treated Cellular Properties in an In Vitro Culture Model

 ,
,  , , , , and
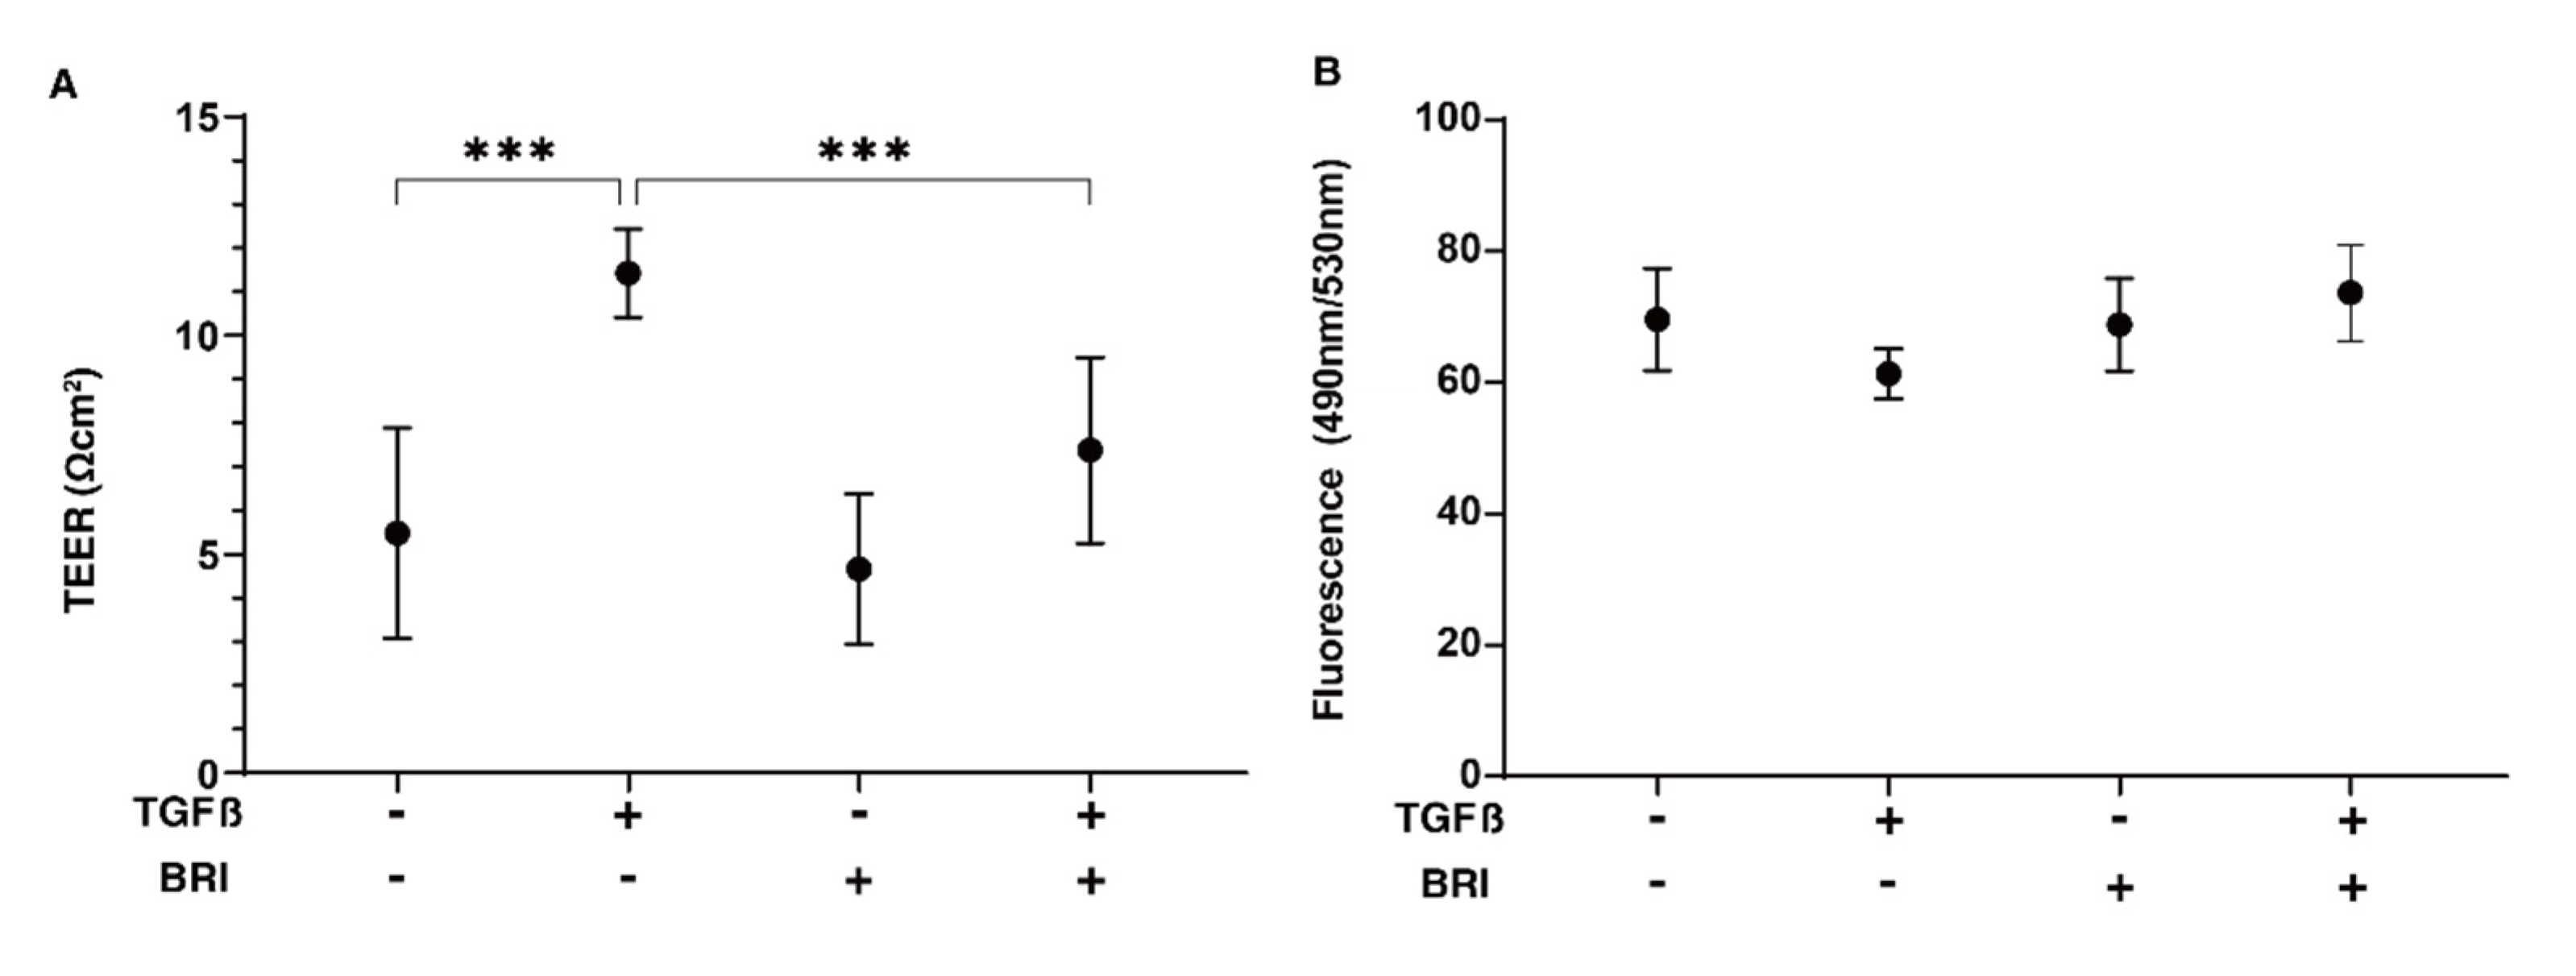
Abstract
:1. Introduction
2. Materials and Methods
2.1. Two-Dimensional and Three-Dimensional Cultures of Human Trabecular Meshwork (HTM) Cells
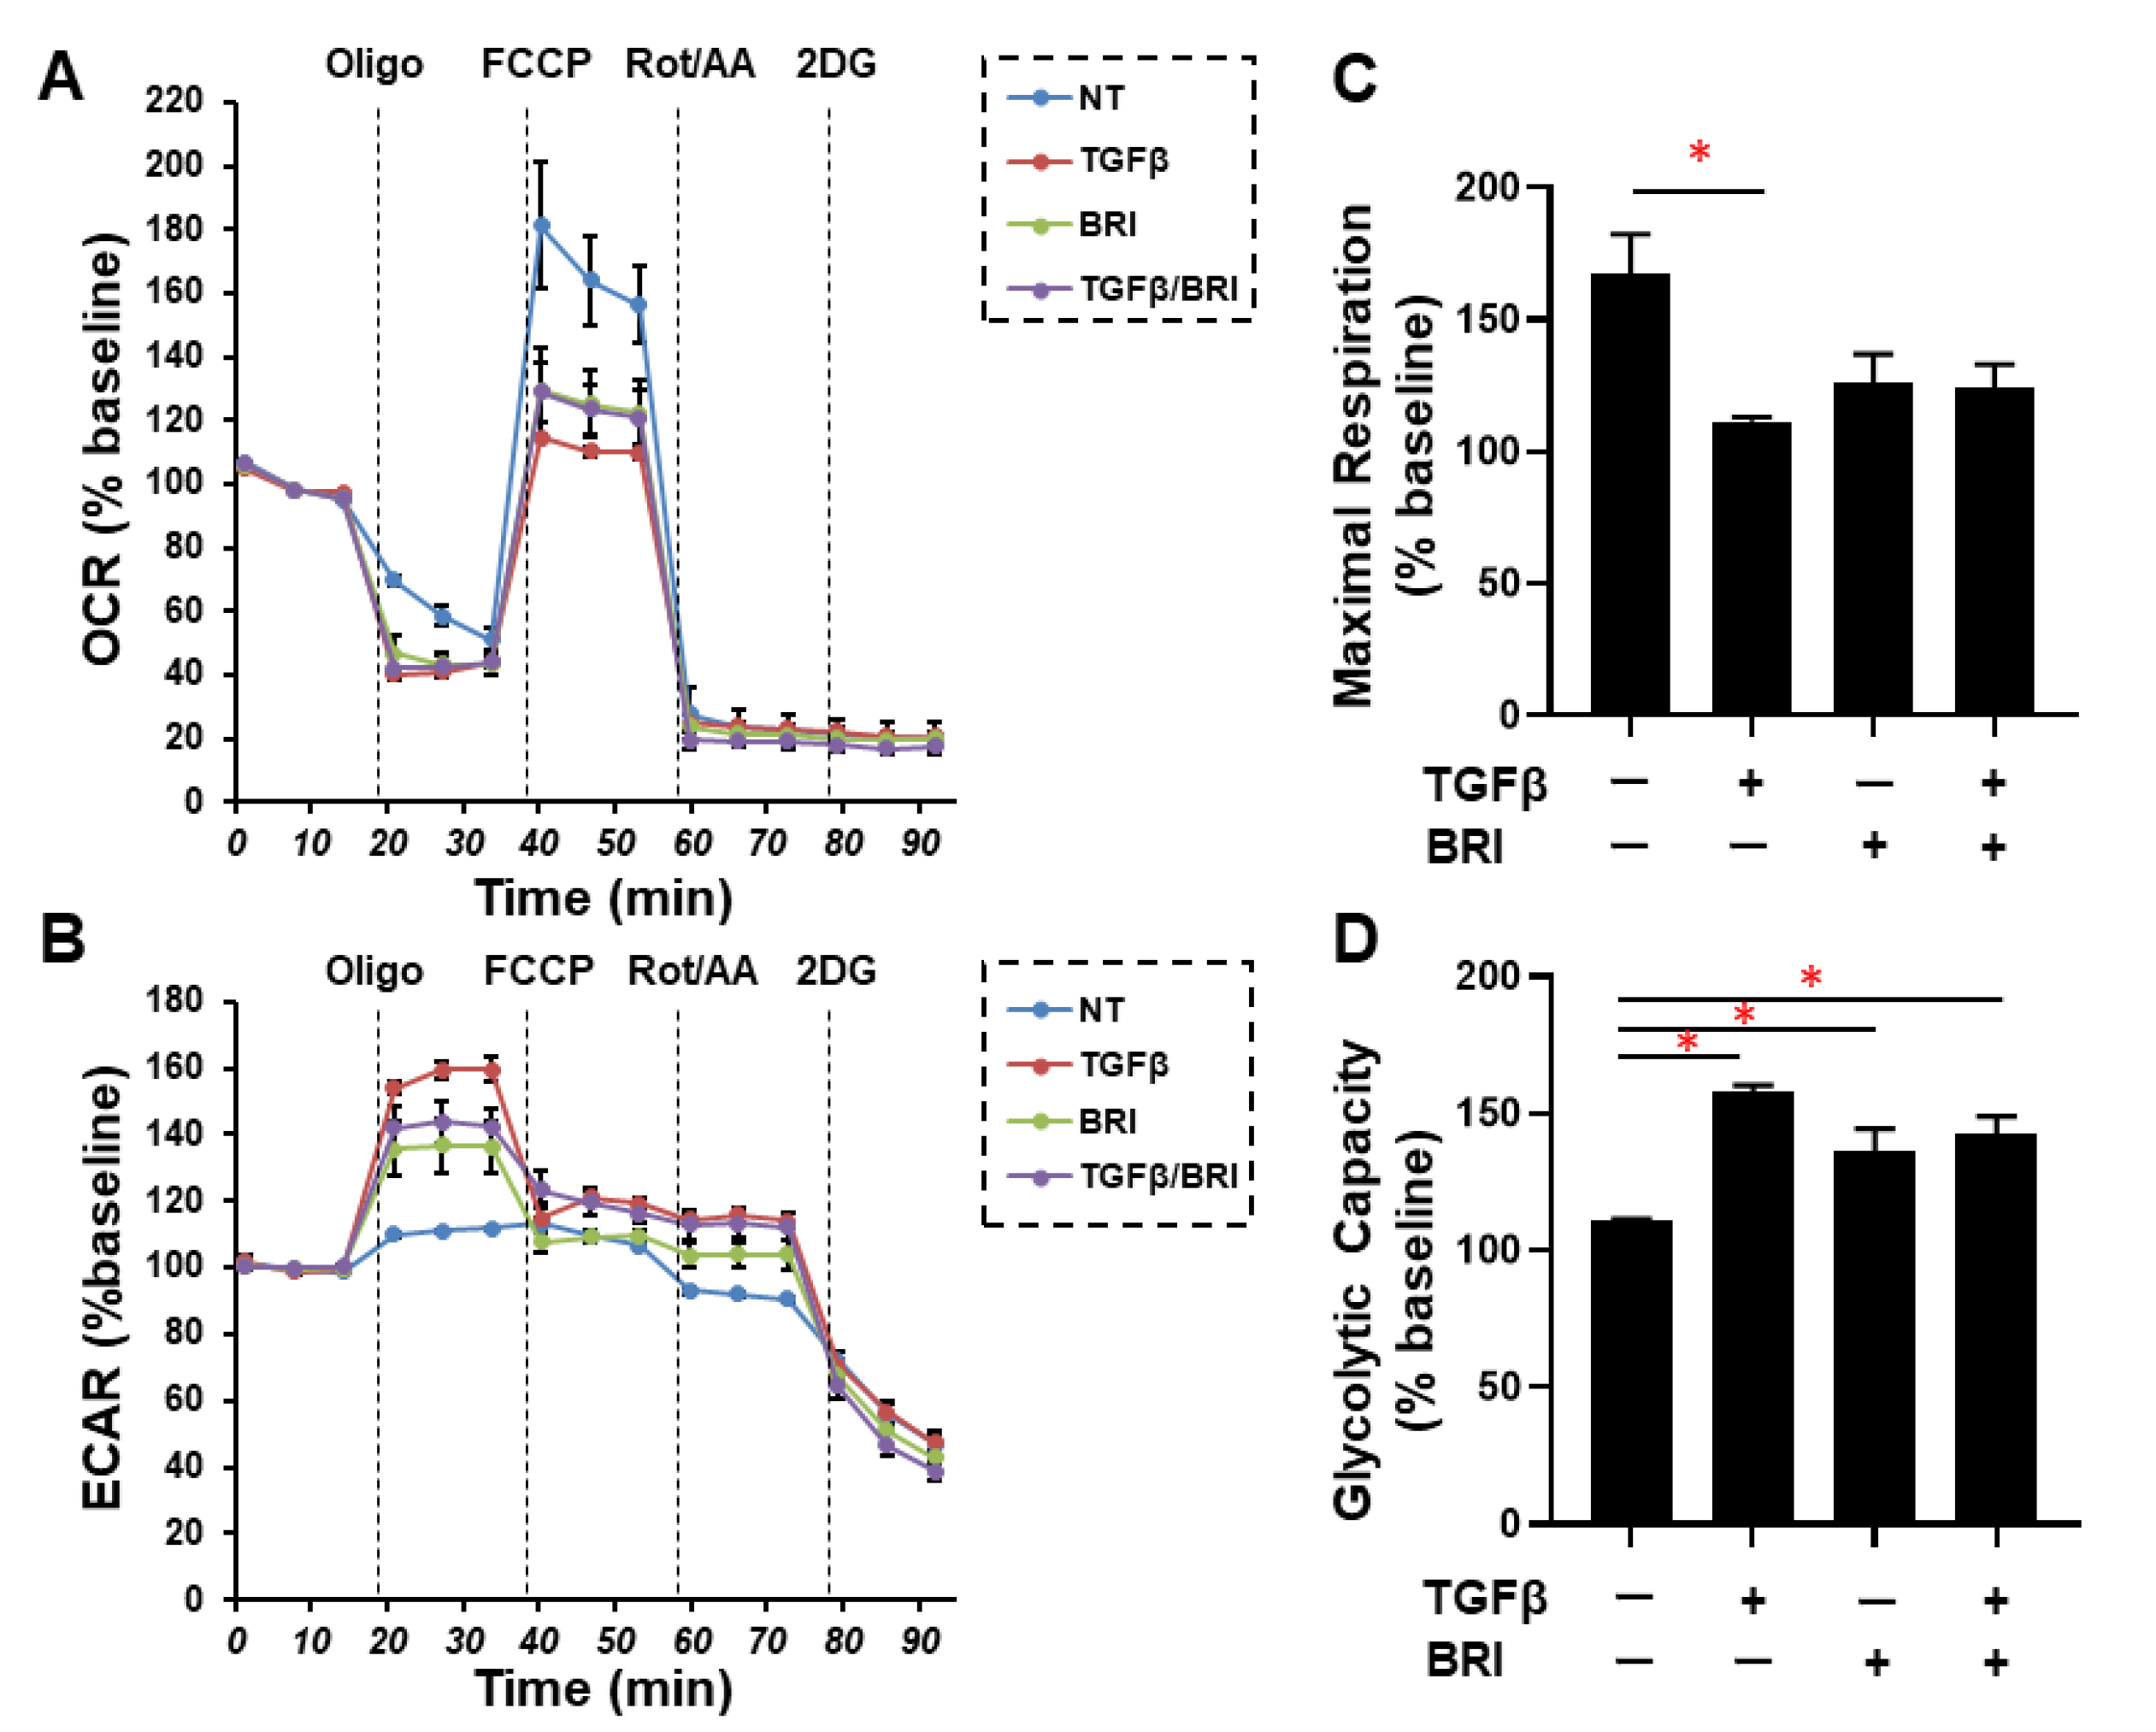
2.2. Barrier Function and Real-Time Cellular Metabolic Function Analyses of the 2D HTM Cells
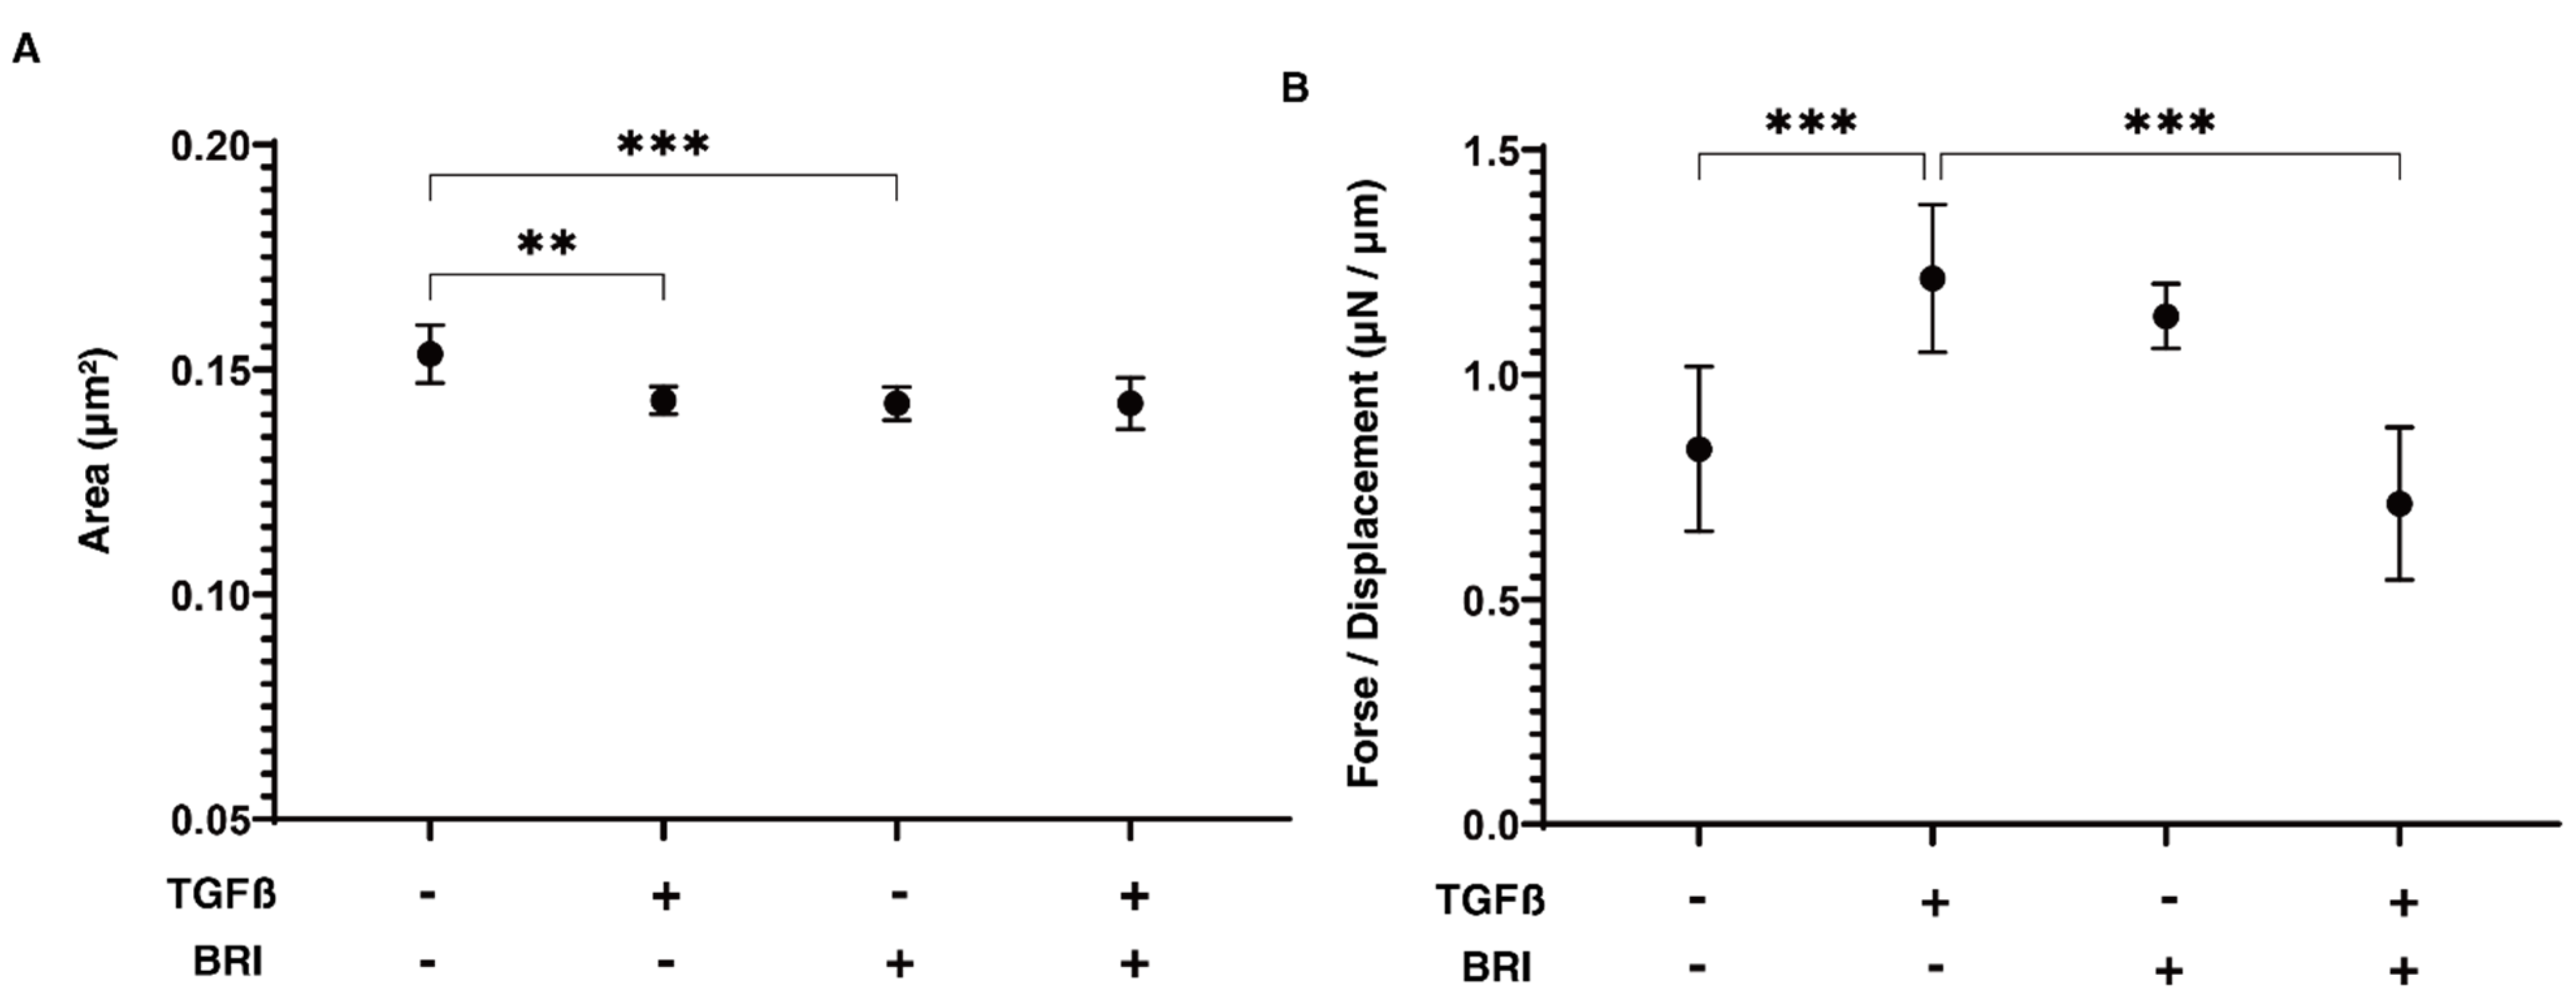
2.3. Measurements of the Largeness and Hardness of 3D HTM Spheroids
2.4. Immunocytochemistry of HTM Cells
2.5. Other Analyses
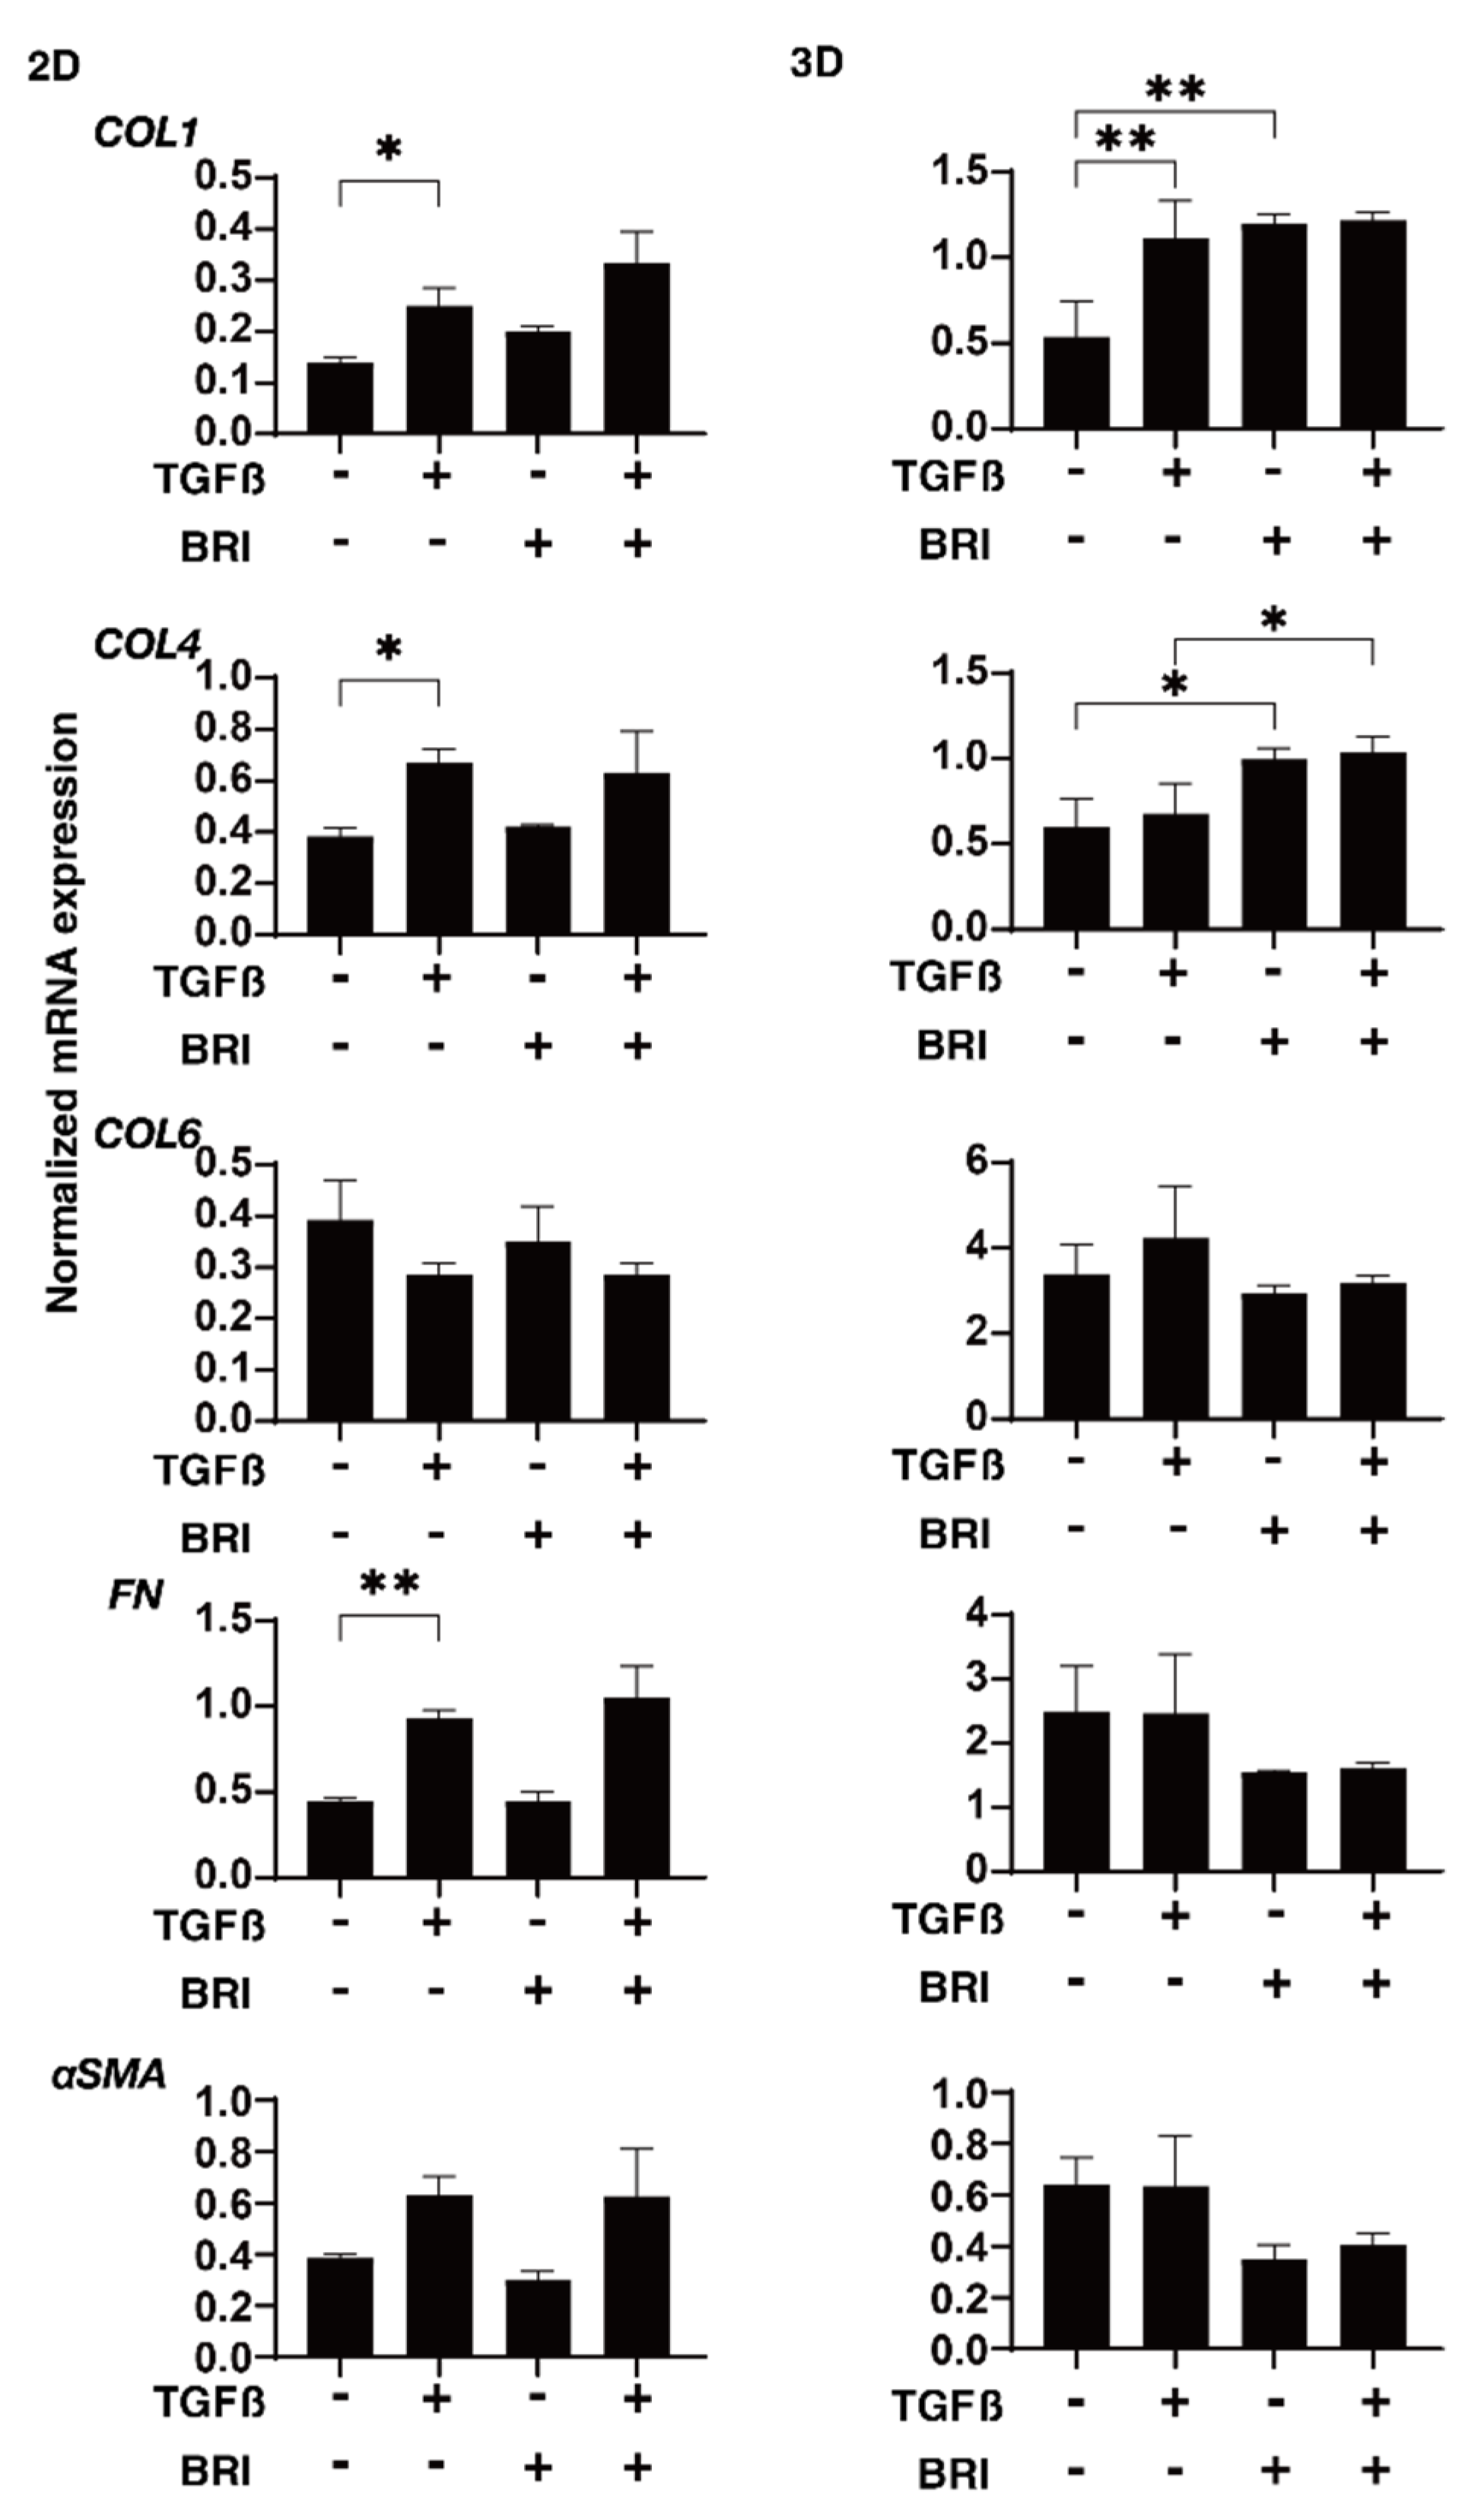
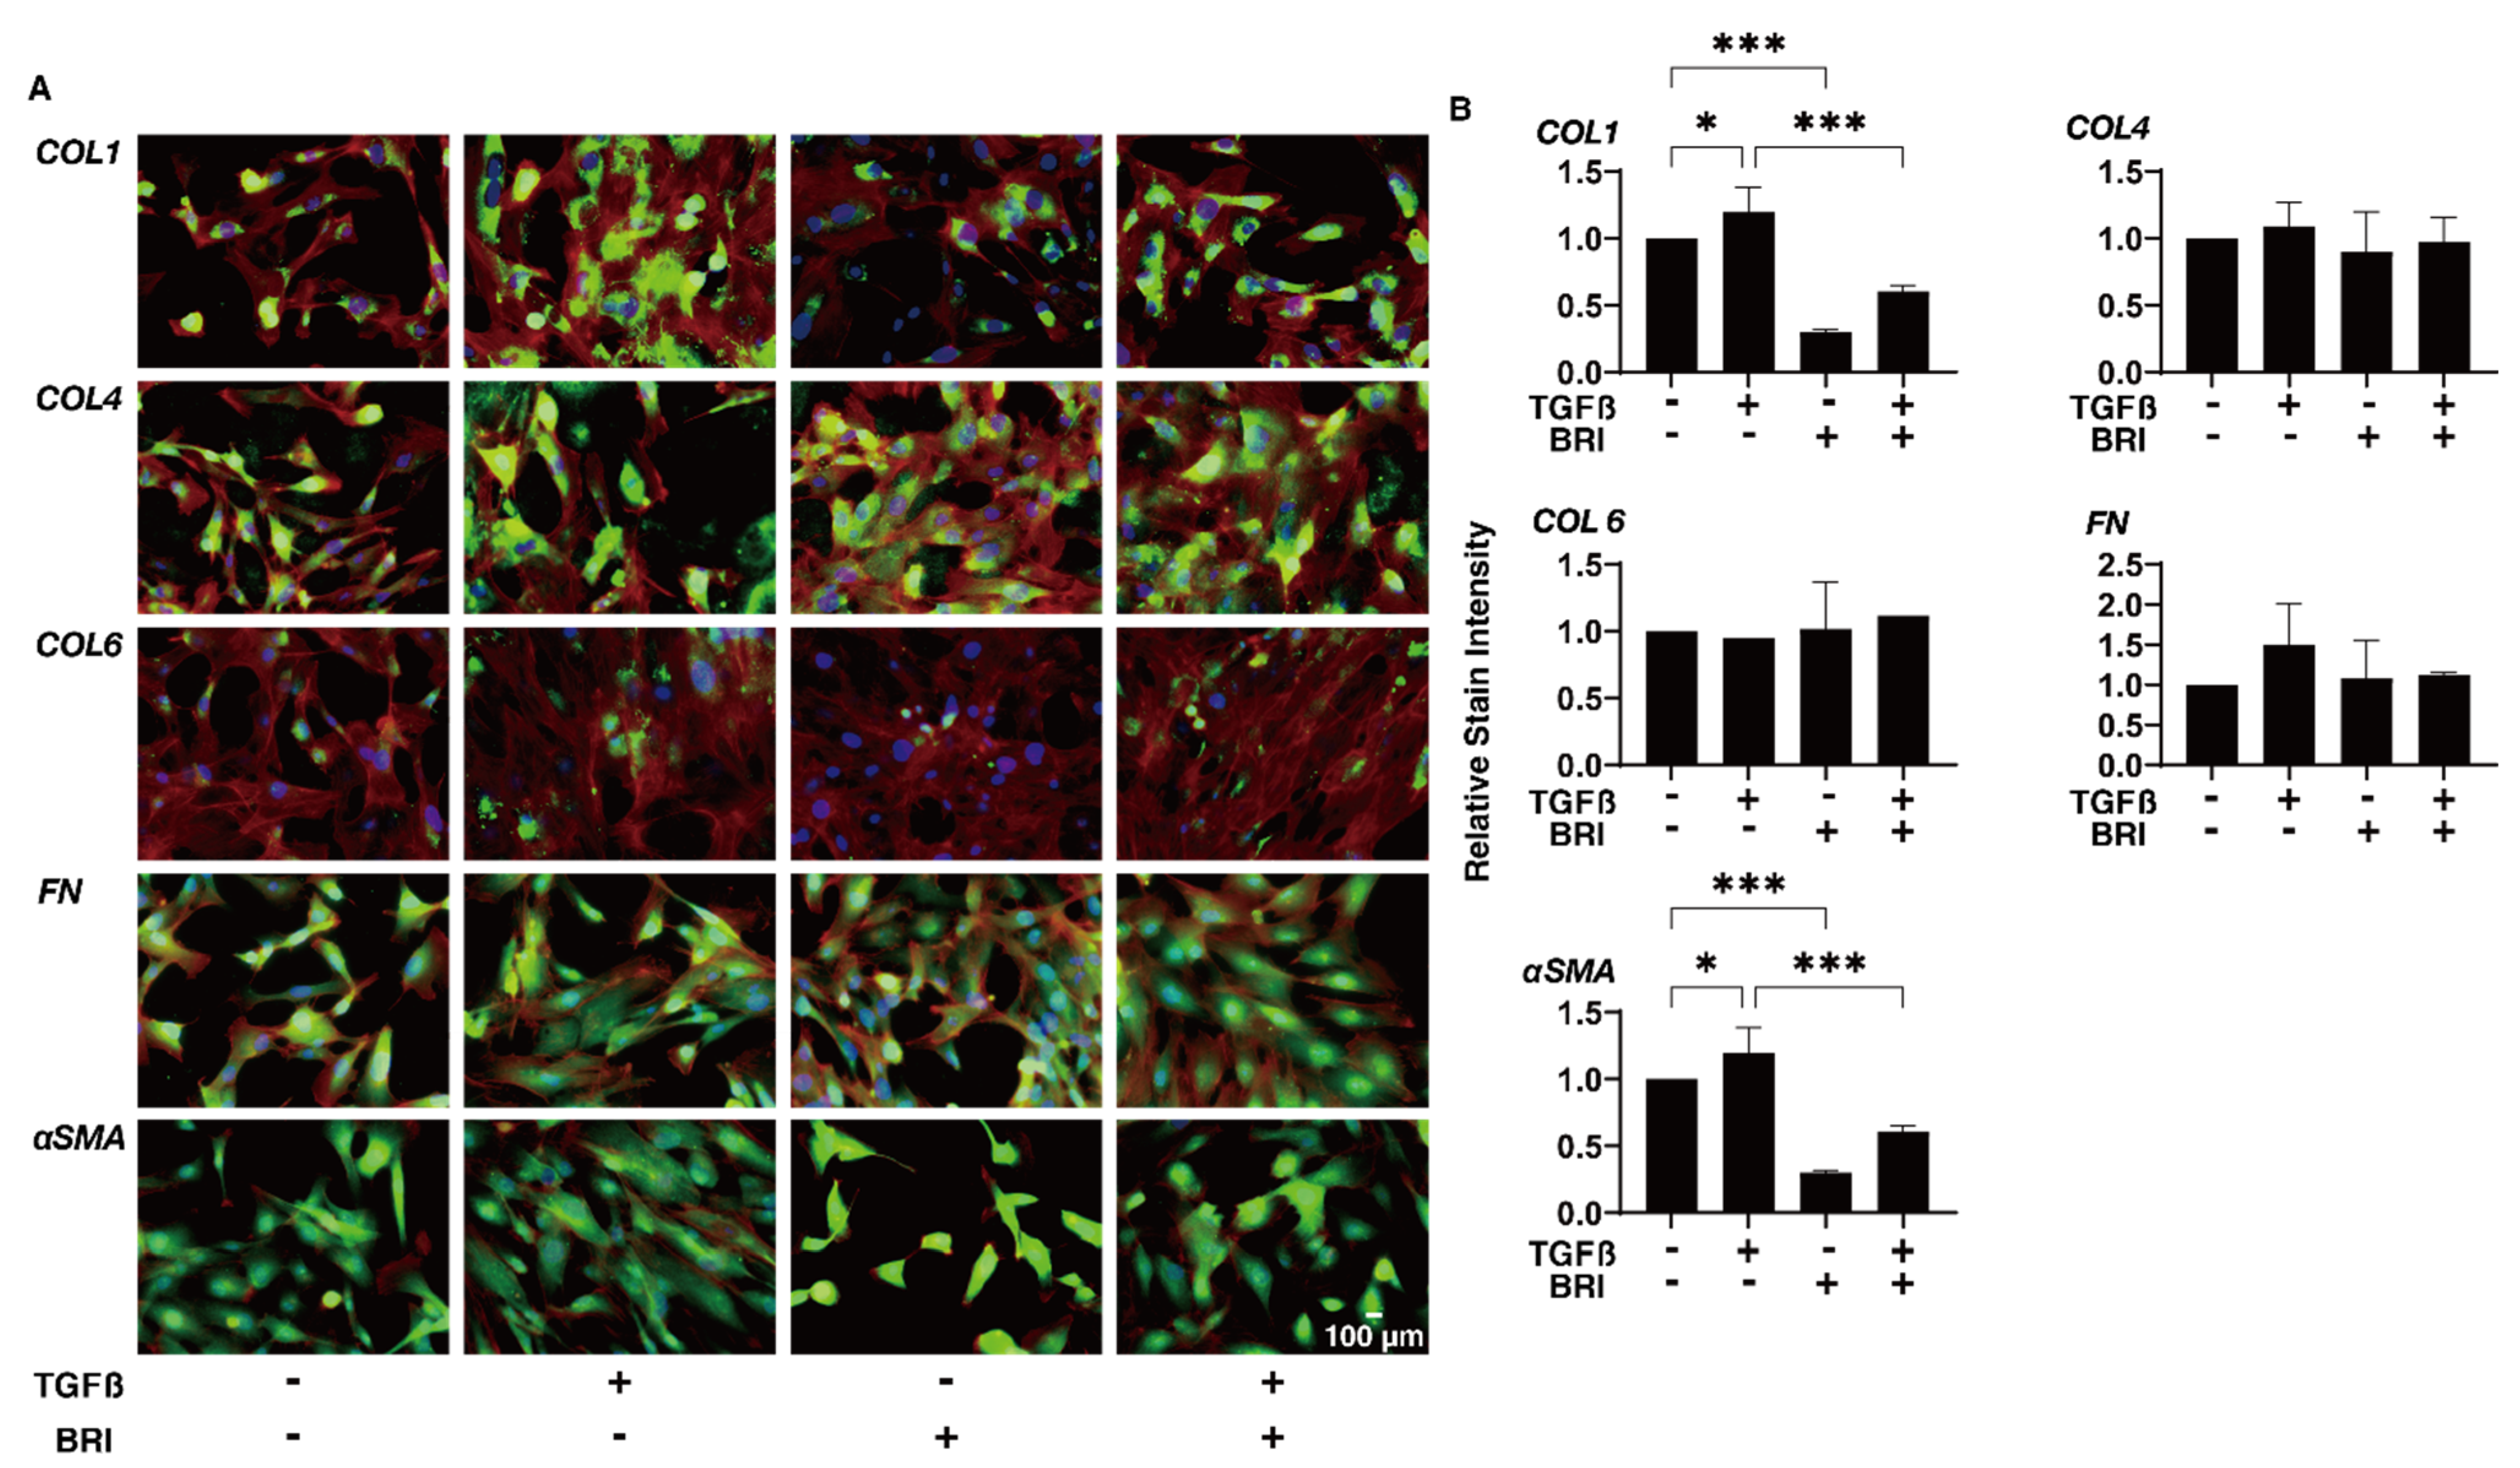
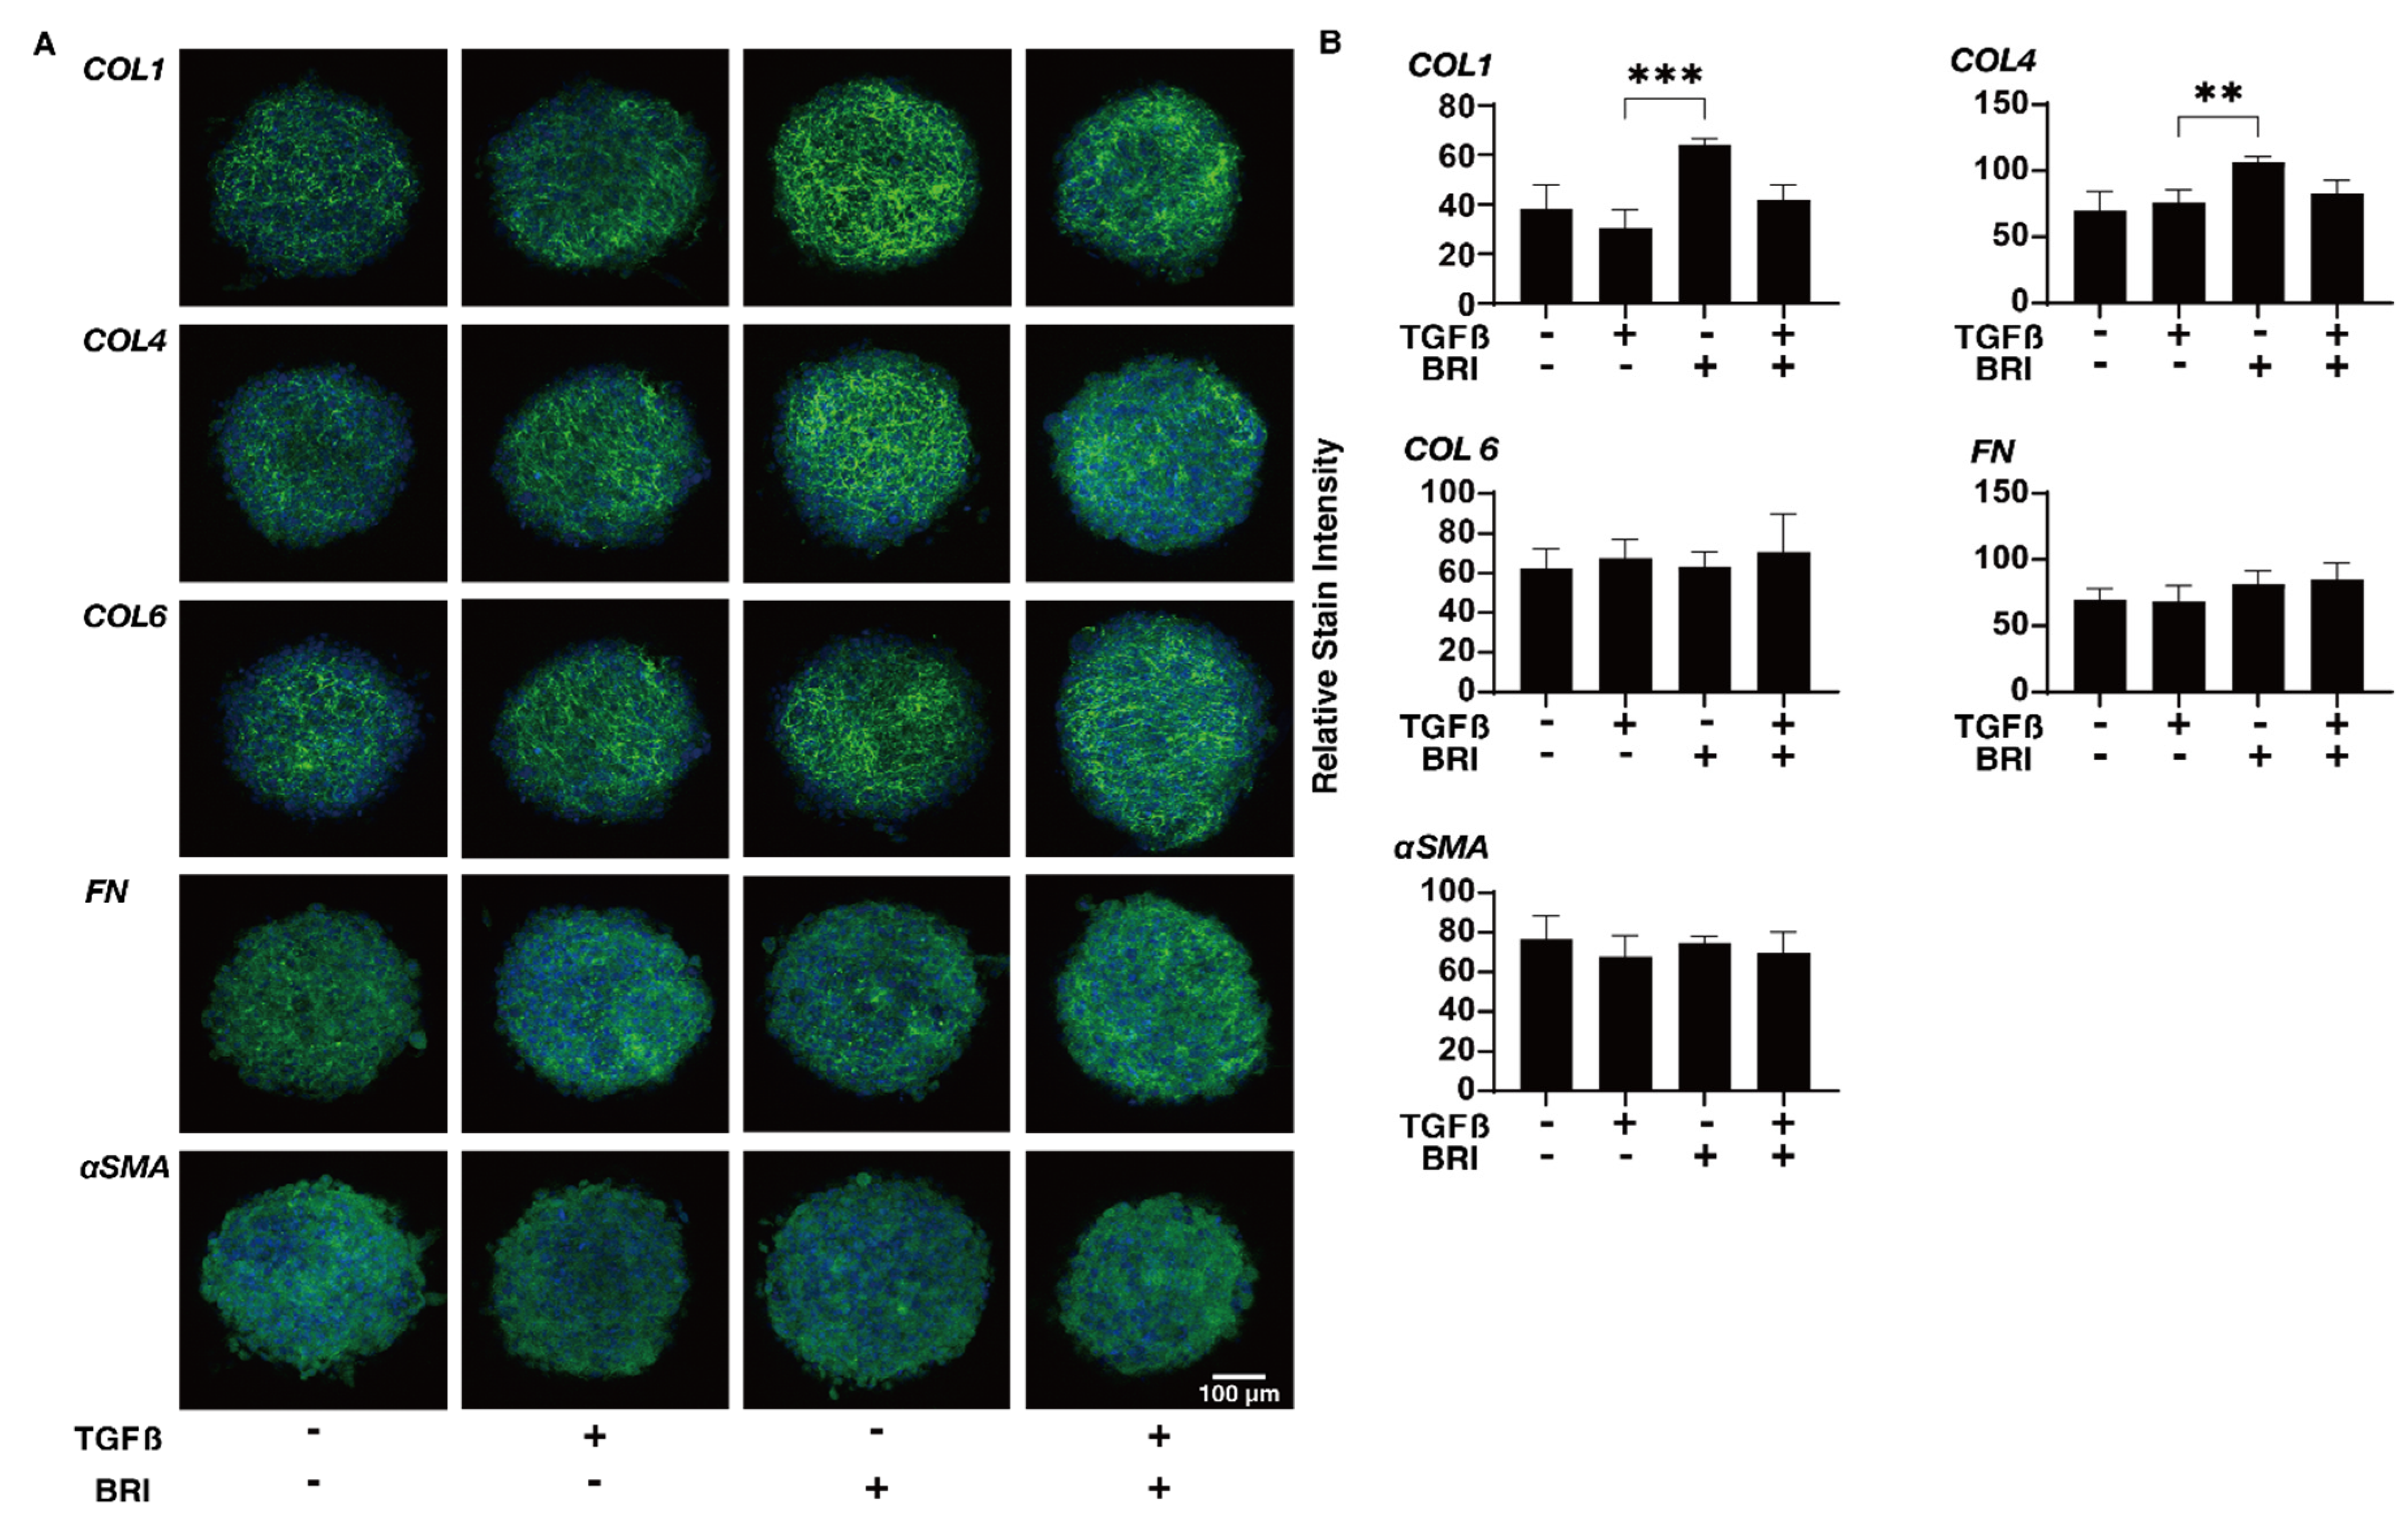
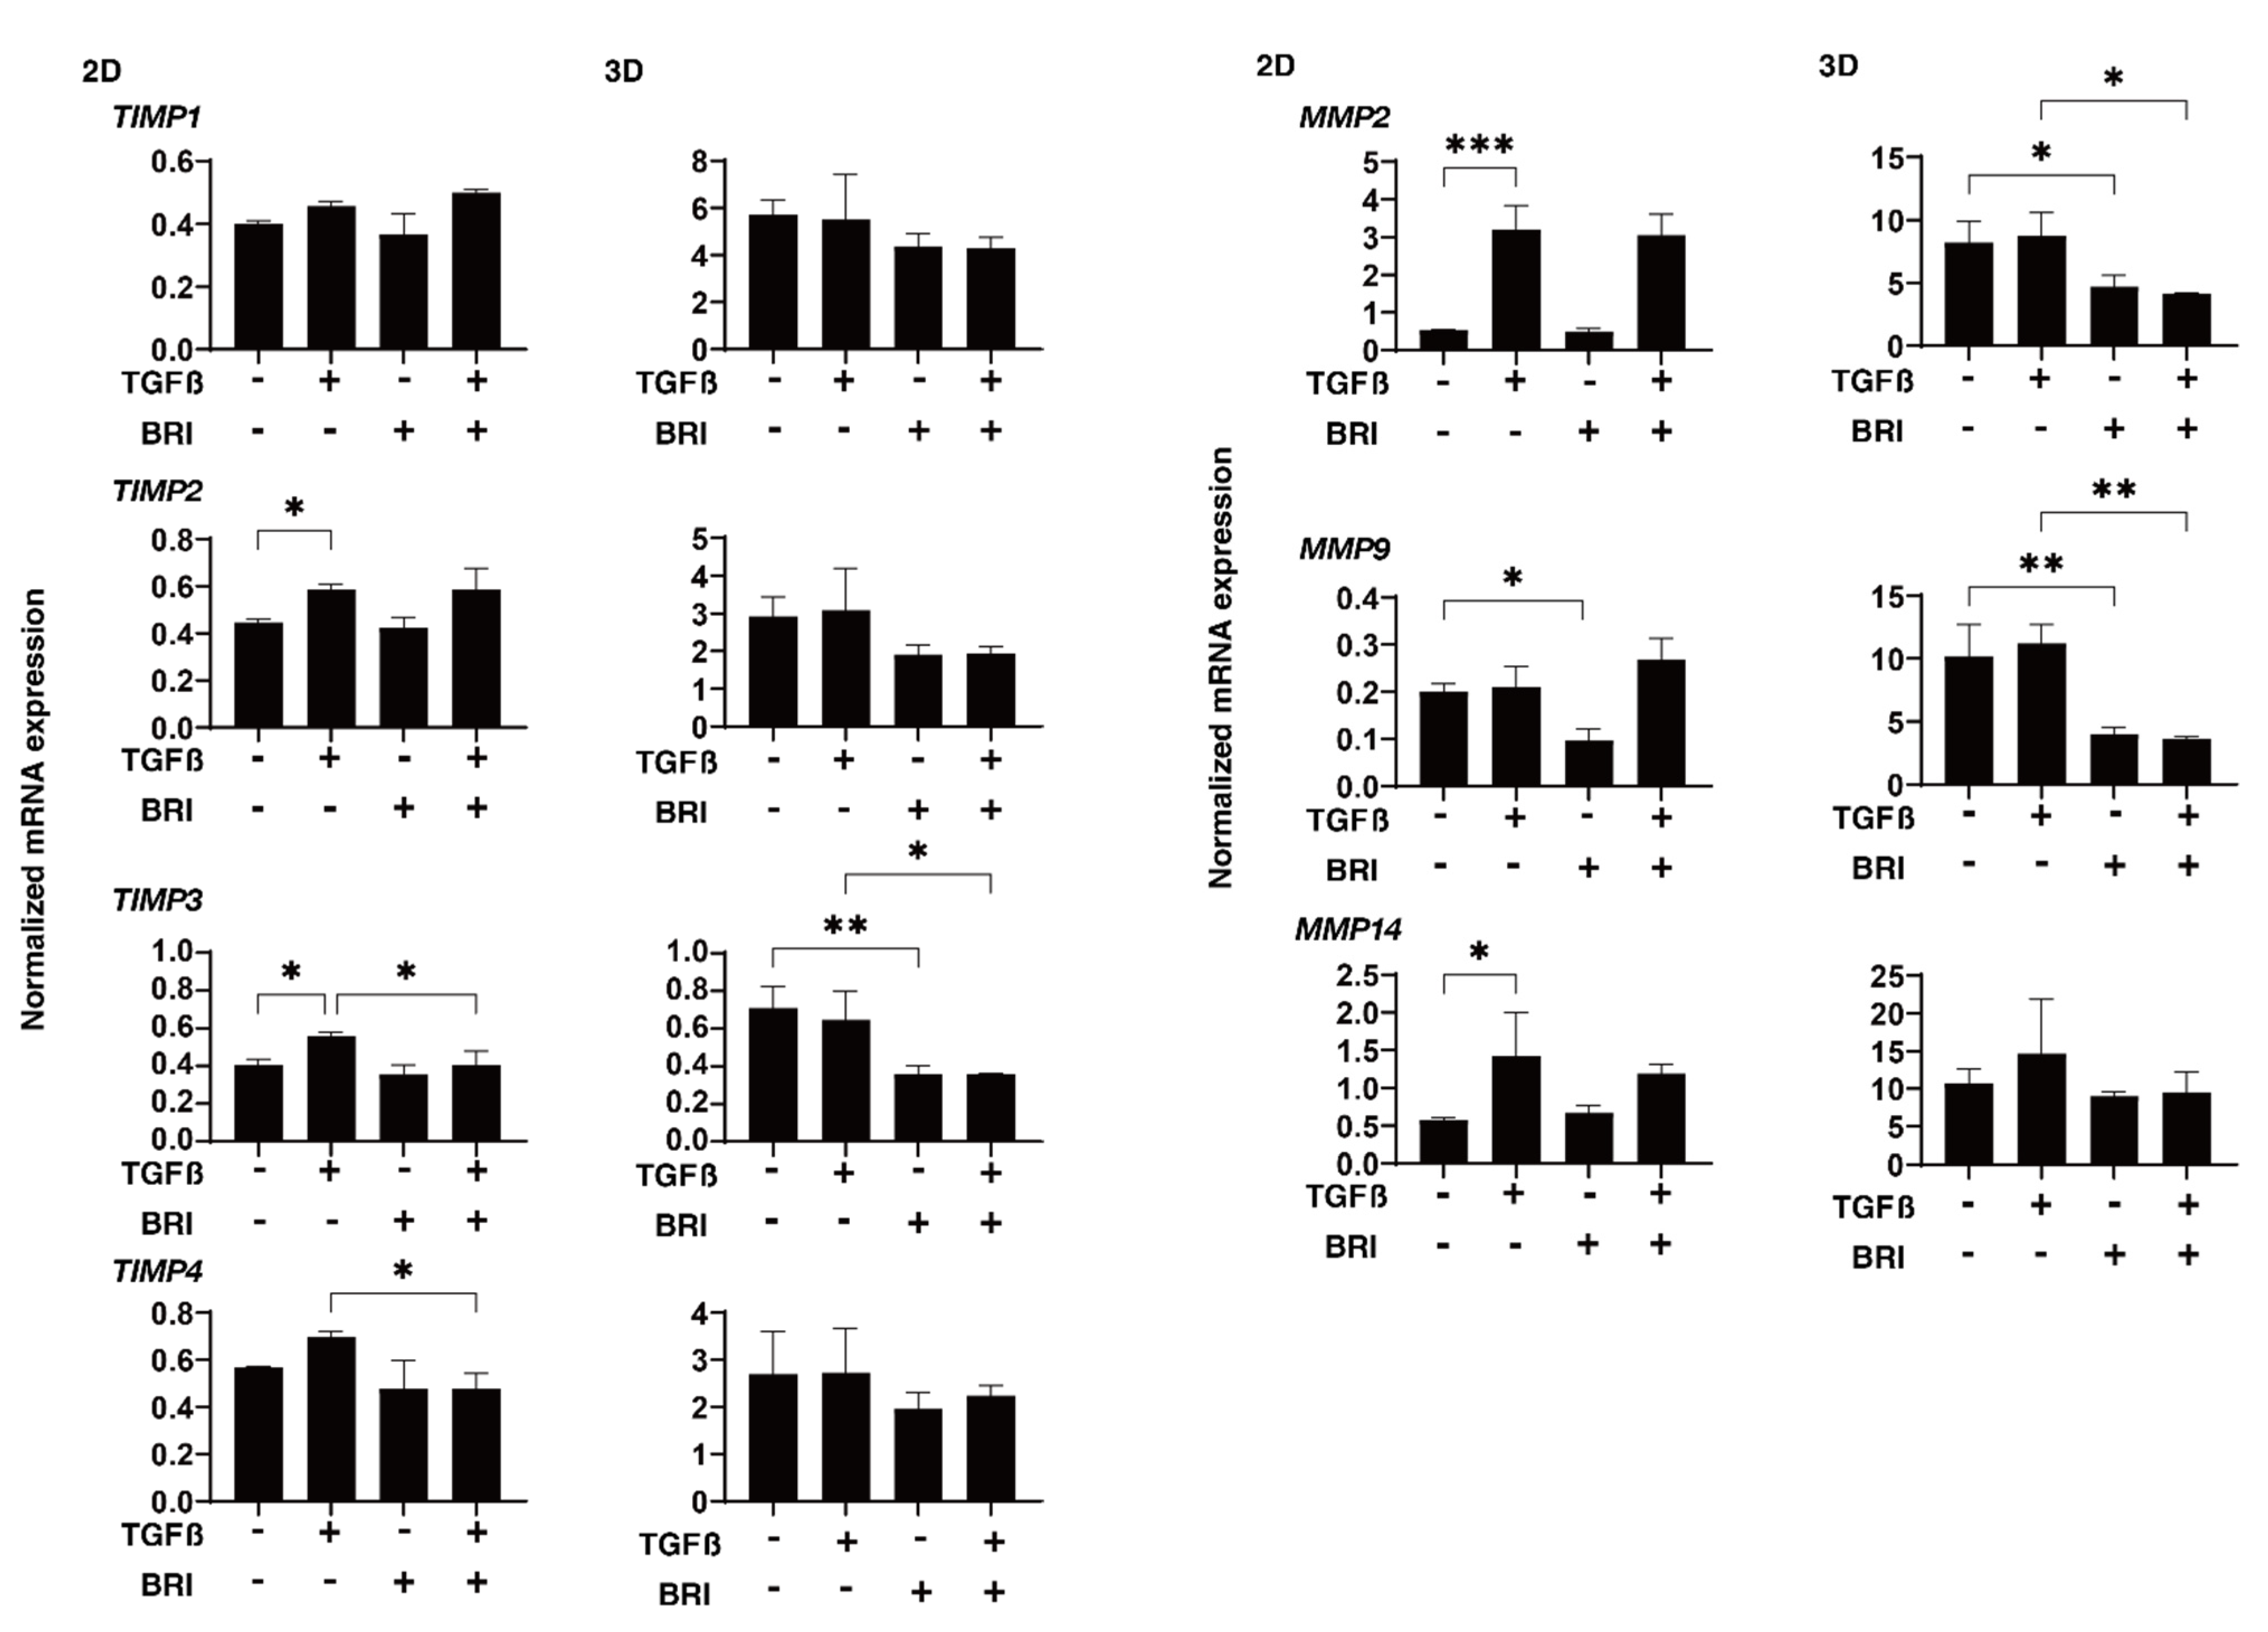
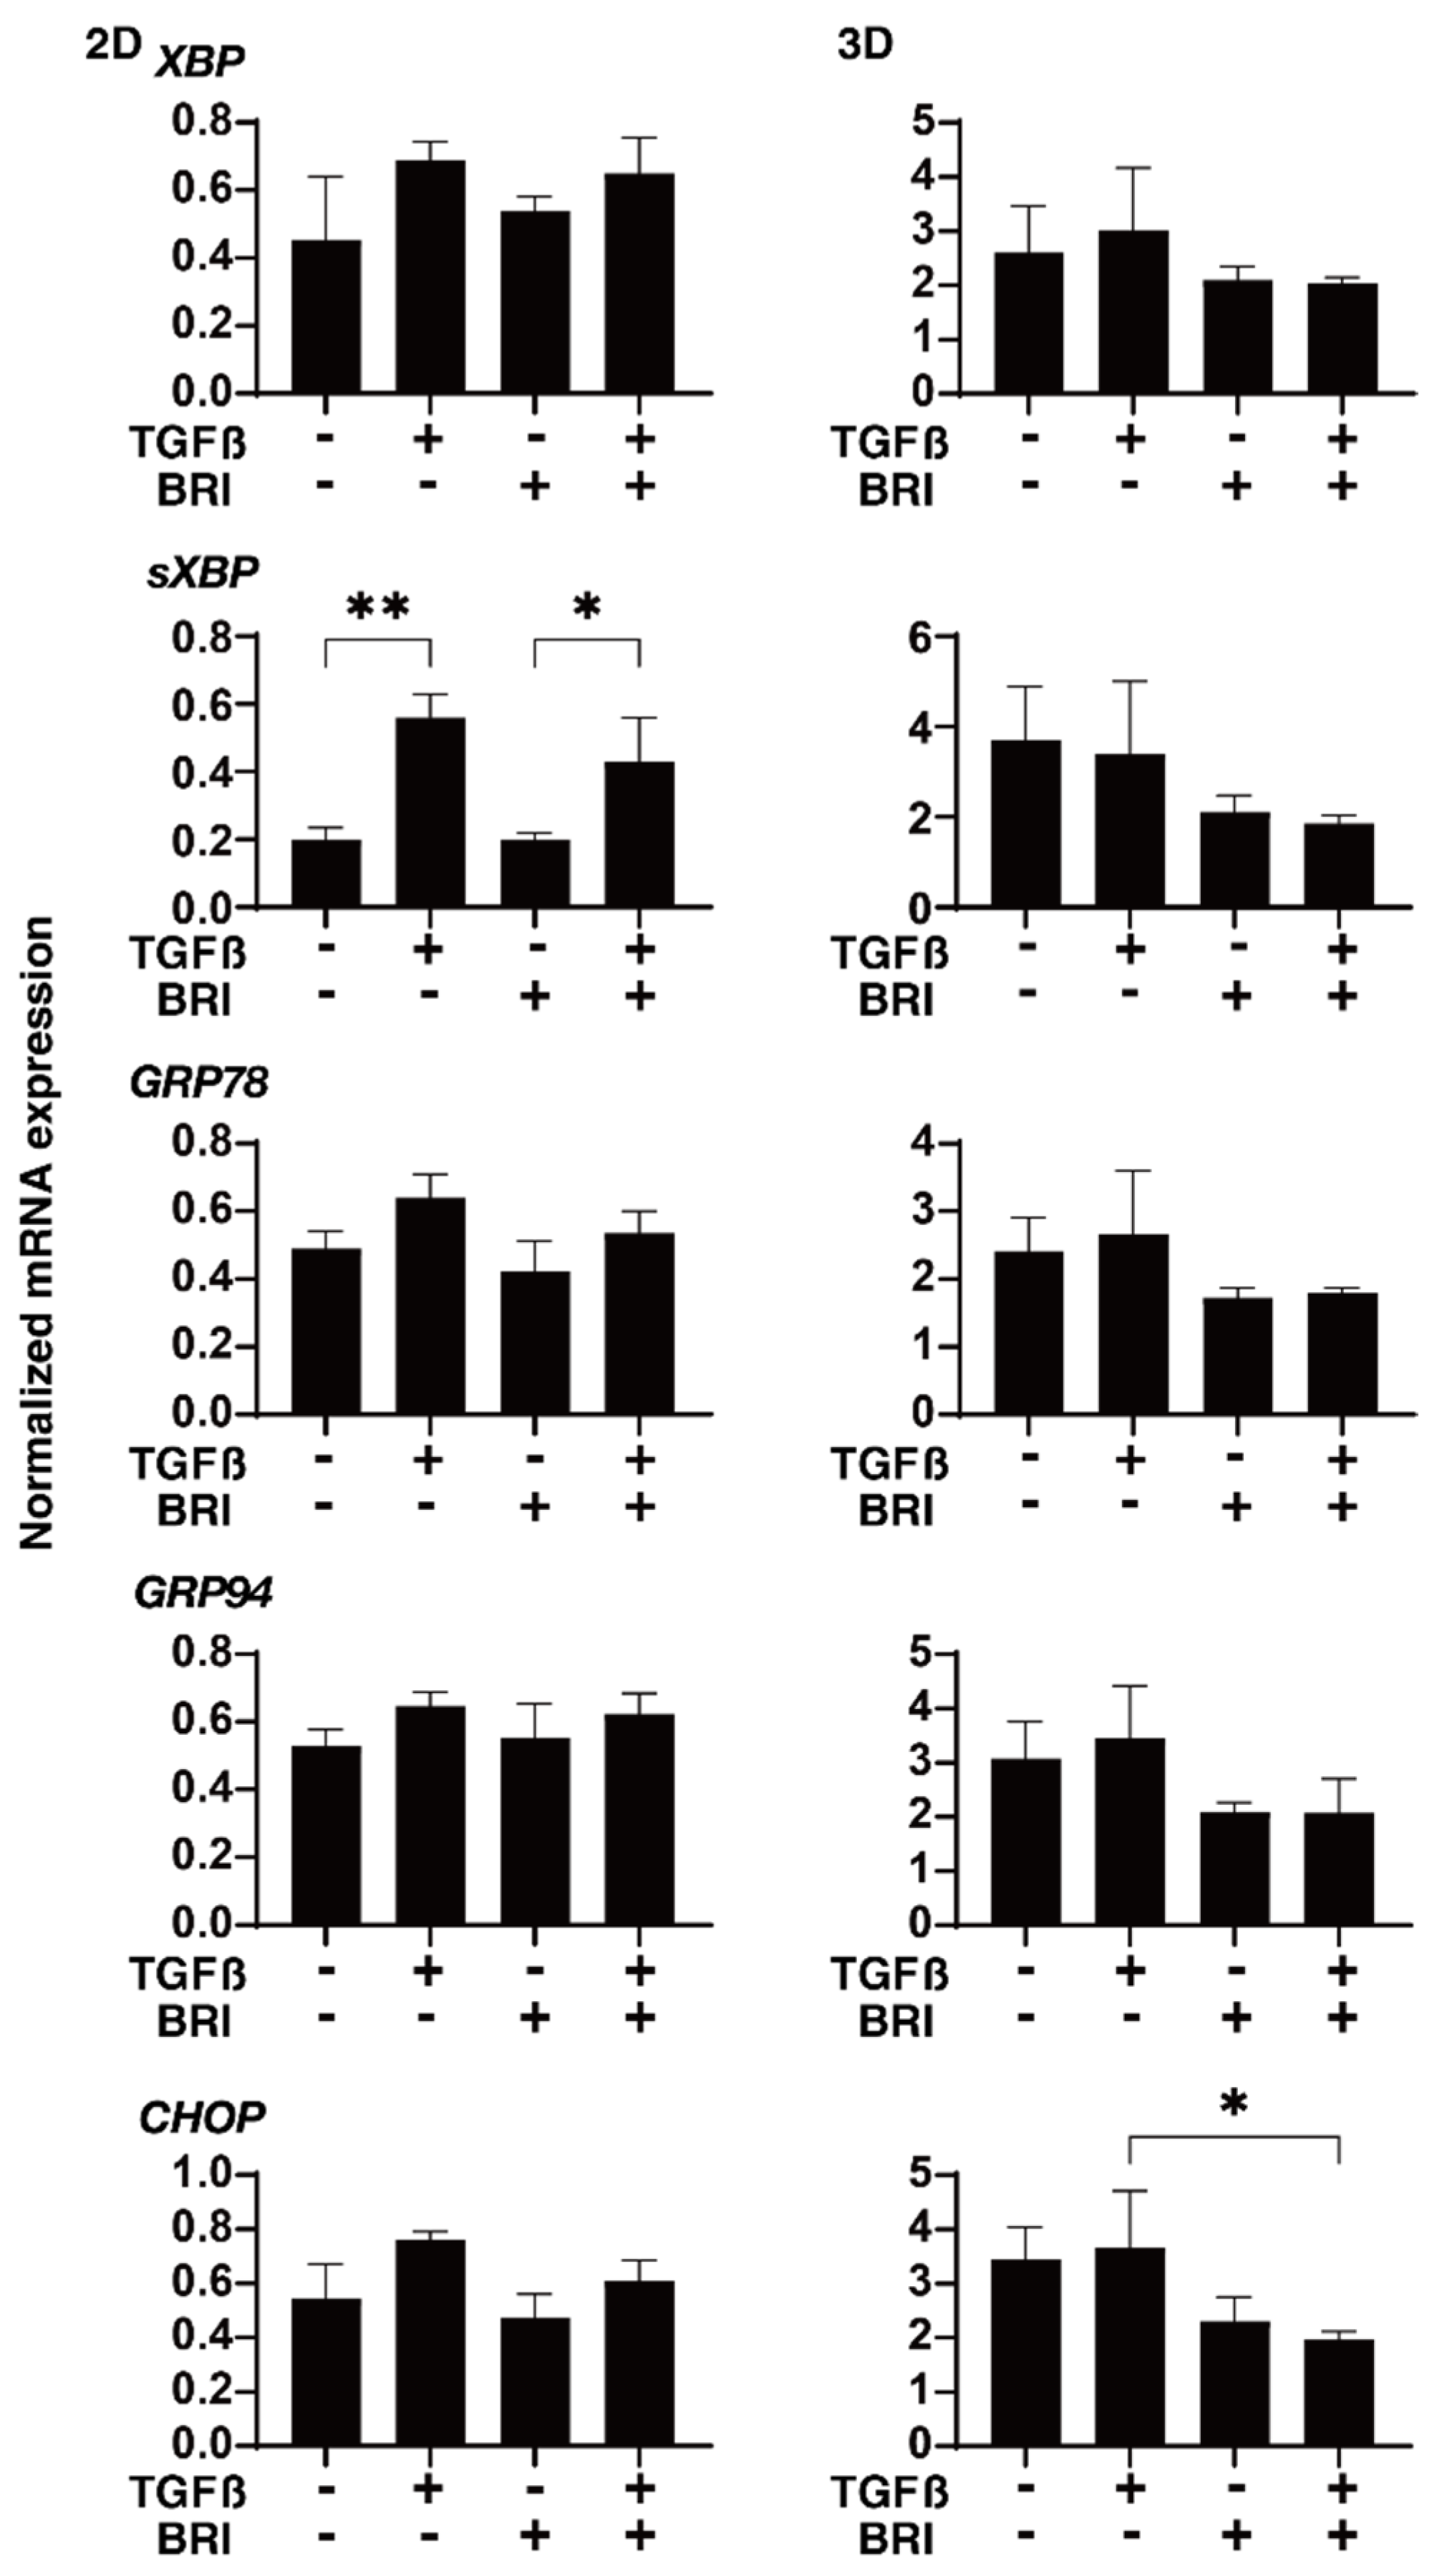
3. Results
4. Discussion
Supplementary Materials
Author Contributions
Funding
Institutional Review Board Statement
Informed Consent Statement
Data Availability Statement
Conflicts of Interest
References
- Oh, D.J.; Chen, J.L.; Vajaranant, T.S.; Dikopf, M.S. Brimonidine tartrate for the treatment of glaucoma. Expert Opin. Pharmacother. 2019, 20, 115–122. [Google Scholar] [CrossRef] [PubMed]
- Cantor, L.B. Brimonidine in the treatment of glaucoma and ocular hypertension. Ther. Clin. Risk Manag. 2006, 2, 337–346. [Google Scholar] [CrossRef] [PubMed] [Green Version]
- Wheeler, L.A.; Lai, R.; Woldemussie, E. From the lab to the clinic: Activation of an alpha-2 agonist pathway is neuroprotective in models of retinal and optic nerve injury. Eur. J. Ophthalmol. 1999, 9, S17–S21. [Google Scholar] [CrossRef] [PubMed]
- Lee, D.; Kim, K.-Y.; Noh, Y.H.; Chai, S.; Lindsey, J.D.; Ellisman, M.H.; Weinreb, R.N.; Ju, W.-K. Brimonidine blocks glutamate excitotoxicity-induced oxidative stress and preserves mitochondrial transcription factor a in ischemic retinal injury. PLoS ONE 2012, 7, e47098. [Google Scholar] [CrossRef] [PubMed] [Green Version]
- Wheeler, L.; WoldeMussie, E.; Lai, R. Role of Alpha-2 agonists in neuroprotection. Surv. Ophthalmol. 2003, 48, S47–S51. [Google Scholar] [CrossRef]
- Jung, K.I.; Kim, J.H.; Park, C.K. α2-Adrenergic modulation of the glutamate receptor and transporter function in a chronic ocular hypertension model. Eur. J. Pharmacol. 2015, 765, 274–283. [Google Scholar] [CrossRef]
- Lambert, W.S.; Ruiz, L.; Crish, S.D.; Wheeler, L.A.; Calkins, D.J. Brimonidine prevents axonal and somatic degeneration of retinal ganglion cell neurons. Mol. Neurodegener. 2011, 6, 4. [Google Scholar] [CrossRef] [Green Version]
- Johnstone, M.; Xin, C.; Tan, J.; Martin, E.; Wen, J.; Wang, R.K. Aqueous outflow regulation—21st century concepts. Prog. Retin. Eye Res. 2021, 83, 100917. [Google Scholar] [CrossRef]
- Stamer, W.D.; Huang, Y.; Seftor, R.E.; Svensson, S.S.; Snyder, R.W.; Regan, J.W. Cultured human trabecular meshwork cells express functional alpha 2A adrenergic receptors. Investig. Ophthalmol. Vis. Sci. 1996, 37, 2426–2433. [Google Scholar]
- Benozzi, J.; Jaliffa, C.O.; Lacoste, F.F.; Llomovatte, D.W.; Sarmiento, M.I.K.; Rosenstein, R.E. Effect of brimonidine on rabbit trabecular meshwork hyaluronidase activity. Investig. Ophthalmol. Vis. Sci. 2000, 41, 2268–2272. [Google Scholar]
- Ota, C.; Ida, Y.; Ohguro, H.; Hikage, F. ROCK inhibitors beneficially alter the spatial configuration of TGFβ2-treated 3D organoids from a human trabecular meshwork (HTM). Sci. Rep. 2020, 10, 20292. [Google Scholar] [CrossRef] [PubMed]
- Keller, K.E.; Bhattacharya, S.K.; Borrás, T.; Brunner, T.M.; Chansangpetch, S.; Clark, A.F.; Dismuke, W.M.; Du, Y.; Elliott, M.H.; Ethier, C.R.; et al. Consensus recommendations for trabecular meshwork cell isolation, characterization and culture. Exp. Eye Res. 2018, 171, 164–173. [Google Scholar] [CrossRef] [PubMed]
- Chen, H.Y.; Chou, H.C.; Ho, Y.J.; Chang, S.J.; Liao, E.C.; Wei, Y.S.; Lin, M.W.; Wang, Y.S.; Chien, Y.A.; Yu, X.R.; et al. Characterization of TGF-β by Induced Oxidative Stress in Human Trabecular Meshwork Cells. Antioxidants 2021, 10, 107. [Google Scholar] [CrossRef] [PubMed]
- Watanabe, M.; Ida, Y.; Furuhashi, M.; Tsugeno, Y.; Ohguro, H.; Hikage, F. Screening of the drug-induced effects of prostaglandin ep2 and fp agonists on 3d cultures of dexamethasone-treated human trabecular meshwork cells. Biomedicines 2021, 9, 930. [Google Scholar] [CrossRef]
- Ramírez, C.; Cáceres-del-Carpio, J.; Chu, J.; Chu, J.; Moustafa, M.T.; Chwa, M.; Limb, G.A.; Kuppermann, B.D.; Kenney, M.C. Brimonidine Can Prevent In Vitro Hydroquinone Damage on Retinal Pigment Epithelium Cells and Retinal Müller Cells. J. Ocul. Pharmacol. Ther. 2016, 32, 102–108. [Google Scholar] [CrossRef]
- Kaneko, Y.; Ohta, M.; Inoue, T.; Mizuno, K.; Isobe, T.; Tanabe, S.; Tanihara, H. Effects of K-115 (Ripasudil), a novel ROCK inhibitor, on trabecular meshwork and Schlemm’s canal endothelial cells. Sci. Rep. 2016, 6, 19640. [Google Scholar] [CrossRef]
- Watanabe, M.; Sato, T.; Tsugeno, Y.; Umetsu, A.; Suzuki, S.; Furuhashi, M.; Ida, Y.; Hikage, F.; Ohguro, H. Human Trabecular Meshwork (HTM) Cells Treated with TGF-β2 or Dexamethasone Respond to Compression Stress in Different Manners. Biomedicines 2022, 10, 1338. [Google Scholar] [CrossRef]
- Hikage, F.; Atkins, S.; Kahana, A.; Smith, T.J.; Chun, T.-H. HIF2A–LOX Pathway Promotes Fibrotic Tissue Remodeling in Thyroid-Associated Orbitopathy. Endocrinology 2019, 160, 20–35. [Google Scholar] [CrossRef] [Green Version]
- Ida, Y.; Hikage, F.; Itoh, K.; Ida, H.; Ohguro, H. Prostaglandin F2α agonist-induced suppression of 3T3-L1 cell adipogenesis affects spatial formation of extra-cellular matrix. Sci. Rep. 2020, 10, 7958. [Google Scholar] [CrossRef]
- Itoh, K.; Hikage, F.; Ida, Y.; Ohguro, H. Prostaglandin F2α Agonists Negatively Modulate the Size of 3D Organoids from Primary Human Orbital Fibroblasts. Investig. Opthalmol. Vis. Sci. 2020, 61, 13. [Google Scholar] [CrossRef]
- Watanabe, M.; Ida, Y.; Ohguro, H.; Ota, C.; Hikage, F. Establishment of appropriate glaucoma models using dexamethasone or TGFβ2 treated three-dimension (3D) cultured human trabecular meshwork (HTM) cells. Sci. Rep. 2021, 11, 19369. [Google Scholar] [CrossRef] [PubMed]
- Derick, R.J.; Robin, A.L.; Walters, T.R.; Barnebey, H.S.; Choplin, N.; Schuman, J.; Kelley, E.P.; Chen, K.; Stoecker, J.F. Brimonidine tartrate: A one-month dose response study. Ophthalmology 1997, 104, 131–136. [Google Scholar] [CrossRef]
- Greenfield, D.S.; Liebmann, J.M.; Ritch, R. Brimonidine: A new alpha2-adrenoreceptor agonist for glaucoma treatment. J. Glaucoma 1997, 6, 250–258. [Google Scholar] [CrossRef] [PubMed]
- Toris, C.B.; Gleason, M.L.; Camras, C.B.; Yablonski, M.E. Effects of brimonidine on aqueous humor dynamics in human eyes. Arch. Ophthalmol. 1995, 113, 1514–1517. [Google Scholar] [CrossRef] [PubMed]
- Roberts, R.E.; Tomlinson, A.E.; Kendall, D.A.; Wilson, V.G. Alpha2-adrenoceptor-mediated contractions of the porcine isolated ear artery: Evidence for a cyclic AMP-dependent and a cyclic AMP-independent mechanism. Br. J. Pharmacol. 1998, 124, 1107–1114. [Google Scholar] [CrossRef] [Green Version]
- Hong, S.; Han, S.-H.; Kim, C.Y.; Kim, K.Y.; Song, Y.K.; Seong, G.J. Brimonidine reduces TGF-beta-induced extracellular matrix synthesis in human Tenon’s fibroblasts. BMC Ophthalmol. 2015, 15, 54. [Google Scholar] [CrossRef] [Green Version]
- Xie, X.; Zhang, Y.; Ge, C.; Liang, P. Effect of Brachytherapy vs. External Beam Radiotherapy on Sexual Function in Patients With Clinically Localized Prostate Cancer: A Meta-Analysis. Front. Cell Dev. Biol. 2021, 9, 792597. [Google Scholar] [CrossRef]
- Ooi, Y.H.; Oh, D.-J.; Rhee, D.J. Analysis of α2-adrenergic receptors and effect of brimonidine on matrix metalloproteinases and their inhibitors in human ciliary body. Investig. Opthalmol. Vis. Sci. 2009, 50, 4237–4243. [Google Scholar] [CrossRef] [Green Version]


Publisher’s Note: MDPI stays neutral with regard to jurisdictional claims in published maps and institutional affiliations. |
© 2022 by the authors. Licensee MDPI, Basel, Switzerland. This article is an open access article distributed under the terms and conditions of the Creative Commons Attribution (CC BY) license (https://creativecommons.org/licenses/by/4.0/).
Share and Cite
Watanabe, M.; Sato, T.; Tsugeno, Y.; Higashide, M.; Furuhashi, M.; Umetsu, A.; Suzuki, S.; Ida, Y.; Hikage, F.; Ohguro, H. An α2-Adrenergic Agonist, Brimonidine, Beneficially Affects the TGF-β2-Treated Cellular Properties in an In Vitro Culture Model. Bioengineering 2022, 9, 310. https://doi.org/10.3390/bioengineering9070310
Watanabe M, Sato T, Tsugeno Y, Higashide M, Furuhashi M, Umetsu A, Suzuki S, Ida Y, Hikage F, Ohguro H. An α2-Adrenergic Agonist, Brimonidine, Beneficially Affects the TGF-β2-Treated Cellular Properties in an In Vitro Culture Model. Bioengineering. 2022; 9(7):310. https://doi.org/10.3390/bioengineering9070310
Chicago/Turabian StyleWatanabe, Megumi, Tatsuya Sato, Yuri Tsugeno, Megumi Higashide, Masato Furuhashi, Araya Umetsu, Soma Suzuki, Yosuke Ida, Fumihito Hikage, and Hiroshi Ohguro. 2022. "An α2-Adrenergic Agonist, Brimonidine, Beneficially Affects the TGF-β2-Treated Cellular Properties in an In Vitro Culture Model" Bioengineering 9, no. 7: 310. https://doi.org/10.3390/bioengineering9070310