

Sensors and Techniques for On-Line Determination of Cell Viability in Bioprocess Monitoring

Abstract
:
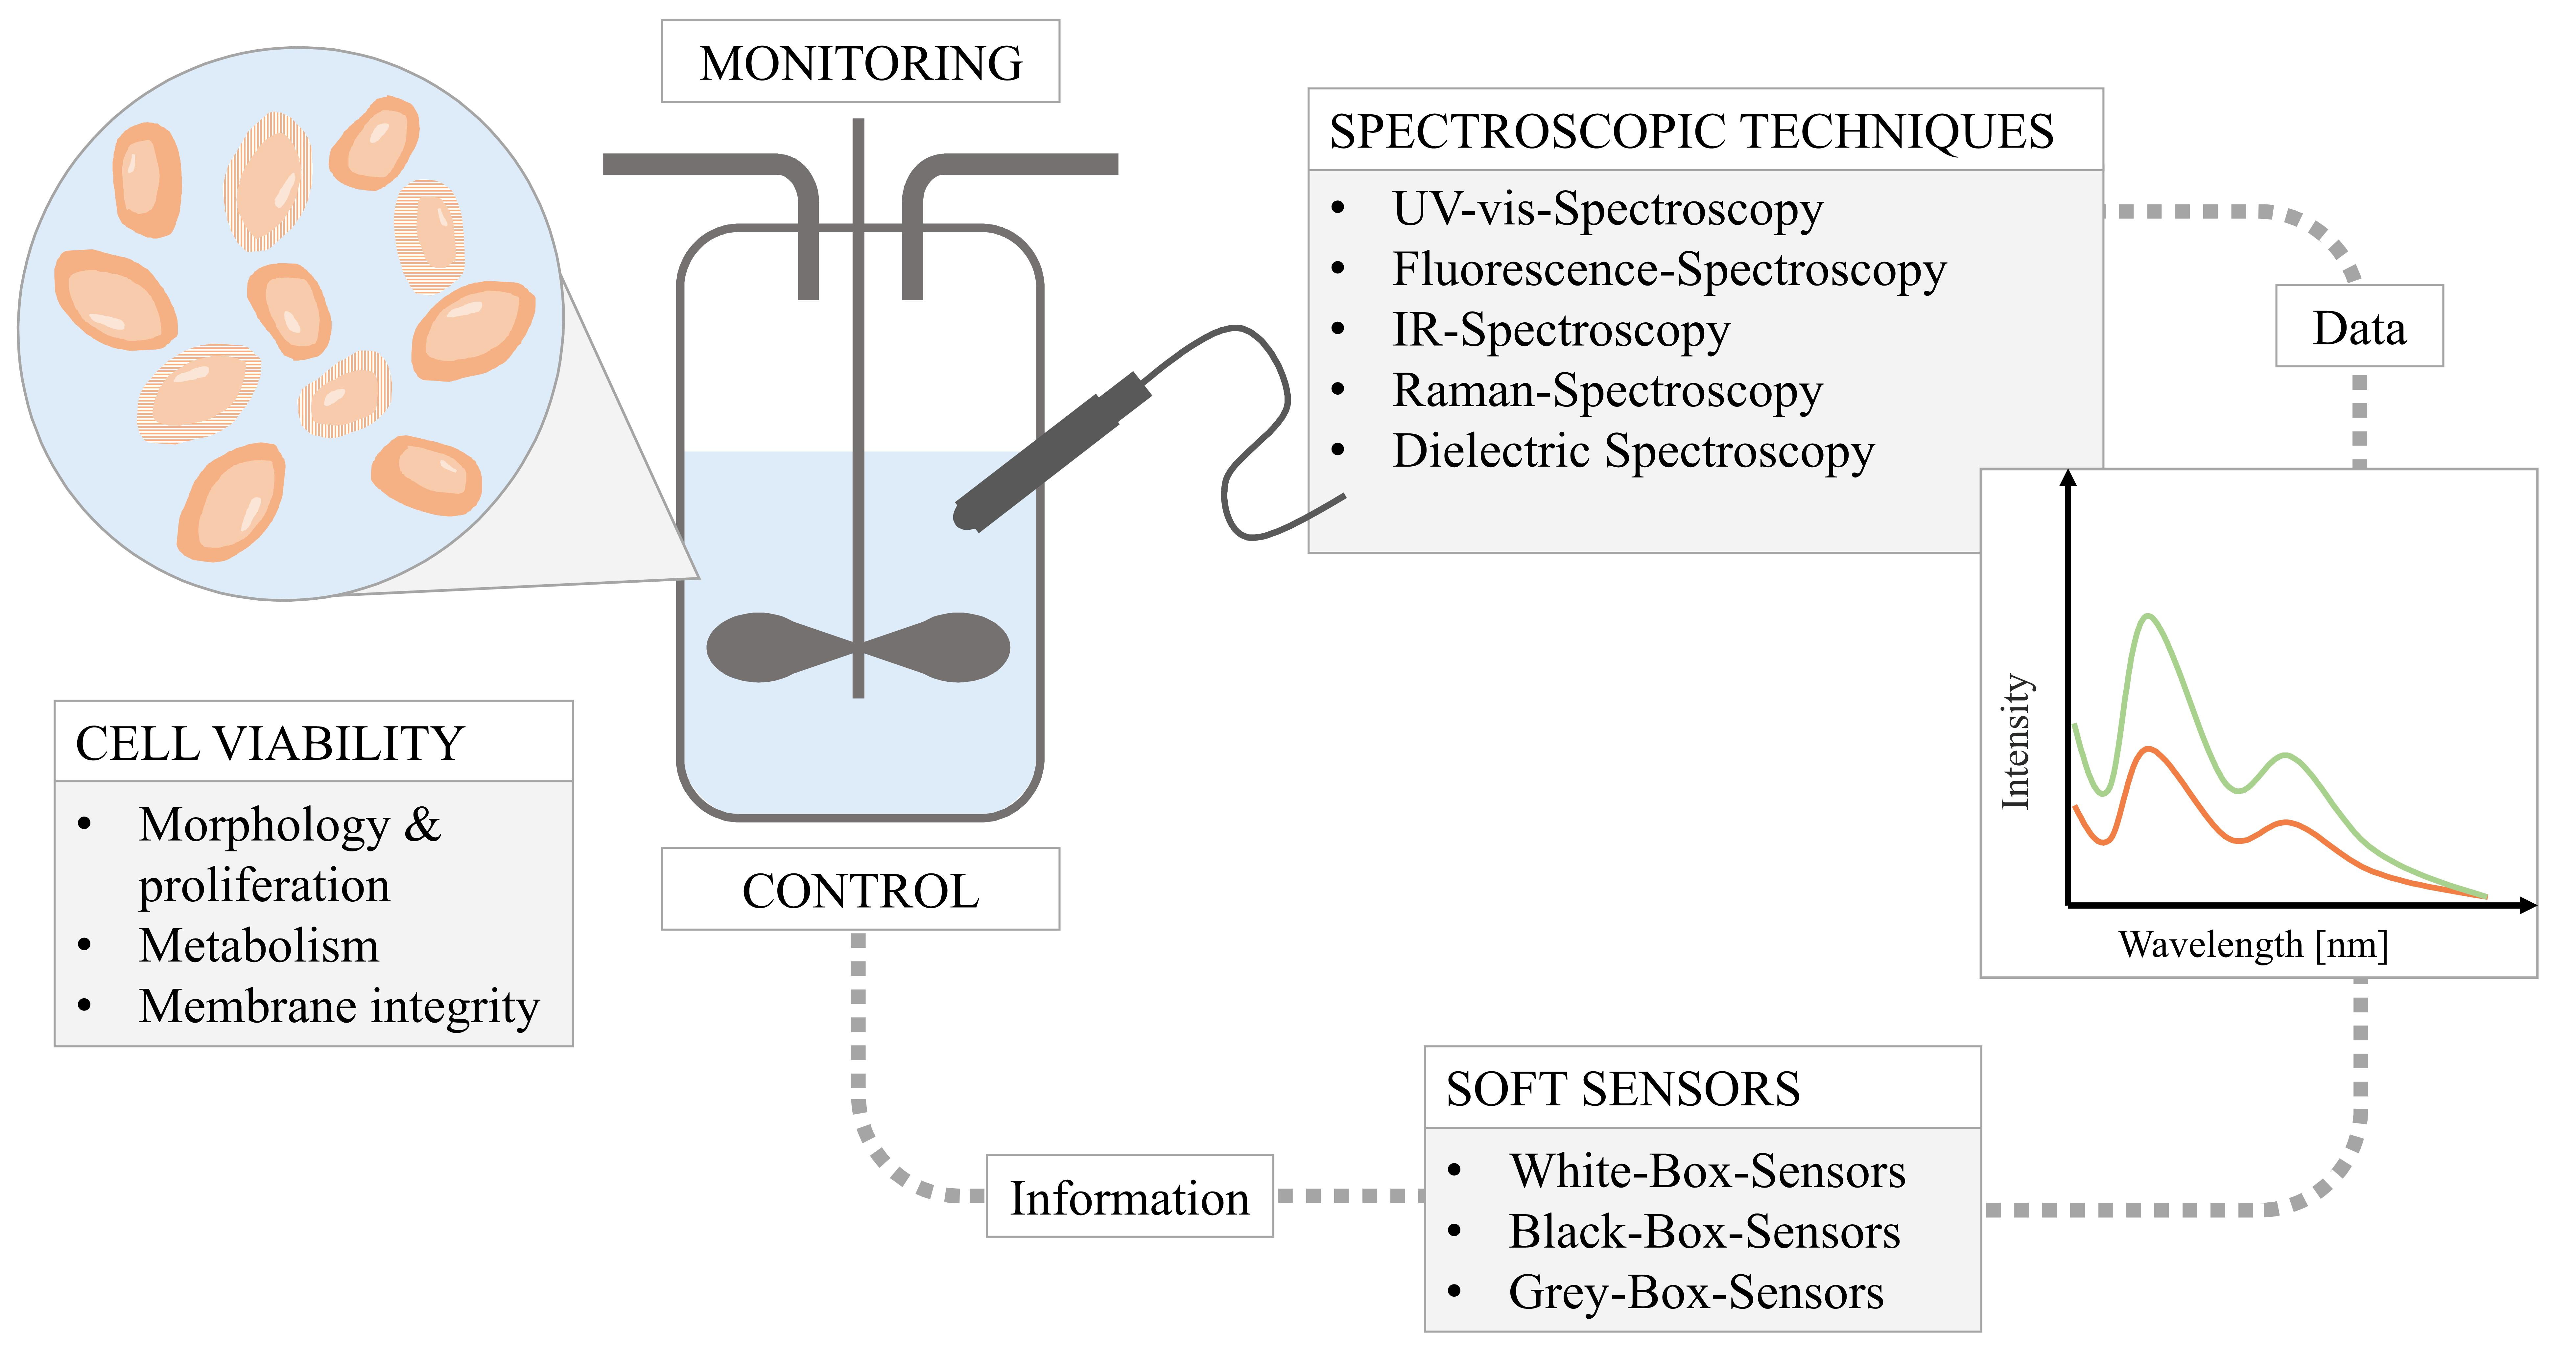
1. Introduction
- UV-vis spectroscopy
- Fluorescence spectroscopy
- Infrared spectroscopy
- Raman spectroscopy
- Dielectric spectroscopy
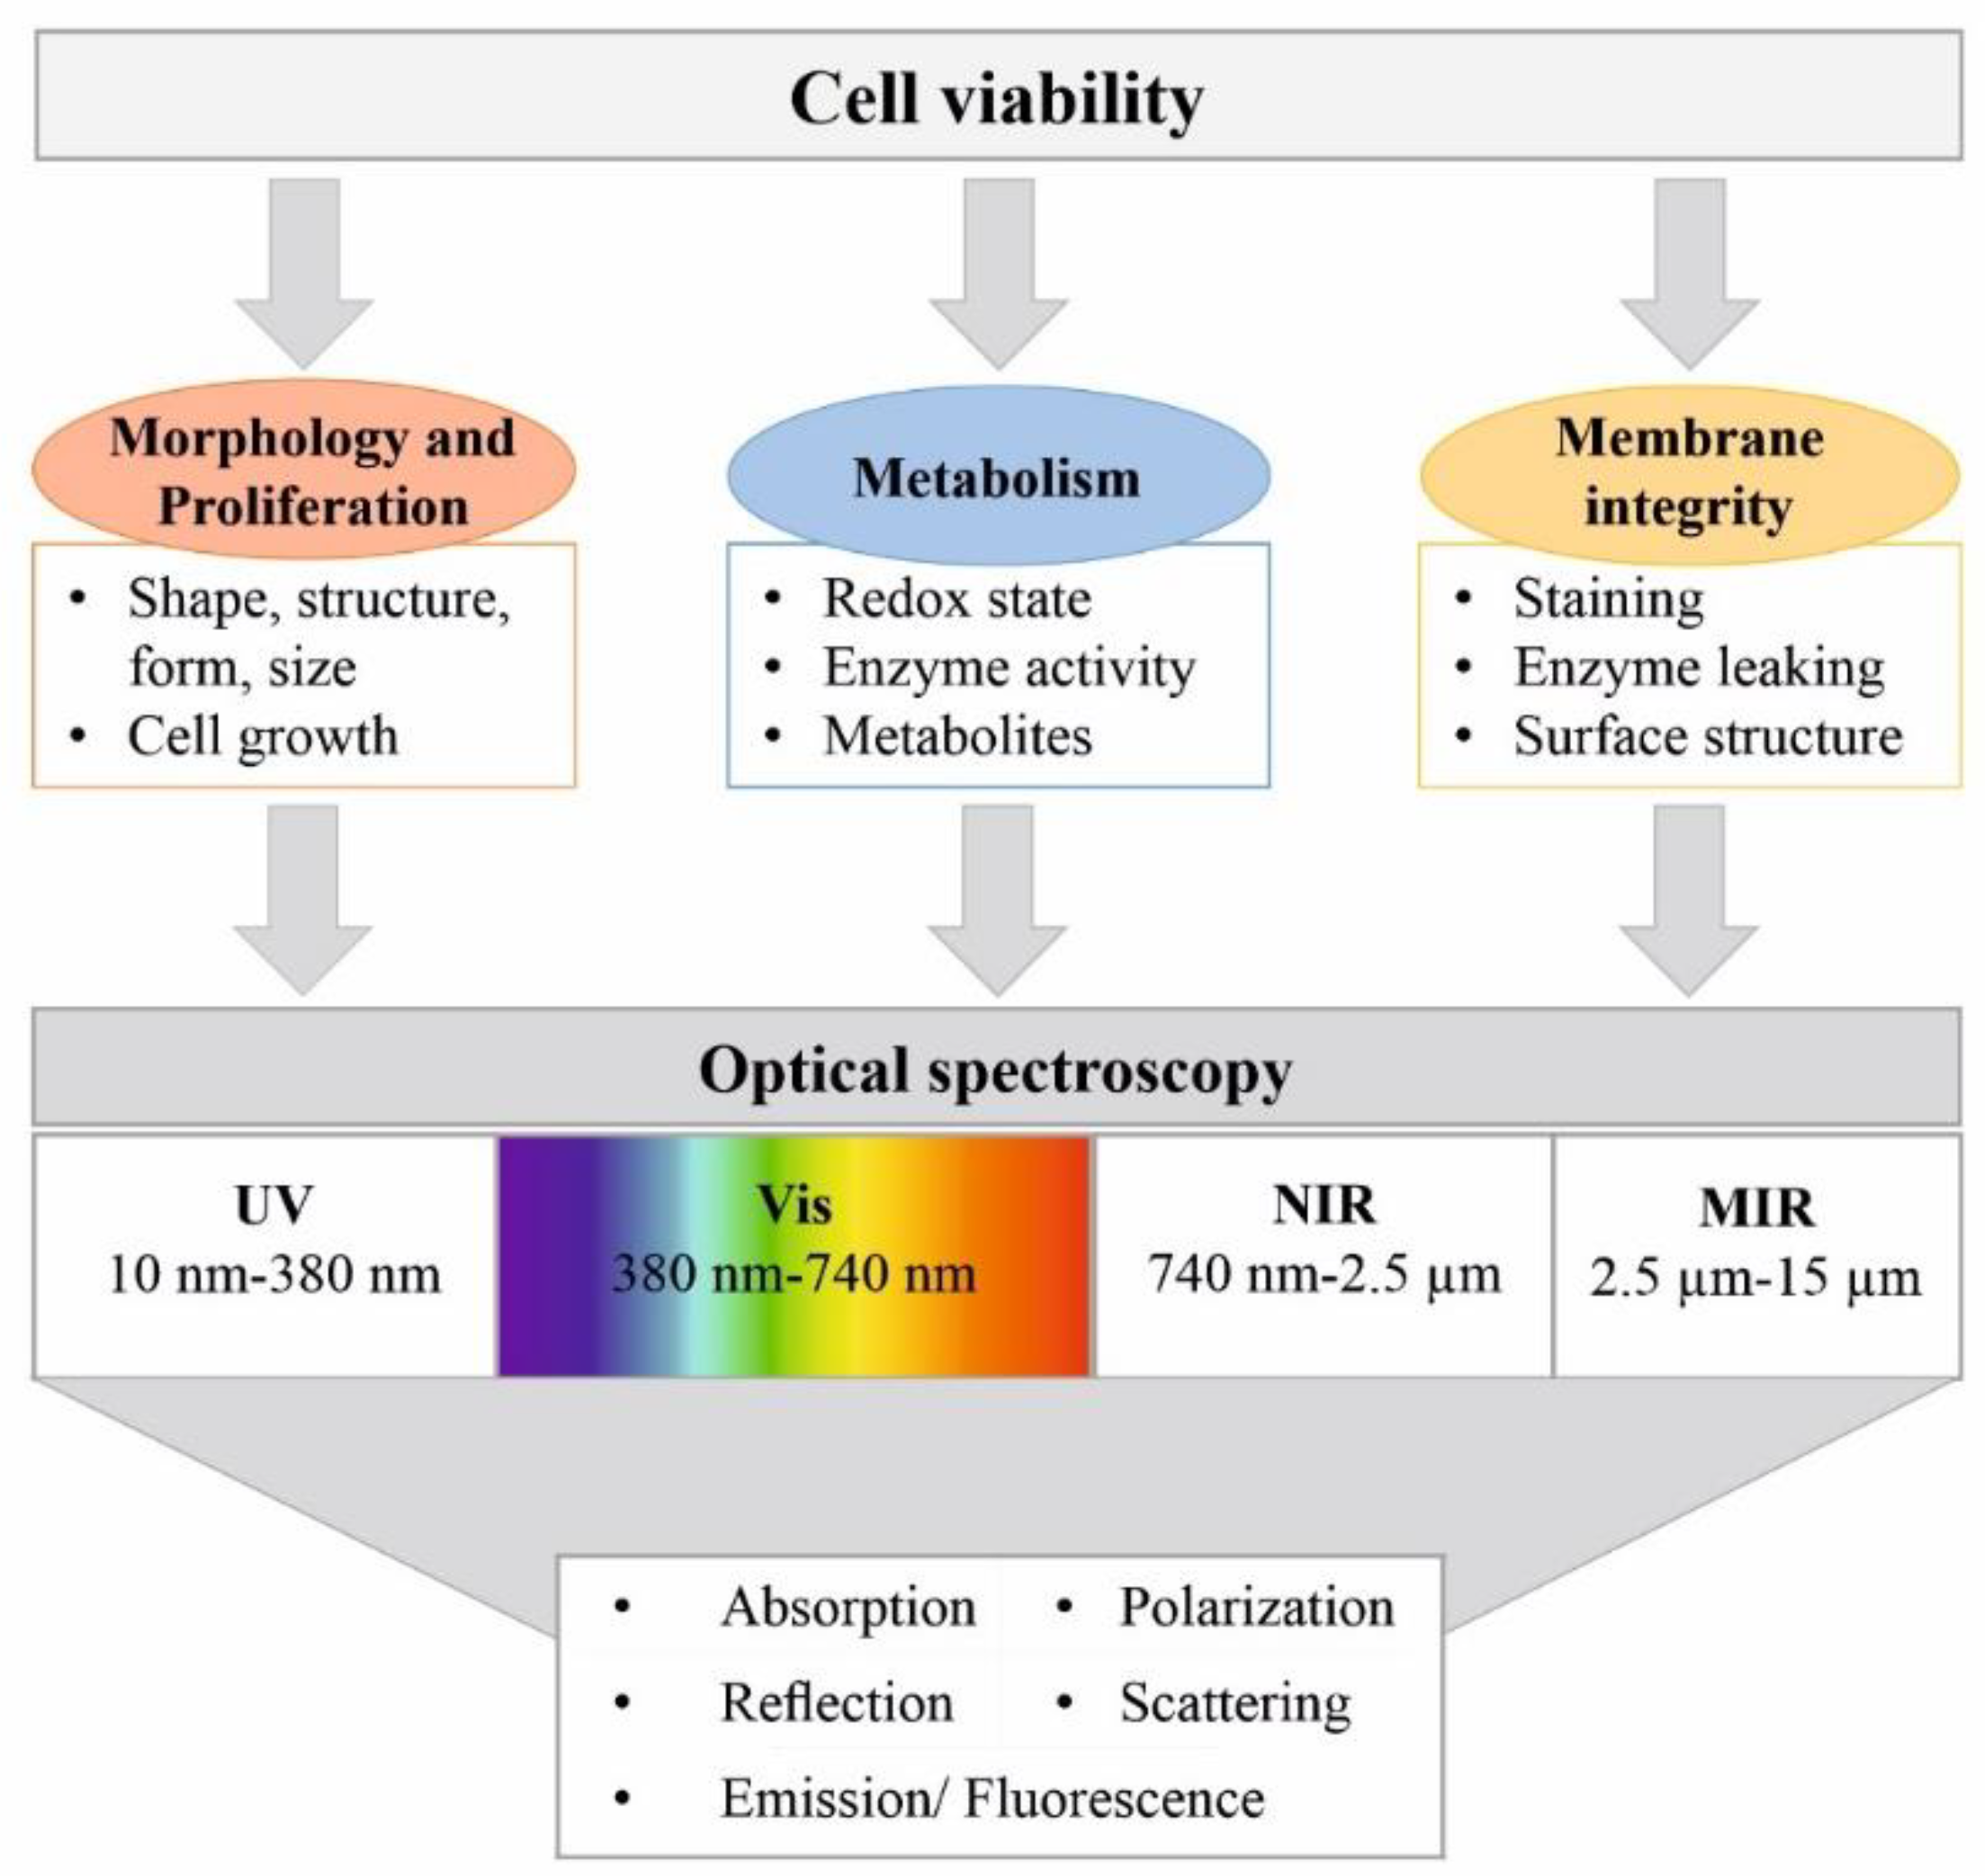
2. Basic Principles of Bioprocess Monitoring and Viability Determination
2.1. Bioreactor Modes of Operation and Monitoring Techniques
2.2. Sensor Requirements
2.3. Off-Line Methods for Viability Determination
3. Spectroscopy-Based Techniques for On-Line Monitoring of Viability
3.1. UV-Vis Spectroscopy
3.1.1. Absorption Measurements
3.1.2. Light-Scattering Measurements
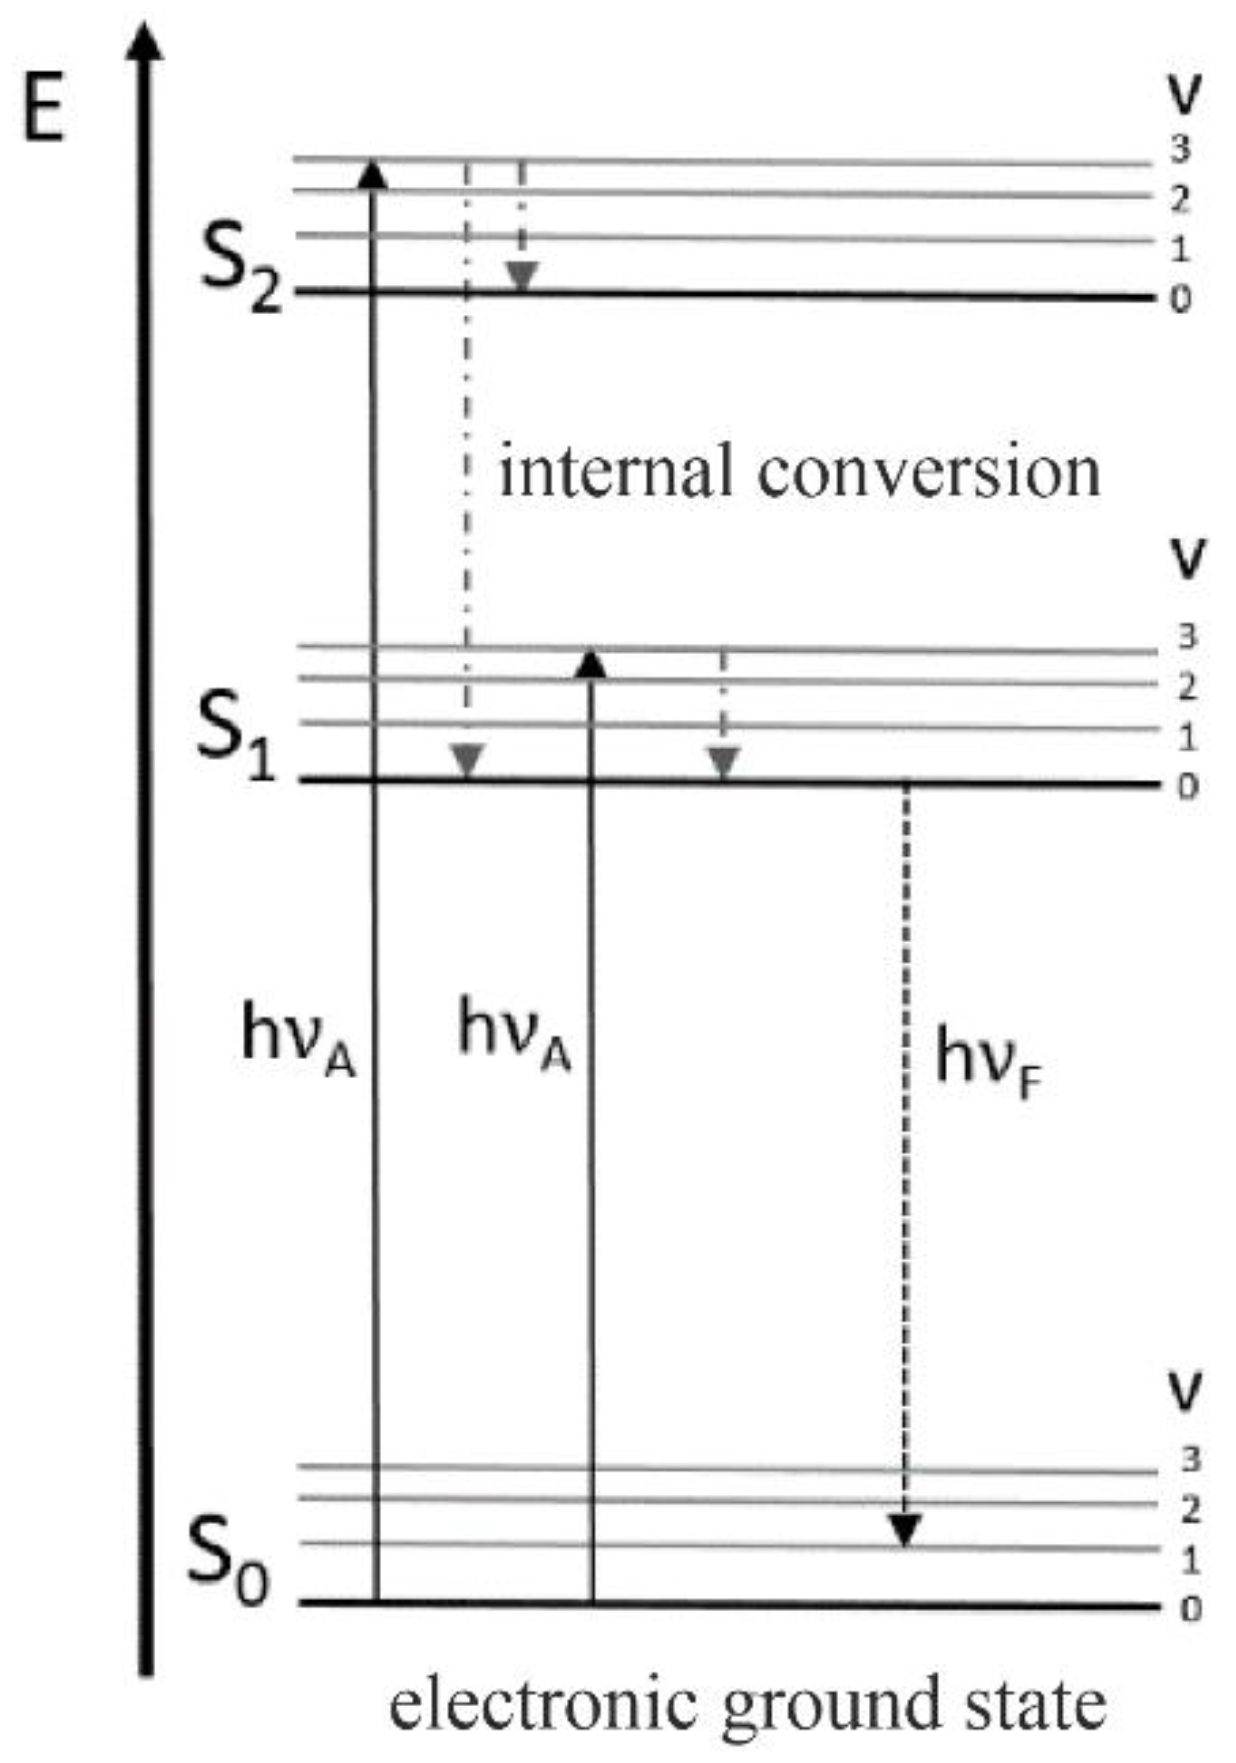
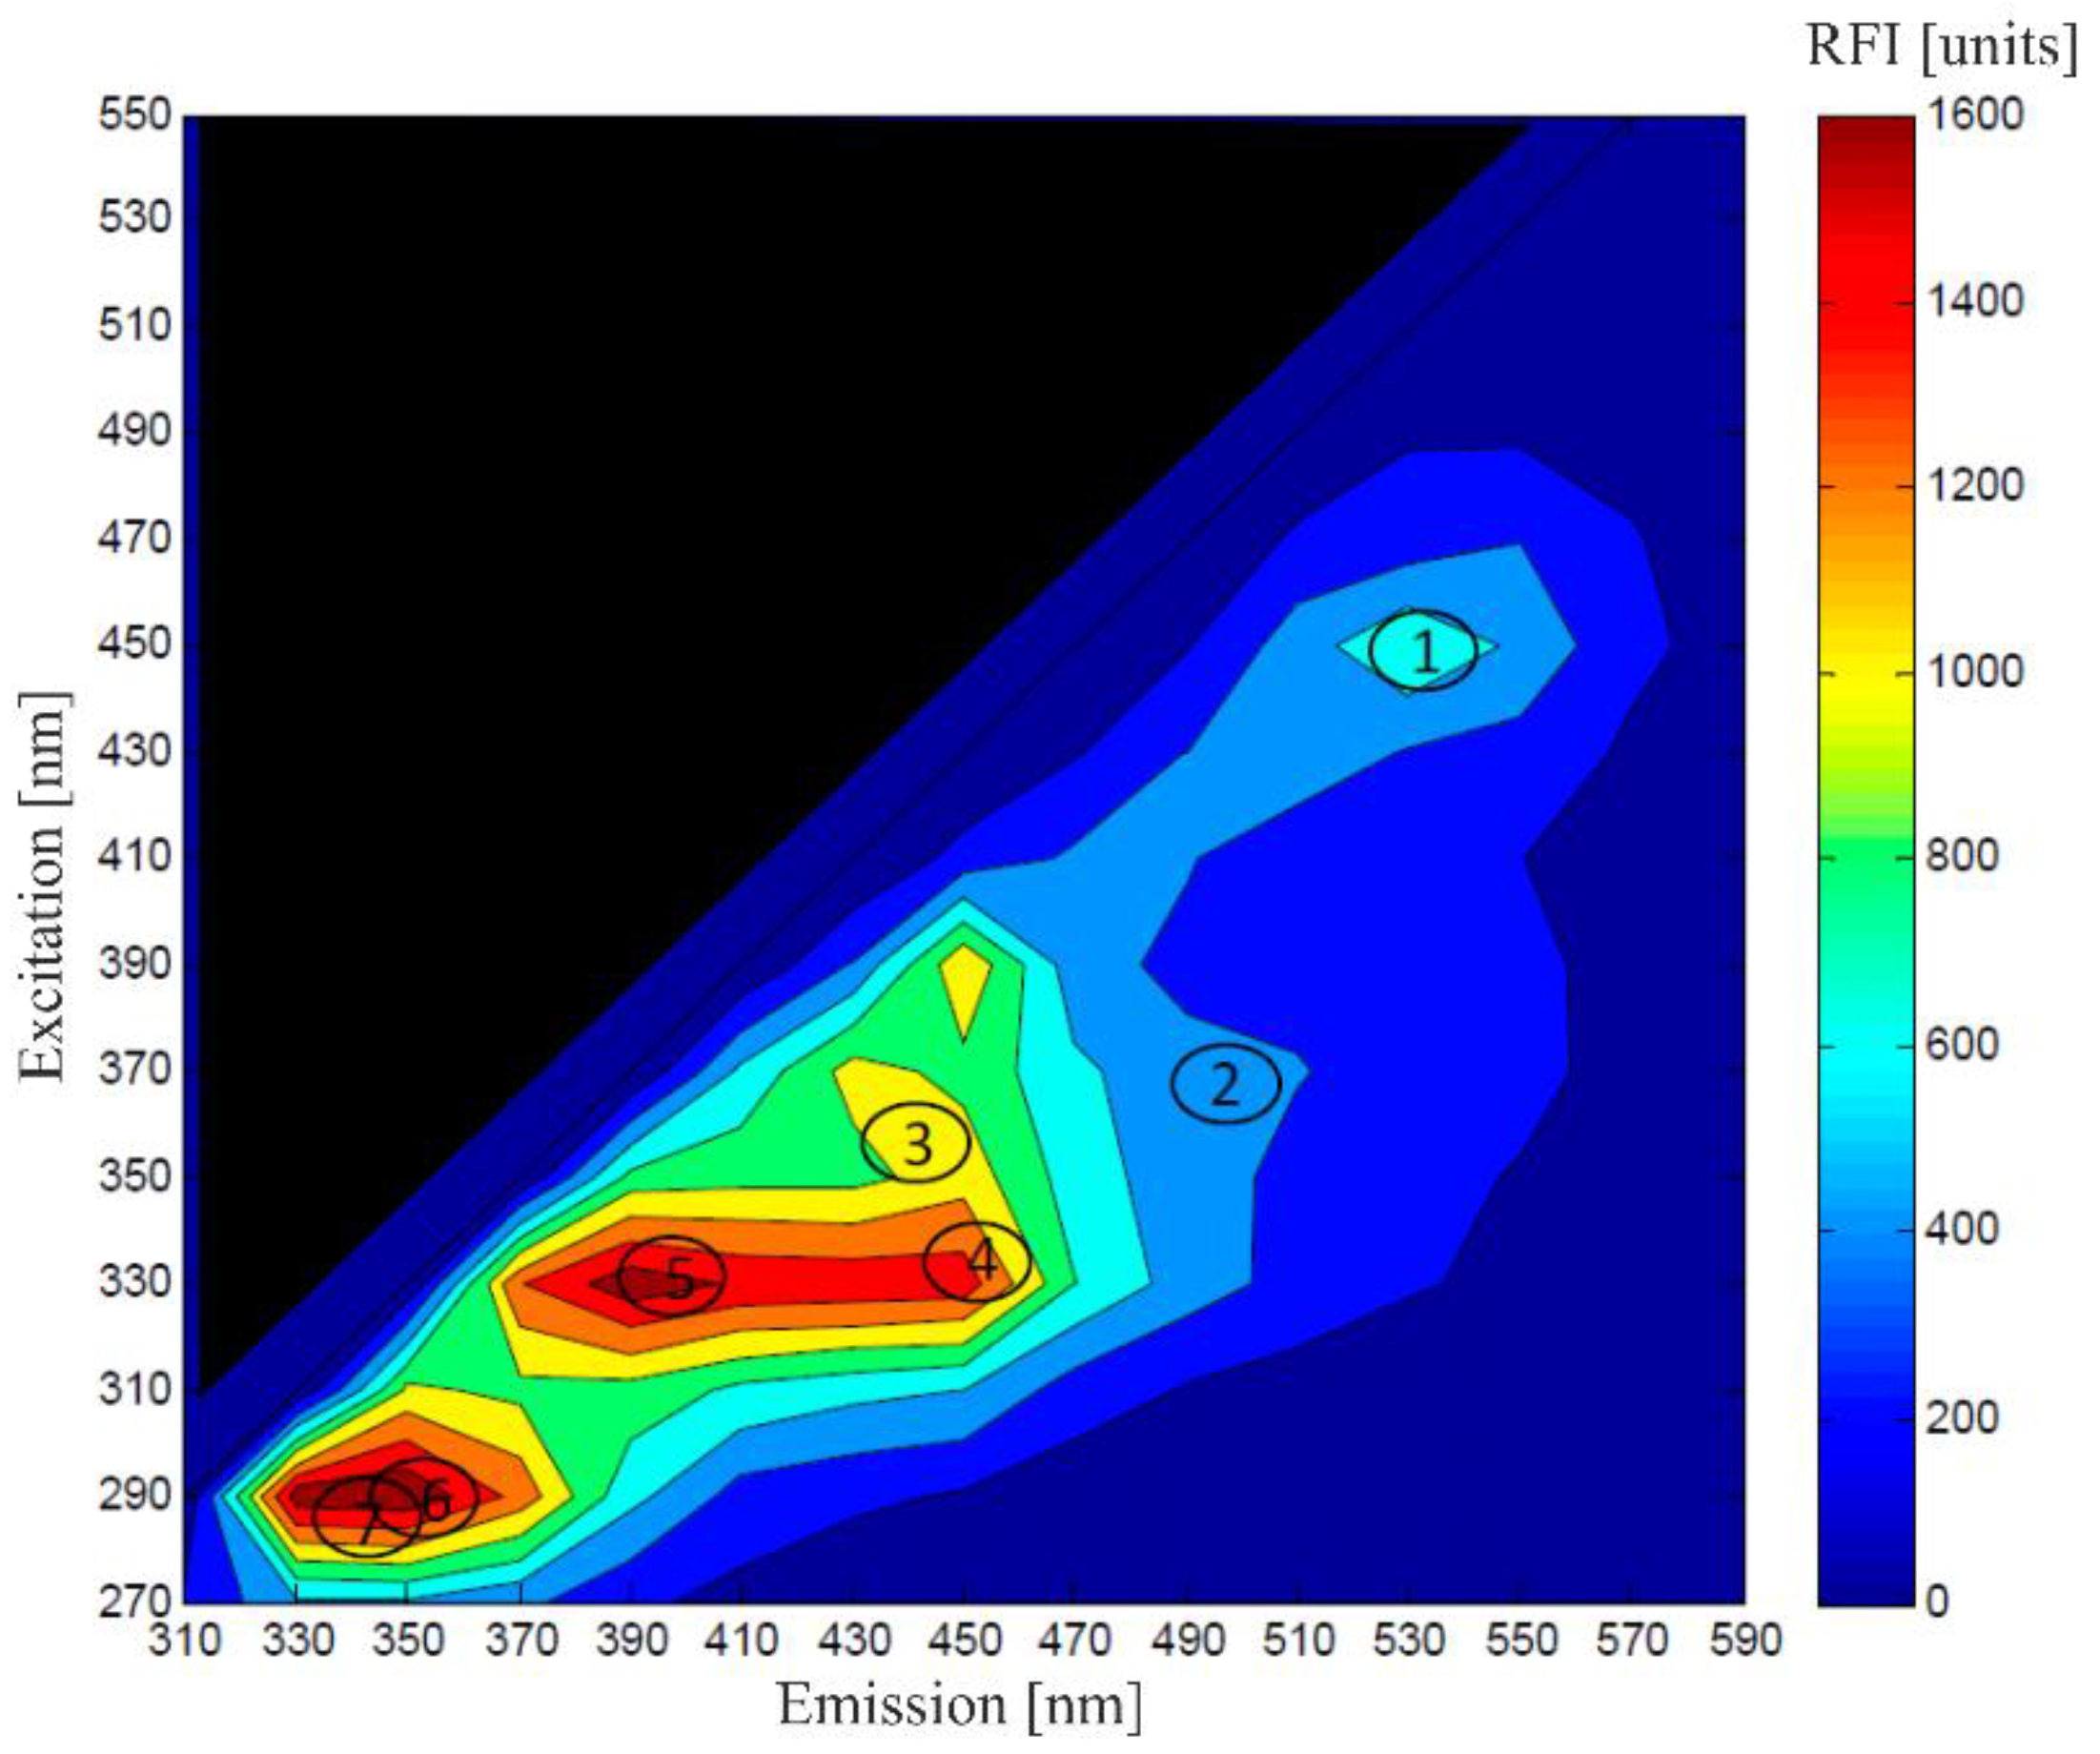
3.2. Fluorescence Spectroscopy
Time-Resolved Fluorescence Spectroscopy and Fluorescence Anisotropy
3.3. Infrared Spectroscopy
3.4. Raman Spectroscopy
3.5. Dielectric Spectroscopy/Capacitance Sensors
4. Soft Sensors
4.1. White-Box Sensors
4.2. Black-Box Sensors
4.3. Gray-Box Sensors
5. Conclusions and Future Perspectives
Author Contributions
Funding
Conflicts of Interest
Abbreviations
| 2D | two-dimensional |
| 7-AAD | 7-aminoactinomycin D |
| ANN | artificial neural networks |
| ATP | adenosine triphosphate |
| ATR | attenuated total reflectance |
| B. subtilis | Bacillus subtilis |
| calcein AM | calcein acetoxymethyl |
| CCD | charge-coupled device |
| CHO | Chinese hamster ovary |
| CPP | critical process parameters |
| CSTR | continuous stirred tank reactor |
| DA | data analysis |
| DLS | dynamic light scattering |
| D. salina | Dunaliella salina |
| E. coli | Escherichia coli |
| EEM | excitation–emission matrix |
| FAD | flavin adenine dinucleotide |
| FDA | food and drug administration |
| FIA | flow injection analysis |
| FMN | flavin mononucleotide |
| FSC | forward scatter |
| HCA-RS | high-content analysis Raman spectroscopy |
| IR | infrared |
| K. phaffii | Komagataella phaffii |
| LOQ | limit of quantification |
| LWR | locally weighted regression |
| MCR | multivariate curve resolution |
| MCR-ALS | multiple curve resolution–alternating least squares |
| MIR | mid-infrared |
| MS | mass spectrometry |
| MTT | 3-(4,5-dimethylthiazol-2-yl)-2,5-diphenyltetrazolium bromide |
| MVA | multivariate data analysis |
| NADH, NADPH | nicotinamide adenine dinucleotide (phosphate) |
| NIR | near-infrared |
| OD | optical density |
| PAT | process analytical technology |
| PC | principal component |
| PCA | principal component analysis |
| PFR | plug flow reactor |
| PLSR | partial least square regression |
| QbD | quality by design |
| RMSE(P) | root mean square error (of prediction) |
| SOP | standard operating procedure |
| SSC | side scatter |
| STR | stirred tank reactor |
| SU | single-use |
| SVM | support vector machine |
| UPLS | unfolded partial least squares |
| UV | ultraviolet |
| UV-vis | Ultraviolet–visible range of light |
References
- Pörtner, R. (Ed.) Cell Culture Engineering and Technology; Springer International Publishing: Cham, Switzerland, 2021; ISBN 978-3-030-79870-3. [Google Scholar]
- Claßen, J.; Aupert, F.; Reardon, K.F.; Solle, D.; Scheper, T. Spectroscopic sensors for in-line bioprocess monitoring in research and pharmaceutical industrial application. Anal. Bioanal. Chem. 2017, 409, 651–666. [Google Scholar] [CrossRef] [PubMed]
- Stärk, E.; Hitzmann, B.; Schügerl, K.; Scheper, T.; Fuchs, C.; Köster, D.; Märkl, H. In-situ-fluorescence-probes: A useful tool for non-invasive bioprocess monitoring. Adv. Biochem. Eng. Biotechnol. 2002, 74, 21–38. [Google Scholar] [CrossRef] [PubMed]
- Musmann, C.; Joeris, K.; Markert, S.; Solle, D.; Scheper, T. Spectroscopic methods and their applicability for high-throughput characterization of mammalian cell cultures in automated cell culture systems. Eng. Life Sci. 2016, 16, 405–416. [Google Scholar] [CrossRef]
- Biomass Sensors and Equipment. Available online: https://aberinstruments.com/biotech/biotech-product-range/#gref (accessed on 6 September 2022).
- BioPAT®Viamass. Available online: https://www.sartorius.com/shop/ww/en/eur/products-bioprocess-process-analysers/biopatviamass/p/BioPAT_Viamass (accessed on 6 September 2022).
- Viable Cell Density Sensors. Available online: https://www.hamiltoncompany.com/process-analytics/sensors/cell-density-sensors/viable-cell-density-sensors (accessed on 6 September 2022).
- Teixeira, A.P.; Oliveira, R.; Alves, P.M.; Carrondo, M.J.T. Advances in on-line monitoring and control of mammalian cell cultures: Supporting the PAT initiative. Biotechnol. Adv. 2009, 27, 726–732. [Google Scholar] [CrossRef] [PubMed]
- Villadsen, J. Bioreaction Engineering Principles; Springer: Berlin/Heidelberg, Germany, 2011; ISBN 978-1-4419-9688-6. [Google Scholar]
- Doran, P.M. Bioprocess Engineering Principles; Elsevier: London, UK, 2004; ISBN 0-12-220855-2. [Google Scholar]
- Simpson, R.; Sastry, S.K. Chemical and Bioprocess Engineering: Fundamental Concepts for First-Year Students; Springer: New York, NY, USA, 2013; ISBN 978-1-4614-9126-2. [Google Scholar]
- Chmiel, H. (Ed.) Bioprozesstechnik, 3rd ed.; Spektrum Akademischer Verlag: Heidelberg, Germany, 2011; ISBN 9783827424778. [Google Scholar]
- Beutel, S.; Henkel, S. In situ sensor techniques in modern bioprocess monitoring. Appl. Microbiol. Biotechnol. 2011, 91, 1493–1505. [Google Scholar] [CrossRef]
- Reyes, S.J.; Durocher, Y.; Pham, P.L.; Henry, O. Modern Sensor Tools and Techniques for Monitoring, Controlling, and Improving Cell Culture Processes. Processes 2022, 10, 189. [Google Scholar] [CrossRef]
- Mandenius, C.-F.; Titchener-Hooker, N.J. (Eds.) . Measurement, Monitoring, Modelling and Control of Bioprocesses; Springer: Berlin/Heidelberg, Germany, 2013; ISBN 978-3-642-36838-7. [Google Scholar]
- Sonnleitner, B. (Ed.) Bioanalysis and Biosensors for Bioprocess Monitoring; Springer: Berlin/Heidelberg, Germany, 2001; ISBN 9783540487739. [Google Scholar]
- Steinwedel, T.; Dahlmann, K.; Solle, D.; Scheper, T.; Reardon, K.F.; Lammers, F. Sensors for Disposable Bioreactor Systems. In Single-Use Technology in Biopharmaceutical Manufacture; Eibl, R., Eibl, D., Eds.; Wiley: Hoboken, NJ, USA, 2019; pp. 69–82. ISBN 9781119477839. [Google Scholar]
- Kuhnke, L.M.; Rehfeld, J.S.; Ude, C.; Beutel, S. Study on the development and integration of 3D-printed optics in small-scale productions of single-use cultivation vessels. Eng. Life Sci. 2022, 22, 440–452. [Google Scholar] [CrossRef]
- Samaras, J.J.; Micheletti, M.; Ding, W. Transformation of Biopharmaceutical Manufacturing through Single-Use Technologies: Current State, Remaining Challenges, and Future Development. Annu. Rev. Chem. Biomol. Eng. 2022, 13, 73–97. [Google Scholar] [CrossRef]
- Busse, C.; Biechele, P.; de Vries, I.; Reardon, K.F.; Solle, D.; Scheper, T. Sensors for disposable bioreactors. Eng. Life Sci. 2017, 17, 940–952. [Google Scholar] [CrossRef]
- Mauerhofer, L.-M.; Pappenreiter, P.; Paulik, C.; Seifert, A.H.; Bernacchi, S.; Rittmann, S.K.-M.R. Methods for quantification of growth and productivity in anaerobic microbiology and biotechnology. Folia Microbiol. 2019, 64, 321–360. [Google Scholar] [CrossRef]
- Kamiloglu, S.; Sari, G.; Ozdal, T.; Capanoglu, E. Guidelines for cell viability assays. Food Front. 2020, 1, 332–349. [Google Scholar] [CrossRef]
- Al-Madani, H.; Du, H.; Yao, J.; Peng, H.; Yao, C.; Jiang, B.; Wu, A.; Yang, F. Living Sample Viability Measurement Methods from Traditional Assays to Nanomotion. Biosensors 2022, 12, 453. [Google Scholar] [CrossRef] [PubMed]
- Riss, T.L.; Moravec, R.A.; Niles, A.L.; Duellman, S.; Benink, H.A.; Worzella, T.J.; Minor, L. Assay Guidance Manual: Cell Viability Assays; National Library of Medicine: Bethesda, MD, USA, 2004. [Google Scholar]
- Braissant, O.; Astasov-Frauenhoffer, M.; Waltimo, T.; Bonkat, G. A Review of Methods to Determine Viability, Vitality, and Metabolic Rates in Microbiology. Front. Microbiol. 2020, 11, 547458. [Google Scholar] [CrossRef] [PubMed]
- Ulber, R.; Frerichs, J.-G.; Beutel, S. Optical sensor systems for bioprocess monitoring. Anal. Bioanal. Chem. 2003, 376, 342–348. [Google Scholar] [CrossRef]
- Leme, J.; Fernández Núñez, E.G.; de Almeida Parizotto, L.; Chagas, W.A.; Salla dos Santos, E.; Tojeira Prestia Caricati, A.; Gonçalves de Rezende, A.; Labate Vale da Costa, B.; Ventini Monteiro, D.C.; Lopes Boldorini, V.L.; et al. A multivariate calibration procedure for UV/VIS spectrometric monitoring of BHK-21 cell metabolism and growth. Biotechnol. Prog. 2014, 30, 241–248. [Google Scholar] [CrossRef]
- Lourenço, N.D.; Lopes, J.A.; Almeida, C.F.; Sarraguça, M.C.; Pinheiro, H.M. Bioreactor monitoring with spectroscopy and chemometrics: A review. Anal. Bioanal. Chem. 2012, 404, 1211–1237. [Google Scholar] [CrossRef]
- Raithel, P.; Steinwedel, T.; Belz, M.; Solle, D. Disposable flowcell for spectroscopic analysis in bioprocesses. Proceedings of the Optical Fibers and Sensors for Medical Diagnostics, Treatment and Environmental Applications XXI, Online, 6–12 March 2021; Gannot, I., Roodenko, K., Eds.; SPIE: Bellingham, WA, USA, 2021; p. 40. ISBN 9781510641051. [Google Scholar]
- Park, C.W.; Yoon, K.Y.; Byeon, J.H.; Kim, K.; Hwang, J. Development of Rapid Assessment Method to Determine Bacterial Viability Based on Ultraviolet and Visible (UV-Vis) Spectroscopy Analysis Including Application to Bioaerosols. Aerosol Air Qual. Res. 2012, 12, 399–408. [Google Scholar] [CrossRef]
- Drieschner, T.; Ostertag, E.; Boldrini, B.; Lorenz, A.; Brecht, M.; Rebner, K. Direct optical detection of cell density and viability of mammalian cells by means of UV/VIS spectroscopy. Anal. Bioanal. Chem. 2020, 412, 3359–3371. [Google Scholar] [CrossRef]
- Kiefer, J.; Ebel, N.; Schlücker, E.; Leipertz, A. Characterization of Escherichia coli suspensions using UV/Vis/NIR absorption spectroscopy. Anal. Methods 2010, 2, 123–128. [Google Scholar] [CrossRef]
- Chapman, J.; Orrell-Trigg, R.; Kwoon, K.Y.; Truong, V.K.; Cozzolino, D. A high-throughput and machine learning resistance monitoring system to determine the point of resistance for Escherichia coli with tetracycline: Combining UV-visible spectrophotometry with principal component analysis. Biotechnol. Bioeng. 2021, 118, 1511–1519. [Google Scholar] [CrossRef]
- Offenbaume, K.L.; Bertone, E.; Stewart, R.A. Monitoring Approaches for Faecal Indicator Bacteria in Water: Visioning a Remote Real-Time Sensor for E. coli and Enterococci. Water 2020, 12, 2591. [Google Scholar] [CrossRef]
- Schulze, K.; López, D.A.; Tillich, U.M.; Frohme, M. A simple viability analysis for unicellular cyanobacteria using a new autofluorescence assay, automated microscopy, and ImageJ. BMC Biotechnol. 2011, 11, 118. [Google Scholar] [CrossRef] [PubMed] [Green Version]
- Loske, A.M.; Tello, E.M.; Vargas, S.; Rodriguez, R. Escherichia coli viability determination using dynamic light scattering: A comparison with standard methods. Arch. Microbiol. 2014, 196, 557–563. [Google Scholar] [CrossRef] [PubMed]
- Vargas, S.; Millán-Chiu, B.E.; Arvizu-Medrano, S.M.; Loske, A.M.; Rodríguez, R. Dynamic light scattering: A fast and reliable method to analyze bacterial growth during the lag phase. J. Microbiol. Methods 2017, 137, 34–39. [Google Scholar] [CrossRef]
- Latimer, P. Light scattering and absorption as methods of studying cell population parameters. Annu. Rev. Biophys. Bioeng. 1982, 11, 129–150. [Google Scholar] [CrossRef]
- Loken, M.R.; Sweet, R.G.; Herzenberg, L.A. Cell discrimination by multiangle light scattering. J. Histochem. Cytochem. 1976, 24, 284–291. [Google Scholar] [CrossRef] [Green Version]
- McKinnon, K.M. Flow Cytometry: An Overview. Curr. Protoc. Immunol. 2018, 120, 5.1.1–5.1.11. [Google Scholar] [CrossRef]
- Adan, A.; Alizada, G.; Kiraz, Y.; Baran, Y.; Nalbant, A. Flow cytometry: Basic principles and applications. Crit. Rev. Biotechnol. 2017, 37, 163–176. [Google Scholar] [CrossRef]
- Cross, D.A.; Latimer, P. Angular dependence of scaftering from Escherichia coli cells. Appl. Opt. 1972, 11, 1225–1228. [Google Scholar] [CrossRef]
- Koch, A.L.; Ehrenfeld, E. The size and shape of bacteria by light scattering measurements. Biochim. Biophys. Acta 1968, 165, 262–273. [Google Scholar] [CrossRef]
- Falke, S.; Betzel, C. Dynamic Light Scattering (DLS). In Radiation in Bioanalysis: Spectroscopic Techniques and Theoretical Methods; Pereira, A.S., Tavares, P., Limão-Vieira, P., Eds.; Springer: Cham, Switzerland, 2019; pp. 173–193. ISBN 978-3-030-28246-2. [Google Scholar]
- Głowacz, K.; Skorupska, S.; Grabowska-Jadach, I.; Ciosek-Skibińska, P. Excitation-emission matrix fluorescence spectroscopy for cell viability testing in UV-treated cell culture. RSC Adv. 2022, 12, 7652–7660. [Google Scholar] [CrossRef] [PubMed]
- König, J.C.; Steinwedel, T.; Solle, D.; Lindner, P.; de Vries, I.; Hentrop, T.; Findeis, M.; John, G.T.; Scheper, T.; Beutel, S. Development and characterisation of a new fluorescence sensor for online monitoring of bioprocesses. J. Sens. Sens. Syst. 2018, 7, 461–467. [Google Scholar] [CrossRef]
- Faassen, S.M.; Hitzmann, B. Fluorescence spectroscopy and chemometric modeling for bioprocess monitoring. Sensors 2015, 15, 10271–10291. [Google Scholar] [CrossRef] [PubMed] [Green Version]
- Heikal, A.A. Intracellular coenzymes as natural biomarkers for metabolic activities and mitochondrial anomalies. Biomark. Med. 2010, 4, 241–263. [Google Scholar] [CrossRef] [PubMed] [Green Version]
- Li, B.; Shanahan, M.; Calvet, A.; Leister, K.J.; Ryder, A.G. Comprehensive, quantitative bioprocess productivity monitoring using fluorescence EEM spectroscopy and chemometrics. Analyst 2014, 139, 1661–1671. [Google Scholar] [CrossRef] [Green Version]
- Sá, M.; Monte, J.; Brazinha, C.; Galinha, C.F.; Crespo, J.G. Fluorescence coupled with chemometrics for simultaneous monitoring of cell concentration, cell viability and medium nitrate during production of carotenoid-rich Dunaliella salina. Algal Res. 2019, 44, 101720. [Google Scholar] [CrossRef]
- Reardon, K.F.; Scheper, T.; Bailey, J.E. In situ fluorescence monitoring of immobilized Clostridium acetobutylicum. Biotechnol. Lett. 1986, 8, 817–822. [Google Scholar] [CrossRef]
- Marose, S.; Lindemann, C.; Scheper, T. Two-dimensional fluorescence spectroscopy: A new tool for on-line bioprocess monitoring. Biotechnol. Prog. 1998, 14, 63–74. [Google Scholar] [CrossRef]
- Teixeira, A.P.; Duarte, T.M.; Oliveira, R.; Carrondo, M.J.T.; Alves, P.M. High-throughput analysis of animal cell cultures using two-dimensional fluorometry. J. Biotechnol. 2011, 151, 255–260. [Google Scholar] [CrossRef]
- Ohadi, K.; Aghamohseni, H.; Legge, R.L.; Budman, H.M. Fluorescence-based soft sensor for at situ monitoring of Chinese hamster ovary cell cultures. Biotechnol. Bioeng. 2014, 111, 1577–1586. [Google Scholar] [CrossRef]
- Schwab, K.; Amann, T.; Schmid, J.; Handrick, R.; Hesse, F. Exploring the capabilities of fluorometric online monitoring on Chinese hamster ovary cell cultivations producing a monoclonal antibody. Biotechnol. Prog. 2016, 32, 1592–1600. [Google Scholar] [CrossRef]
- Claßen, J.; Graf, A.; Aupert, F.; Solle, D.; Höhse, M.; Scheper, T. A novel LED-based 2D-fluorescence spectroscopy system for in-line bioprocess monitoring of Chinese hamster ovary cell cultivations-Part II. Eng. Life Sci. 2019, 19, 341–351. [Google Scholar] [CrossRef] [Green Version]
- Graf, A.; Claßen, J.; Solle, D.; Hitzmann, B.; Rebner, K.; Hoehse, M. A novel LED-based 2D-fluorescence spectroscopy system for in-line monitoring of Chinese hamster ovary cell cultivations—Part I. Eng. Life Sci. 2019, 19, 352–362. [Google Scholar] [CrossRef] [PubMed] [Green Version]
- Havlik, I.; Beutel, S.; Scheper, T.; Reardon, K.F. On-Line Monitoring of Biological Parameters in Microalgal Bioprocesses Using Optical Methods. Energies 2022, 15, 875. [Google Scholar] [CrossRef]
- Sá, M.; Monte, J.; Brazinha, C.; Galinha, C.F.; Crespo, J.G. 2D Fluorescence spectroscopy for monitoring Dunaliella salina concentration and integrity during membrane harvesting. Algal Res. 2017, 24, 325–332. [Google Scholar] [CrossRef]
- Dittmar, R.; Potier, E.; van Zandvoort, M.; Ito, K. Assessment of cell viability in three-dimensional scaffolds using cellular auto-fluorescence. Tissue Eng. Part C Methods 2012, 18, 198–204. [Google Scholar] [CrossRef] [Green Version]
- Dittmar, R.; van Dijk, B.G.M.; van Zandvoort, M.A.M.J.; Ito, K. In situ label-free cell viability assessment of nucleus pulposus tissue. J. Orthop. Res. 2014, 32, 545–550. [Google Scholar] [CrossRef] [PubMed]
- Eng, J.; Lynch, R.M.; Balaban, R.S. Nicotinamide adenine dinucleotide fluorescence spectroscopy and imaging of isolated cardiac myocytes. Biophys. J. 1989, 55, 621–630. [Google Scholar] [CrossRef] [PubMed] [Green Version]
- Pogue, B.W.; Pitts, J.D.; Mycek, M.-A.; Sloboda, R.D.; Wilmot, C.M.; Brandsema, J.F.; O’Hara, J.A. In Vivo NADH Fluorescence Monitoring as an Assay for Cellular Damage in Photodynamic Therapy. Photochem. Photobiol. 2001, 74, 817. [Google Scholar] [CrossRef]
- Serwer, P.; Hayes, S.J.; Lieman, K.; Griess, G.A. In situ fluorescence microscopy of bacteriophage aggregates. J. Microsc. 2007, 228, 309–321. [Google Scholar] [CrossRef]
- Biscoe, T.J.; Duchen, M.R. Responses of type I cells dissociated from the rabbit carotid body to hypoxia. J. Physiol. 1990, 428, 39–59. [Google Scholar] [CrossRef] [PubMed]
- Beuthan, J.; Minet, O.; Muller, G. Observations of the fluorescence response of the coenzyme NADH in biological samples. Opt. Lett. 1993, 18, 1098. [Google Scholar] [CrossRef] [PubMed]
- Blacker, T.S.; Duchen, M.R. Investigating mitochondrial redox state using NADH and NADPH autofluorescence. Free Radic. Biol. Med. 2016, 100, 53–65. [Google Scholar] [CrossRef] [PubMed] [Green Version]
- Müllerová, L.; Marková, K.; Obruča, S.; Mravec, F. Use of Flavin-Related Cellular Autofluorescence to Monitor Processes in Microbial Biotechnology. Microorganisms 2022, 10, 1179. [Google Scholar] [CrossRef] [PubMed]
- Schneckenburger, H. Fluorescence decay kinetics and imaging of NAD(P)H and flavins as metabolic indicators. Opt. Eng. 1992, 31, 1447. [Google Scholar] [CrossRef]
- Houston, J.P.; Naivar, M.; Martin, J.C.; Goddard, G.; Carpenter, S.; Mourant, J.R.; Freyer, J.P. Endogenous Fluorescence Lifetime of Viable Cells by flow Cytometry. In Proceedings of the Imaging, Manipulation, and Analysis of Biomolecules, Cells, and Tissues VI , San Jose, CA, USA, 19 January 2008; Farkas, D.L., Nicolau, D.V., Leif, R.C., Eds.; SPIE: Bellingham, WA, USA, 2008. 68590T. [Google Scholar]
- Guo, H.-W.; Wei, Y.-H.; Wang, H.-W. Reduced nicotinamide adenine dinucleotide fluorescence lifetime detected poly(adenosine-5′-diphosphate-ribose) polymerase-1-mediated cell death and therapeutic effect of pyruvate. J. Biomed. Opt. 2011, 16, 68001. [Google Scholar] [CrossRef]
- Wang, H.-W.; Wei, Y.-H.; Guo, H.-W. Reduced nicotinamide adenine dinucleotide (NADH) fluorescence for the detection of cell death. Anticancer. Agents Med. Chem. 2009, 9, 1012–1017. [Google Scholar] [CrossRef]
- Vishwasrao, H.D.; Heikal, A.A.; Kasischke, K.A.; Webb, W.W. Conformational dependence of intracellular NADH on metabolic state revealed by associated fluorescence anisotropy. J. Biol. Chem. 2005, 280, 25119–25126. [Google Scholar] [CrossRef] [Green Version]
- Yuan, Y.; Li, Y.; Cameron, B.D.; Relue, P. Fluorescence Anisotropy of Cellular NADH as a Tool to Study Different Metabolic Properties of Human Melanocytes and Melanoma Cells. IEEE J. Select. Topics Quantum Electron. 2007, 13, 1671–1679. [Google Scholar] [CrossRef]
- Xie, N.; Zhang, L.; Gao, W.; Huang, C.; Huber, P.E.; Zhou, X.; Li, C.; Shen, G.; Zou, B. NAD+ metabolism: Pathophysiologic mechanisms and therapeutic potential. Signal Transduct. Target. Ther. 2020, 5, 227. [Google Scholar] [CrossRef]
- Thaler, C.; Blank, P.; Koushik, S.; Vogel, S. Time-Resolved Fluorescence Anisotropy. In FLIM Microscopy in Biology and Medicine; Clegg, R., Periasamy, A., Eds.; Chapman and Hall/CRC: Boca Raton, FL, USA, 2009; pp. 245–320. ISBN 978-1-4200-7890-9. [Google Scholar]
- Biechele, P.; Busse, C.; Solle, D.; Scheper, T.; Reardon, K. Sensor systems for bioprocess monitoring. Eng. Life Sci. 2015, 15, 469–488. [Google Scholar] [CrossRef]
- Ozaki, Y. Near-infrared spectroscopy—Its versatility in analytical chemistry. Anal. Sci. 2012, 28, 545–563. [Google Scholar] [CrossRef] [PubMed] [Green Version]
- Pasquini, C. Near Infrared Spectroscopy: Fundamentals, practical aspects and analytical applications. J. Braz. Chem. Soc. 2003, 14, 198–219. [Google Scholar] [CrossRef] [Green Version]
- Ozaki, Y.; Huck, C.; Tsuchikawa, S.; Engelsen, S.B. (Eds.) Near-Infrared Spectroscopy: Theory, Spectral Analysis, Instrumentation, and Applications; Springer: Singapore, 2021; ISBN 9789811586477. [Google Scholar]
- Abu-Absi, N.R.; Kenty, B.M.; Cuellar, M.E.; Borys, M.C.; Sakhamuri, S.; Strachan, D.J.; Hausladen, M.C.; Li, Z.J. Real time monitoring of multiple parameters in mammalian cell culture bioreactors using an in-line Raman spectroscopy probe. Biotechnol. Bioeng. 2011, 108, 1215–1221. [Google Scholar] [CrossRef]
- Zimmerleiter, R.; Kager, J.; Nikzad-Langerodi, R.; Berezhinskiy, V.; Westad, F.; Herwig, C.; Brandstetter, M. Probeless non-invasive near-infrared spectroscopic bioprocess monitoring using microspectrometer technology. Anal. Bioanal. Chem. 2020, 412, 2103–2109. [Google Scholar] [CrossRef] [PubMed] [Green Version]
- Arnold, S.A.; Crowley, J.; Woods, N.; Harvey, L.M.; McNeil, B. In-situ near infrared spectroscopy to monitor key analytes in mammalian cell cultivation. Biotechnol. Bioeng. 2003, 84, 13–19. [Google Scholar] [CrossRef] [PubMed]
- Sandor, M.; Rüdinger, F.; Bienert, R.; Grimm, C.; Solle, D.; Scheper, T. Comparative study of non-invasive monitoring via infrared spectroscopy for mammalian cell cultivations. J. Biotechnol. 2013, 168, 636–645. [Google Scholar] [CrossRef] [PubMed]
- Clavaud, M.; Roggo, Y.; von Daeniken, R.; Liebler, A.; Schwabe, J.-O. Chemometrics and in-line near infrared spectroscopic monitoring of a biopharmaceutical Chinese hamster ovary cell culture: Prediction of multiple cultivation variables. Talanta 2013, 111, 28–38. [Google Scholar] [CrossRef] [PubMed]
- Capito, F.; Zimmer, A.; Skudas, R. Mid-infrared spectroscopy-based analysis of mammalian cell culture parameters. Biotechnol. Prog. 2015, 31, 578–584. [Google Scholar] [CrossRef]
- Li, M.; Ebel, B.; Chauchard, F.; Guédon, E.; Marc, A. Parallel comparison of in situ Raman and NIR spectroscopies to simultaneously measure multiple variables toward real-time monitoring of CHO cell bioreactor cultures. Biochem. Eng. J. 2018, 137, 205–213. [Google Scholar] [CrossRef]
- Landgrebe, D.; Haake, C.; Höpfner, T.; Beutel, S.; Hitzmann, B.; Scheper, T.; Rhiel, M.; Reardon, K.F. On-line infrared spectroscopy for bioprocess monitoring. Appl. Microbiol. Biotechnol. 2010, 88, 11–22. [Google Scholar] [CrossRef] [PubMed]
- Arnold, S.A.; Gaensakoo, R.; Harvey, L.M.; McNeil, B. Use of at-line and in-situ near-infrared spectroscopy to monitor biomass in an industrial fed-batch Escherichia coli process. Biotechnol. Bioeng. 2002, 80, 405–413. [Google Scholar] [CrossRef] [PubMed]
- De Sousa Marques, A.; Nicácio, J.T.N.; Cidral, T.A.; de Melo, M.C.N.; de Lima, K.M.G. The use of near infrared spectroscopy and multivariate techniques to differentiate Escherichia coli and Salmonella Enteritidis inoculated into pulp juice. J. Microbiol. Methods 2013, 93, 90–94. [Google Scholar] [CrossRef]
- Tian, Y.; Gao, X.; Qi, W.-L.; Wang, Y.; Wang, X.; Zhou, J.; Lu, D.; Chen, B. Advances in differentiation and identification of foodborne bacteria using near infrared spectroscopy. Anal. Methods 2021, 13, 2558–2566. [Google Scholar] [CrossRef] [PubMed]
- Aguinaga Bósquez, J.P.; Oǧuz, E.; Cebeci, A.; Majadi, M.; Kiskó, G.; Gillay, Z.; Kovacs, Z. Characterization and Viability Prediction of Commercial Probiotic Supplements under Temperature and Concentration Conditioning Factors by NIR Spectroscopy. Fermentation 2022, 8, 66. [Google Scholar] [CrossRef]
- Mehdizadeh, H.; Lauri, D.; Karry, K.M.; Moshgbar, M.; Procopio-Melino, R.; Drapeau, D. Generic Raman-based calibration models enabling real-time monitoring of cell culture bioreactors. Biotechnol. Prog. 2015, 31, 1004–1013. [Google Scholar] [CrossRef]
- Berry, B.; Moretto, J.; Matthews, T.; Smelko, J.; Wiltberger, K. Cross-scale predictive modeling of CHO cell culture growth and metabolites using Raman spectroscopy and multivariate analysis. Biotechnol. Prog. 2015, 31, 566–577. [Google Scholar] [CrossRef]
- Whelan, J.; Craven, S.; Glennon, B. In situ Raman spectroscopy for simultaneous monitoring of multiple process parameters in mammalian cell culture bioreactors. Biotechnol. Prog. 2012, 28, 1355–1362. [Google Scholar] [CrossRef]
- Webster, T.A.; Hadley, B.C.; Hilliard, W.; Jaques, C.; Mason, C. Development of generic raman models for a GS-KOTM CHO platform process. Biotechnol. Prog. 2018, 34, 730–737. [Google Scholar] [CrossRef]
- Novikova, N.I.; Matthews, H.; Williams, I.; Sewell, M.A.; Nieuwoudt, M.K.; Simpson, M.C.; Broderick, N.G.R. Detecting Phytoplankton Cell Viability Using NIR Raman Spectroscopy and PCA. ACS Omega 2022, 7, 5962–5971. [Google Scholar] [CrossRef]
- Andreasen, M.; Lundgreen, K.; Holbech, H.; Hedegaard, M.A. Raman spectroscopy as a tool for viability assessment of planktonic organisms in UV treated ballast water. Vib. Spectrosc. 2020, 110, 103142. [Google Scholar] [CrossRef]
- Mondol, A.S.; Töpfer, N.; Rüger, J.; Neugebauer, U.; Popp, J.; Schie, I.W. New perspectives for viability studies with high-content analysis Raman spectroscopy (HCA-RS). Sci. Rep. 2019, 9, 12653. [Google Scholar] [CrossRef] [Green Version]
- Esmonde-White, K.A.; Cuellar, M.; Lewis, I.R. The role of Raman spectroscopy in biopharmaceuticals from development to manufacturing. Anal. Bioanal. Chem. 2022, 414, 969–991. [Google Scholar] [CrossRef] [PubMed]
- Esmonde-White, K.A.; Cuellar, M.; Uerpmann, C.; Lenain, B.; Lewis, I.R. Raman spectroscopy as a process analytical technology for pharmaceutical manufacturing and bioprocessing. Anal. Bioanal. Chem. 2017, 409, 637–649. [Google Scholar] [CrossRef] [PubMed] [Green Version]
- Justice, C.; Brix, A.; Freimark, D.; Kraume, M.; Pfromm, P.; Eichenmueller, B.; Czermak, P. Process control in cell culture technology using dielectric spectroscopy. Biotechnol. Adv. 2011, 29, 391–401. [Google Scholar] [CrossRef] [PubMed] [Green Version]
- Flores-Cosío, G.; Herrera-López, E.J.; Arellano-Plaza, M.; Gschaedler-Mathis, A.; Kirchmayr, M.; Amaya-Delgado, L. Application of dielectric spectroscopy to unravel the physiological state of microorganisms: Current state, prospects and limits. Appl. Microbiol. Biotechnol. 2020, 104, 6101–6113. [Google Scholar] [CrossRef] [PubMed]
- Yardley, J.E.; Kell, D.B.; Barrett, J.; Davey, C.L. On-line, real-time measurements of cellular biomass using dielectric spectroscopy. Biotechnol. Genet. Eng. Rev. 2000, 17, 3–35. [Google Scholar] [CrossRef] [Green Version]
- Braasch, K.; Nikolic-Jaric, M.; Cabel, T.; Salimi, E.; Bridges, G.E.; Thomson, D.J.; Butler, M. The changing dielectric properties of CHO cells can be used to determine early apoptotic events in a bioprocess. Biotechnol. Bioeng. 2013, 110, 2902–2914. [Google Scholar] [CrossRef]
- Metze, S.; Ruhl, S.; Greller, G.; Grimm, C.; Scholz, J. Monitoring online biomass with a capacitance sensor during scale-up of industrially relevant CHO cell culture fed-batch processes in single-use bioreactors. Bioprocess Biosyst. Eng. 2020, 43, 193–205. [Google Scholar] [CrossRef] [Green Version]
- Patel, P.; Markx, G.H. Dielectric measurement of cell death. Enzym. Microb. Technol. 2008, 43, 463–470. [Google Scholar] [CrossRef]
- Metze, S.; Blioch, S.; Matuszczyk, J.; Greller, G.; Grimm, C.; Scholz, J.; Hoehse, M. Multivariate data analysis of capacitance frequency scanning for online monitoring of viable cell concentrations in small-scale bioreactors. Anal. Bioanal. Chem. 2020, 412, 2089–2102. [Google Scholar] [CrossRef] [PubMed]
- Moore, B.; Sanford, R.; Zhang, A. Case study: The characterization and implementation of dielectric spectroscopy (biocapacitance) for process control in a commercial GMP CHO manufacturing process. Biotechnol. Prog. 2019, 35, e2782. [Google Scholar] [CrossRef] [PubMed]
- Wu, S.; Ketcham, S.A.; Corredor, C.C.; Both, D.; Drennen, J.K.; Anderson, C.A. Rapid at-line early cell death quantification using capacitance spectroscopy. Biotechnol. Bioeng. 2022, 119, 857–867. [Google Scholar] [CrossRef] [PubMed]
- Kiss, B.; Németh, Á. Application of a High Cell Density Capacitance Sensor to Different Microorganisms. Period. Polytech. Chem. Eng. 2016, 60, 290–297. [Google Scholar] [CrossRef] [Green Version]
- November, E.J.; van Impe, J.F. Evaluation of on-line viable biomass measurements during fermentations of Candida utilis. Bioprocess Eng. 2000, 23, 473–477. [Google Scholar] [CrossRef]
- Reis, G.B.; Horta, A.C.; Zangirolami, T.C.; Giordano, R.C.; Cruz, A.J. Control of Fed-Batch Yeast Cultivation Using a Capacitance Sensor. In 10th International Symposium on Process Systems Engineering; Elsevier: Amsterdam, The Netherlands; London, UK, 2009; pp. 1323–1328. ISBN 9780444534729. [Google Scholar]
- Horta, A.C.L.; da Silva, A.J.; Sargo, C.R.; Cavalcanti-Montaño, I.D.; Galeano-Suarez, I.D.; Velez, A.M.; Santos, M.P.; Gonçalves, V.M.; Giordano, R.C.; Zangirolami, T.C. On-Line Monitoring of Biomass Concentration Based on A Capacitance Sensor: Assessing the Methodology for Different Bacteria and Yeast High Cell Density Fed-Batch Cultures. Braz. J. Chem. Eng. 2015, 32, 821–829. [Google Scholar] [CrossRef]
- Downey, B.J.; Graham, L.J.; Breit, J.F.; Glutting, N.K. A novel approach for using dielectric spectroscopy to predict viable cell volume (VCV) in early process development. Biotechnol. Prog. 2014, 30, 479–487. [Google Scholar] [CrossRef] [Green Version]
- Lee, R.; Kim, J.; Kim, S.Y.; Jang, S.M.; Lee, S.-M.; Choi, I.-H.; Park, S.W.; Shin, J.-S.; Yoo, K.-H. Capacitance-based assay for real-time monitoring of endocytosis and cell viability. Lab. Chip 2012, 12, 2377–2384. [Google Scholar] [CrossRef]
- Patel, P.M.; Bhat, A.; Markx, G.H. A comparative study of cell death using electrical capacitance measurements and dielectrophoresis. Enzym. Microb. Technol. 2008, 43, 523–530. [Google Scholar] [CrossRef]
- Yan, W.; Di, T.; Lin, Y. A Data-Driven Soft Sensor Modeling Method Based on Deep Learning and its Application. IEEE Trans. Ind. Electron. 2017, 64, 4237–4245. [Google Scholar] [CrossRef]
- Warne, K.; Prasad, G.; Rezvani, S.; Maguire, L. Statistical and computational intelligence techniques for inferential model development: A comparative evaluation and a novel proposition for fusion. Eng. Appl. Artif. Intell. 2004, 17, 871–885. [Google Scholar] [CrossRef]
- Fortuna, L. Soft Sensors for Monitoring and Control of Industrial Processes; Springer: London, UK, 2007; ISBN 9781846284793. [Google Scholar]
- Hrnčiřík, P. Software Sensors for the Monitoring of Bioprocesses. In 15th International Conference on Soft Computing Models in Industrial and Environmental Applications (SOCO 2020); Herrero, Á., Cambra, C., Urda, D., Sedano, J., Quintián, H., Corchado, E., Eds.; Springer International Publishing: Cham, Switzerland, 2021; pp. 207–215. ISBN 978-3-030-57801-5. [Google Scholar]
- Kadlec, P.; Gabrys, B.; Strandt, S. Data-driven Soft Sensors in the process industry. Comput. Chem. Eng. 2009, 33, 795–814. [Google Scholar] [CrossRef] [Green Version]
- Kessler, W. Multivariate Datenanalyse für die Pharma-, Bio- und Prozessanalytik: Ein Lehrbuch; Wiley-VCH: Weinheim, Germany, 2007; ISBN 978-3-527-31262-7. [Google Scholar]
- Sagmeister, P.; Wechselberger, P.; Jazini, M.; Meitz, A.; Langemann, T.; Herwig, C. Soft sensor assisted dynamic bioprocess control: Efficient tools for bioprocess development. Chem. Eng. Sci. 2013, 96, 190–198. [Google Scholar] [CrossRef]
- Rathore, A.; Singh, S. Use of Multivariant Data Analysis in Bioprocessing. BioPharm Int. 2015, 28, 26–31. [Google Scholar]
- Beiroti, A.; Hosseini, S.N.; Norouzian, D.; Aghasadeghi, M.R.; Hatami Giklou Jajan, L. Development of Soft Sensors for Online Biomass Prediction in Production of Hepatitis B Vaccine. Biointerface Res. Appl. Chem. 2022, 13, 195. [Google Scholar] [CrossRef]
- Eren, F.; Aslan, M.; Kanarya, D.; Uysalli, Y.; Aydin, M.; Kiraz, B.; Aydin, O.; Kiraz, A. DeepCAN: A Modular Deep Learning System for Automated Cell Counting and Viability Analysis. IEEE J. Biomed. Health Inform. 2022, 26, 5575–5583. [Google Scholar] [CrossRef] [PubMed]
- Ng, W.L.; Chan, A.; Ong, Y.S.; Chua, C.K. Deep learning for fabrication and maturation of 3D bioprinted tissues and organs. Virtual Phys. Prototyp. 2020, 15, 340–358. [Google Scholar] [CrossRef]
- Moen, E.; Bannon, D.; Kudo, T.; Graf, W.; Covert, M.; van Valen, D. Deep learning for cellular image analysis. Nat. Methods 2019, 16, 1233–1246. [Google Scholar] [CrossRef]
- Zavala-Ortiz, D.A.; Ebel, B.; Li, M.-Y.; Barradas-Dermitz, D.M.; Hayward-Jones, P.M.; Aguilar-Uscanga, M.G.; Marc, A.; Guedon, E. Interest of locally weighted regression to overcome nonlinear effects during in situ NIR monitoring of CHO cell culture parameters and antibody glycosylation. Biotechnol. Prog. 2020, 36, e2924. [Google Scholar] [CrossRef]
- Rajwa, B.; Venkatapathi, M.; Ragheb, K.; Banada, P.P.; Hirleman, E.D.; Lary, T.; Robinson, J.P. Automated classification of bacterial particles in flow by multiangle scatter measurement and support vector machine classifier. Cytom. A 2008, 73, 369–379. [Google Scholar] [CrossRef]
- Ohadi, K.; Legge, R.L.; Budman, H.M. Development of a soft-sensor based on multi-wavelength fluorescence spectroscopy and a dynamic metabolic model for monitoring mammalian cell cultures. Biotechnol. Bioeng. 2015, 112, 197–208. [Google Scholar] [CrossRef] [PubMed]
- Hergeth, W.-D. On-Line Monitoring of Chemical Reactions. In Ullmann’s Encyclopedia of Industrial Chemistry; Wiley-VCH Verlag GmbH & Co. KGaA: Weinheim, Germany, 2000; ISBN 3527306730. [Google Scholar]
- Veloso, A.C.; Ferreira, E.C. Online Analysis for Industrial Bioprocesses. In Current Developments in Biotechnology and Bioengineering; Elsevier: Amsterdam, The Netherlands, 2017; pp. 679–704. ISBN 9780444636638. [Google Scholar]
- Scheper, T.; Beutel, S.; McGuinness, N.; Heiden, S.; Oldiges, M.; Lammers, F.; Reardon, K.F. Digitalization and Bioprocessing: Promises and Challenges. Adv. Biochem. Eng. Biotechnol. 2021, 176, 57–69. [Google Scholar] [CrossRef] [PubMed]
- Schütte, G. What kind of innovation policy does the bioeconomy need? New Biotechnol. 2018, 40, 82–86. [Google Scholar] [CrossRef] [PubMed]
- Javaid, M.; Haleem, A.; Singh, R.P.; Rab, S.; Suman, R. Significance of sensors for industry 4.0: Roles, capabilities, and applications. Sens. Int. 2021, 2, 100110. [Google Scholar] [CrossRef]
- Bodenbenner, M.; Montavon, B.; Schmitt, R.H. FAIR sensor services—Towards sustainable sensor data management. Meas. Sens. 2021, 18, 100206. [Google Scholar] [CrossRef]


Publisher’s Note: MDPI stays neutral with regard to jurisdictional claims in published maps and institutional affiliations. |
© 2022 by the authors. Licensee MDPI, Basel, Switzerland. This article is an open access article distributed under the terms and conditions of the Creative Commons Attribution (CC BY) license (https://creativecommons.org/licenses/by/4.0/).
Share and Cite
Rösner, L.S.; Walter, F.; Ude, C.; John, G.T.; Beutel, S. Sensors and Techniques for On-Line Determination of Cell Viability in Bioprocess Monitoring. Bioengineering 2022, 9, 762. https://doi.org/10.3390/bioengineering9120762
Rösner LS, Walter F, Ude C, John GT, Beutel S. Sensors and Techniques for On-Line Determination of Cell Viability in Bioprocess Monitoring. Bioengineering. 2022; 9(12):762. https://doi.org/10.3390/bioengineering9120762
Chicago/Turabian StyleRösner, Laura S., Franziska Walter, Christian Ude, Gernot T. John, and Sascha Beutel. 2022. "Sensors and Techniques for On-Line Determination of Cell Viability in Bioprocess Monitoring" Bioengineering 9, no. 12: 762. https://doi.org/10.3390/bioengineering9120762