1. Introduction
The cardiovascular system warrants blood to transport oxygen and nutrients through the body. The heart’s left side receives and pumps the oxygenated blood to the rest of the body through the aorta. The cardiovascular system includes the aorta, coronary, carotid arteries, and others. The coronary arteries emerge from the ascending aorta and supply blood to the heart. Small coronary branches go through the heart muscle to provide it with the necessary oxygenated blood. Additionally, the neck’s main blood vessels, the carotid arteries, carry blood to the brain, neck, and face. Every carotid artery in the neck splits into two branches: the external carotid artery (ECA), which delivers blood to the face and neck, and the internal carotid artery (ICA), which supplies blood to the brain [
1].
Cardiovascular disease (CVD) is collectively referred to as a condition affecting the heart and the blood vessels. It’s usually characterized by the thickening and hardening of the vessel walls due to endothelial dysfunction and plaque development, defined as atherosclerosis. Atherosclerosis is a significant arterial disease associated with the accumulation of cholesterol and other lipids beneath the internal layer of the artery and causes stenosis, which is a reduction in the cross-sectional area of the lumen [
2].
Endothelial dysfunction is a primary precursor to atherosclerosis leading to a disturbance in hemodynamics [
3]. The plaques accumulate over distorted endothelial cell regions due to low wall shear stress and associated descriptors (flow circulation) [
4]. Low wall shear stress (WSS) leads to plaque susceptibility and initiation. Once the plaques are formed, an increase in WSS value is observed. Accordingly, high WSS leads to a rupture of the plaques and potentially even thrombosis [
5]. Eshtehardi et al. [
6] epitomized the clinical data associating high WSS with prospective endothelial cell damage as a putative etiological mechanism underpinning high-risk plaque formation. Endothelial shear stress is associated with plaque development characteristics with low defined as
, physiologic (intermediate) of
, and high WSS
[
7,
8].
Understanding the mechanisms underlying the initiation and progression of atherosclerosis requires a thorough knowledge of blood flow. Several clinical methods have been used for the in vivo investigation of blood flow-related variables, such as the use of phase contrast magnetic resonance imaging (MRI), Doppler ultrasound, and particle-based methods such as particle image velocimetry (PIV) [
9,
10]. Doppler ultrasound can be used for early diagnosis of internal carotid artery (ICA) stenosis through extracranial hemodynamics [
11]. Thereby, computational simulation emerges as a more efficient alternative to predict blood behavior and hemodynamics [
12]. The hemodynamics was numerically investigated in symmetrical and asymmetrical bifurcating of pulsatile flow in simplified geometries [
13]. Mekheimer et al. [
14] presented numerically that mixing the blood with the synovial fluid can change the rheological properties of the blood and the mechanical characteristics of the formed stenosis. Accordingly, computational fluid dynamics (CFD) has been extensively used in the investigation of hemodynamics [
15]. Additionally, CFD can lead to non-invasive procedures for diagnosing different diseases, such as atherosclerosis before they proceed to severe instances [
16,
17]. Taebi [
18] presented recent deep-learning approaches integrated with CFD for computational hemodynamics.
The vascular arterial wall has an extremely intricate structure with various mechanical properties. The derivation of accurate comprehensive models for such a complicated structure is highly difficult and continues to be a challenging point of active research. High-complexity models are essential in capturing detailed features of the material’s mechanical behavior. However, simpler models are less accurate but more practicable from mathematical and computational standpoints. Accordingly, a proper balance between high-complexity and simpler models is necessary to obtain the mechanical features with appropriate computational simulation.
The arterial behavior was approximated to be a rigid body using fluid flow modeling [
19]. Further studies considered fluid domain simulations coupled with finite element analysis of the arterial wall response through two-way fluid–structure interaction (FSI). FSI is a multiphysics coupling of fluid dynamics and structural mechanics regulations. This phenomenon, which can be steady or oscillatory, is characterized by interactions between a deformable or moving structure and a surrounding or interior fluid flow. This multiphysics coupling is a more realistic approach for simulating the influence of the blood flow on the artery vessel and vice versa [
20]. However, FSI necessitates additional modeling assumptions regarding the vessel’s mechanical properties and significantly more computational effort. Several researchers investigated the hemodynamics of arteriosclerosis diseases using the FSI procedure in stenosed vessels [
21,
22]. Dong et al. [
23] presented a correlation between the angulation of the coronary artery branches and the local mechanical and hemodynamic stresses at the artery bifurcation using FSI analysis. Additionally, Failer et al. [
24] investigated the impact of using FSI to simulate blood flow in simple stenotic geometry. Zouggari et al. [
25] investigated the influence of plaques on the WSS distribution using FSI analysis and CFD simulations. The obtained results showed attenuation of WSS values only at the plaque region.
The morphologic features of plaques can be classified based on how the artery is narrowed as asymmetric (eccentric stenosis) and axisymmetric (concentric stenosis) [
26]. Different stenosis morphologies were investigated, including oval, bean-shaped, and crescent, either with or without eccentricity [
27]. Eccentric lesions are frequently common in patients with partially occlusive thrombus or ruptured atherosclerotic plaques [
28]. Additionally, according to Poepping et al. [
29], flow patterns varied amongst stenoses of various eccentricities, with the salient changes reflected in the circulation regions’ size and position.
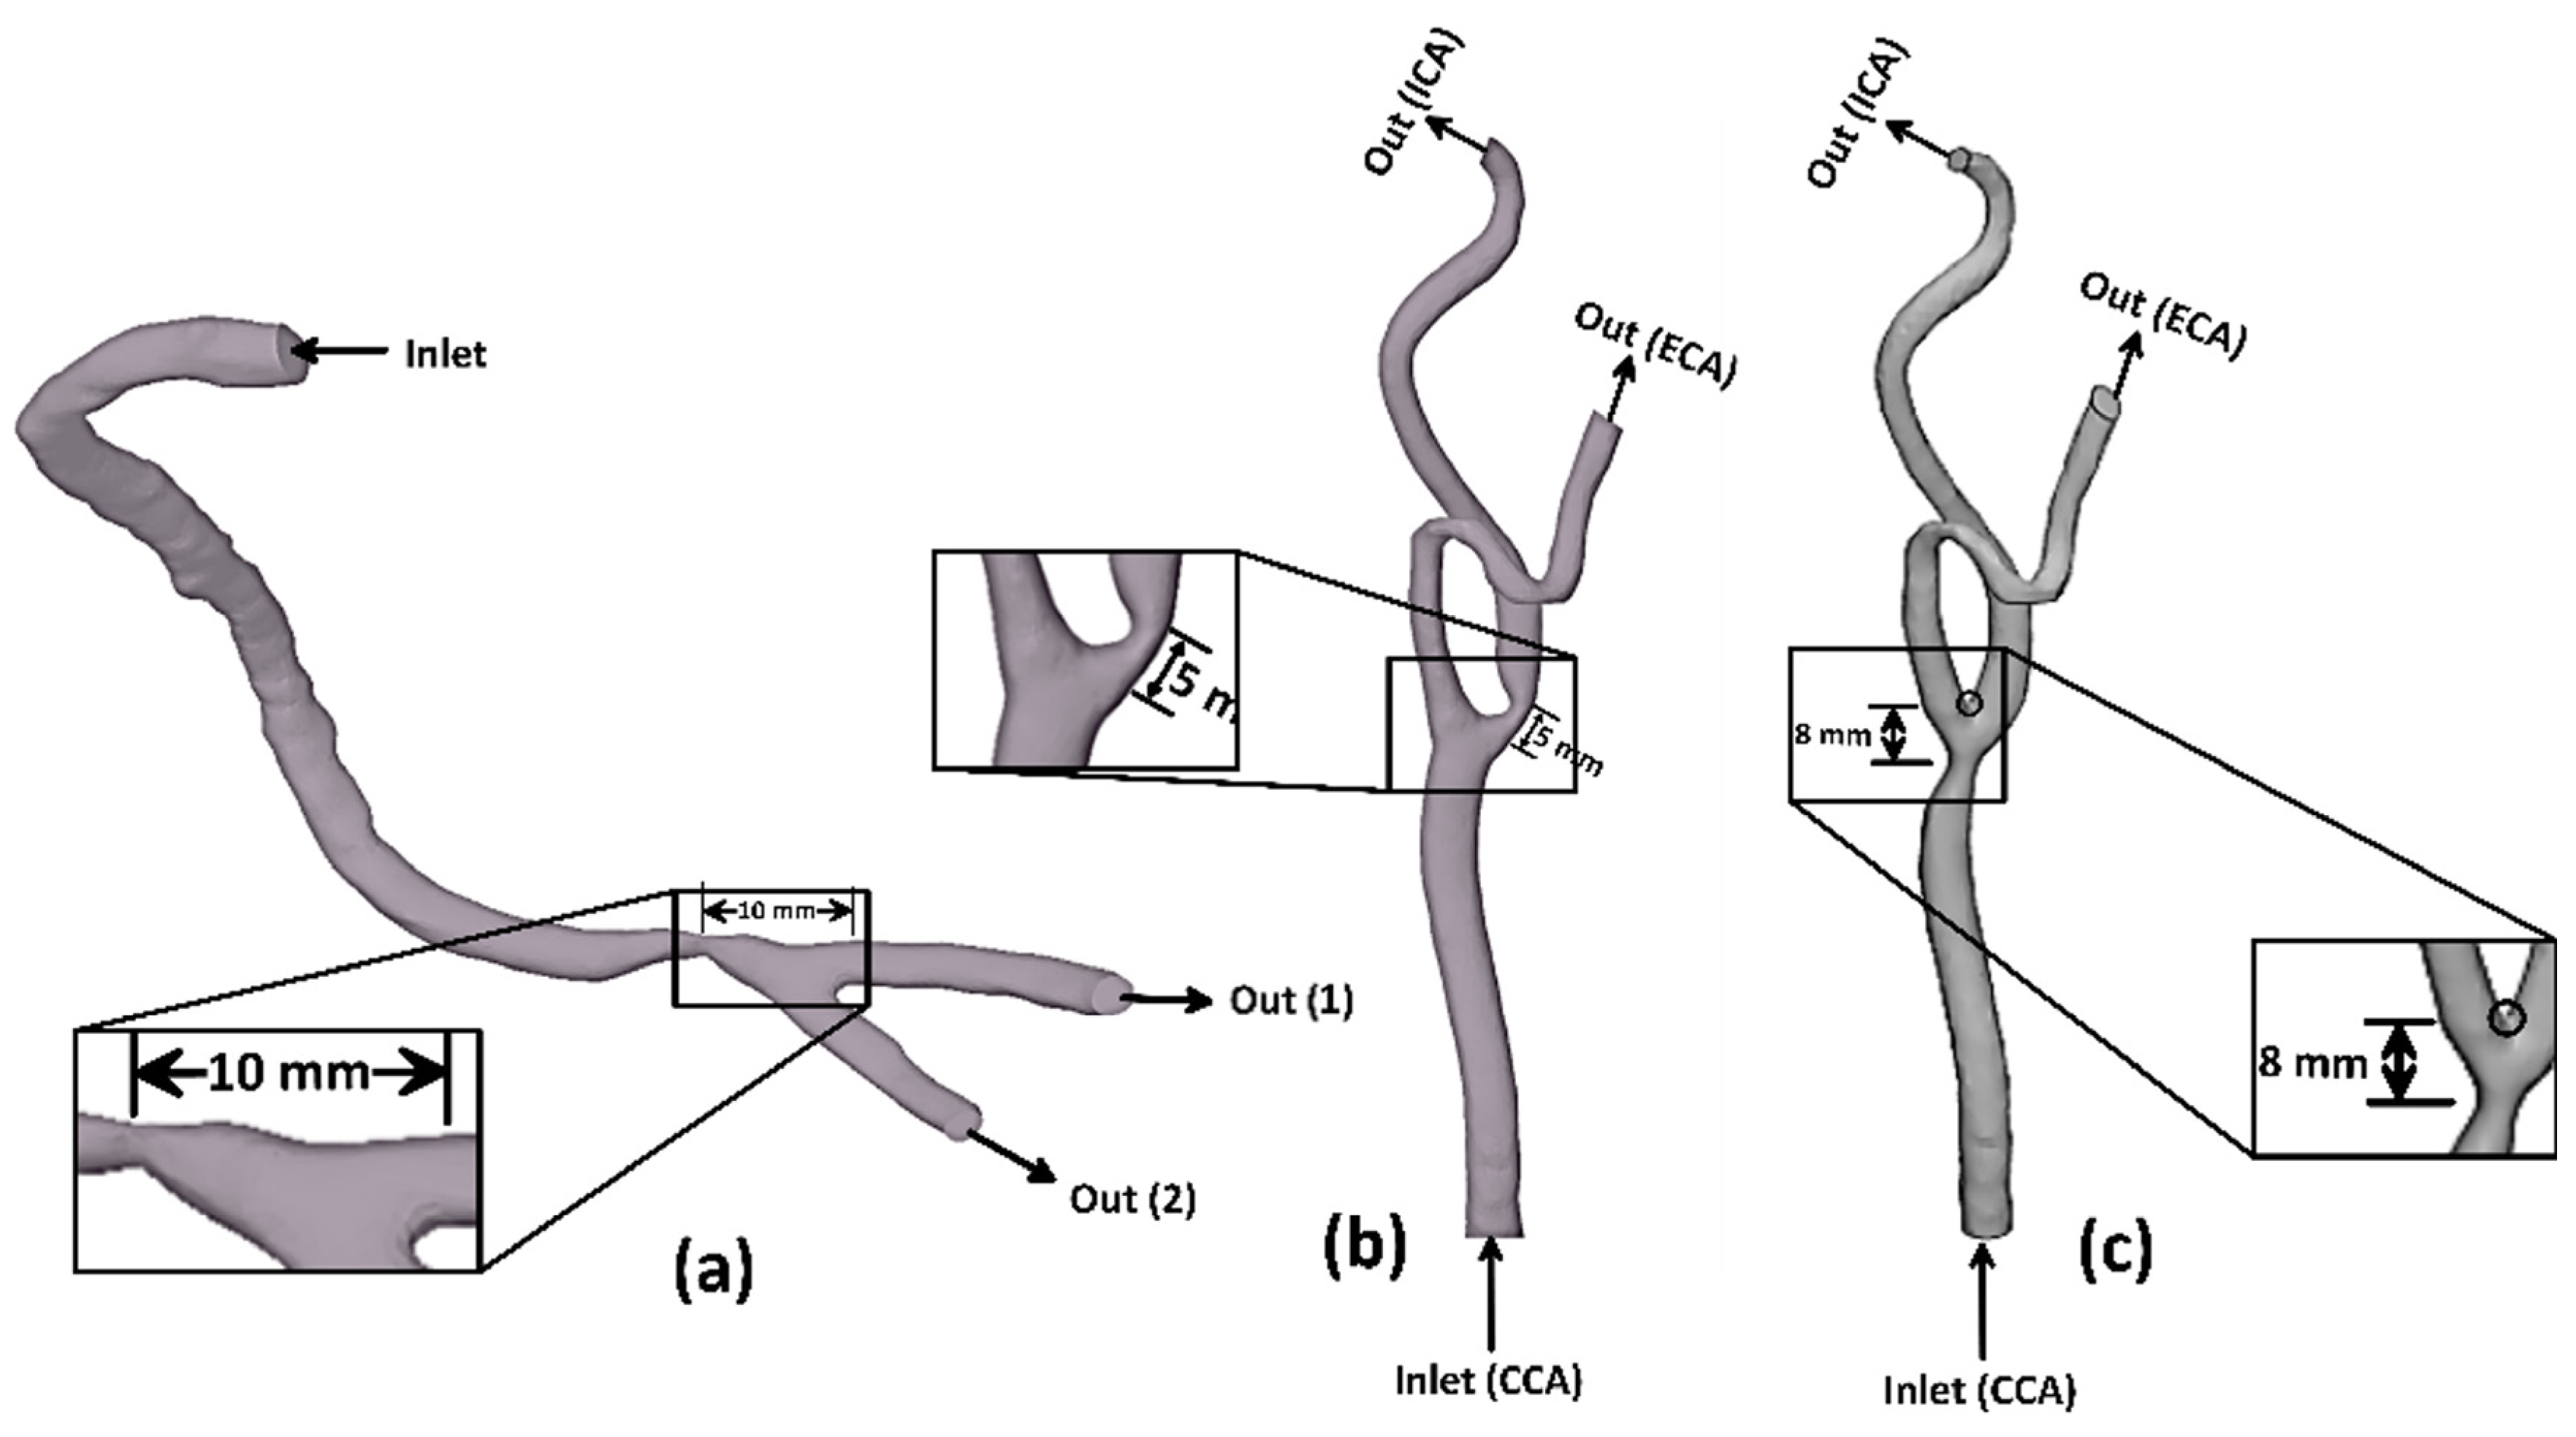
Based on a review of the literature, several studies investigated the influence of wall compliance on the hemodynamics of stenotic arteries. However, to the authors’ knowledge, no reported research has assessed the rigid wall assumption of patient-specific arteries based on hemodynamics. Therefore, the originality of the current work is to investigate the hemodynamics in coronary and carotid arteries and compare the obtained results with the corresponding values obtained using rigid wall assumption. The hemodynamics was estimated based on the numerical simulation of a comprehensive three-dimensional non-Newtonian blood flow model in elastic and rigid arteries. Accordingly, the two-way FSI approach is considered when coupling the blood flow model with the finite element analysis of wall elasticity in the case of eccentric stenoses with a moderate degree of severity. Lastly, a comparison between predicted results of coronary and carotid arteries with those obtained under rigid wall assumption is reported and discussed.
3. Results and discussion
3.1. Wall Shear Stress (WSS)
The WSS induced due to the arterial blood flow system influences the deposition of cholesterol beneath the internal layer of the arteries. Accordingly, the WSS is considered to be an indication of atherosclerotic plaque formation in the vascular system [
42]. Furthermore, high shear stresses near the stenotic throat can activate platelets and thus cause thrombosis and complete blockage of the blood flow to the heart or the brain [
42]. An exciting piece of evidence from different studies suggests that wall shear stress is associated with the plaque’s development characteristics with low defined as less than 1 Pa and high WSS values greater than 2.5 Pa, which are frequently associated with high-risk plaque features [
7,
8].
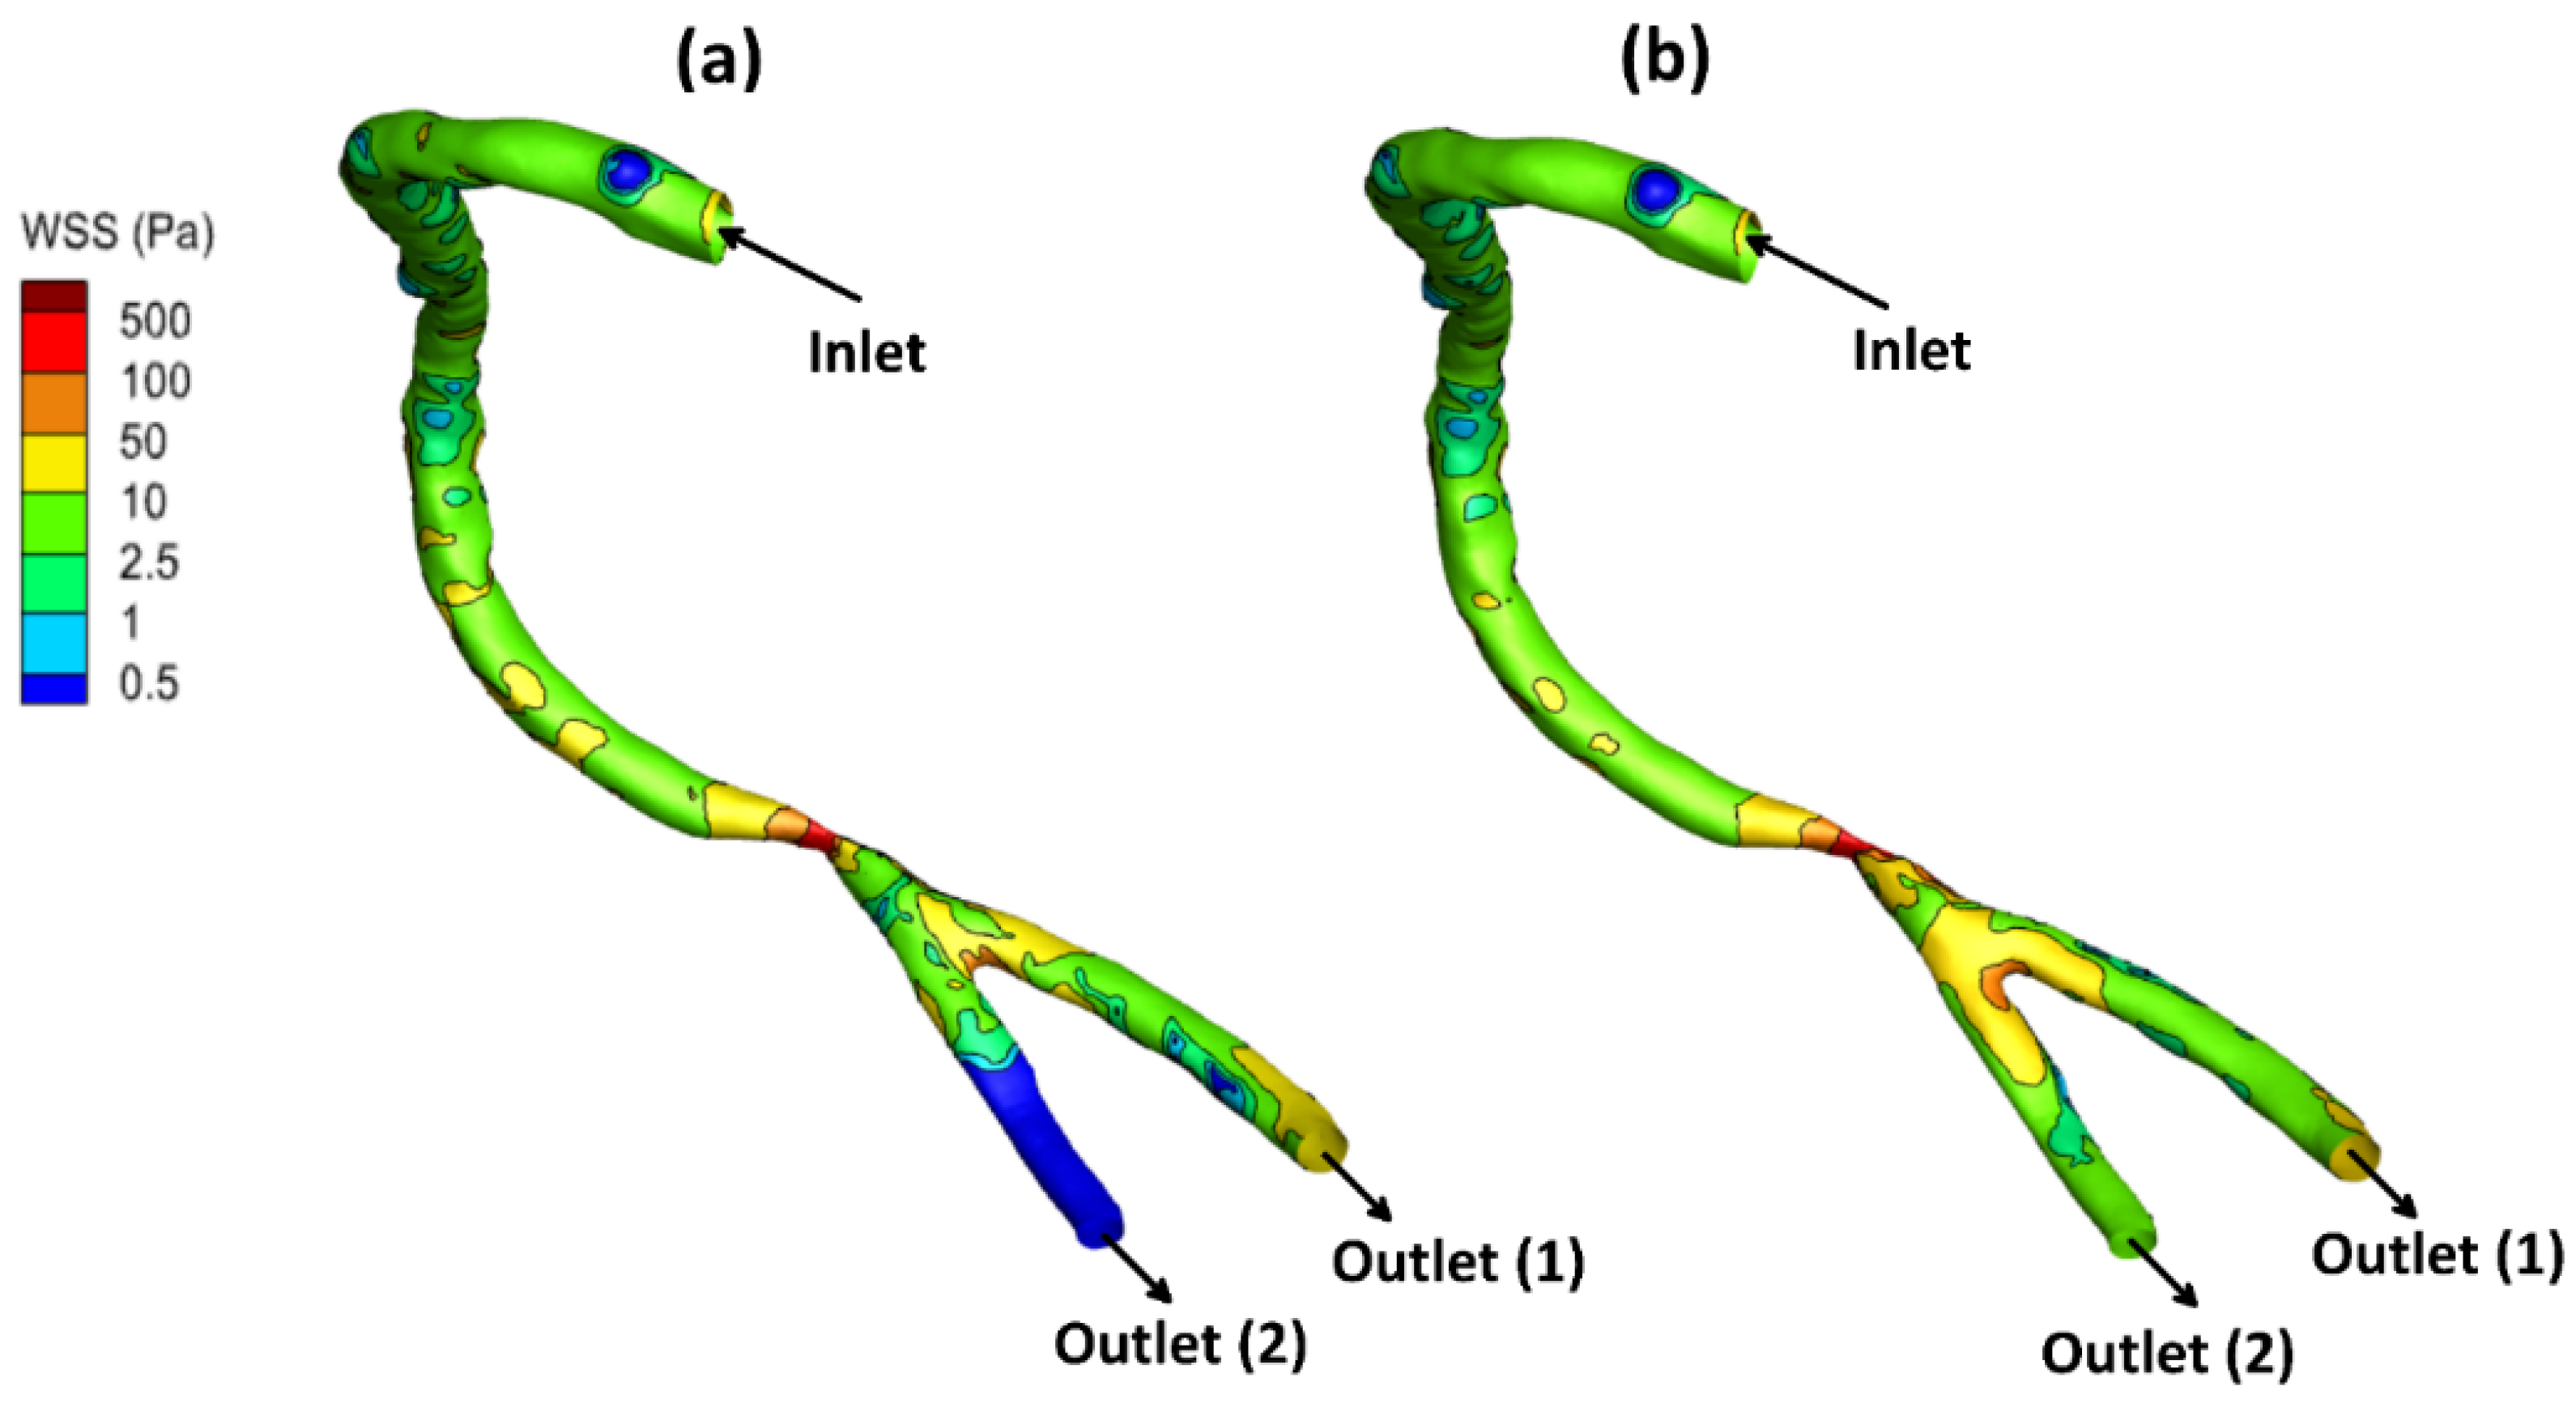
The local allocation of the WSS for the stenotic RCA and CA at the peak systole of the cardiac cycle is presented in
Figure 4,
Figure 5 and
Figure 6. For stenotic RCA—model A, it was found that the maximum value of WSS is located at the stenosis throat, where it reached 508.8 Pa in case of including the arterial compliance compared to 456.7 Pa for the rigid wall assumption, as shown in
Figure 4. Additionally, the artery bifurcation is considered as the region of interest where the value of WSS reached 64.4 Pa by considering the wall elasticity and 61.9 Pa for the rigid wall assumption. Furthermore, as shown in
Figure 4, it was found that the region of WSS contours for the stenotic RCA changed by including the wall compliance. Accordingly, the high WSS region downstream of the stenosis was smaller for the arterial elasticity effect than the rigid wall assumption, which agrees with Failer et al. [
19]. Moreover, the side branch of outlet (2) faces a low WSS of less than 1 Pa, as shown in
Figure 3; hence a high risk of plaque initiation appeared to locate in this region.
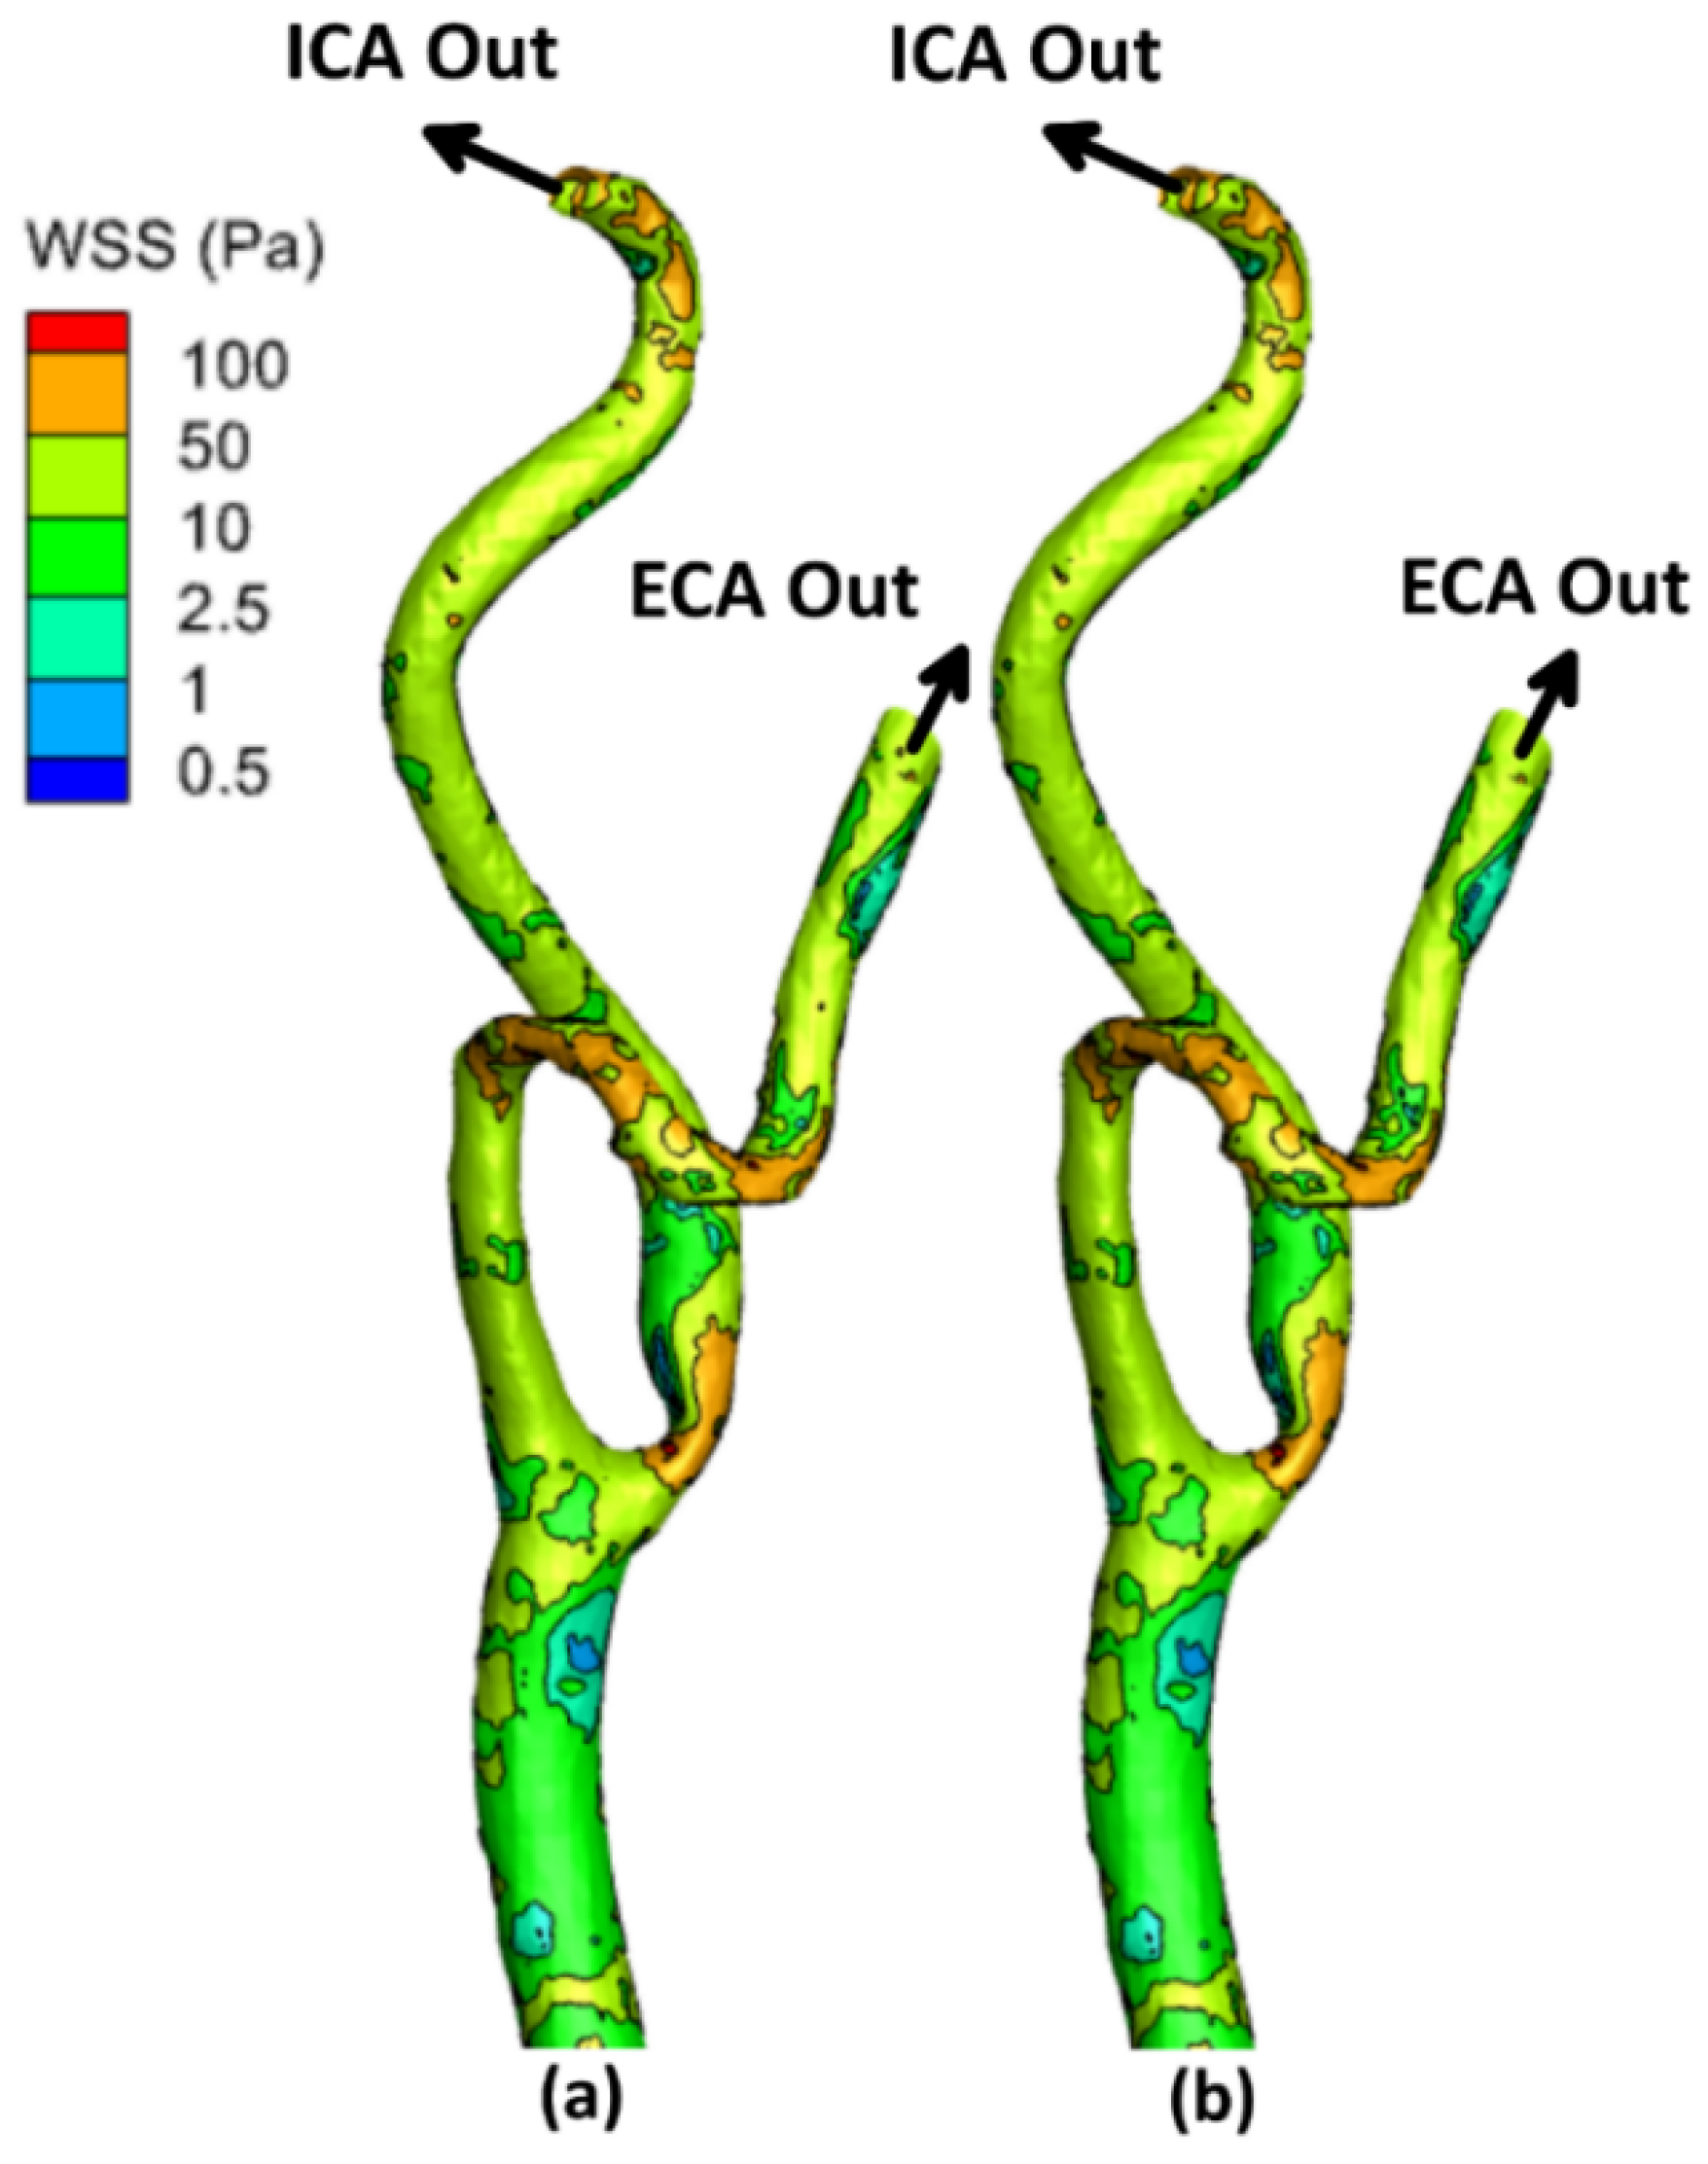
On the other hand, for the stenotic ICA—model B, it was found that the maximum value of WSS located at the stenosis throat, which reached
in case of considering the wall elasticity compared to
for the rigid wall assumption, as shown in
Figure 5. Additionally, at the artery bifurcation, the value of WSS reached
by considering the wall elasticity and
for the rigid wall assumption. It can be noticed that the values of WSS at the stenotic throat and the artery bifurcation are almost the same by including the arterial wall compliance and the rigid wall assumption, which agrees with De Wilde et al. [
48]. Moreover, it was found that the region of contours for the stenotic CA did not change by using the wall compliance compared to the rigid wall assumption.
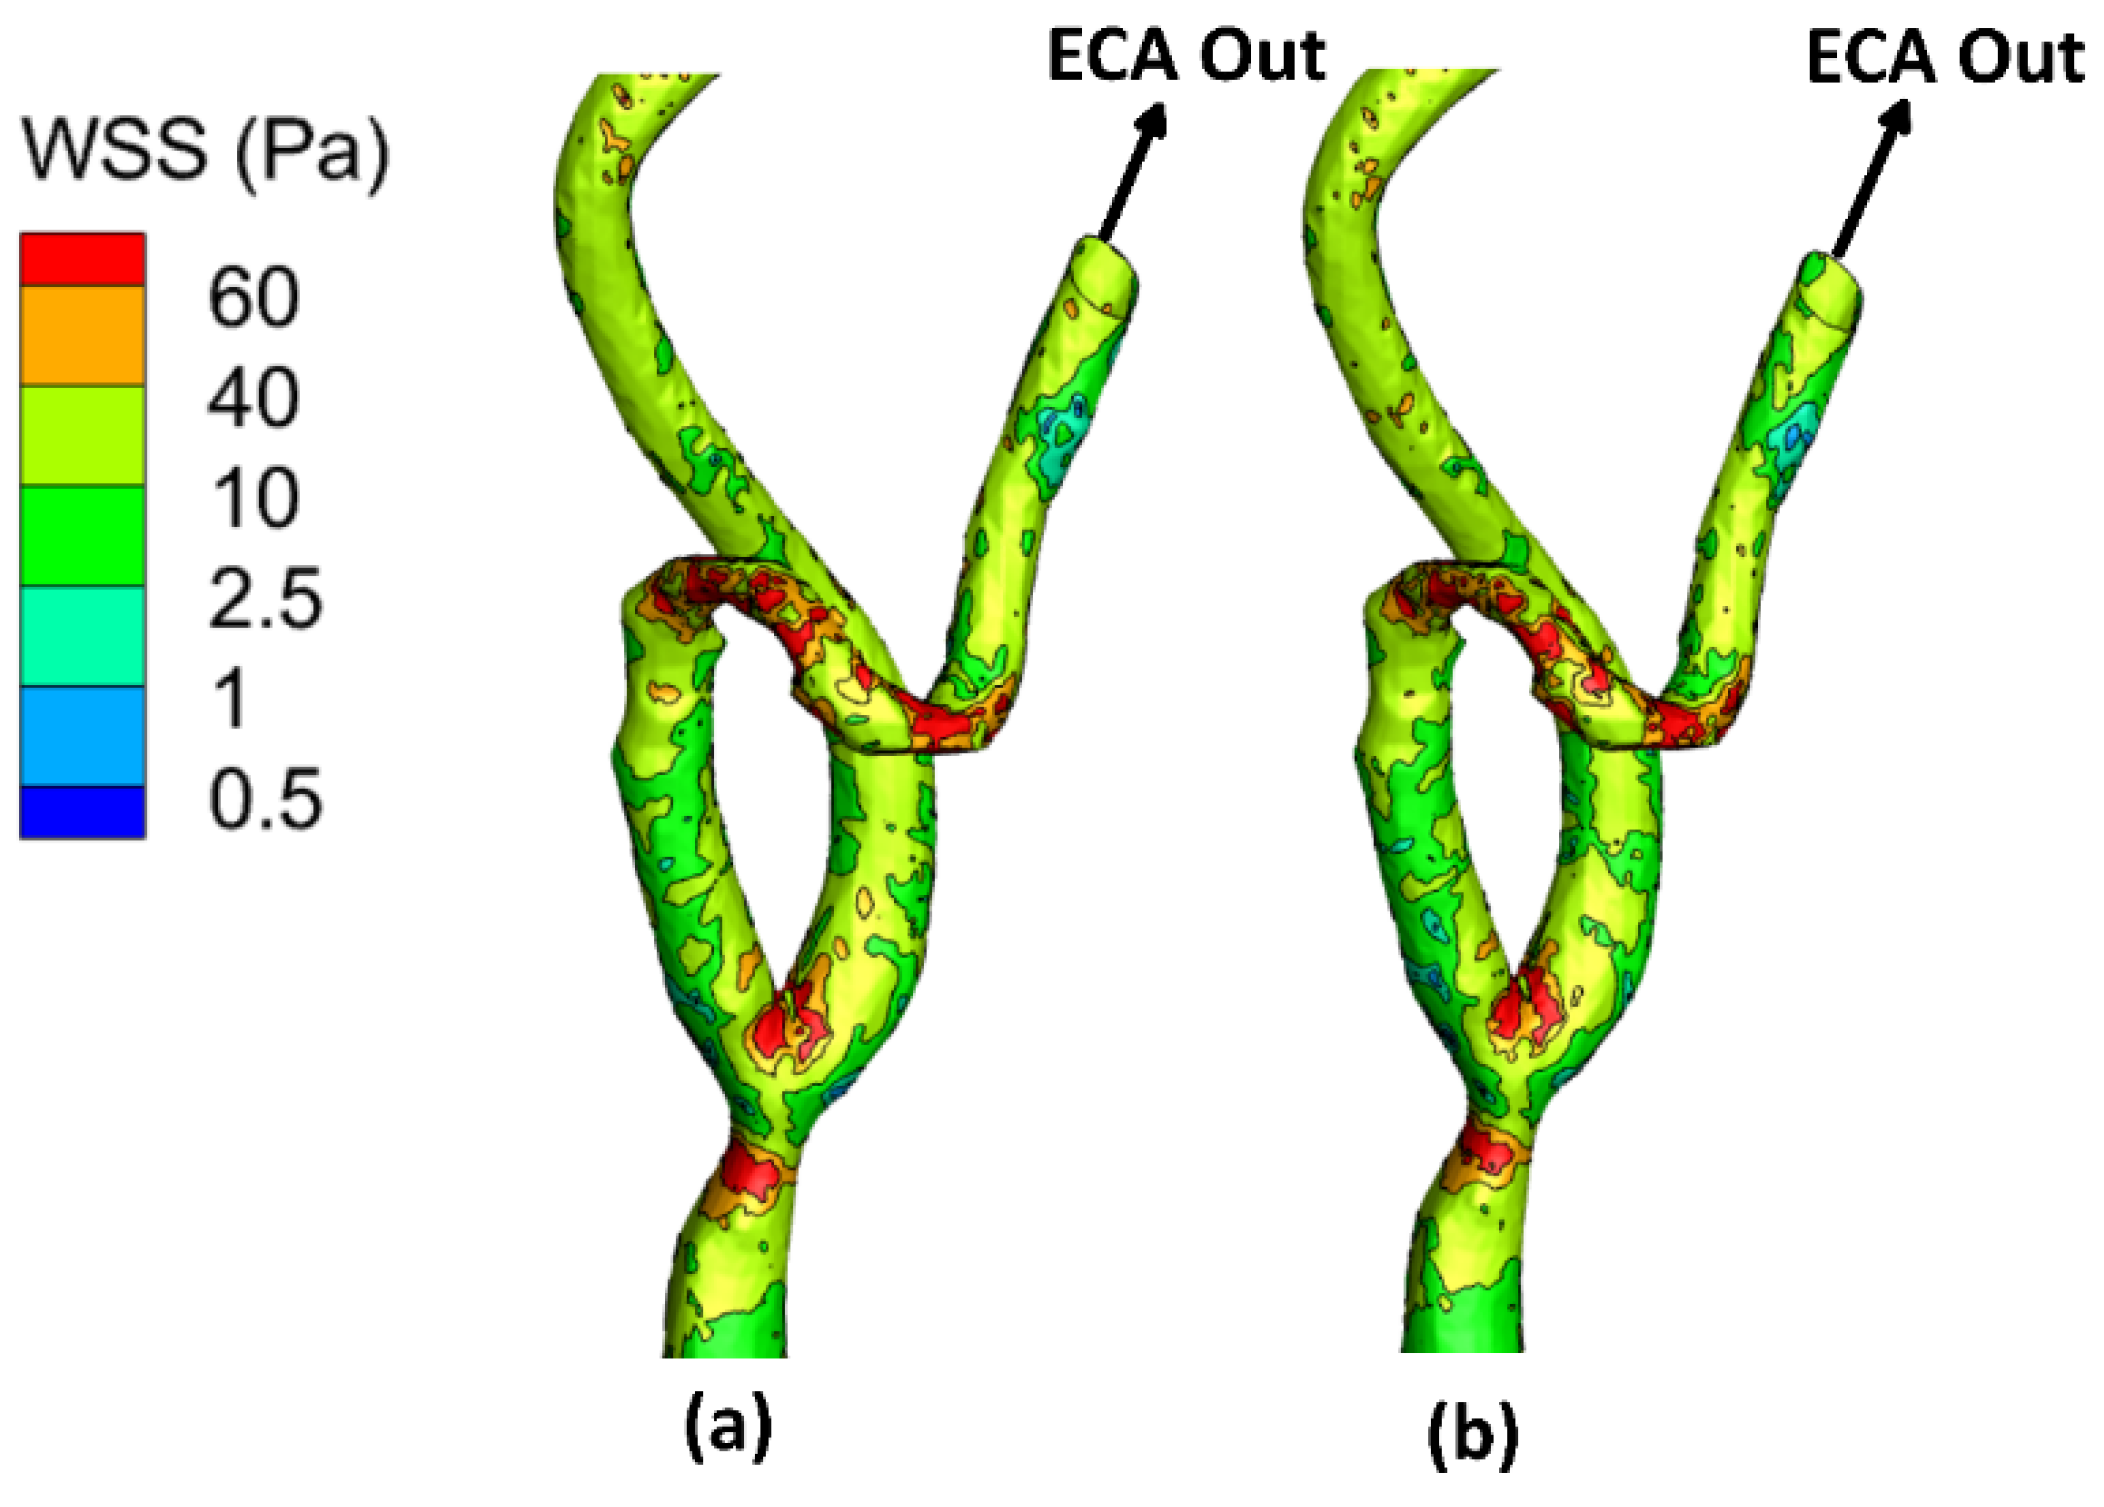
Moreover, for the stenotic CCA—model C, it was found that the maximum value of WSS located at the stenotic region reached
in case of considering the wall elasticity compared to
for the rigid wall assumption, as shown in
Figure 6. Additionally, at the artery bifurcation, the value of WSS reached
by considering the wall elasticity and
for the rigid wall assumption. It can be noticed that the values of WSS at the stenotic throat and the artery bifurcation are almost the same by including the arterial wall compliance and the rigid wall assumption which agrees with De Wilde et al. [
48]. Moreover, it was found that the region of contours for the stenotic CCA did not change by using the wall compliance compared to the rigid wall assumption.
Furthermore,
Table 2 compares the WSS values at the peak systole of the cardiac cycle between the stenotic RCA and CA arteries with FSI and those obtained under rigid wall assumption. Therefore, it can be concluded that considering the wall elasticity is not significant in simulating large arteries such as the carotid artery, as the WSS values were found to be close by including the arterial wall compliance and the rigid wall. However, for the stenotic RCA, it was found that the rigid wall assumption underestimates the WSS values at the stenosis throat by 10.24% compared to including the arterial elasticity. Additionally, it was found that the rigid wall assumption underestimates the WSS values at the RCA bifurcation by 3.8% compared to considering the wall elasticity.
3.2. Time-Averaged Wall Shear Stress (TAWSS)
The TAWSS is defined as the mean value of WSS as presented in Equation (7). For the stenotic RCA—model A, the TAWSS values at the stenotic throat were found to be in the case of considering the wall elasticity compared to for the rigid wall assumption. Additionally, at the artery bifurcation, the TAWSS values were in case of including the arterial wall elasticity compared to for the rigid wall assumption.
On the other hand, it was found that for the stenotic ICA—model B, the values of TAWSS at the stenosis throat were in the case of considering the arterial wall elasticity and for the rigid wall. Furthermore, the values of TAWSS at the CA bifurcation were found to be in the case of including the arterial wall docility and by using the rigid wall.
Additionally, it was found that for the stenotic CCA—model C, the values of TAWSS at the stenosis throat were in the case of considering the arterial wall compliance and for the rigid wall. Furthermore, the values of TAWSS at the CA bifurcation were found to be in the case of including the arterial wall docility and by using the rigid wall.
Regarding the WSS, the TAWSS is known to be an indicator of the formation of plaques in the cardiovascular system. Accordingly, the depositions of plaques beneath the internal layer of the artery influence the artery that appeared to be at risk due to high and low values of TAWSS, which exceed and less than .
Furthermore,
Table 3 compares the TAWSS values between the stenotic RCA and CA arteries with FSI and rigid wall assumption. From the values of TAWSS, it can be concluded that the vessel segments appear to be at high risk for thrombogenicity and damage to endothelial cells. Moreover, including the arterial wall elasticity is not significant in simulating large arteries such as the carotid artery, as the TAWSS values were close by including the arterial wall elasticity and the wall rigidity assumption. However, for the stenotic RCA, it was found that the rigid wall assumption reduces the TAWSS values at the stenosis throat by 9.39% compared to those obtained by the FSI approach. Additionally, it was found that the wall rigidity assumption underestimates the TAWSS values at the RCA bifurcation of 4.64% compared to wall compliance.
3.3. Velocity Field and Streamlines
The streamlines demonstrate the flow velocity direction inside the artery, the stagnation points, and the eddies’ locations.
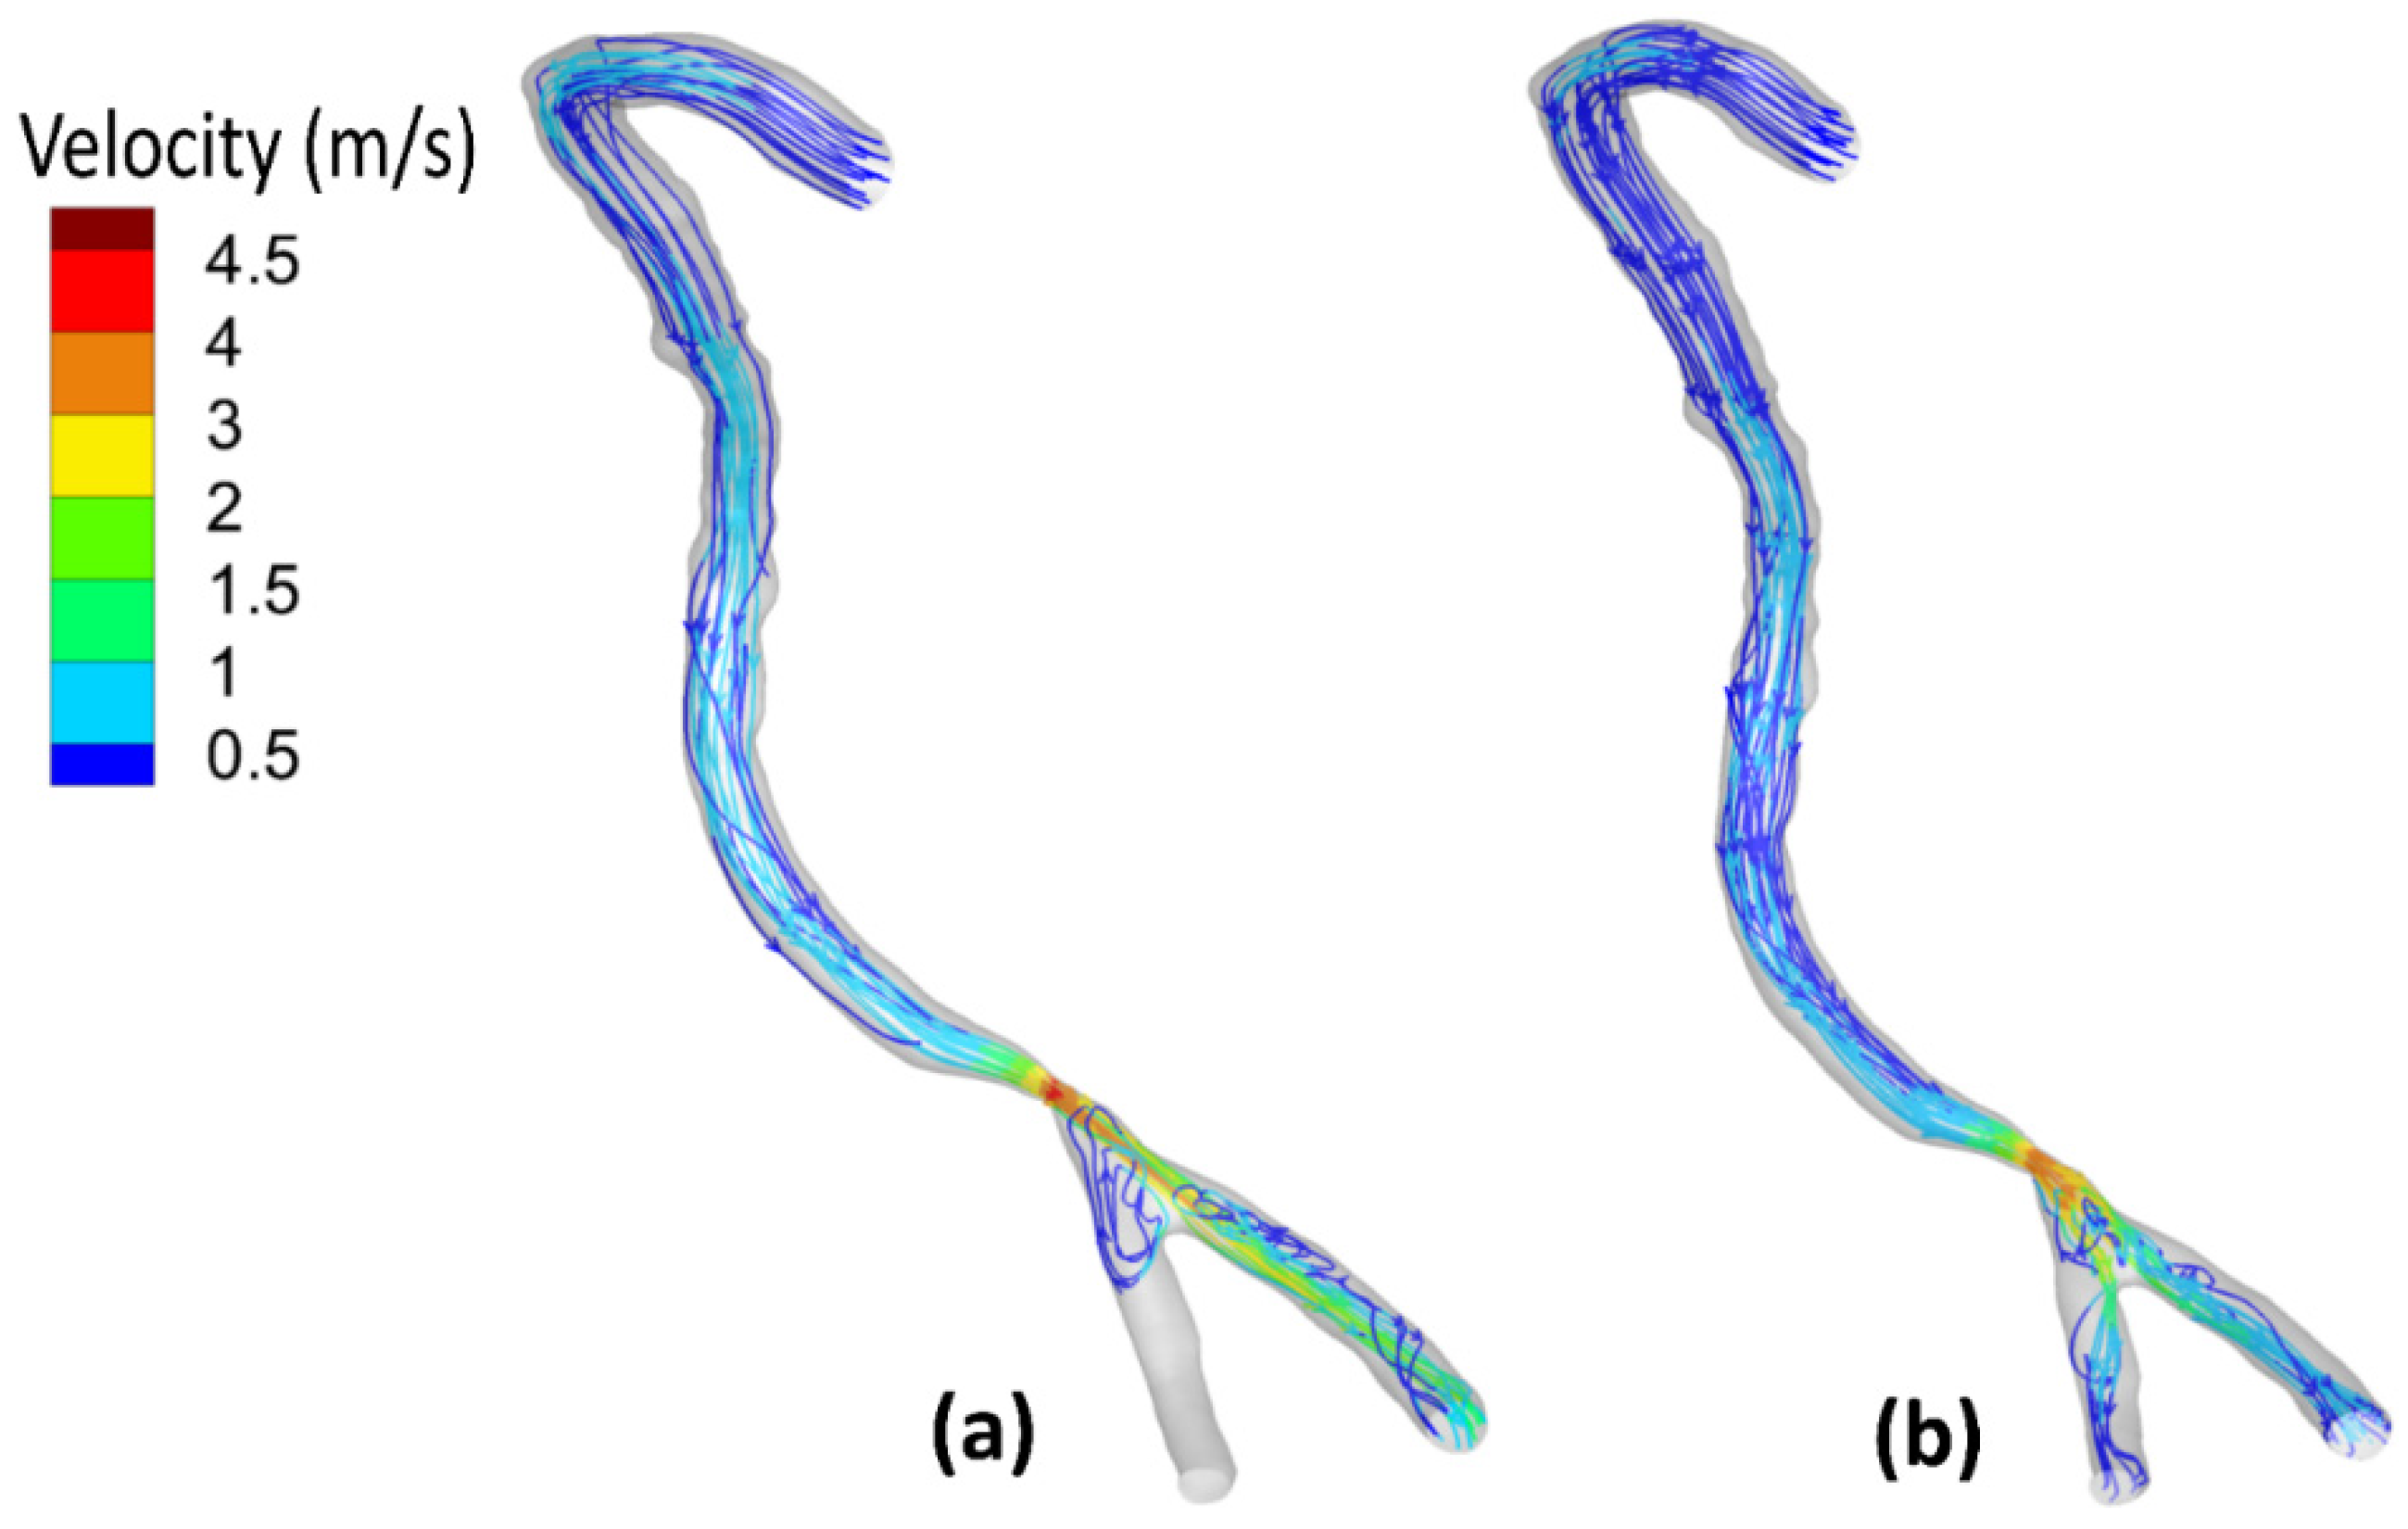
Figure 7 shows the flow field streamlines for the stenotic RCA—model A. It was found that the peak value of the velocity at the stenotic throat reached
by including the wall elasticity compared to
for the rigid wall assumption. This difference is due to increasing the inlet flow rate in the case of the elastic wall. Considering the wall elasticity enlarges the flow area and decreases the flow resistance. Moreover, due to the arterial wall deformation by using the FSI procedure, it was found that in the case of including the wall compliance, all the flows are directed towards the outlet (1). However, for the rigid wall, the flow was distributed between the two outlets. Furthermore, after the stenotic throat, the blood behaves as a jet which affects velocity streamline distribution and the eddies’ existence. Additionally, the WSS is a frictional force, and it is a function of the velocity gradient exerted parallel to the arterial vessel wall that leads to alteration of the endothelial cell leading to plaque development. Accordingly, the internal wall of the vessel at the artery bifurcation faces a jet of flow that increases the WSS, which causes erosion for the arterial wall, especially for stenoses near it, and causes plaques to rupture [
49]. Moreover, eddies that exist after the throat area increase the chances of plaque formation and development. Accordingly, these regions with eddies and low velocities affect the stenosis lesion progression, where the deposition of cholesterol and other lipids are beneath the internal layer of the artery.
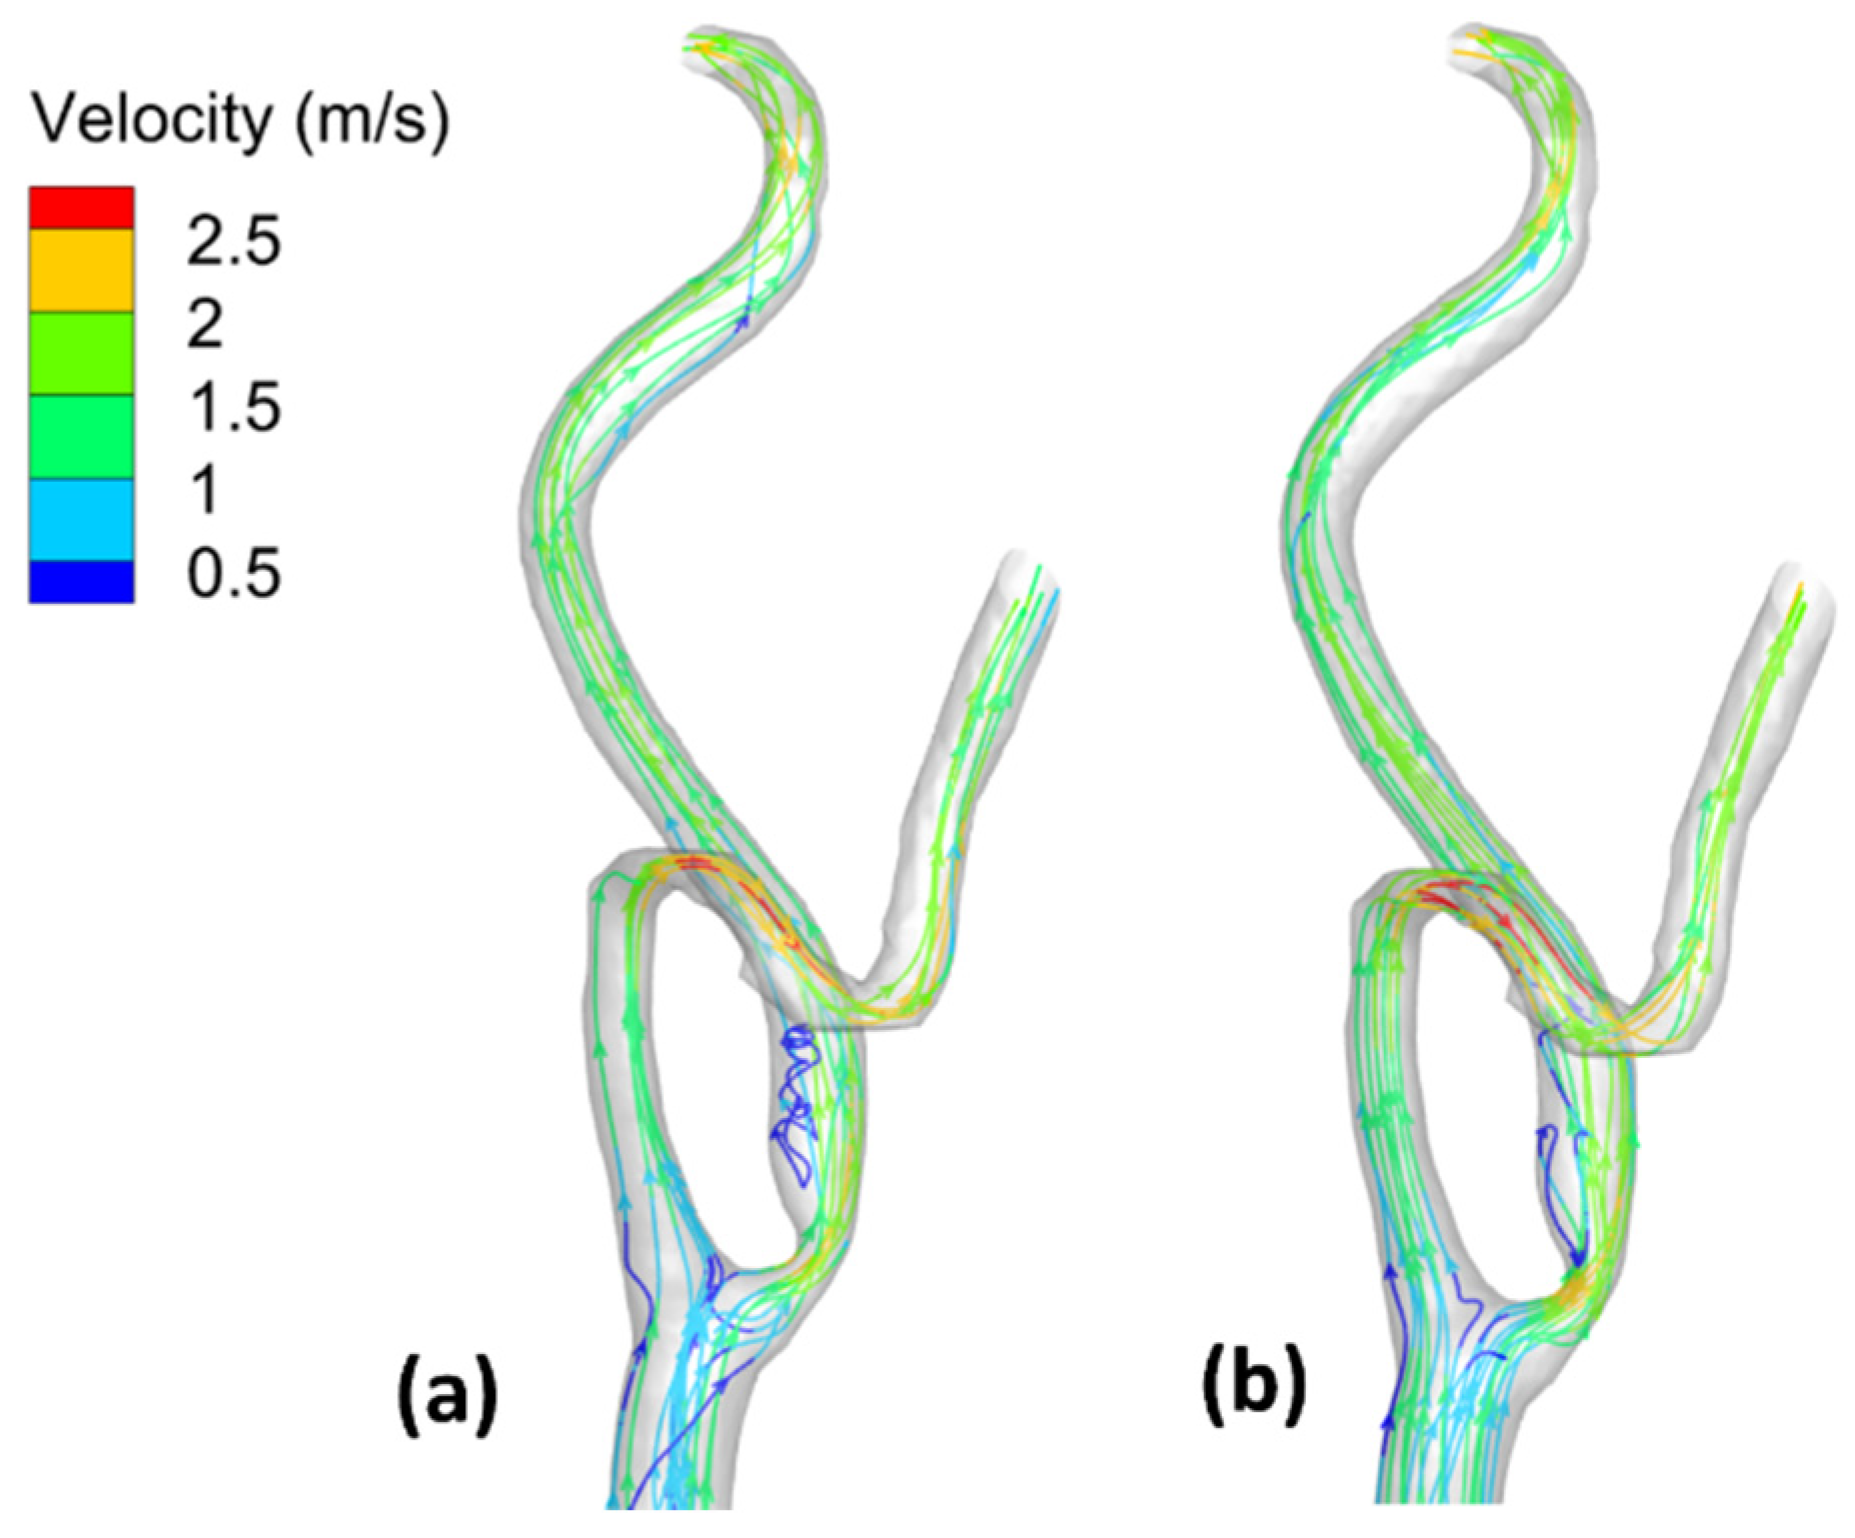
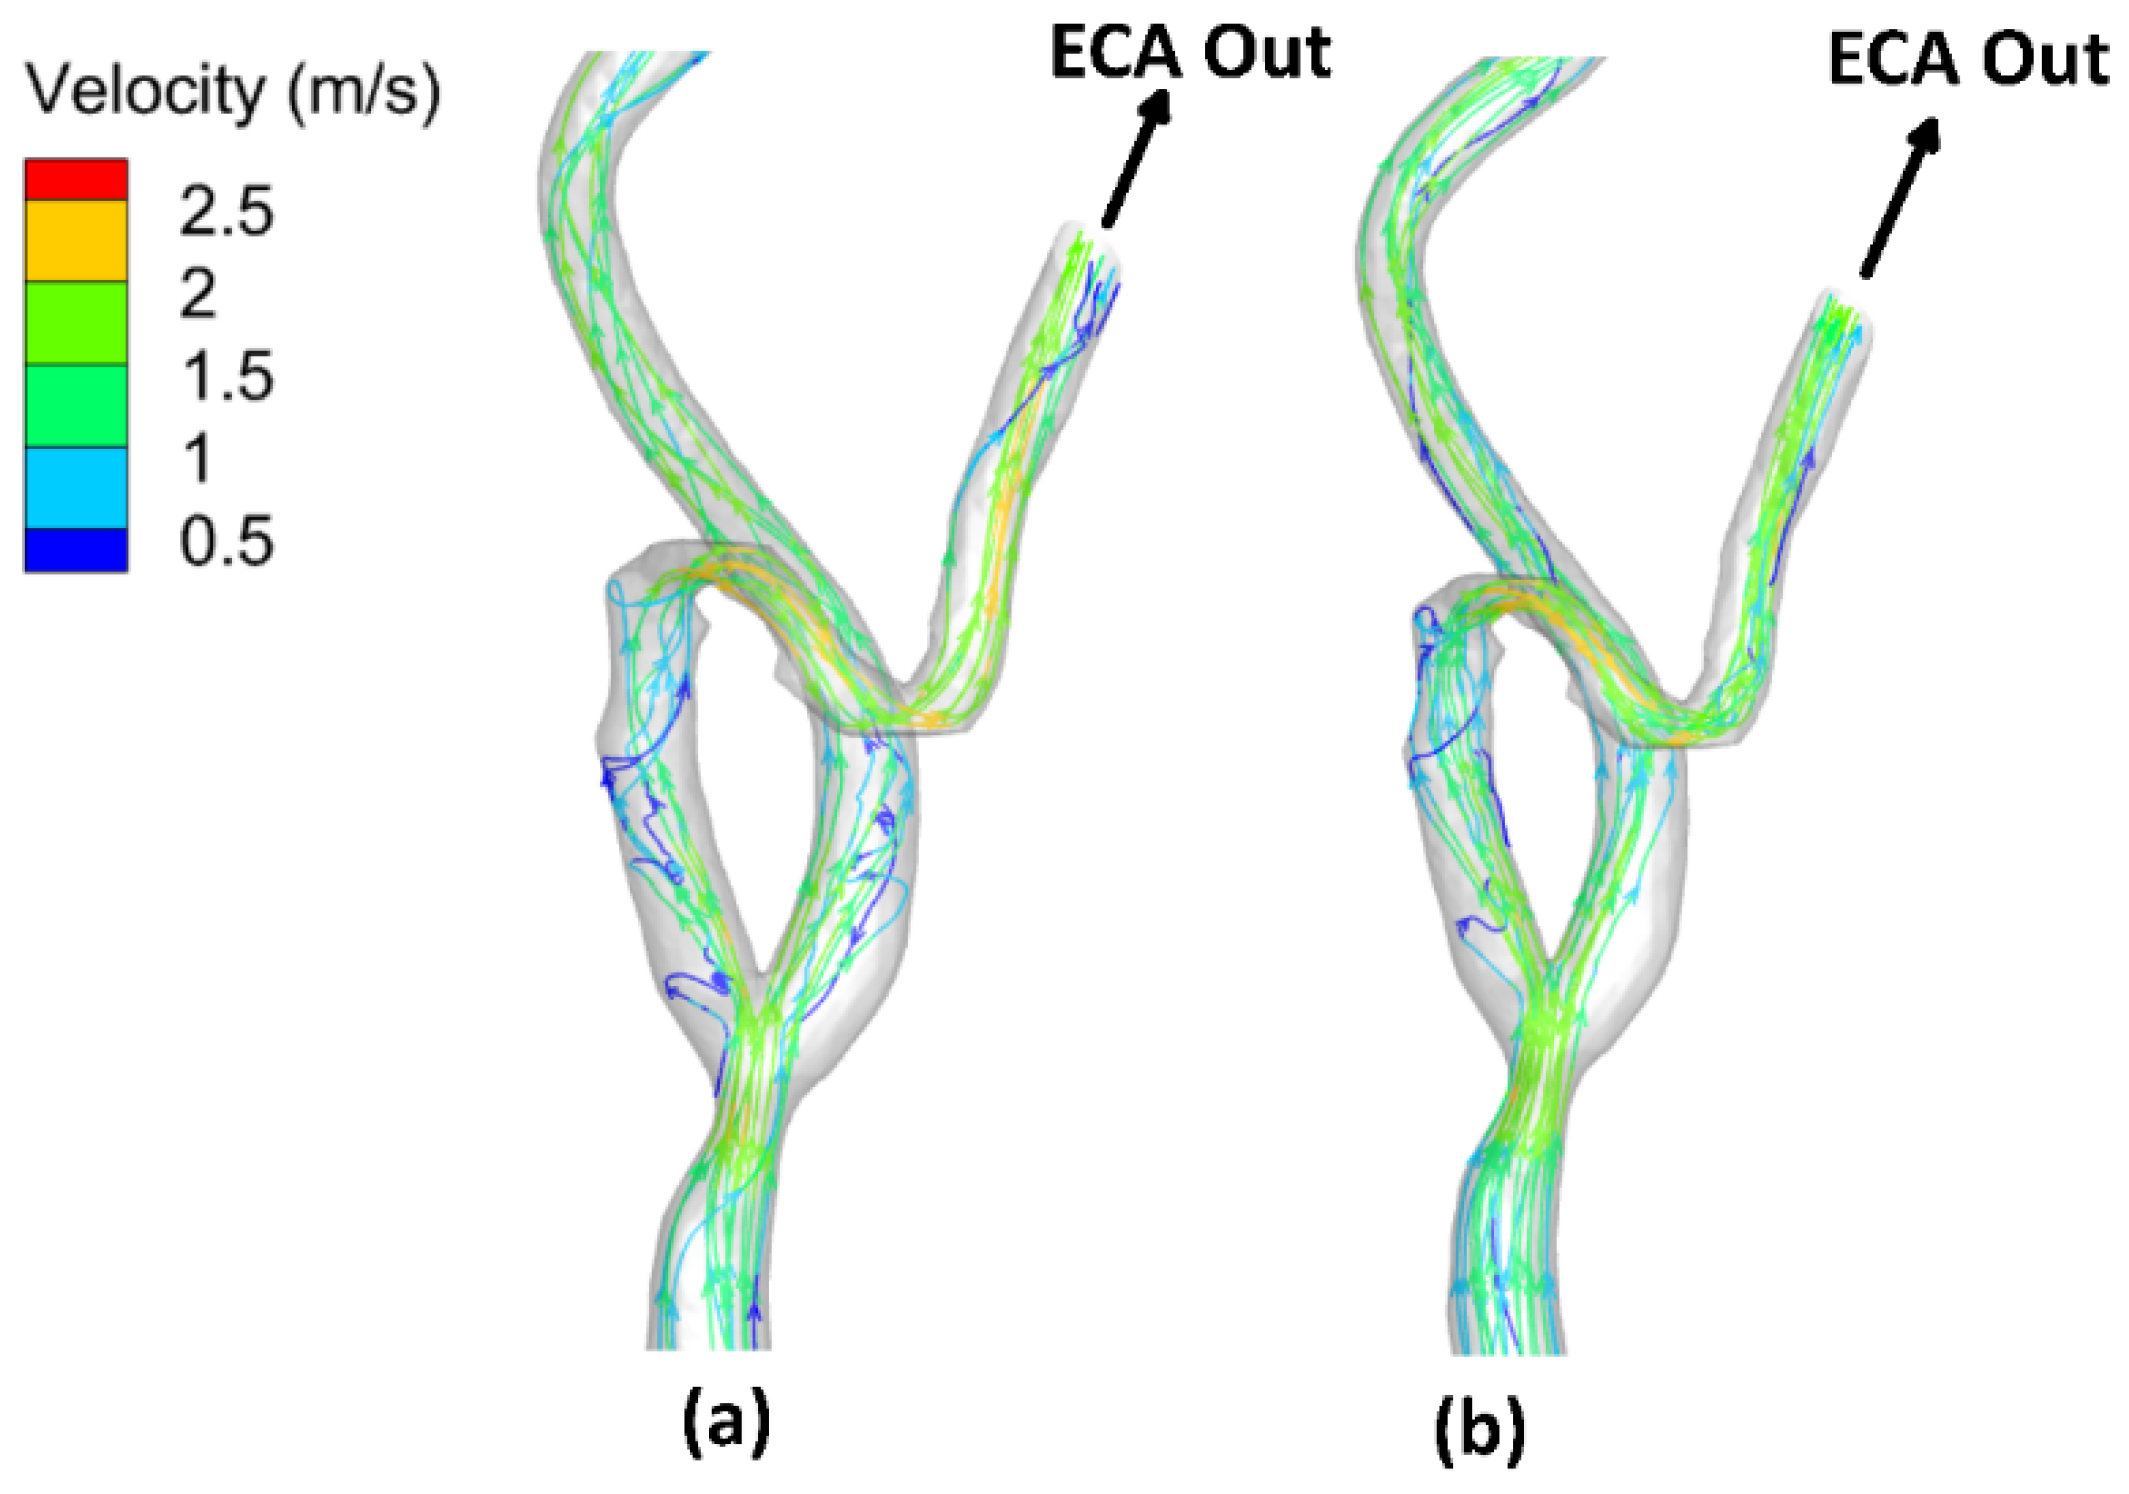
On the other hand,
Figure 8 shows the flow–field streamlines for the stenotic ICA—model B. It was found that the peak value of the velocity at the stenotic throat which reached
by considering the arterial wall elasticity compared to
for the rigid wall assumption. It is notable that the maximum velocity in the ICA branch did not change for both the elastic and the rigid wall due to low arterial wall deformation, which will be discussed later. Additionally, it is noticeable that the recirculation zone after the stenotic is larger in case of considering the arterial wall compliance than the rigid wall assumption, which decreases the WSS values, hence increasing the probability of plaque initiation.
Furthermore, after the throat area, these regions with eddies and low velocities affect the stenosis lesion progression, where the deposition of cholesterol and other lipids are beneath the internal layer of the artery.
Moreover, due to the curvature in the ECA, it was found that the velocity is greater than . The internal wall of the vessel at the artery ECA faces high values of flow velocities that affected the WSS distribution.
Additionally,
Figure 9 shows the flow–field streamlines for the stenotic CCA—model C. It was found that the peak value of the velocity at the stenotic throat reached
by considering the arterial wall elasticity compared to
for the rigid wall assumption. Notably, the maximum velocity in the CCA did not change for both the elastic and the rigid wall due to low arterial wall deformation which will be discussed later. Additionally, it is noticeable that the recirculation zone after the stenotic region is more significant in the case of considering the arterial wall compliance than the rigid wall assumption, which decreases the WSS values, hence increasing the probability of plaque initiation. In addition, the peak velocity at the stenotic throat is more prominent in the case of stenotic ICA compared to stenotic CCA, which also appeared in WSS values, which were more remarkable in the case of stenotic ICA than stenotic CCA. Furthermore, after the throat area, these regions with eddies and low velocities affect the stenosis lesion progression, where the deposition of cholesterol and other lipids are beneath the internal layer of the artery.
Moreover, due to the curvature in the ECA, it was found that the velocity is greater than . The internal wall of the vessel at the artery ECA faces high values of flow velocities that affected the WSS distribution.
3.4. Mass Flow Rate Distribution
The stenotic throats in the vascular system affect the flow rate in the arteries. Hence, the oxygenated blood flow to the heart or the head will change. Therefore, the patient is exposed to high risk due to the reduction in the oxygenated blood flow. Furthermore, the mass flow rate distribution changed significantly with the simulation procedure considering the arterial wall elasticity or the rigid wall assumption.
Regarding the stenotic RCA—model A, it was found that the mass flow rate distribution varied with considering the wall elasticity, as shown in
Table 4. At the late diastole of the cardiac cycle, by using the FSI simulation procedure, the inlet mass flow rate is
compared to
for the rigid wall assumption. The outlet mass flow is
from outlet (1) and
from outlet (2). For rigid wall, the outlet mass flow rate is
from outlet (1) and
from outlet (2). Additionally, at the peak systole of the cardiac cycle, the inlet mass flow rate is
compared to
for the rigid wall assumption. The outlet mass flow is
from outlet (1) and
from outlet (2). For rigid wall, the outlet mass flow rate is
from outlet (1) and
from outlet (2).
The deviation between the elastic and rigid wall assumption is due to the deformation of the other side of the artery wall of the stenotic throat relative to the plaque’s formation on the wall side. Additionally, it can be noticed that no flow goes out at outlet (2) of the RCA; the resistance increased, which boosted the inlet mass flow rate and the flow velocity directed to outlet (1).
Regarding the CA’s stenotic ICA—model B,
Table 5 presents the mass flow rate distribution using the simulation procedure. At the late diastole of the cardiac cycle, the inlet mass flow rate is
compared to
for the rigid wall assumption. The outlet mass flow is
from ICA and
from ECA. For the rigid wall assumption, the outlet mass flow rate is
from ICA and
from ECA. At the peak systole of the cardiac cycle, the inlet mass flow rate is
compared to
for the rigid wall assumption. The outlet mass flow is
from ICA and
from ECA. For the rigid wall assumption, the outlet mass flow rate is
from ICA and
from ECA. It can be noticed that the mass flow rate distribution in the case of elastic to rigid wall assumption is almost insignificant.
Table 6 presents the mass flow rate distribution using the simulation procedure for the CA’s stenotic CCA—model C. At the late diastole of the cardiac cycle, the inlet mass flow rate is
compared to
for the rigid wall assumption. The outlet mass flow is
from ICA and 8.7
from ECA. For the rigid wall assumption, the outlet mass flow rate is
from ICA and
from ECA. At the peak systole of the cardiac cycle, the inlet mass flow rate is
compared to 40.44
for the rigid wall assumption. The outlet mass flow is 21.8
from ICA and 18.9
from ECA. For the rigid wall assumption, the outlet mass flow rate is
from ICA and 18.8
from ECA. It can be noticed that the mass flow rate distribution in the case of elastic to rigid wall assumption is almost insignificant.
It can be concluded that the numerical simulation considering the elastic wall is necessary for the relatively small diameter vessels, such as the right coronary artery, and can be neglected for the relatively large arteries, such as the carotid artery.
3.5. Arterial Wall Deformation
The displacement of the vessel walls significantly affects the flow pattern due to the forces acting on its wall. Radial strain represents the cross-sectional area deformation in terms of the relative radial deformation of the vessel wall to a reference diameter [
50]. Fluid flow and solid structure domains are coupled, and their interaction is obtained through the arterial wall strains.
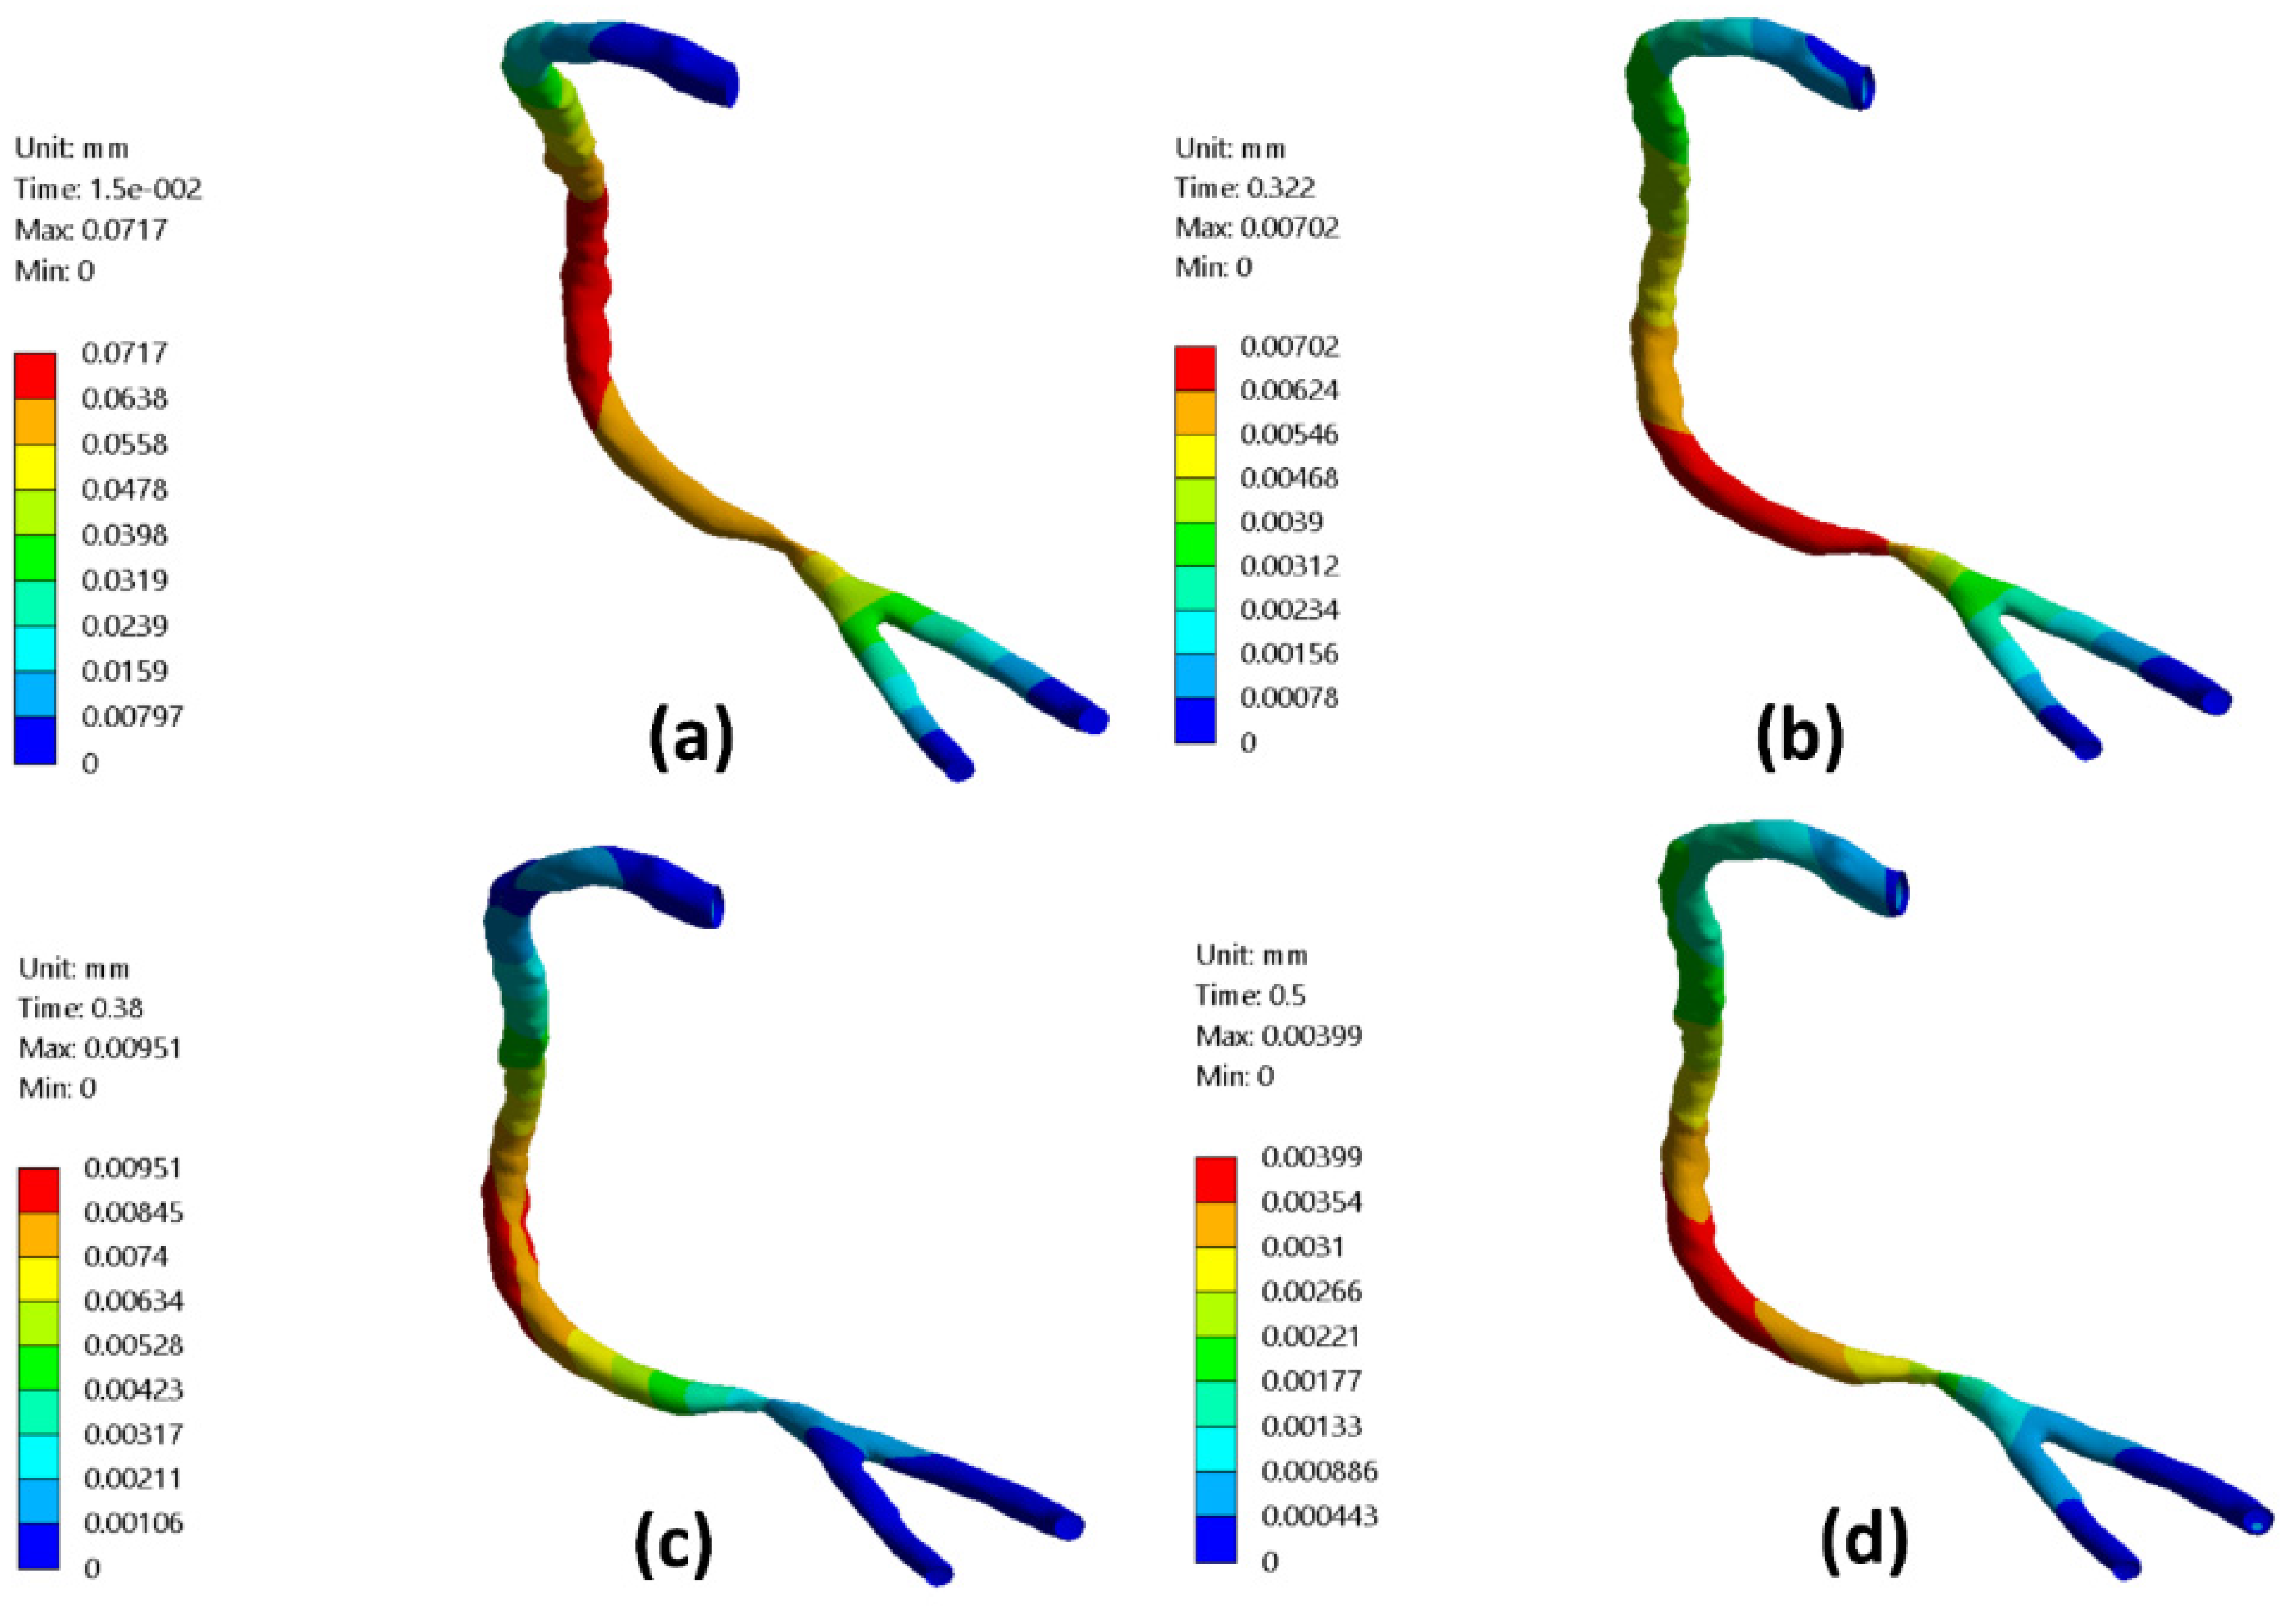
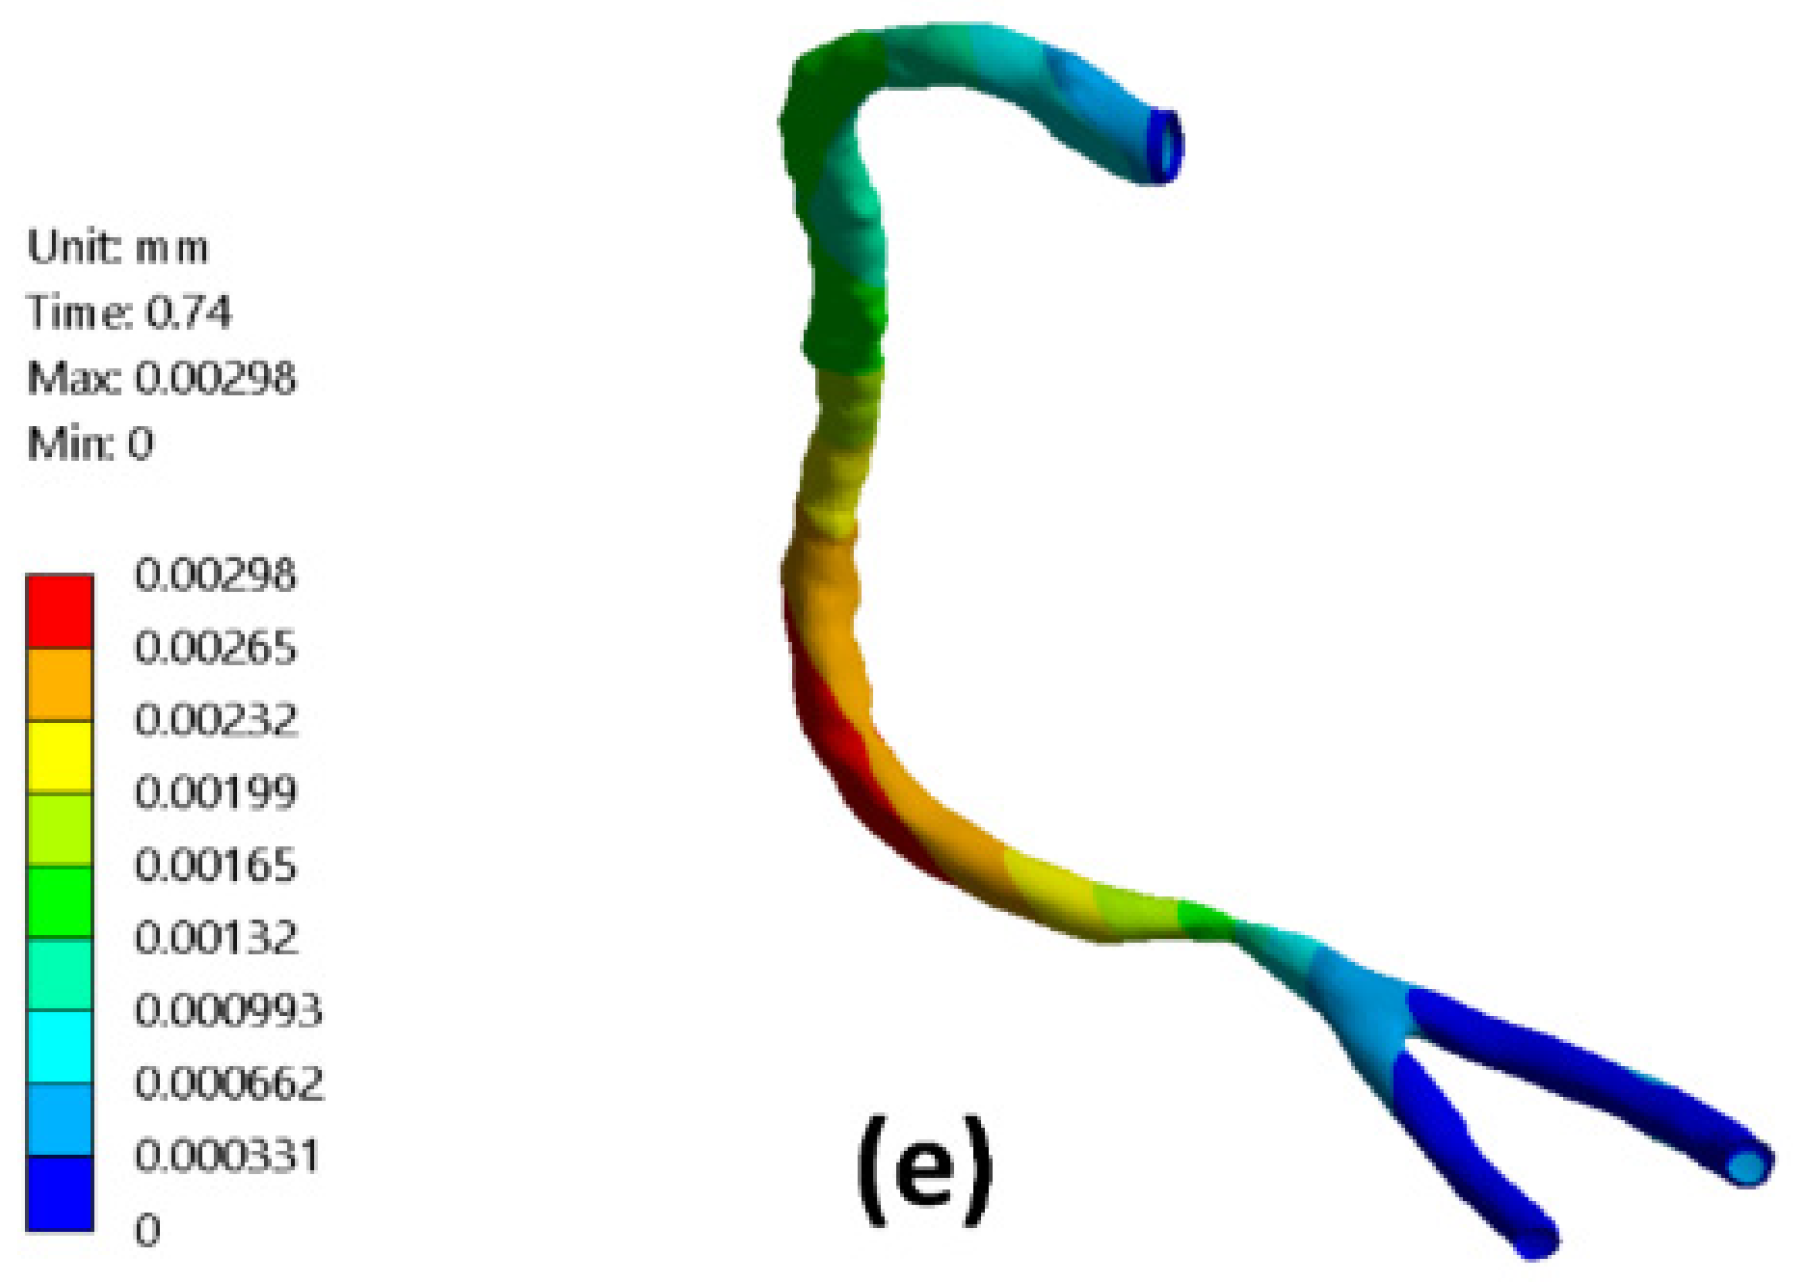
Figure 10 presents the RCA wall radial deformation contours for different times along the cardiac cycle representing the early diastole, peak systole, and late diastole. It was found that the maximum value for the arterial wall radial deformation at the early diastole (
) reached
and decreased to
at
, as shown in
Figure 10a,b. At the peak systole of the cardiac cycle at
, the arterial wall radial deformation’s maximum value was
at nearly the mid-distance between the artery inlet and the stenotic throat, as shown in
Figure 10c. Afterward,
Figure 10d,e shows the arterial wall radial displacement at the late diastole of the cardiac cycle which the maximum value decreased from
at a time
of the cardiac cycle to
at a time
of the cardiac cycle.
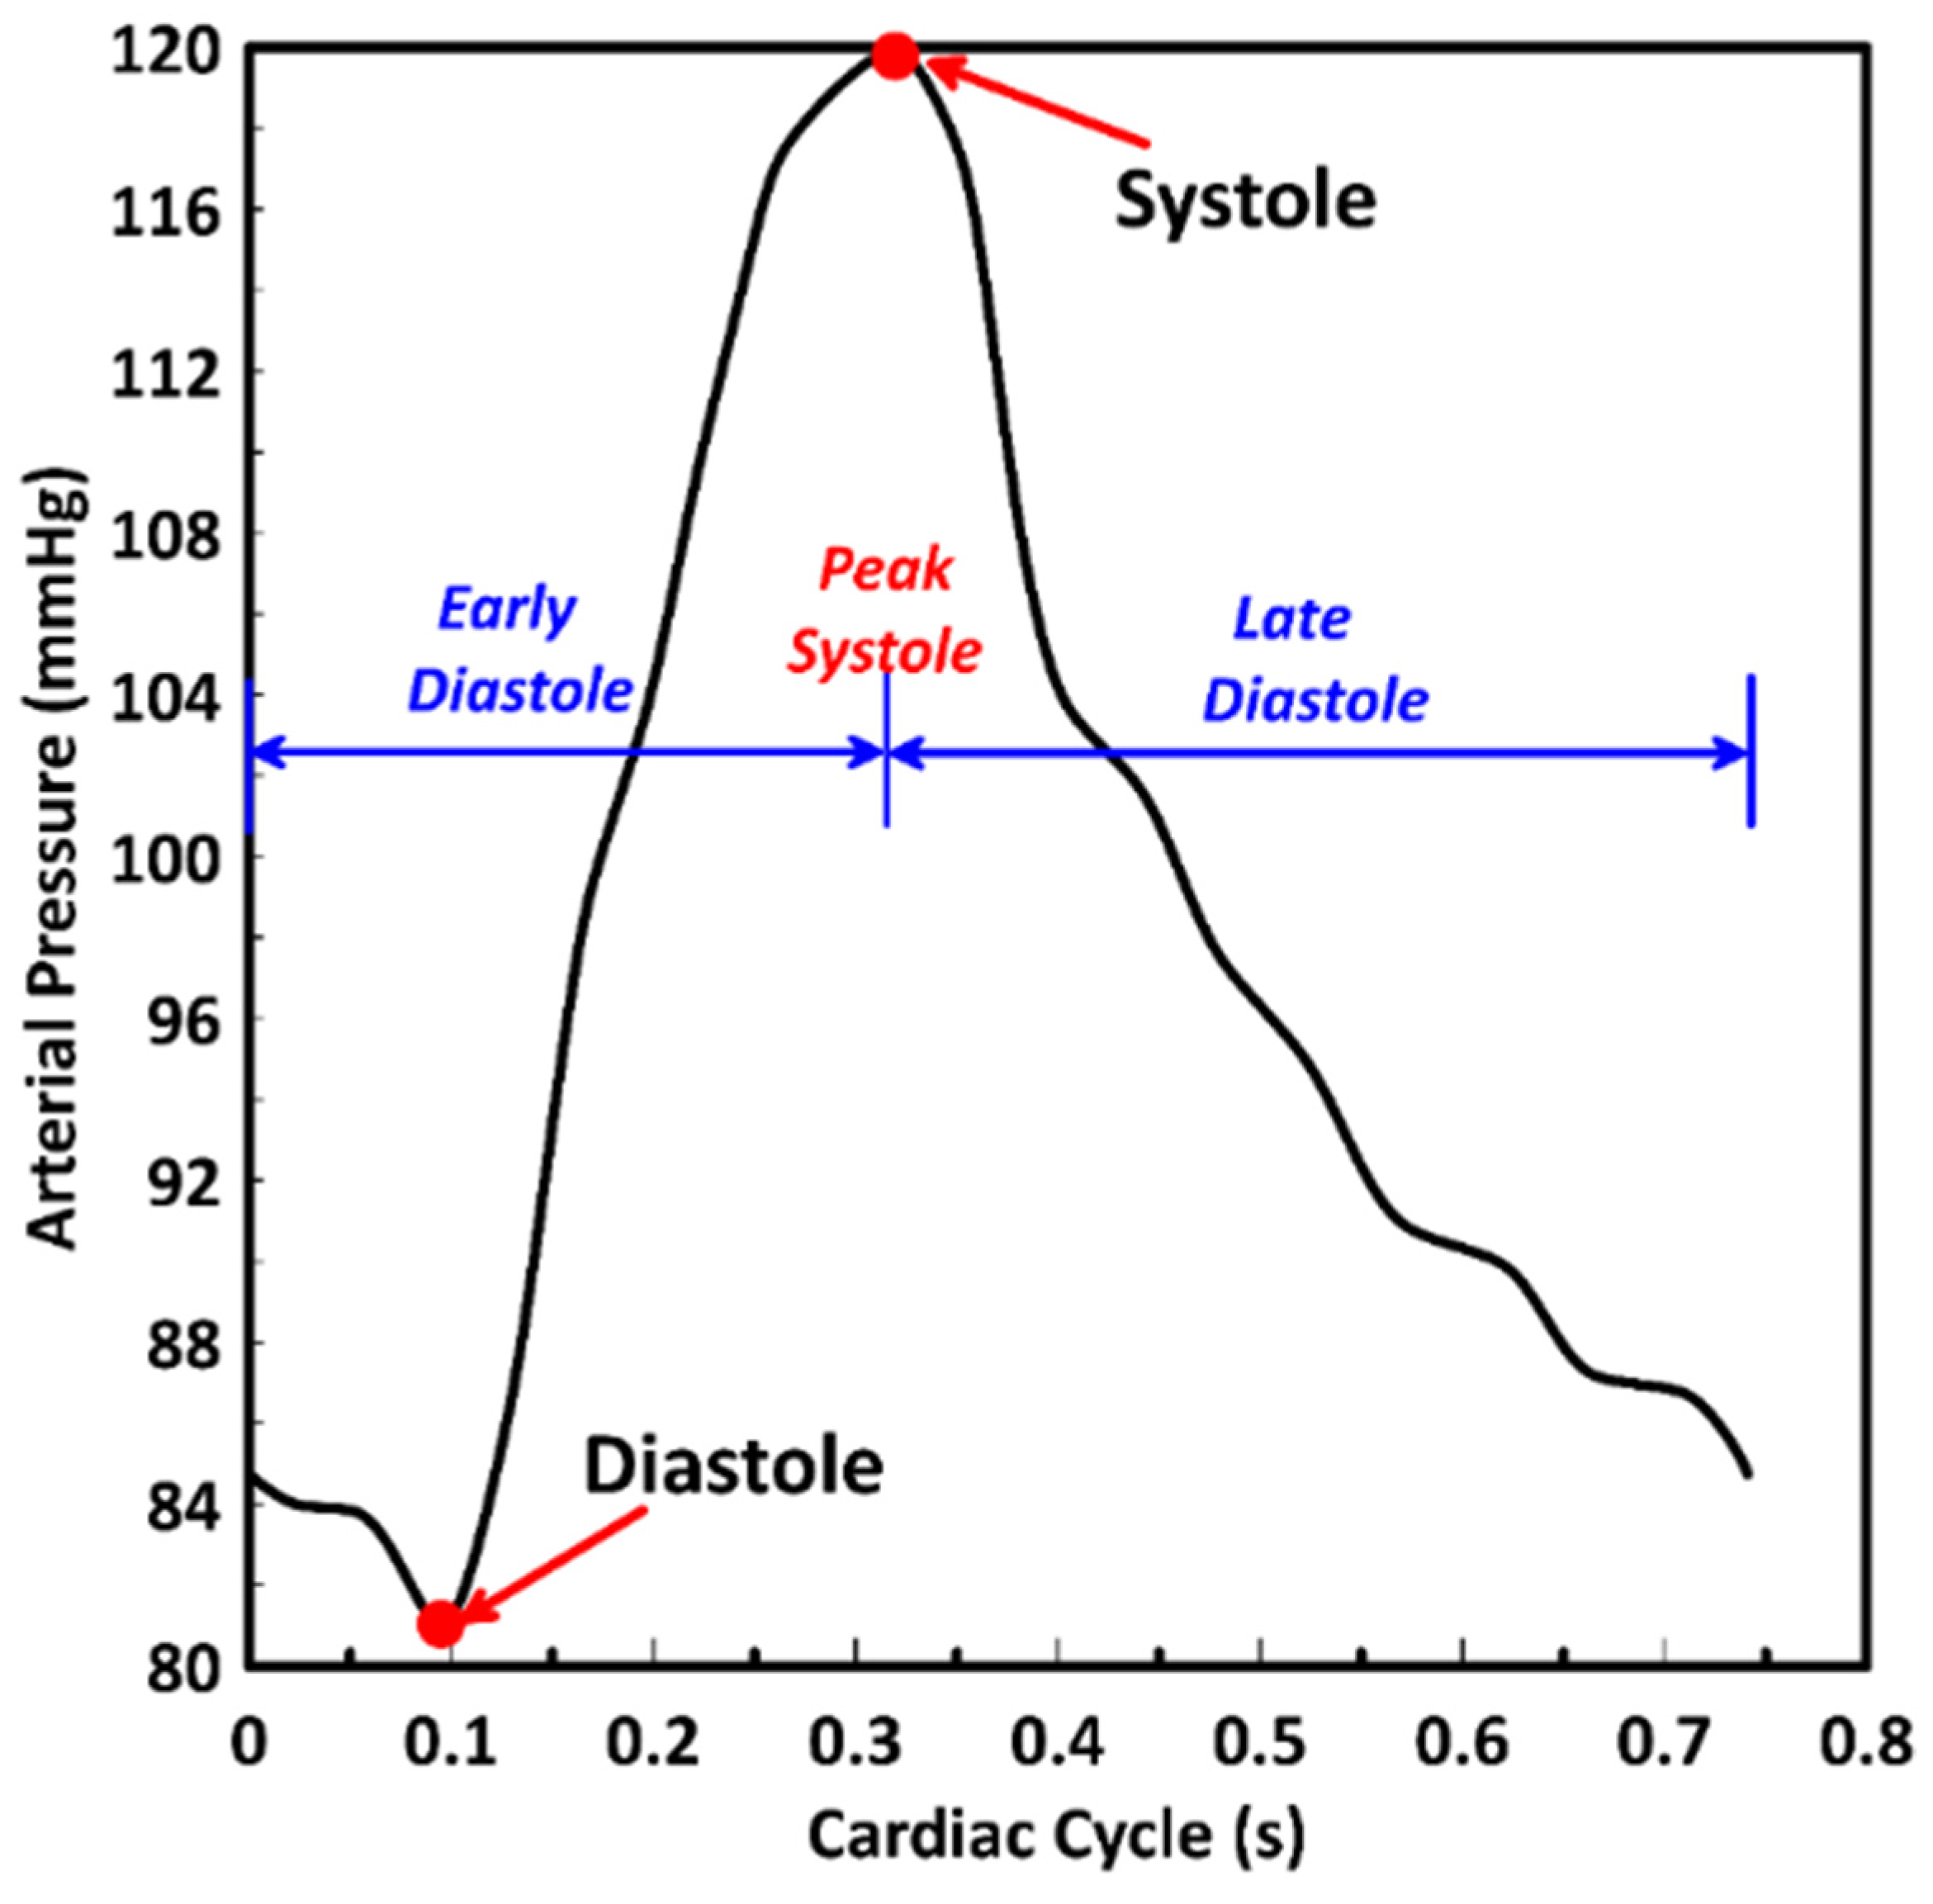
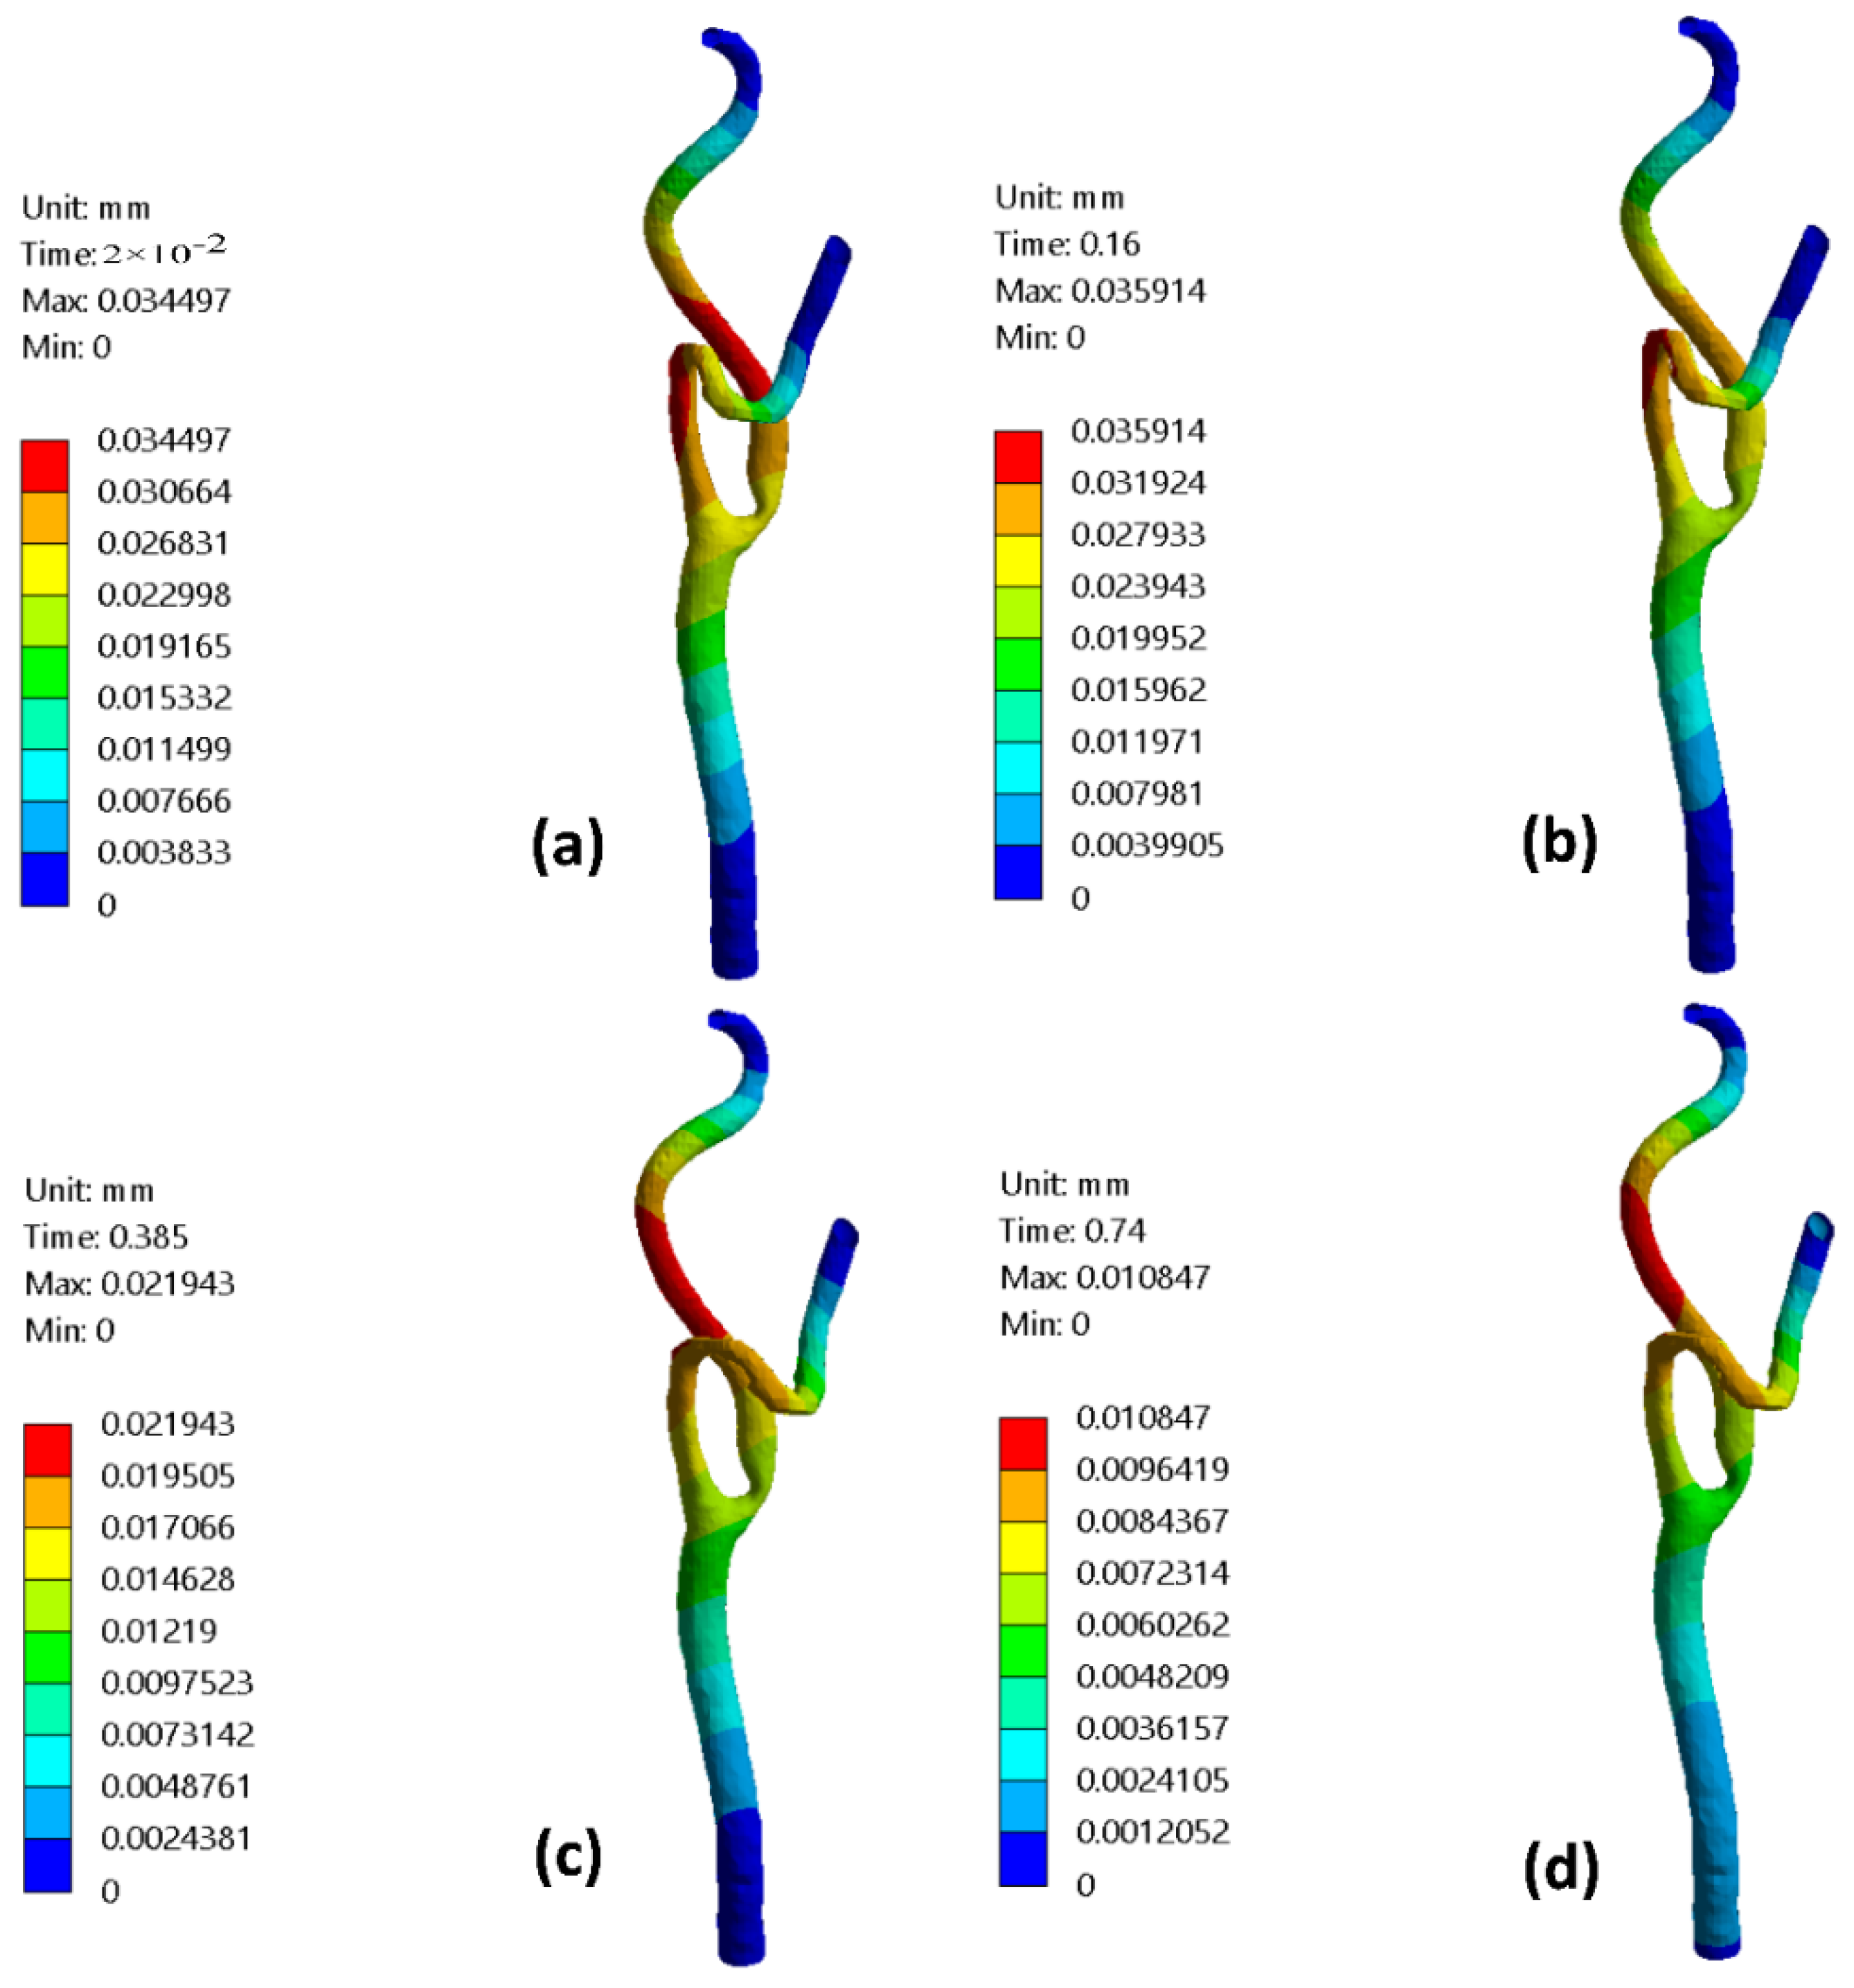
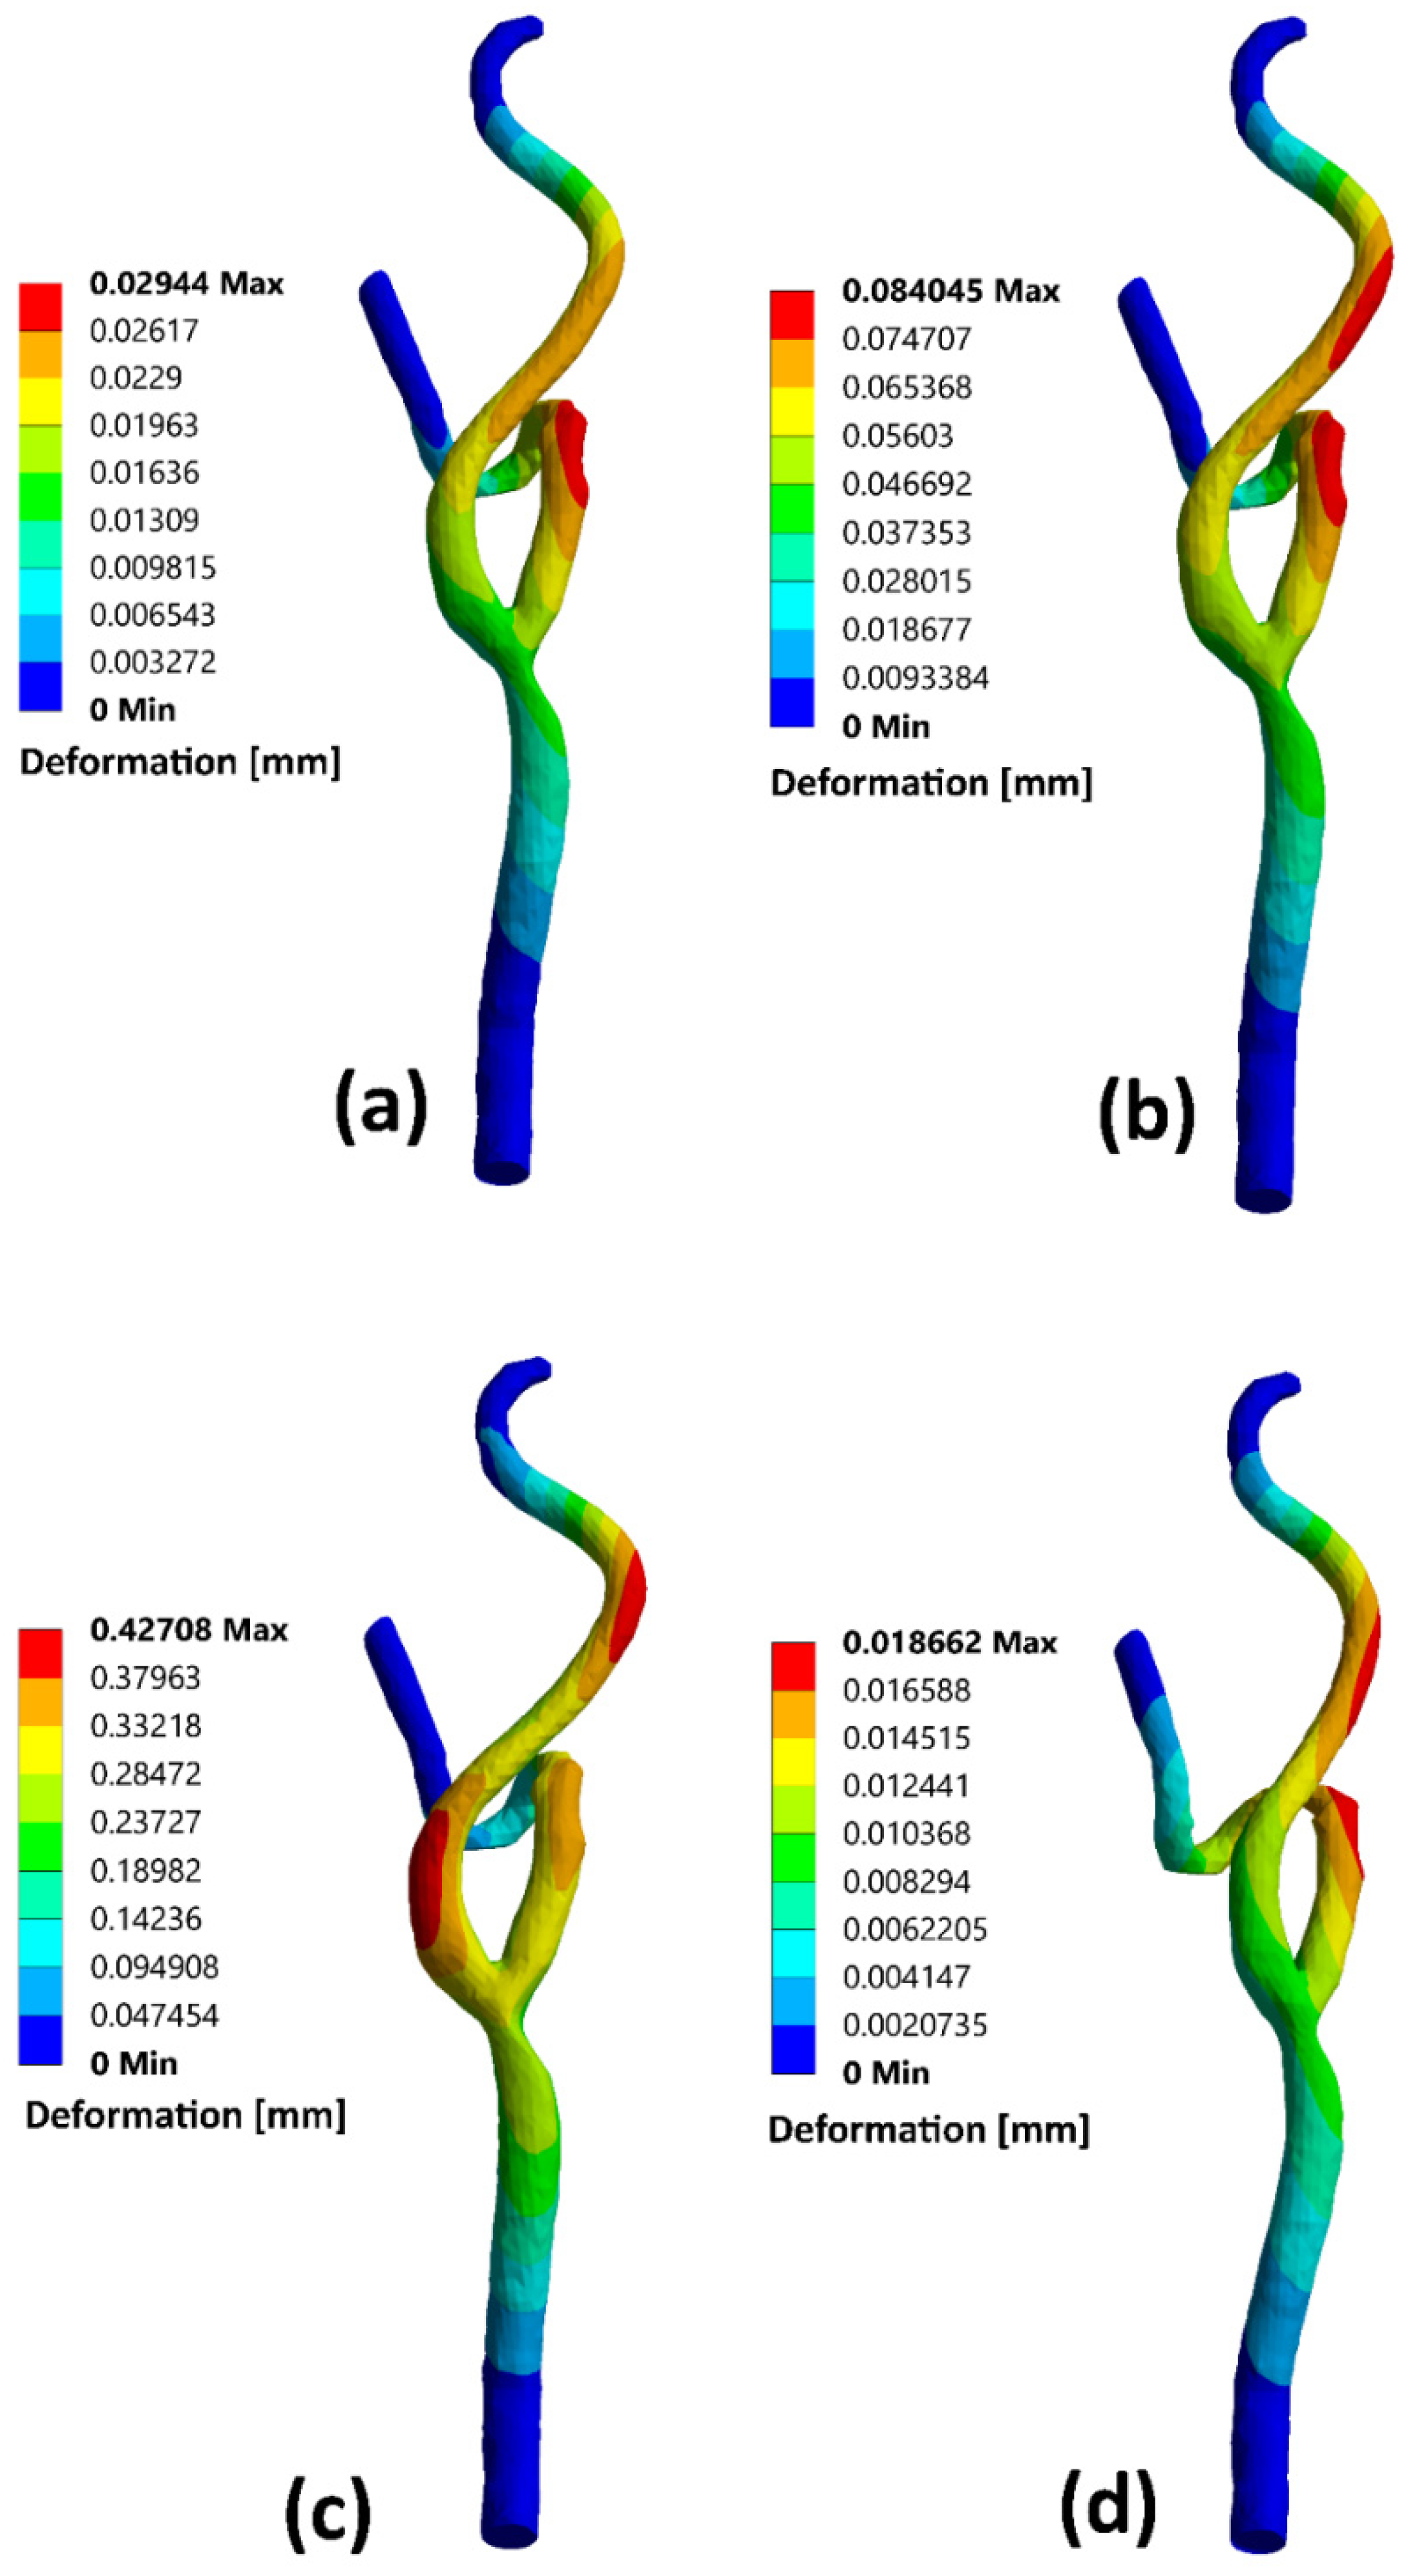
Figure 11 presents the stenotic ICA—model B wall radial deformation contours for different times along the cardiac cycle at the early diastole, peak systole, and late diastole, defined in
Figure 2. It was found that the maximum value for the arterial wall radial displacement at the early diastole (
) reached
after the stenotic region of the ICA and increased to
at a time
of the cardiac cycle but located before the artery turn of the ECA branch, as shown in
Figure 11a,b. At the peak systole of the cardiac cycle (
), the maximum value of the arterial wall radial deformation was
, located after the ICA’s stenotic throat, as shown in
Figure 11c. Afterward,
Figure 11d shows the arterial wall displacement at the late diastole of the cardiac cycle, in which the maximum value was
at a time
of the cardiac cycle.
Moreover, the stenotic CCA—model C wall radial deformation contours are presented for different times along the cardiac cycle at the early diastole, peak systole, and late diastole, defined in
Figure 2. It was found that the maximum value for the arterial wall radial displacement at the early diastole (
) reached
after the stenotic region of the CCA at the ECA and increased to
at a time
of the cardiac cycle but located before the artery turn of the ECA branch as shown in
Figure 12a,b. At the peak systole of the cardiac cycle (
), the maximum value of the arterial wall radial deformation was
, located after the CCA’s stenotic throat at the ICA, as shown in
Figure 12c. Afterward,
Figure 12d shows the arterial wall displacement at the late diastole of the cardiac cycle, for which the maximum value was
at a time
of the cardiac cycle.
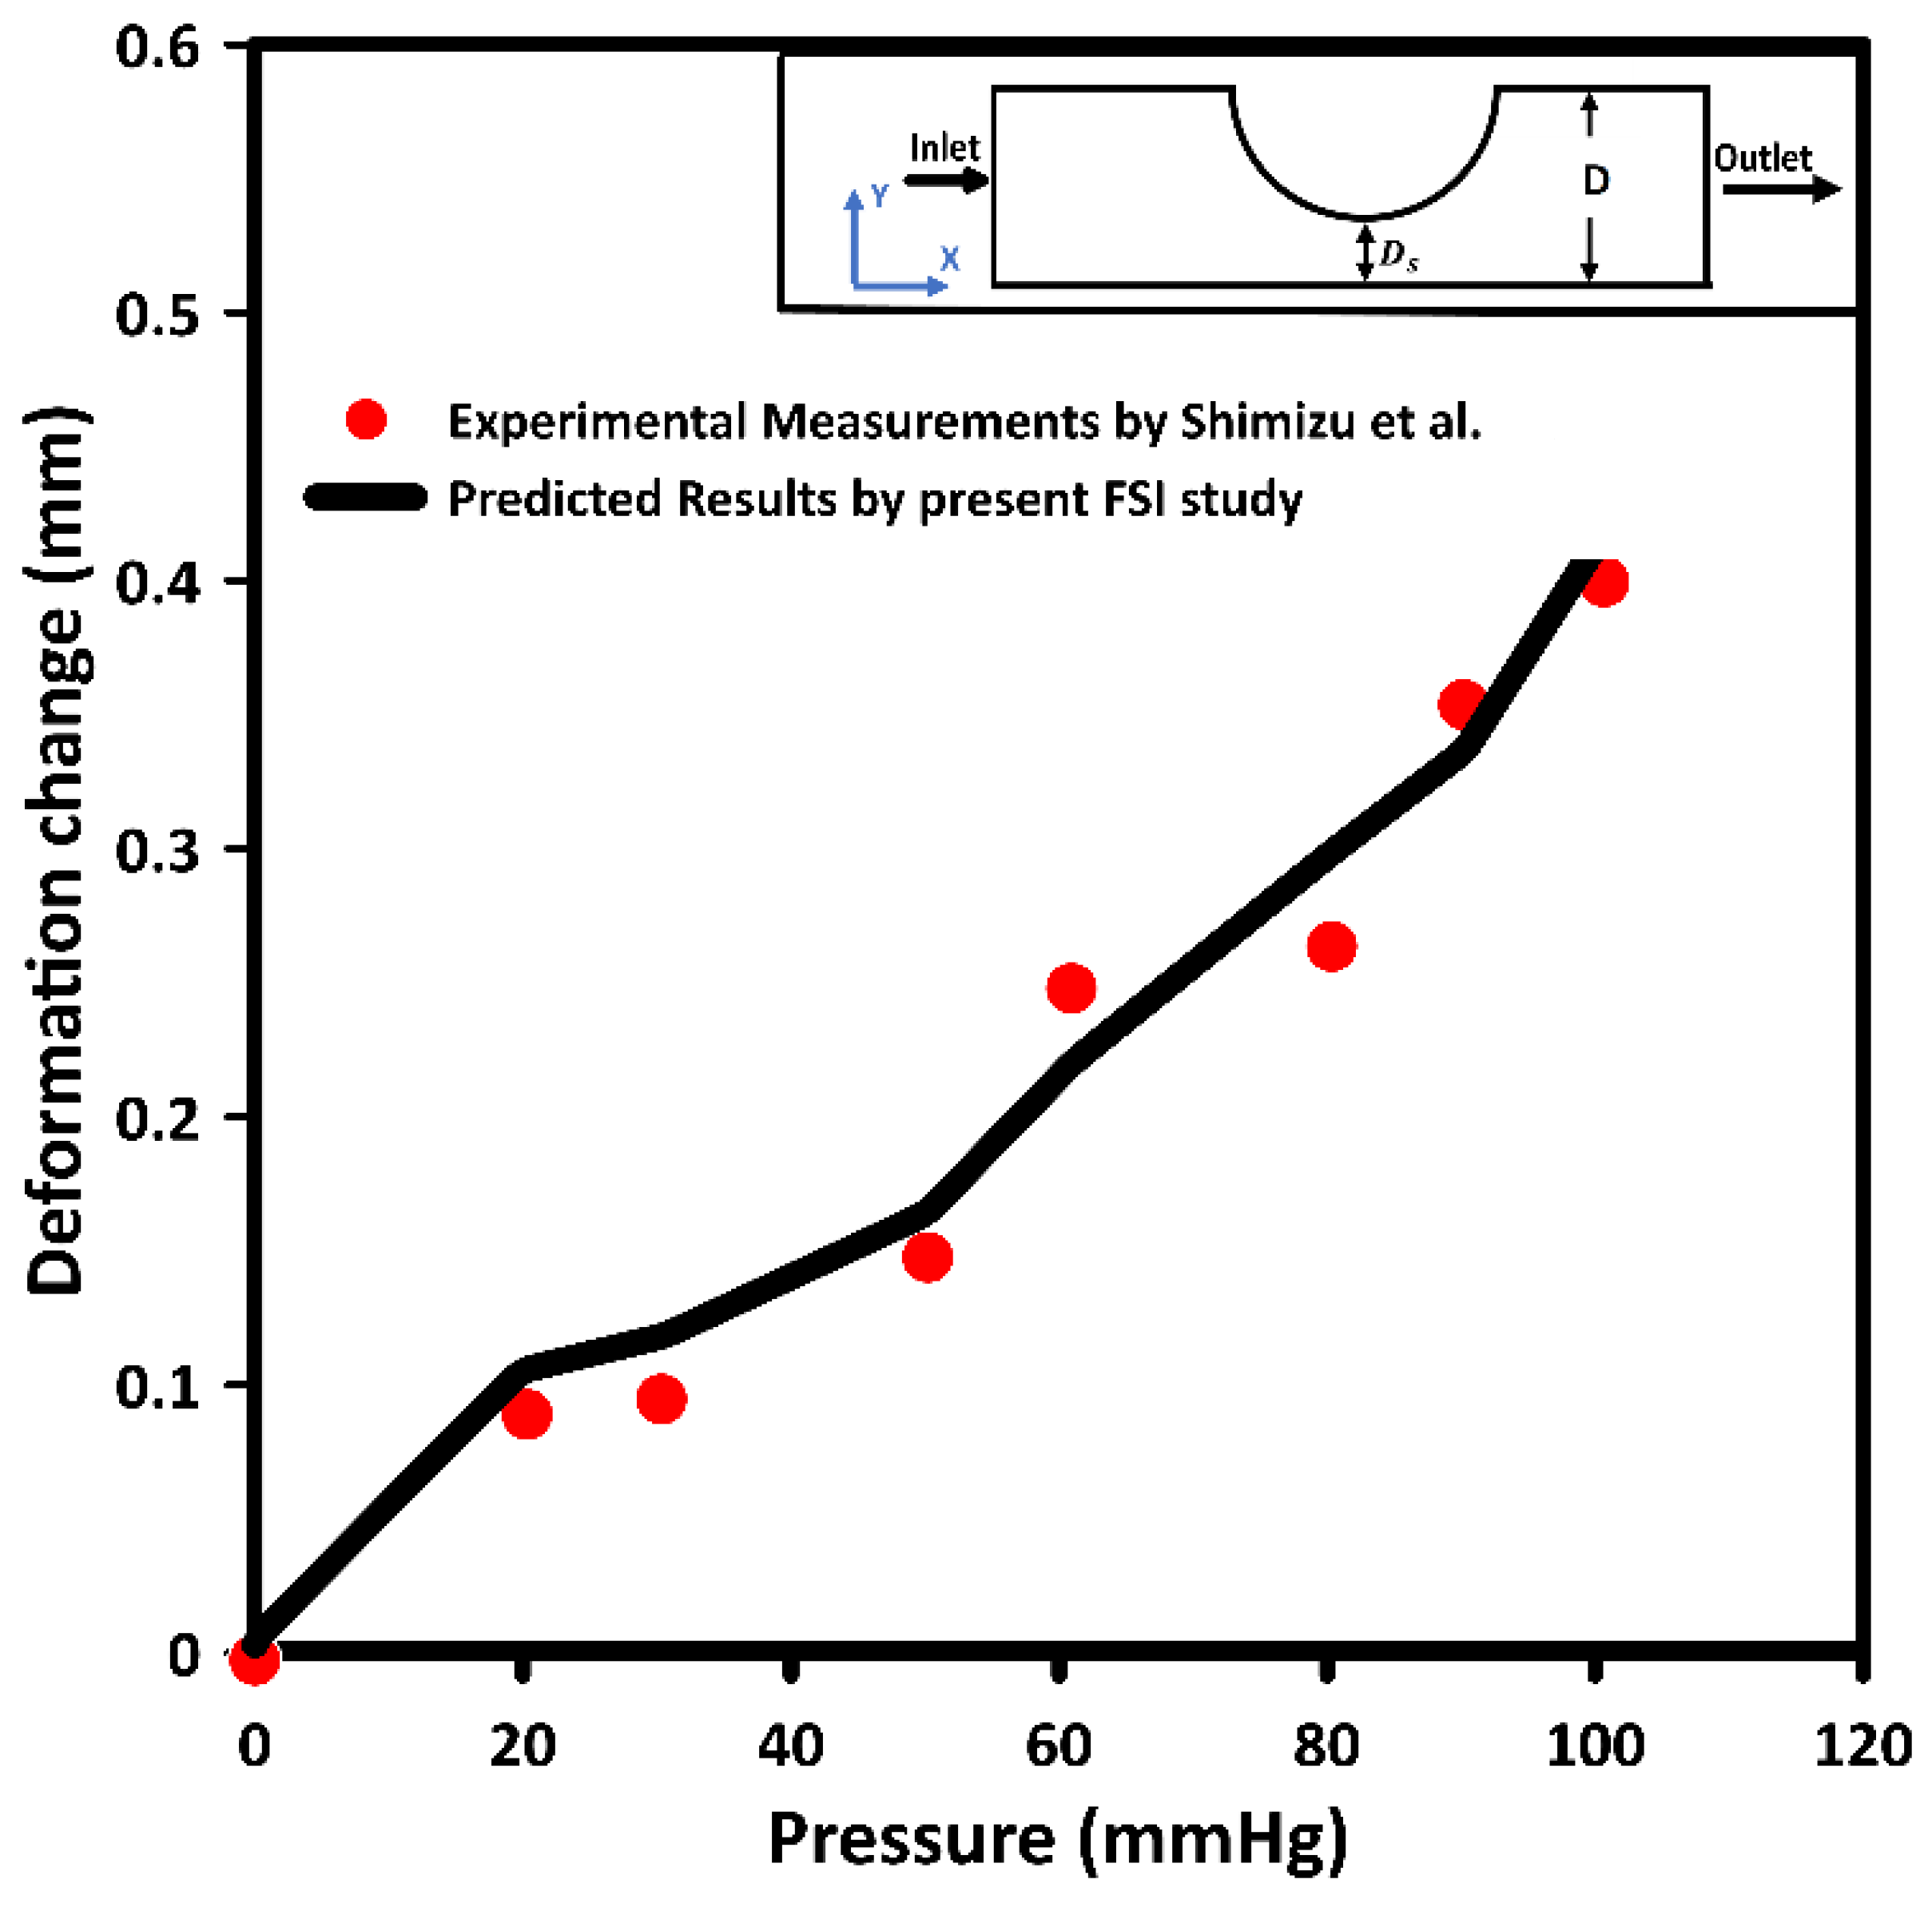
It can be concluded that the deformation output from the numerical results can be validated with the theoretical wall expansion. The theoretical wall expansion assumption follows Barlow’s formula.
where
H is the hoop stress,
P is the pressure,
D is the diameter, and
t is the wall thickness.
Additionally, the strain can be calculated using the following equation
where
is the strain and
E is the Young modulus of elasticity.
For stenotic RCA—model A at the stenotic throat, with pressure = 5406 Pa, diameter = 3.77 mm, thickness = 0.55 mm, and the Young modulus of elasticity = 1.08 MPa, hence the strain = 0.0171 and in diameter = 0.064 mm which agrees with
Figure 10. Additionally, for stenotic ICA—model B at the stenotic throat, with pressure = 450 Pa, diameter = 7.82 mm, thickness = 0.66 mm, and the Young modulus of elasticity = 1.08 MPa, hence the strain = 0.00247 and in diameter = 0.0193 mm which agrees with
Figure 11. In the same context, for stenotic CCA—model C at the stenotic throat, with pressure = 5531 Pa, diameter = 7.82 mm, thickness = 0.66 mm, and the Young modulus of elasticity = 1.08 MPa, hence the strain = 0.0303 and in diameter = 0.237 mm which agrees with
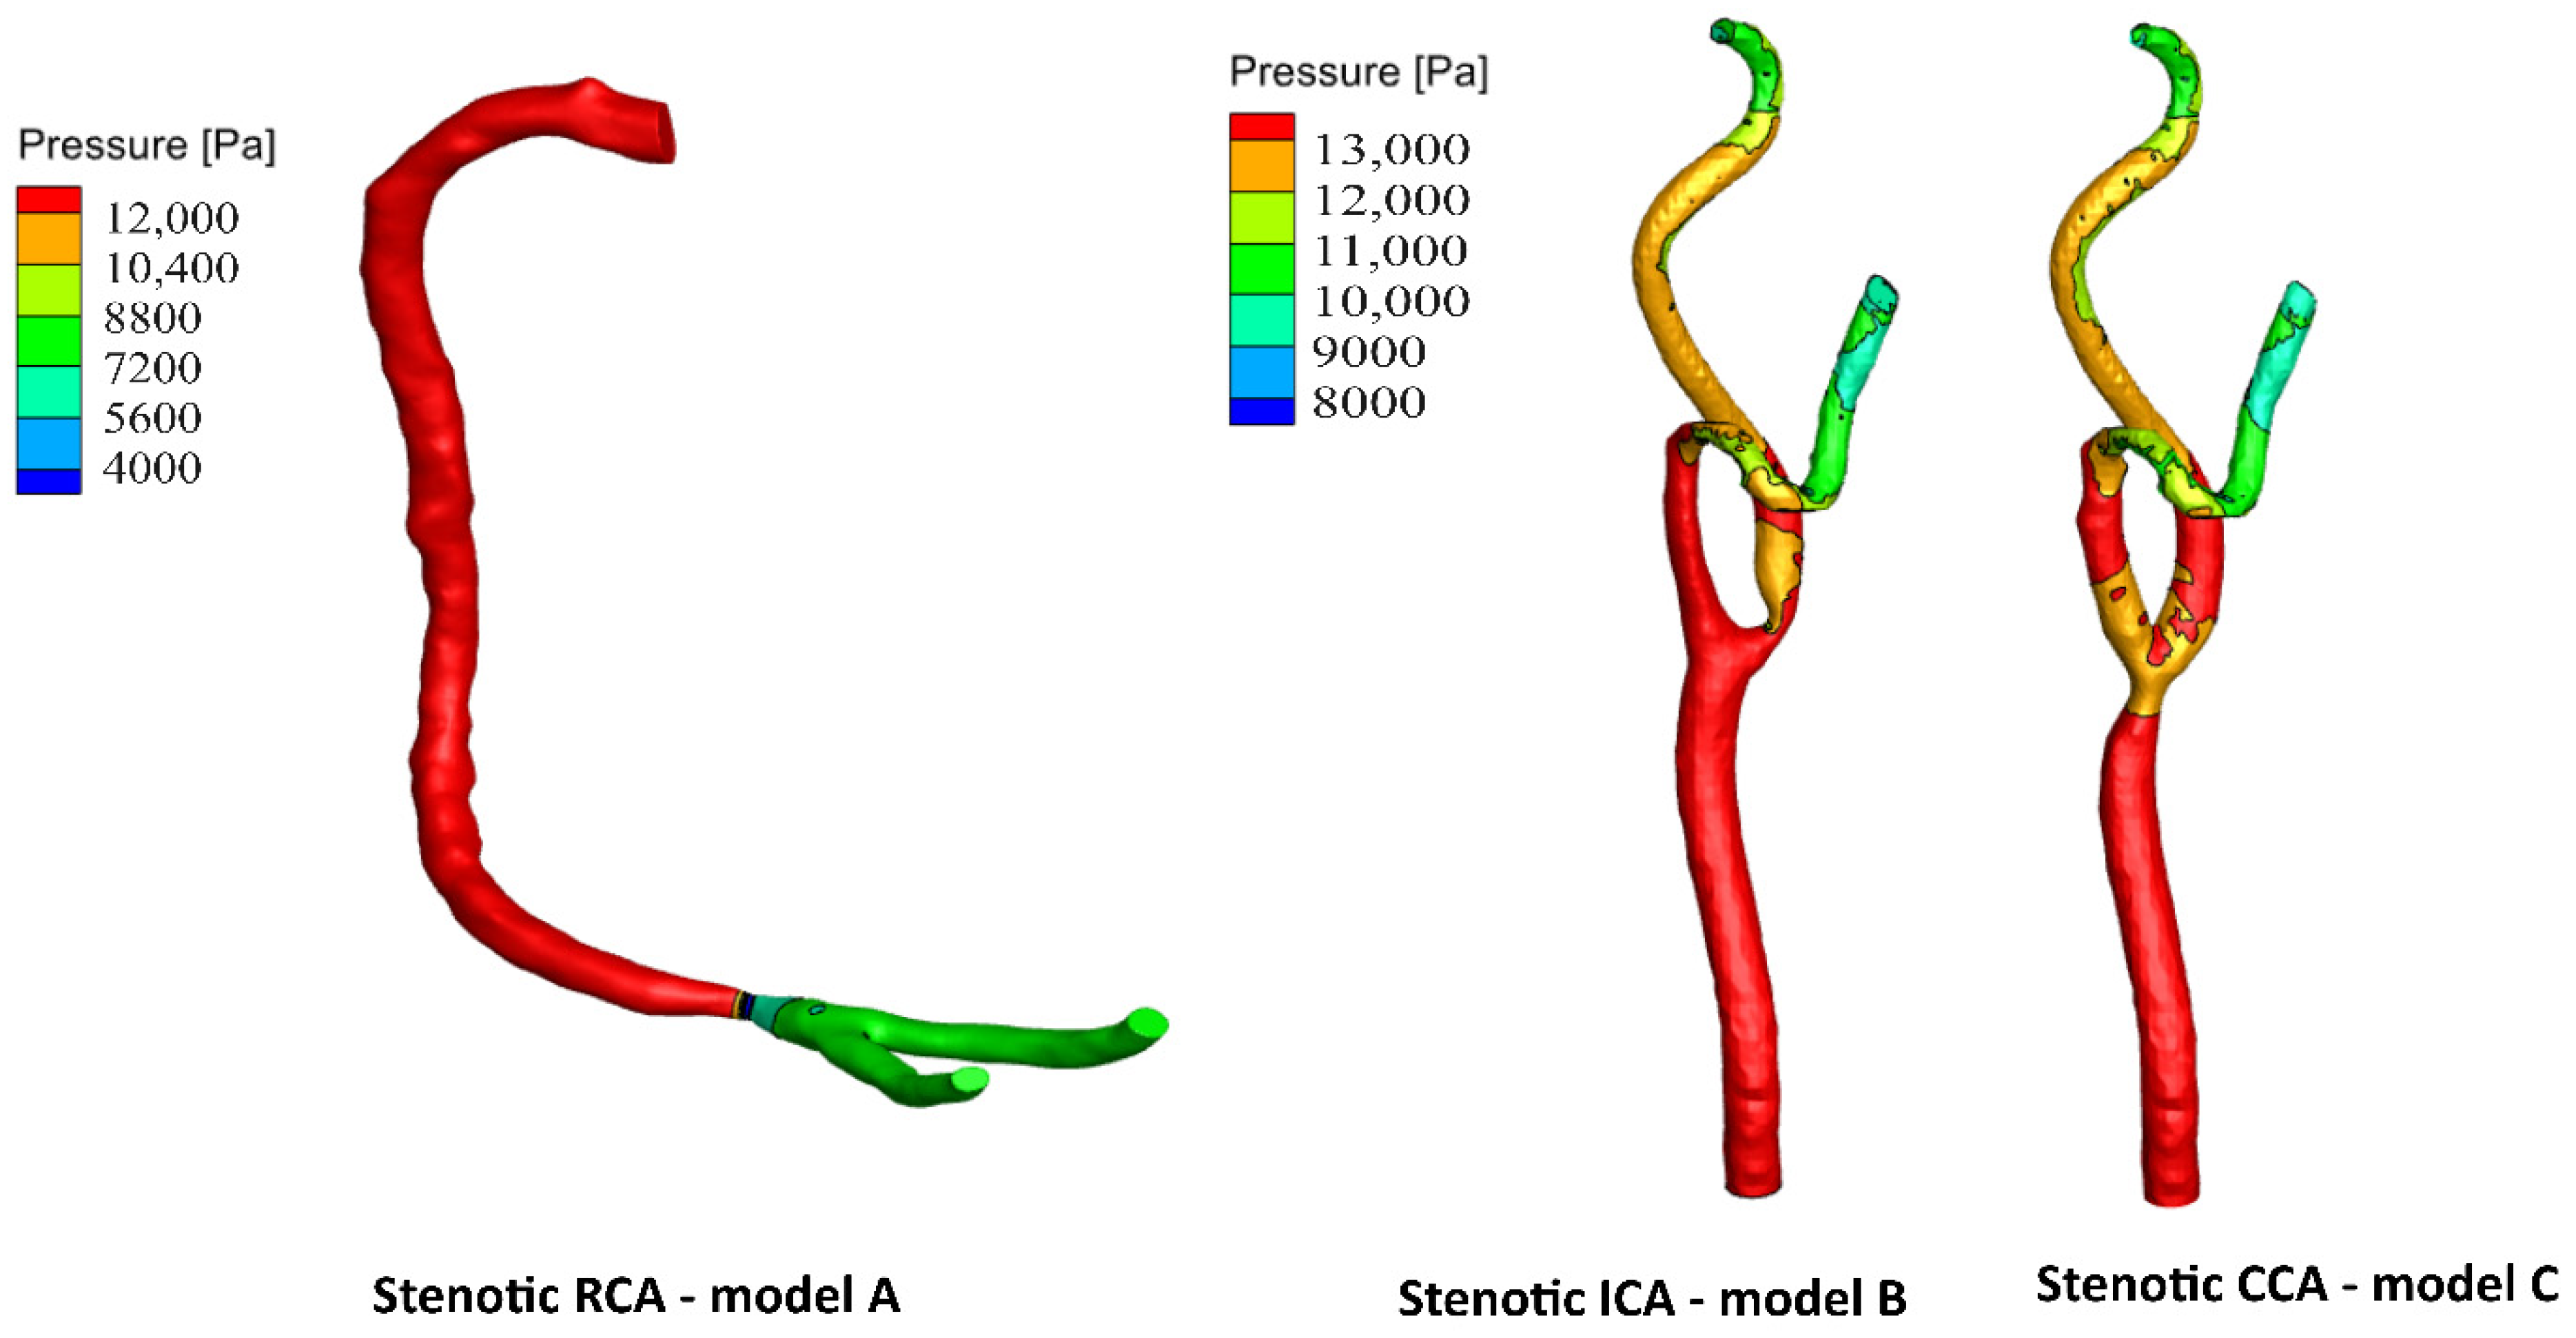
Figure 12. Moreover, it is well known that the deformation occurred due to the pressure forces near the arterial wall. However,
Figure 7,
Figure 8 and
Figure 9 show the velocity streamlines inside the RCA and CA geometries by using the wall compliance and rigidity assumption to compare the effect of using the rigid wall assumption on the hemodynamics. Furthermore,
Figure 10,
Figure 11 and
Figure 12 show the deformation that occurred in the elastic wall geometries due to the presence of pressure forces on the arterial walls. Additionally,
Figure 13 shows the pressure contours along the studied geometries at the peak systole of the cardiac cycle.
4. Conclusions
The occurrence of stenosis significantly affects the blood flow dynamic factors, such as WSS, velocity distribution, and arterial wall deformation. Hence, hemodynamics can be used as a threshold to explore the influence of using the rigid wall assumption along the coronary and the carotid arteries. Therefore, comprehensive blood flow models were developed and numerically simulated to predict the blood flow dynamic factors.
It can be concluded that considering the arterial wall elasticity is unnecessary in simulating large arteries such as the carotid artery. It was found that the hemodynamics for the stenotic carotid artery (CA) were almost the same when using the elastic and rigid wall assumptions. The WSS at the stenosis throat reached 116.9 Pa, considering the wall elasticity compared to 118.8 Pa for the rigid wall assumption. Additionally, at the artery bifurcation, the value of WSS reached 16.3 Pa by considering the wall elasticity and 16.2 Pa for the rigid wall assumption. Hence, assuming the elastic wall assumption for relatively large arteries such as the CA can be neglected to save the computational cost.
However, for the stenotic right coronary artery (RCA), it was found that adopting the rigid wall assumption underestimates the WSS values at the stenosis throat by 10.24% compared to simulating the blood flow considering wall elasticity. Additionally, it was found that rigid wall assumption underestimates the WSS values at the RCA bifurcation by 3.8% compared to considering wall compliance.
Accordingly, the blood flow dynamic factors were significantly influenced by using the elastic wall assumption for relatively small diameters of the blood vessels, such as RCA.
Additionally, the rigid wall assumption is plausible in flow modeling for relatively large diameters such as the carotid artery.


 ,
, 


