
Simulation-Based Clarification of Appropriate Factors for Presenting Phosphene in Two Directions Avoiding Electrical Interference


Abstract
:1. Introduction
2. Background Knowledge
2.1. Stimulus Factors for Human Head
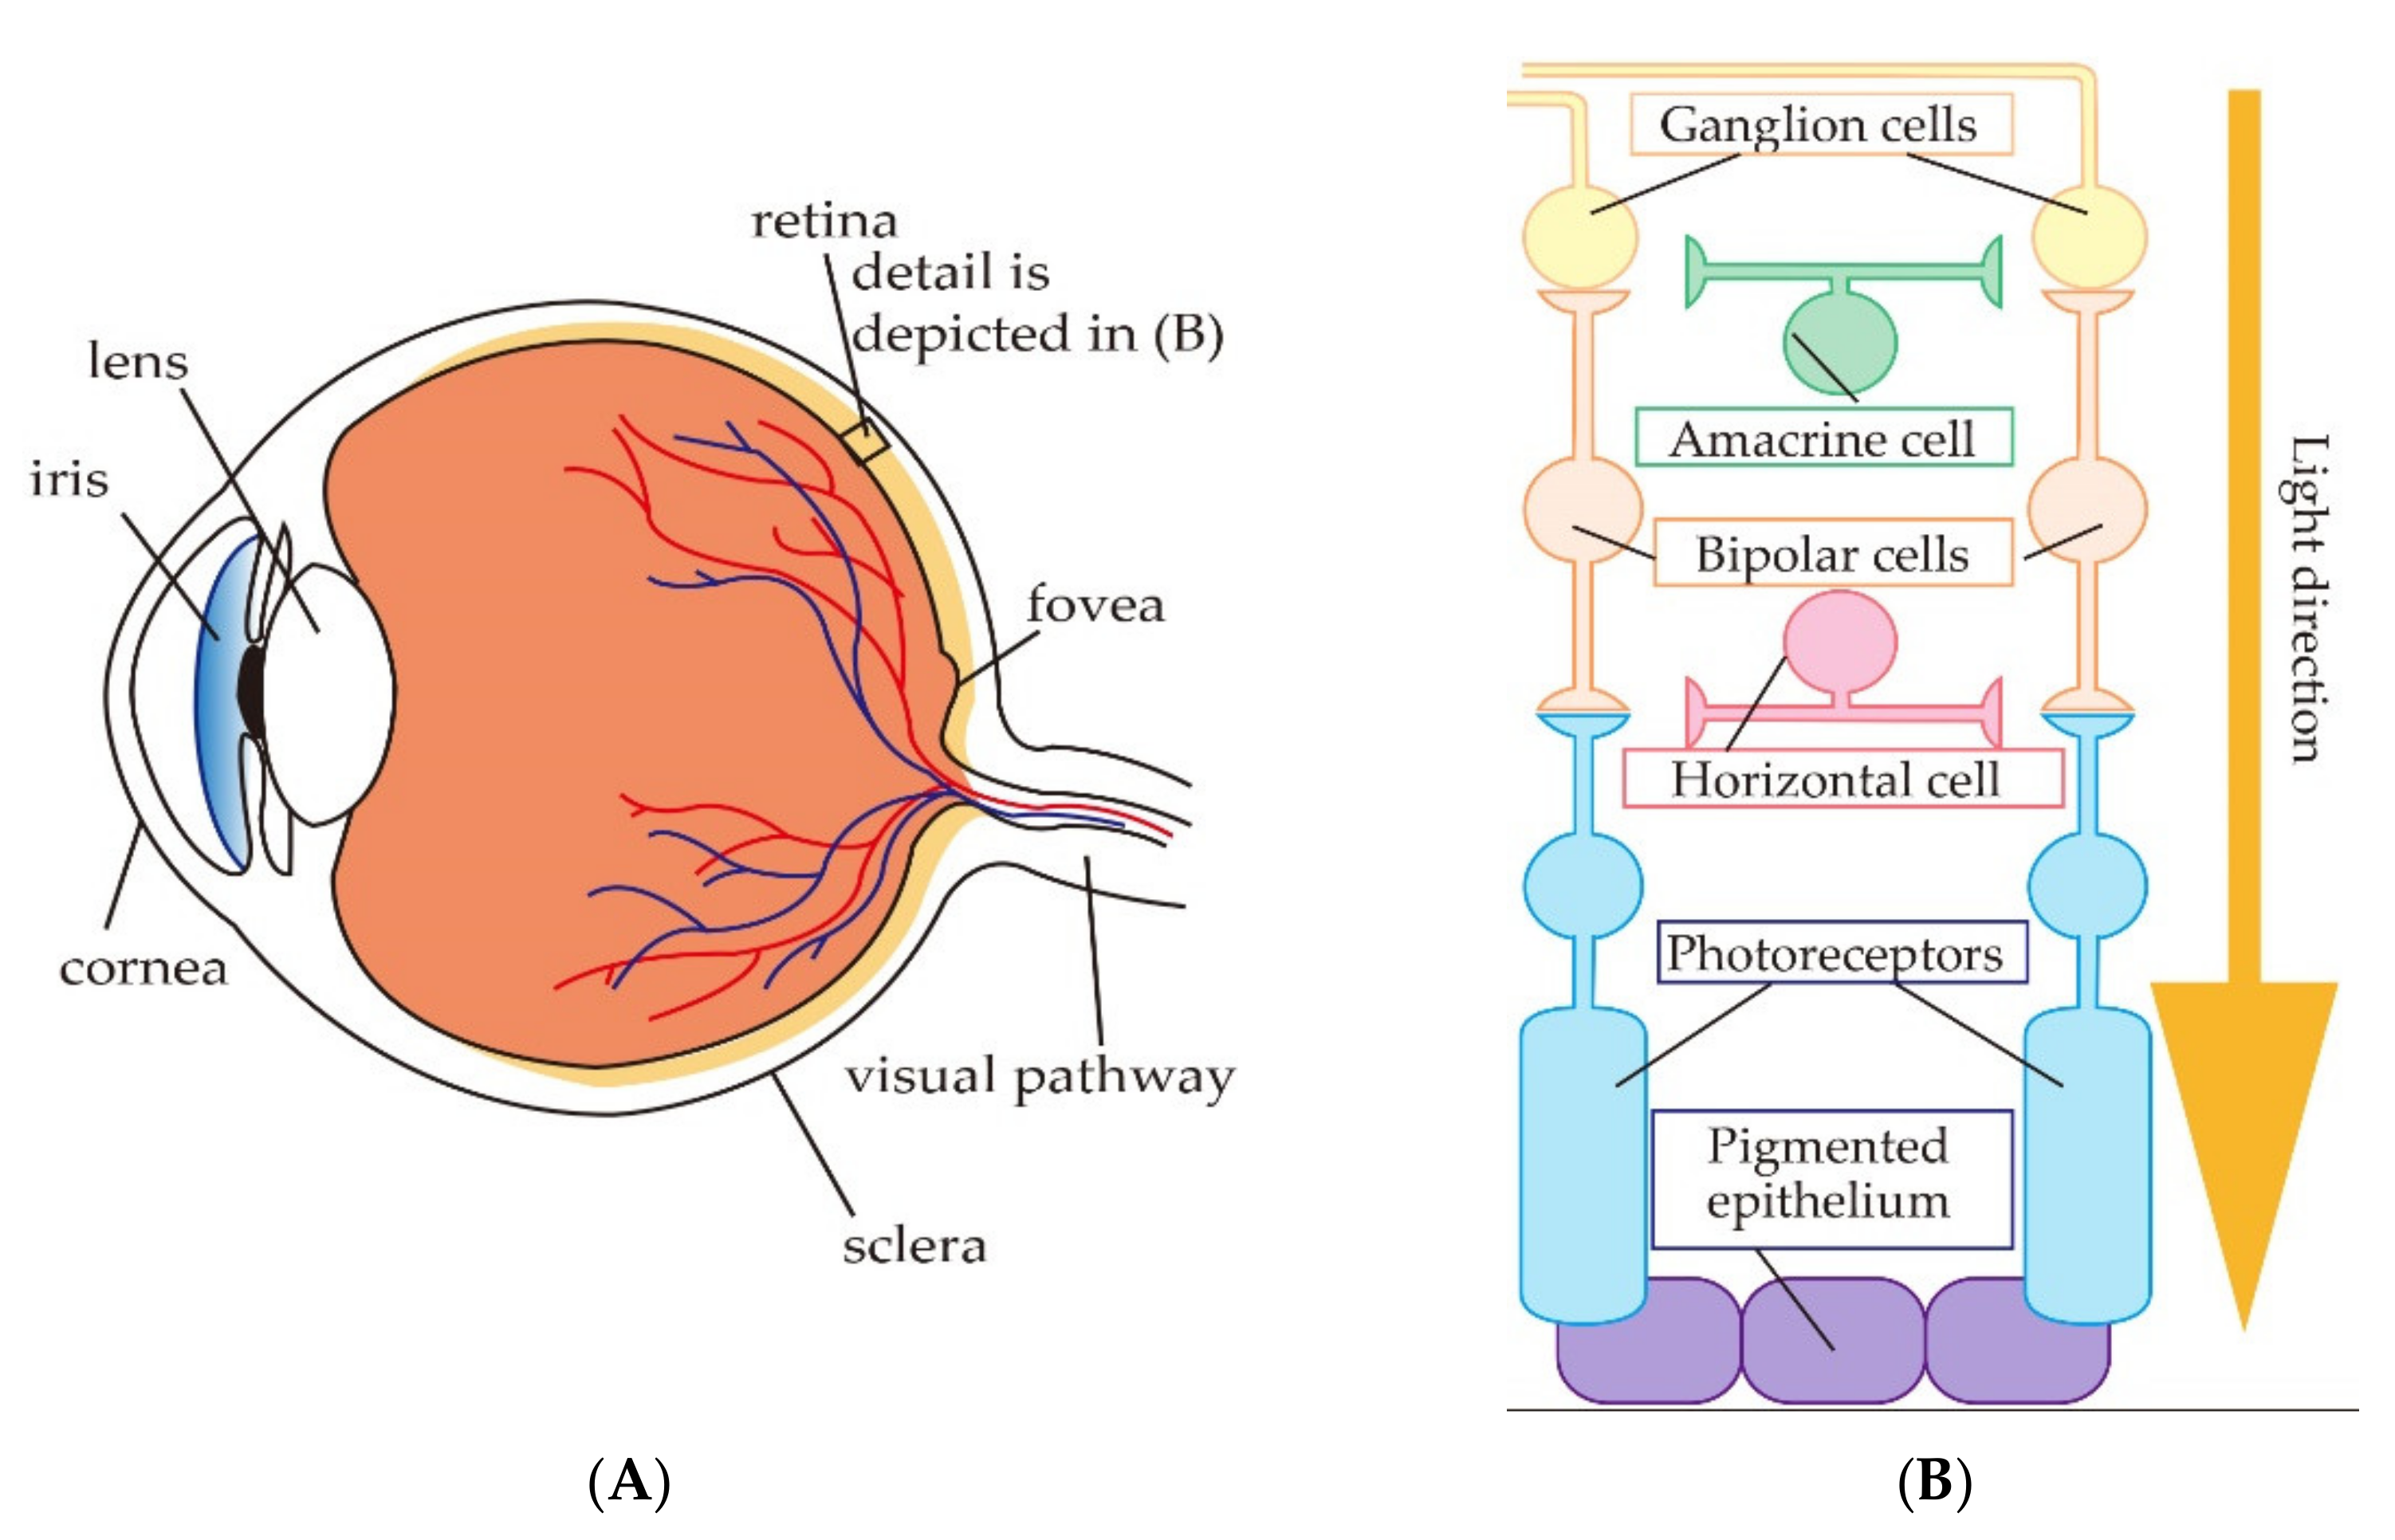
2.2. Phosphene Presentation
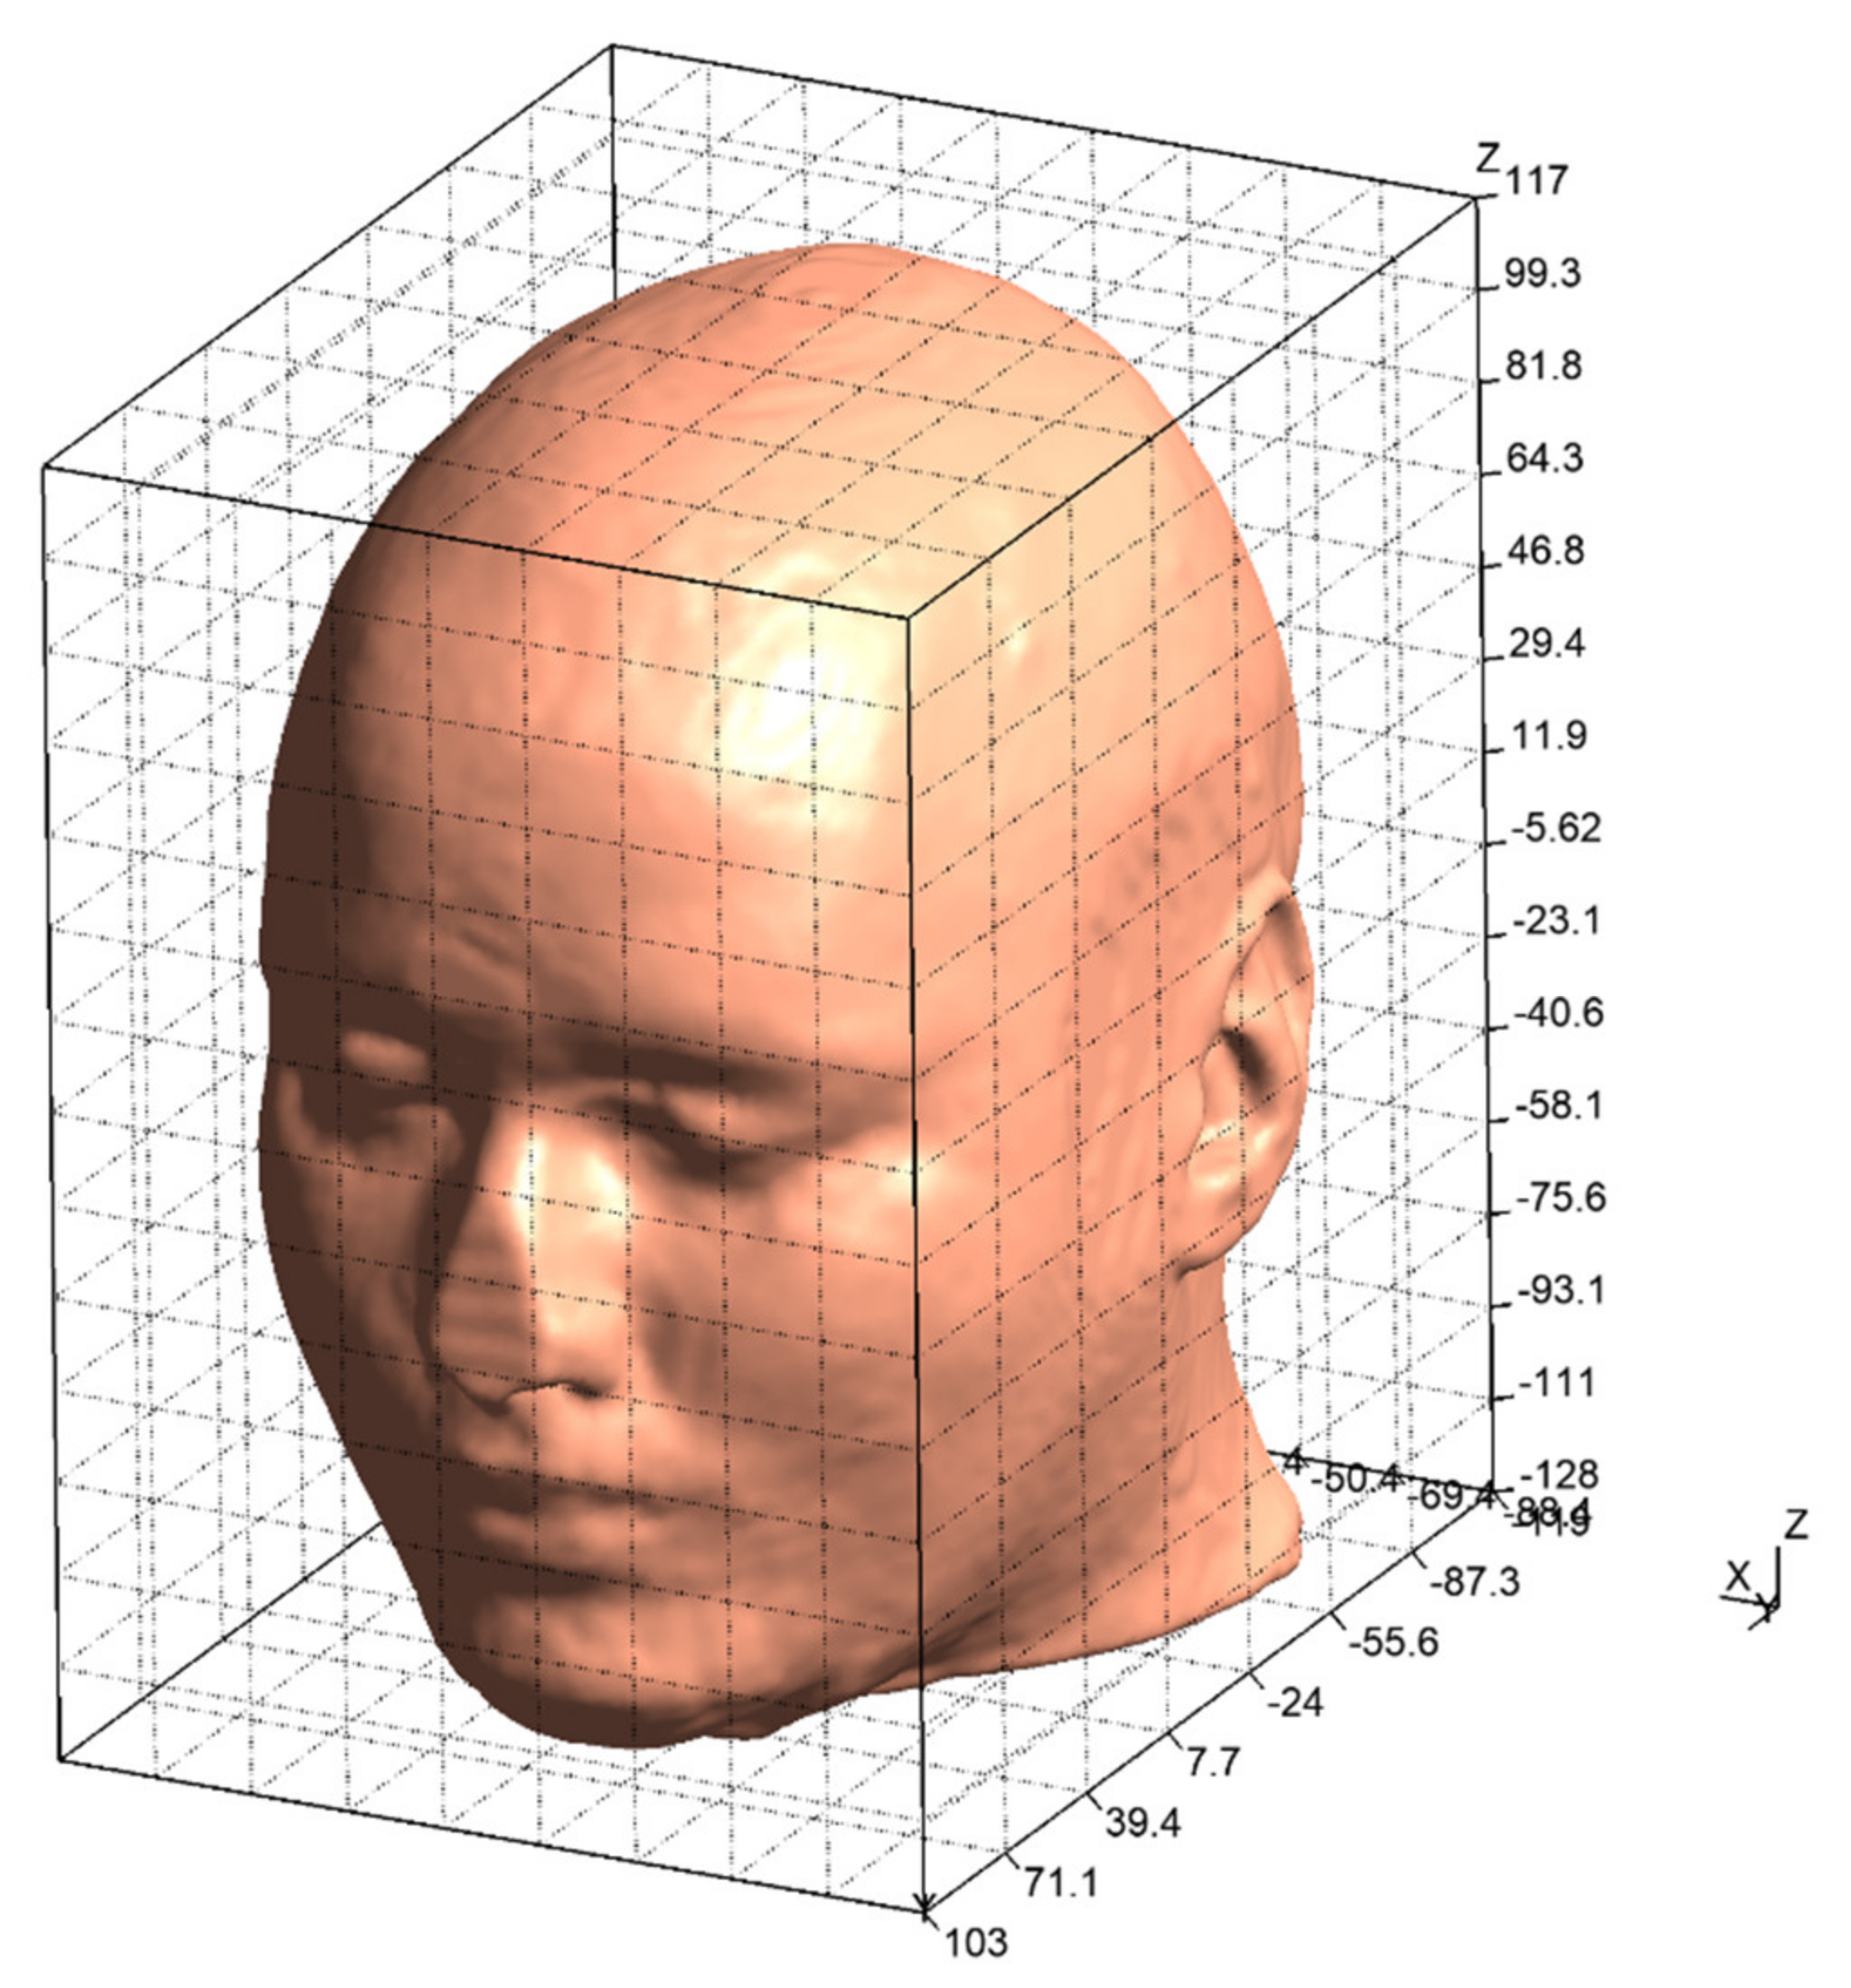
2.3. Simulation Tool of the Electric Field for Human Head Model
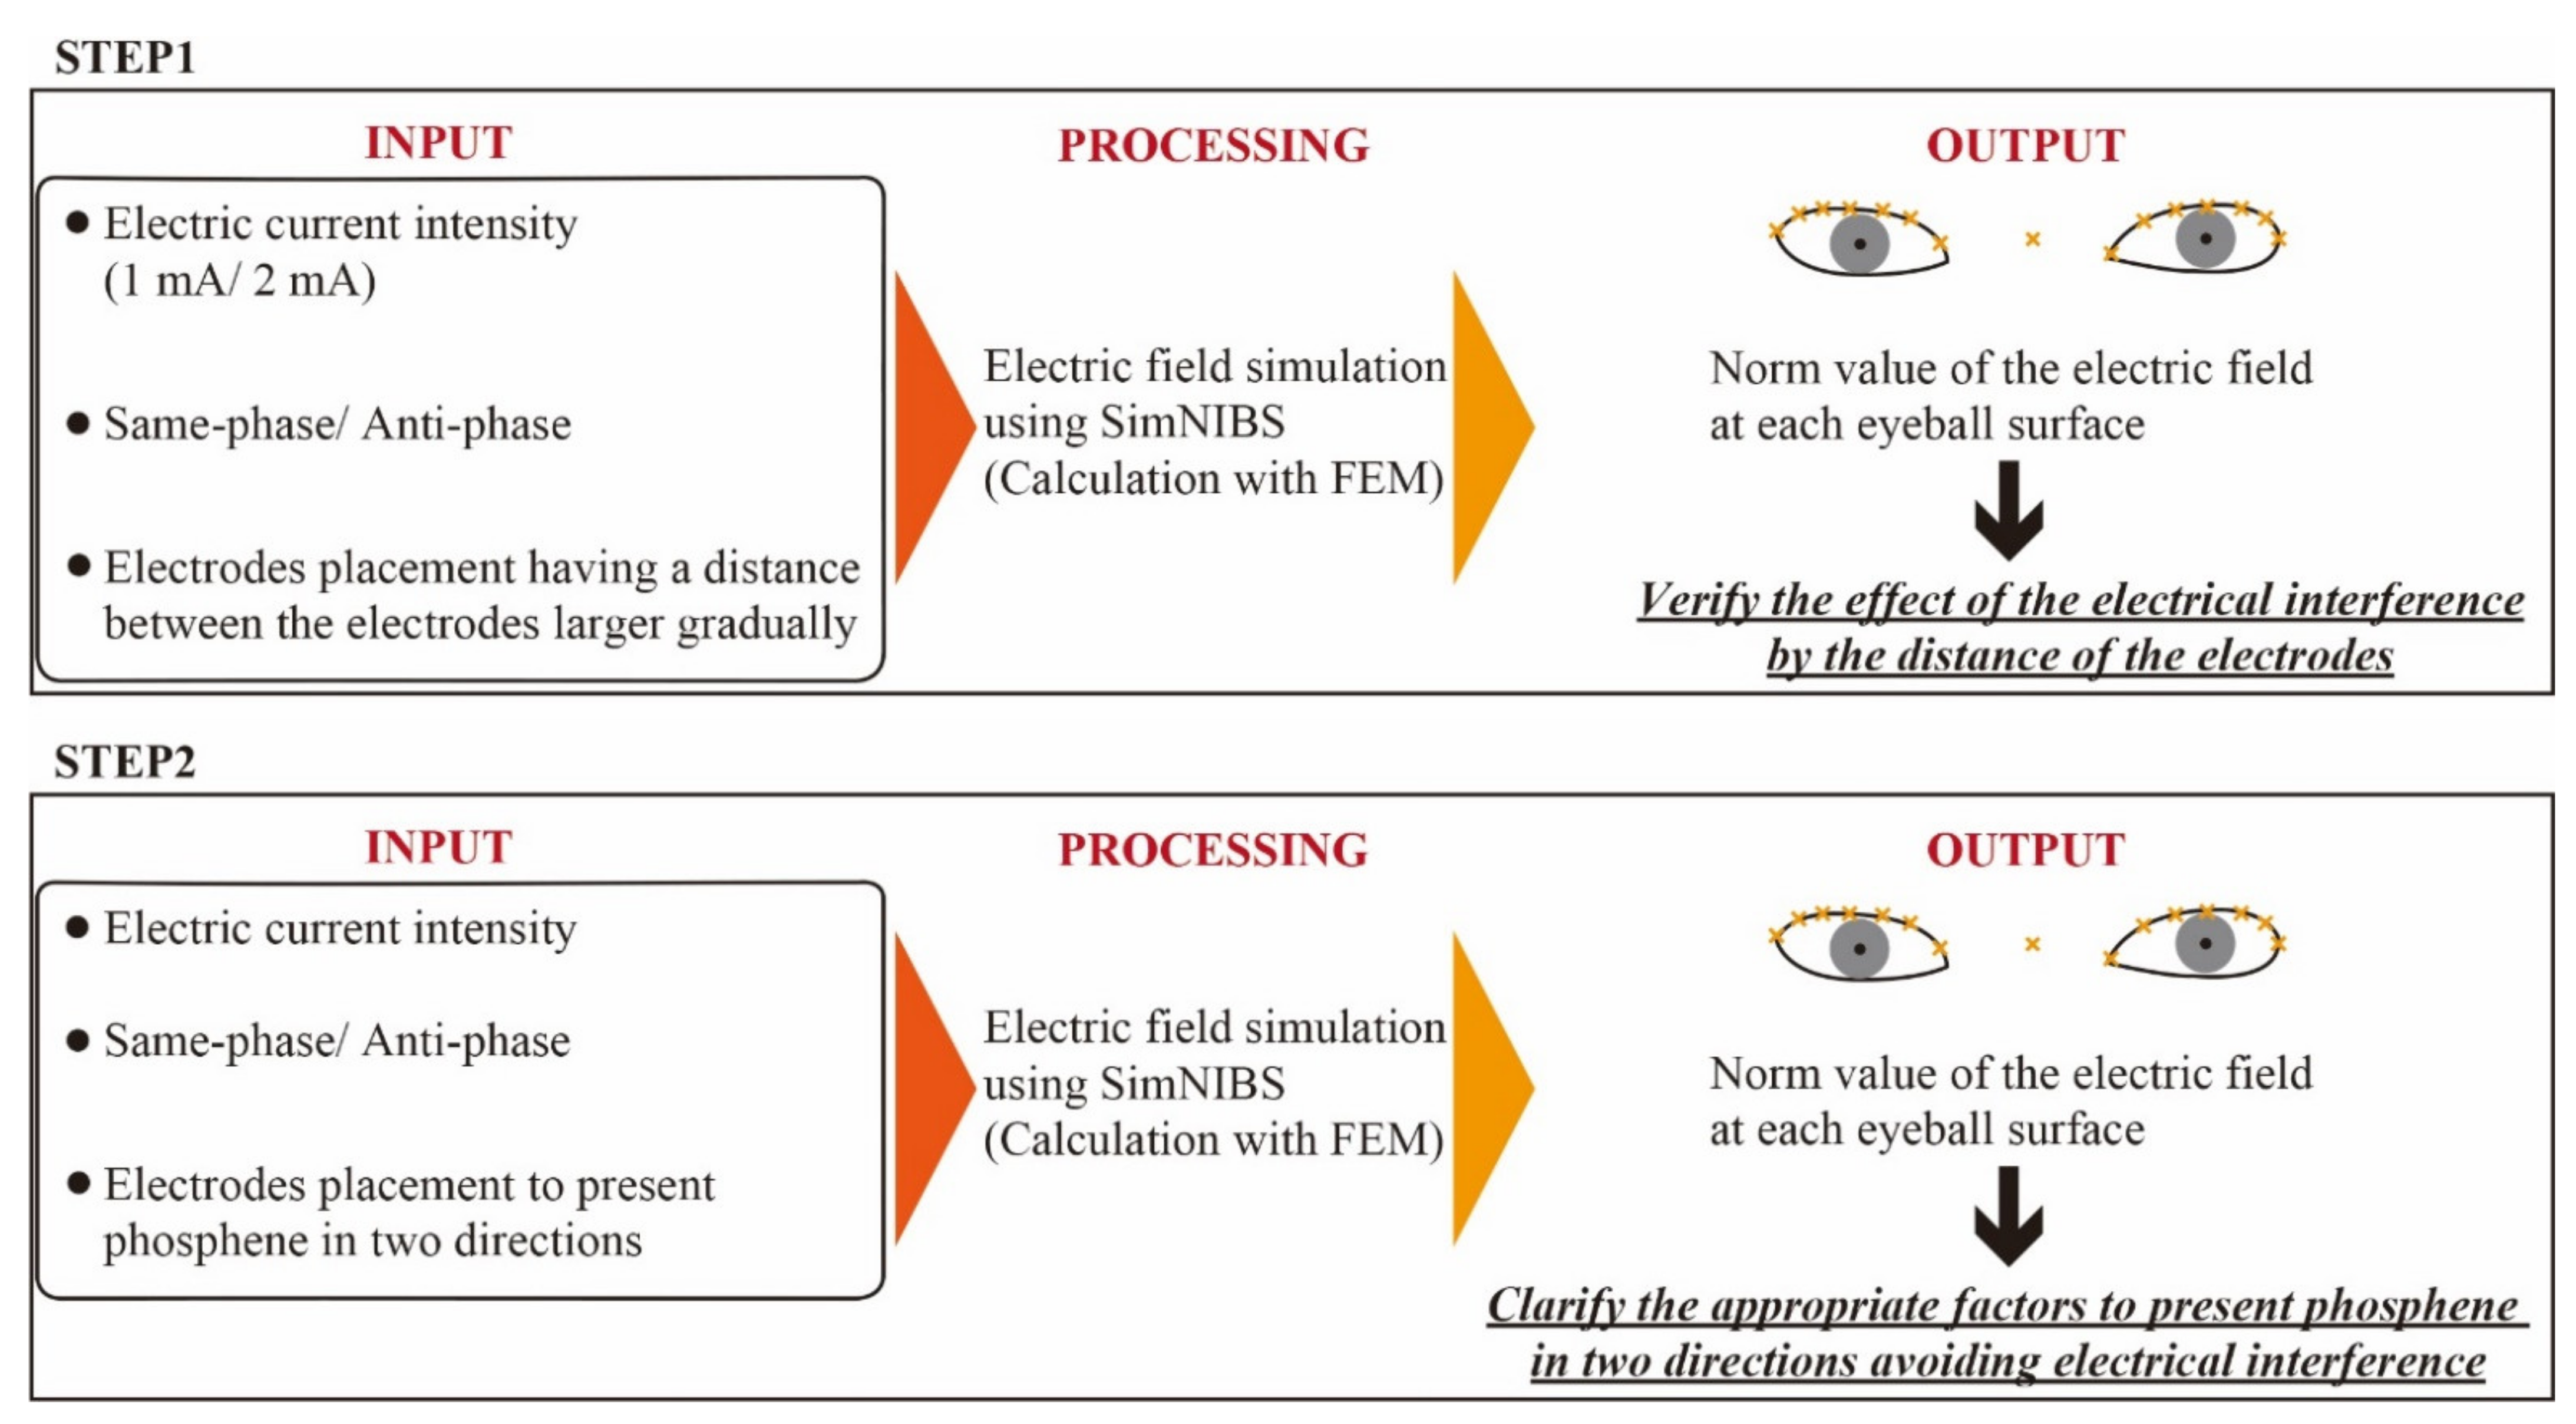
3. Evaluation Method for Avoiding the Electric Interference While Presenting Phosphene in Two Directions
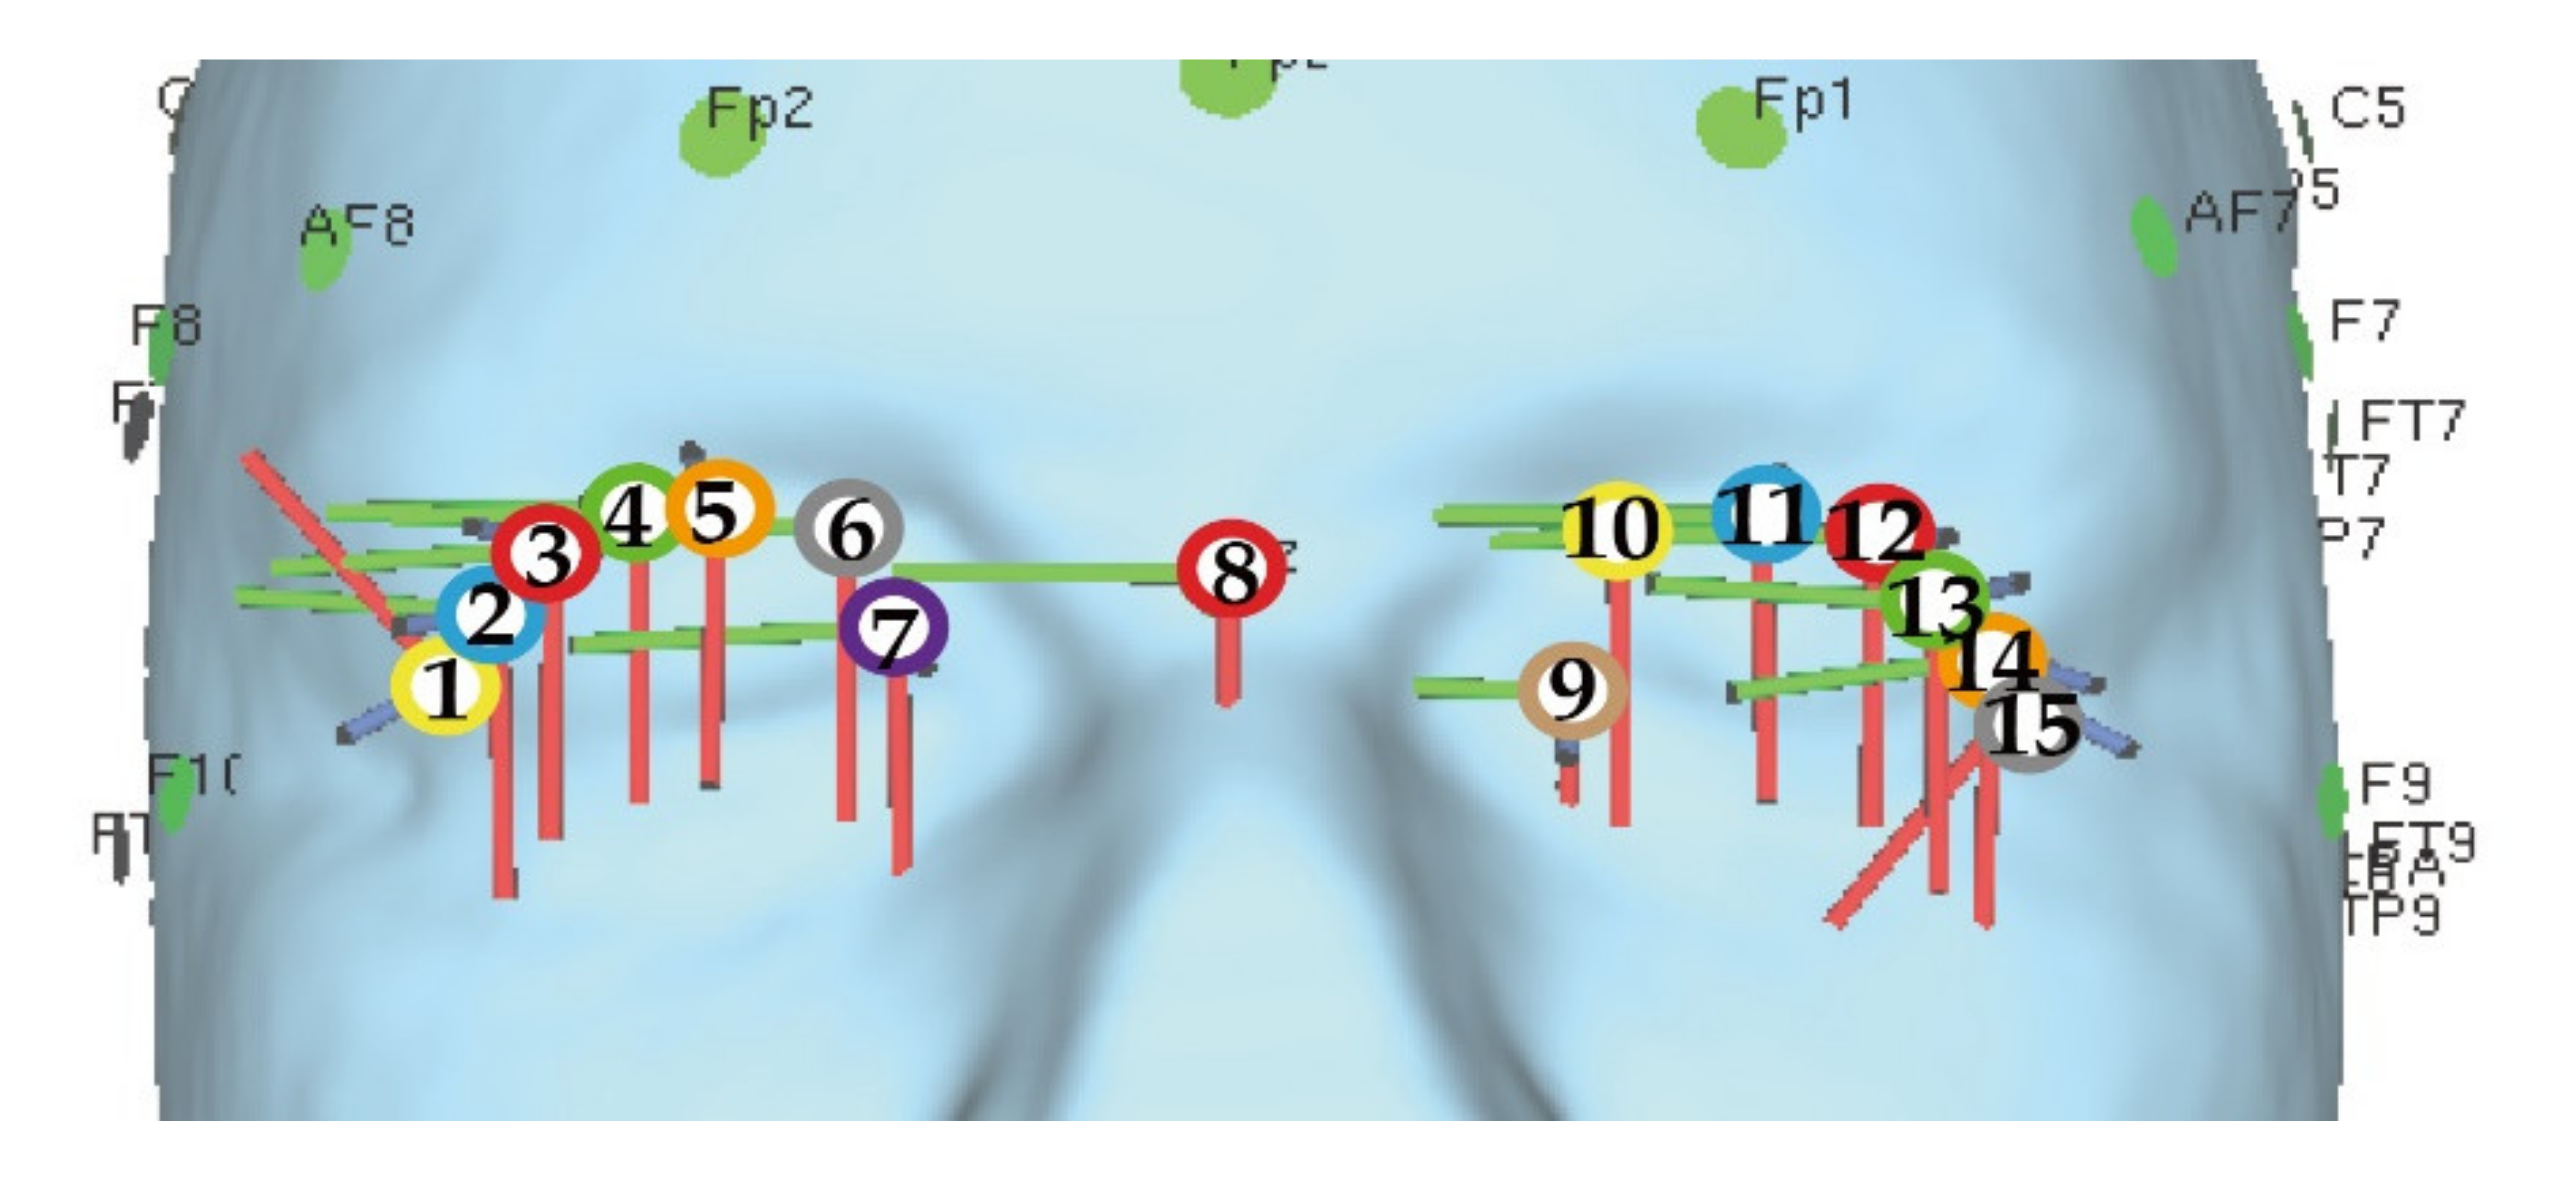
- Verify how much electrical interference due to the distance between the electrodes affects the transition of the electric field on the eyeball surface. The electrode placements are designed to gradually make the distance between the electrodes larger.
- Clarify how to simultaneously present the phosphene in two directions of the visual field while avoiding electrical interference. The electrode placements that stimulate intended regions on the eyeball surface reported in the previous study are applied in the simulation.
3.1. The Simulation Conditions
3.2. Summarization of the Evaluation Method
4. Evaluation
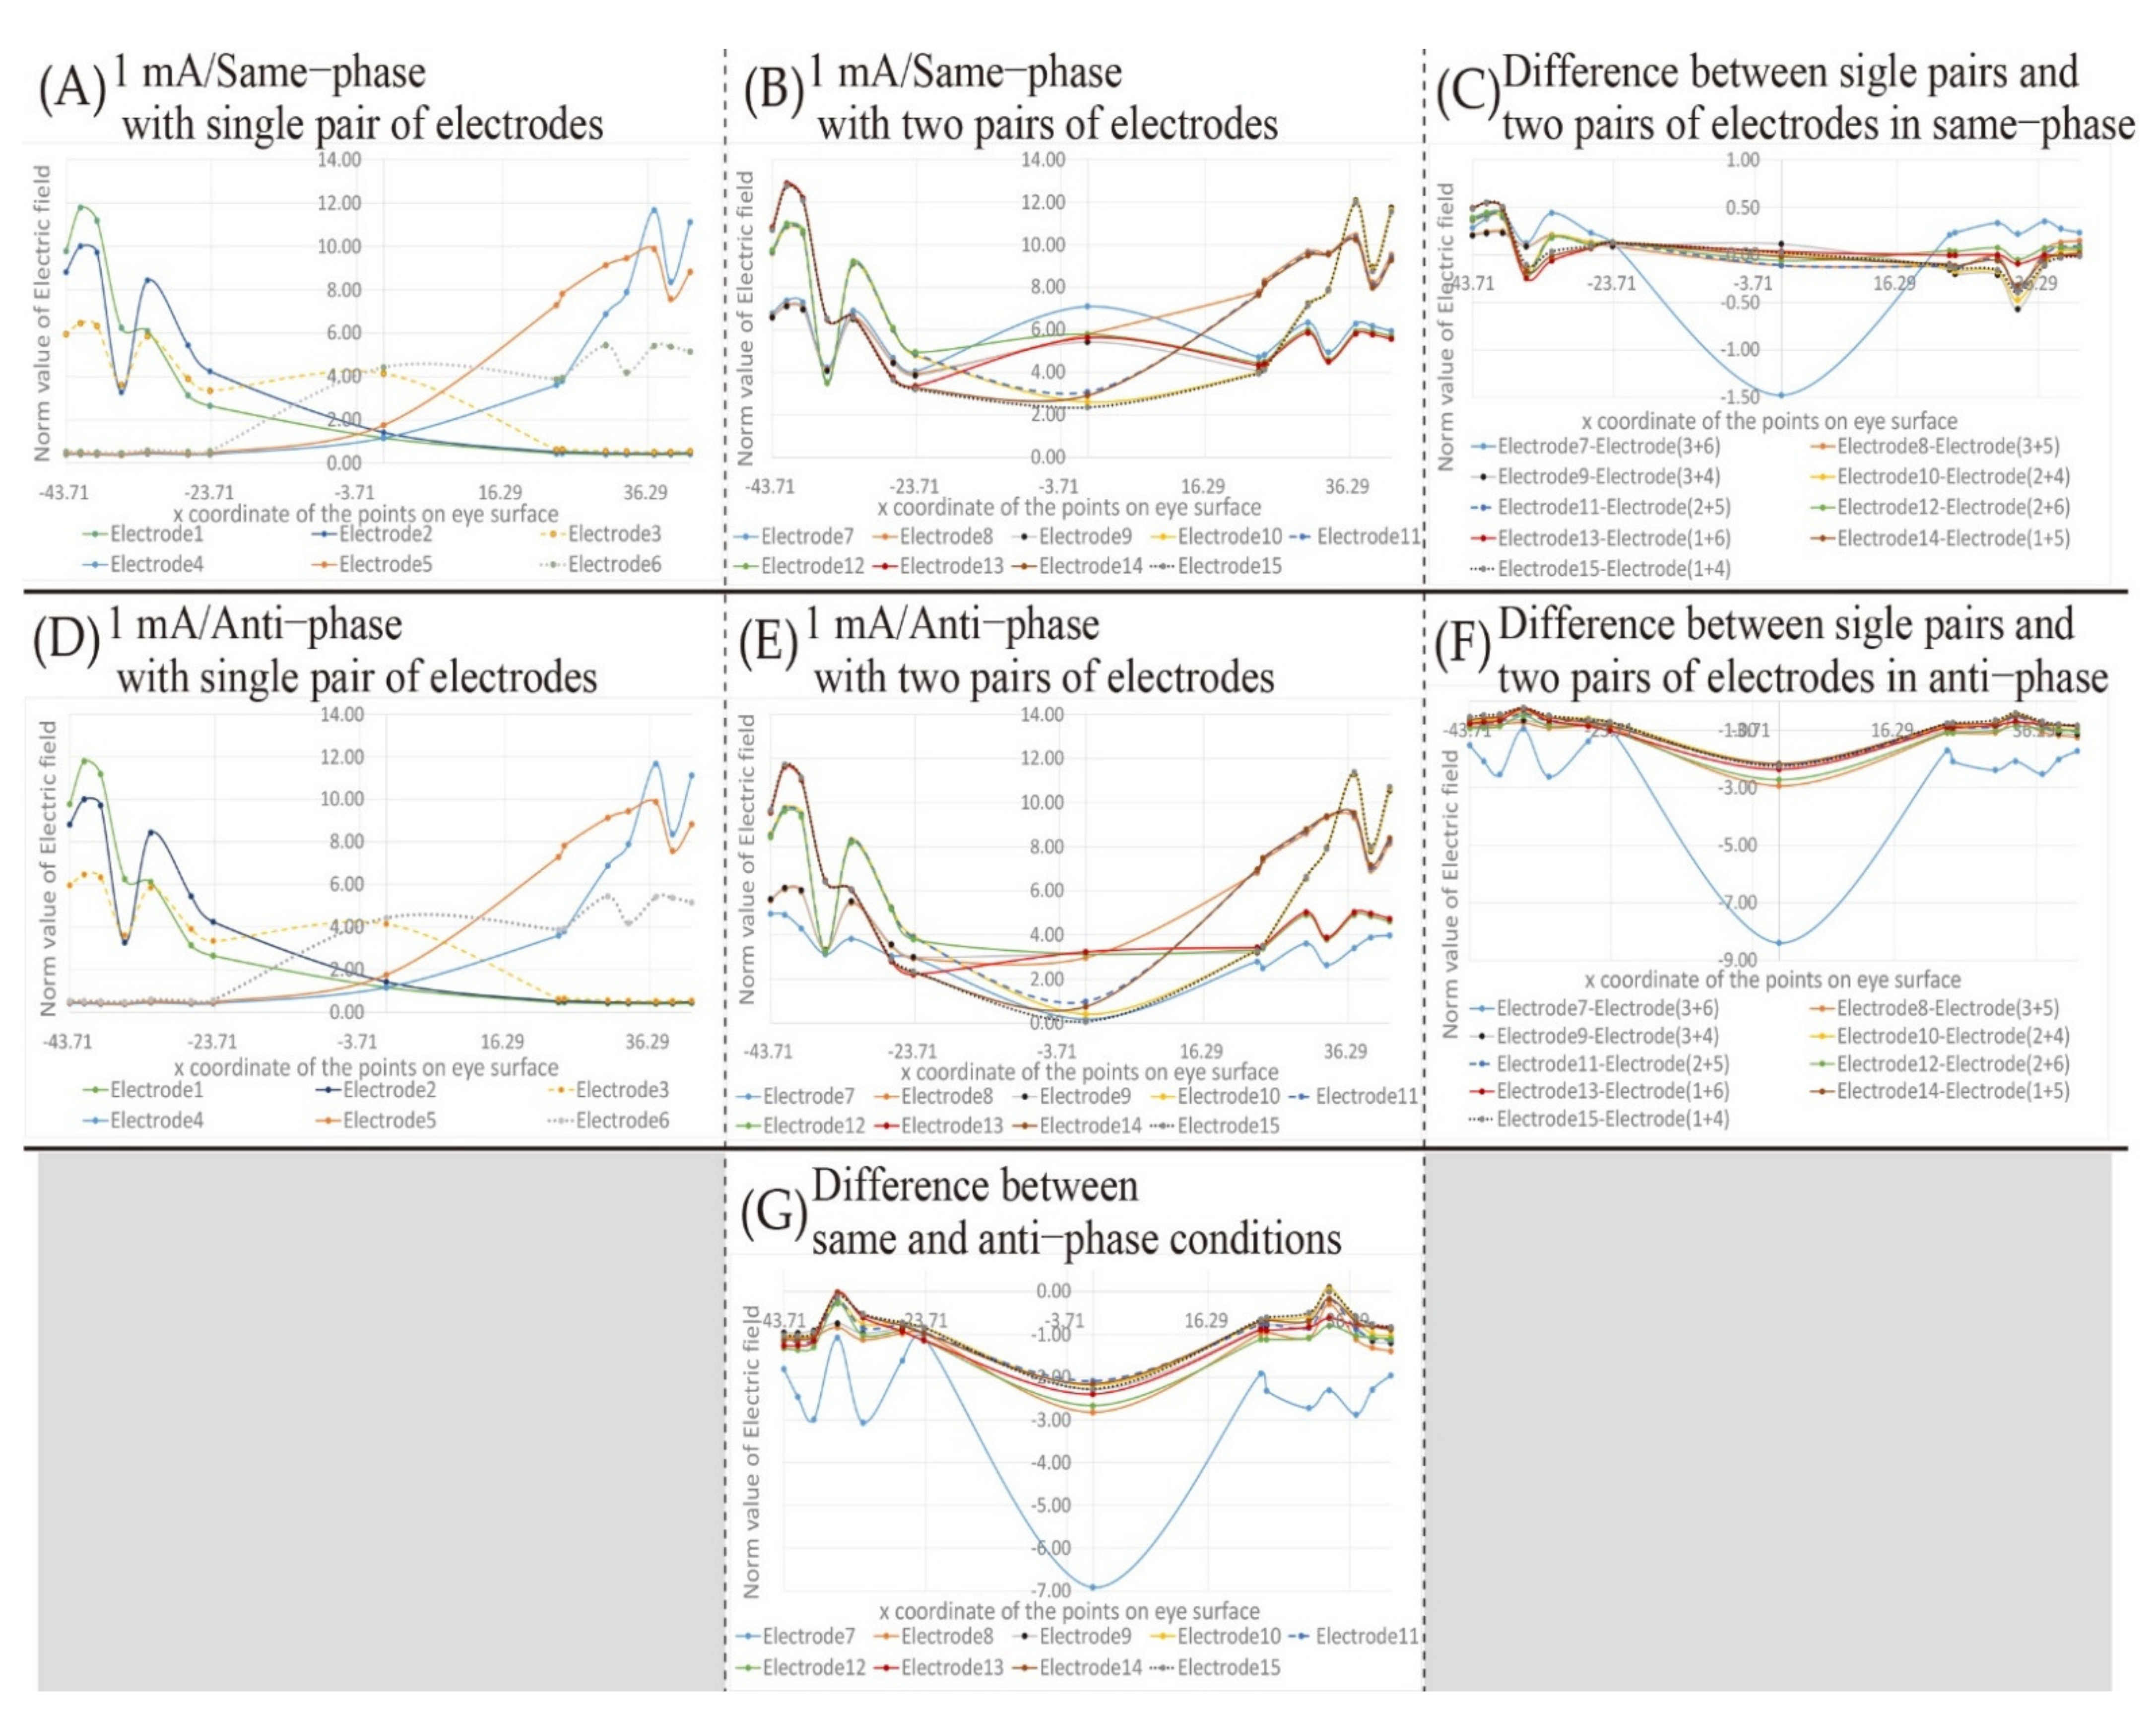
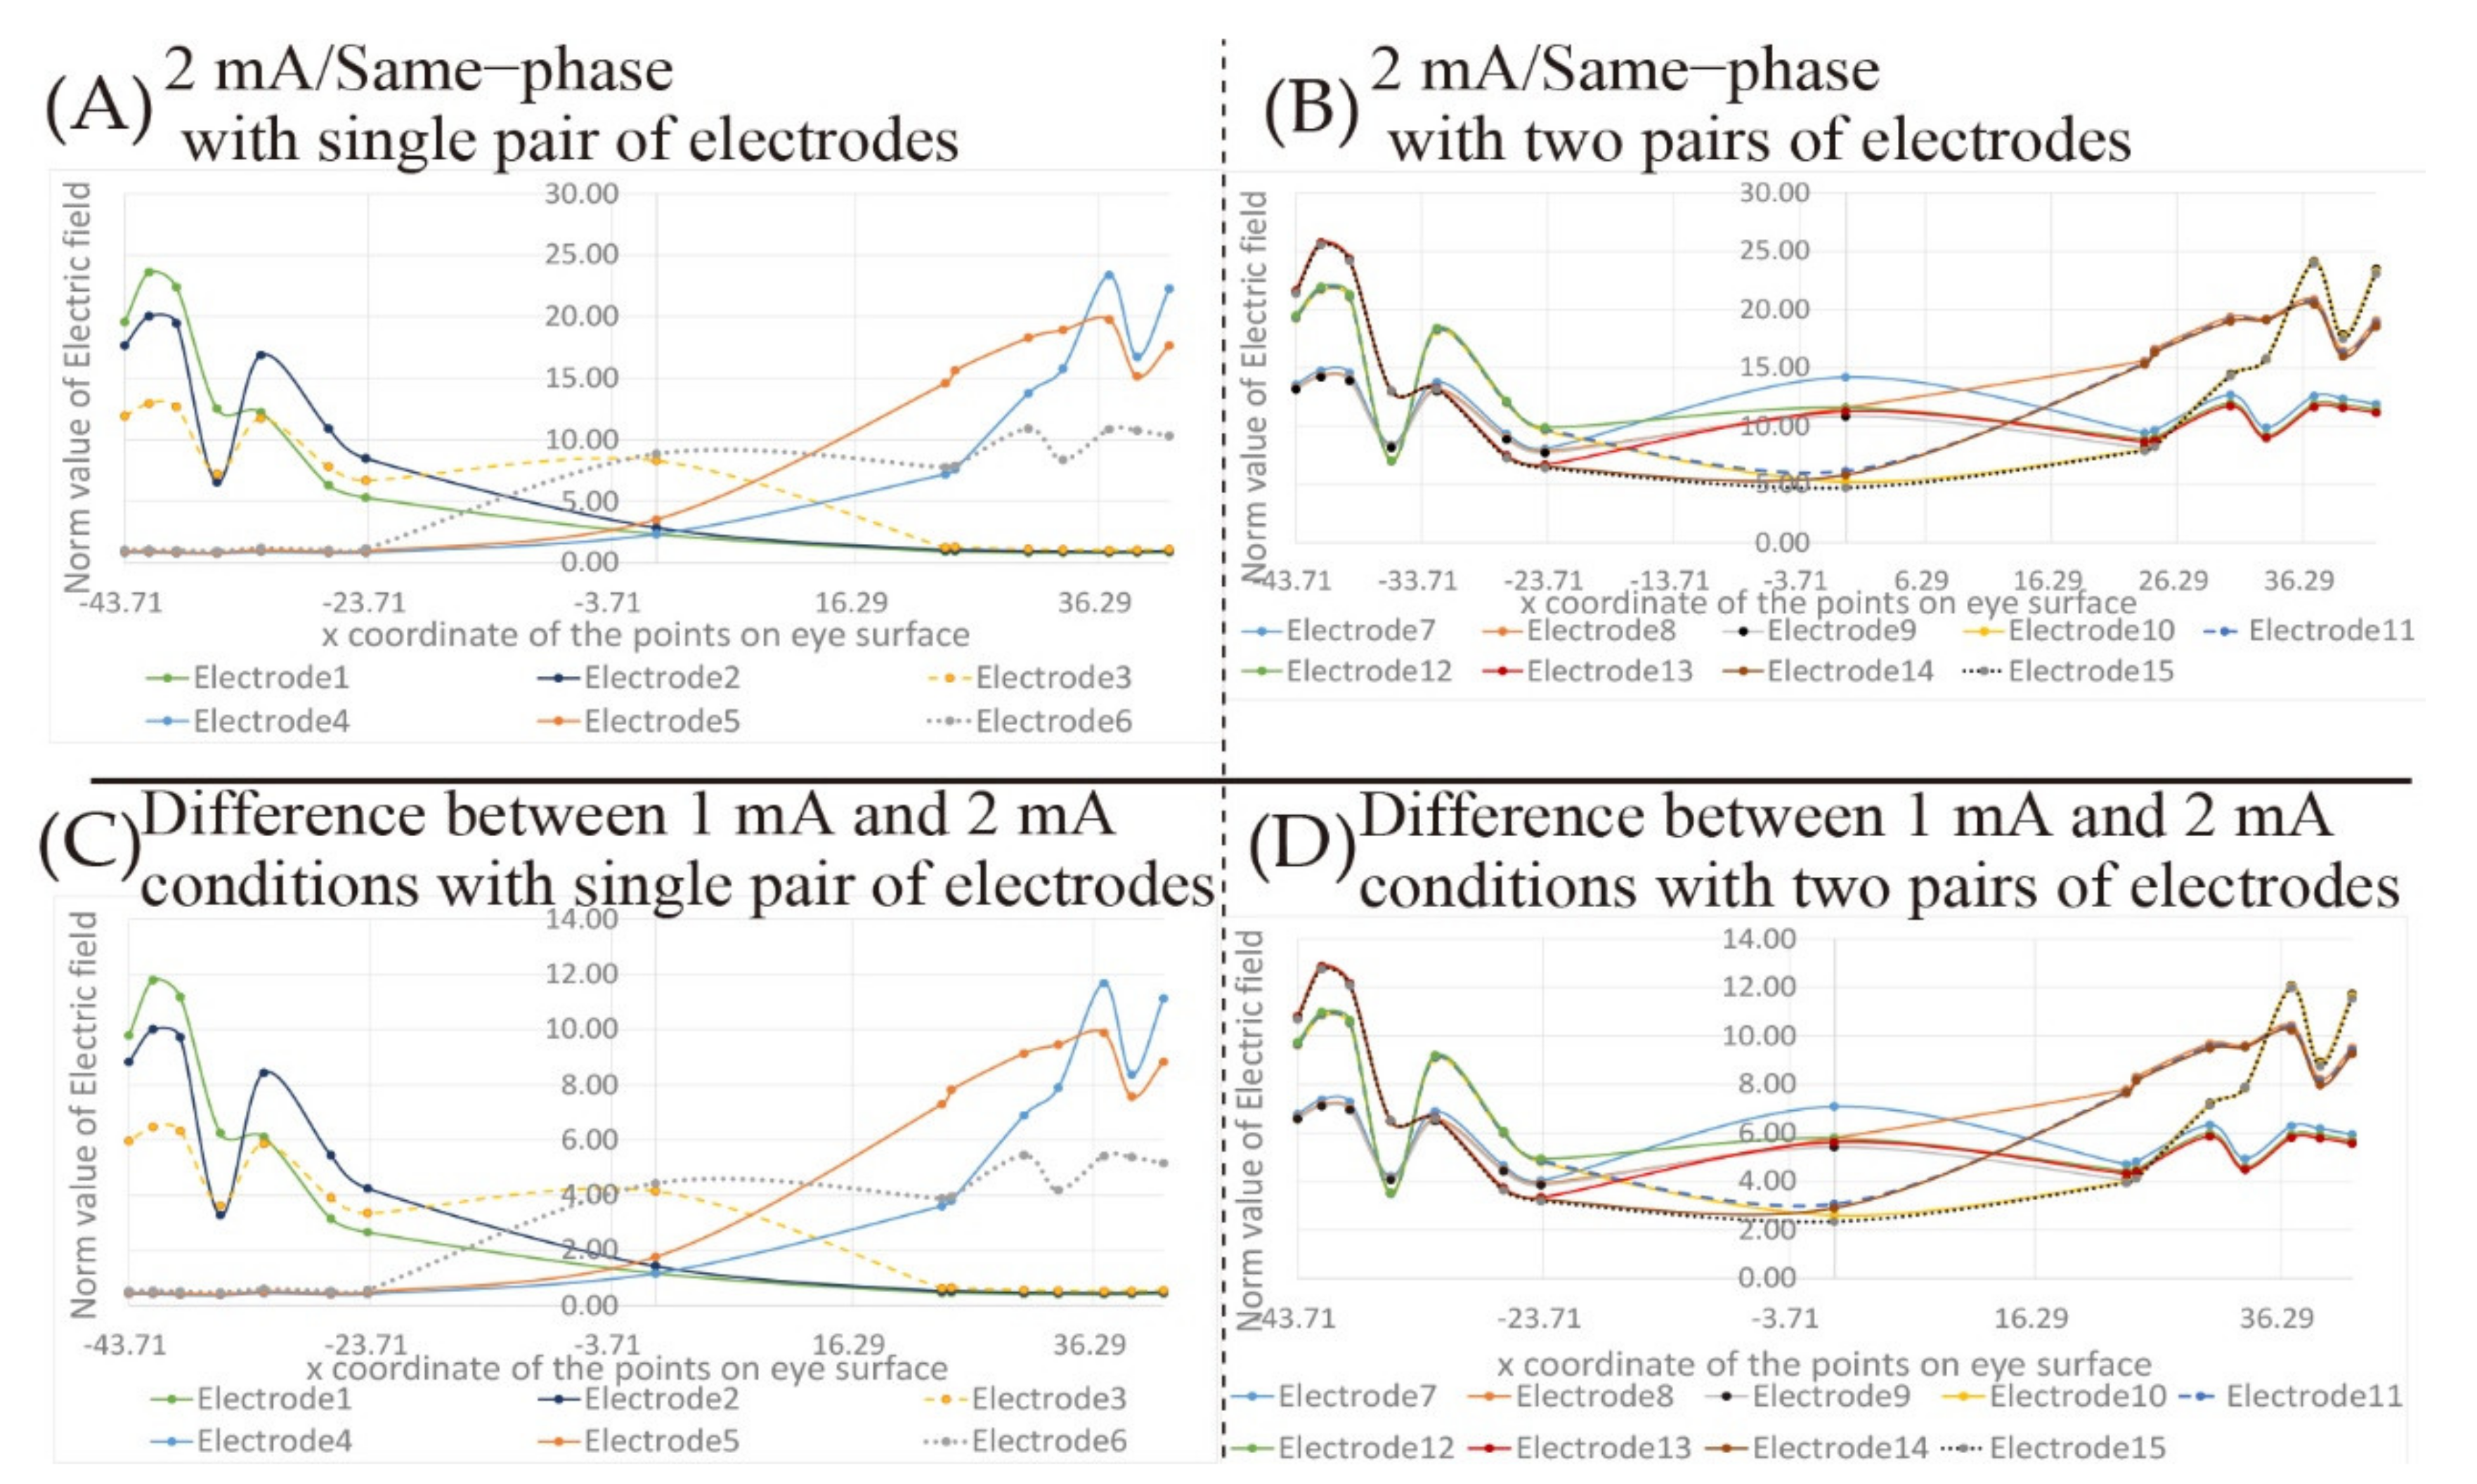
4.1. Electric Interference Due to the Distance of the Electrodes
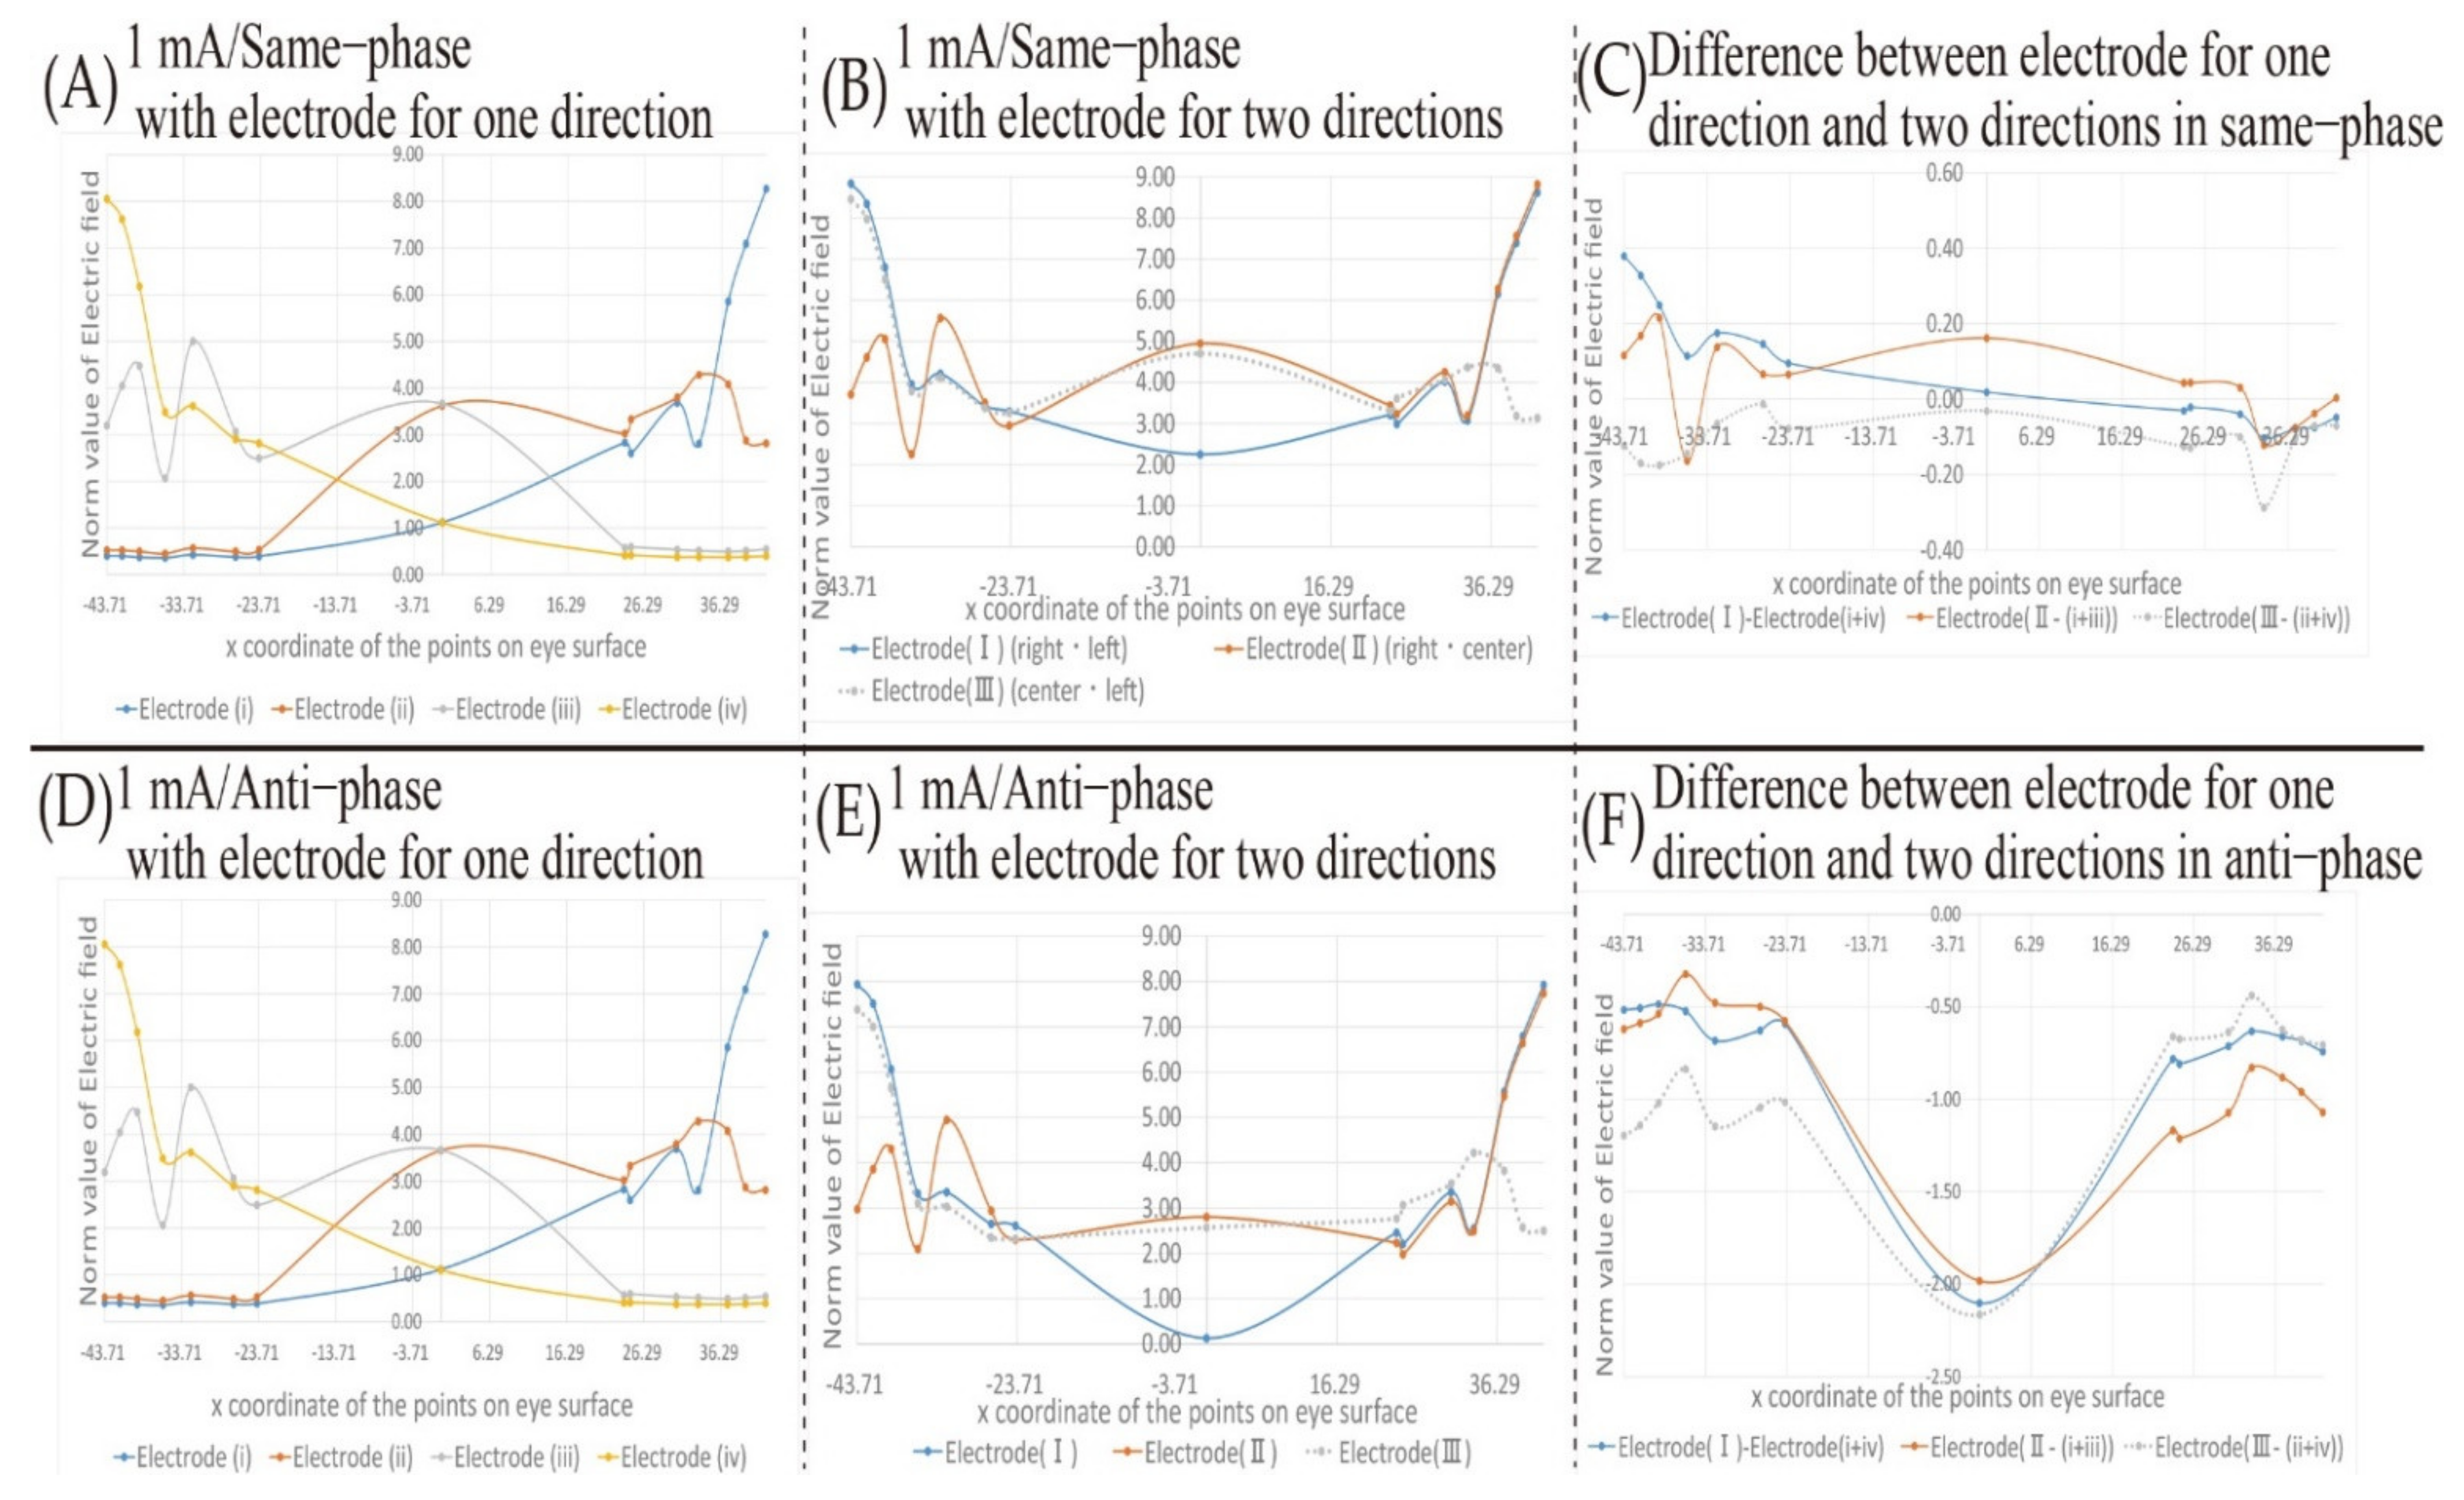
- When two pairs of electrodes’ placements are used under the same phase condition, the effect of electrical interference can be seen. However, the value does not fluctuate significantly within the region of the eyeball surface.
- When a single pair of electrodes is used under the anti-phase condition, the same result as the norm value of the electric field under the same phase condition is shown.
- When two pairs of electrodes’ placements are used under the anti-phase conditions, the electric field values near the center point between the electrodes are canceled out due to the electrical interference.
- The transition waveform and the peak position of the electric field are not changed due to the stimulation current intensity, which is irrespective of the electrode placements.
- The electric field value with 2 mA is twice that of the one with 1 mA.
- The coordinates of the peak position are not changed due to the influence of electrical interference, only the norm value of the electric field is changed.
4.2. The Effect of Electric Interference with Presenting the Phosphene at Two Directions
5. Discussion
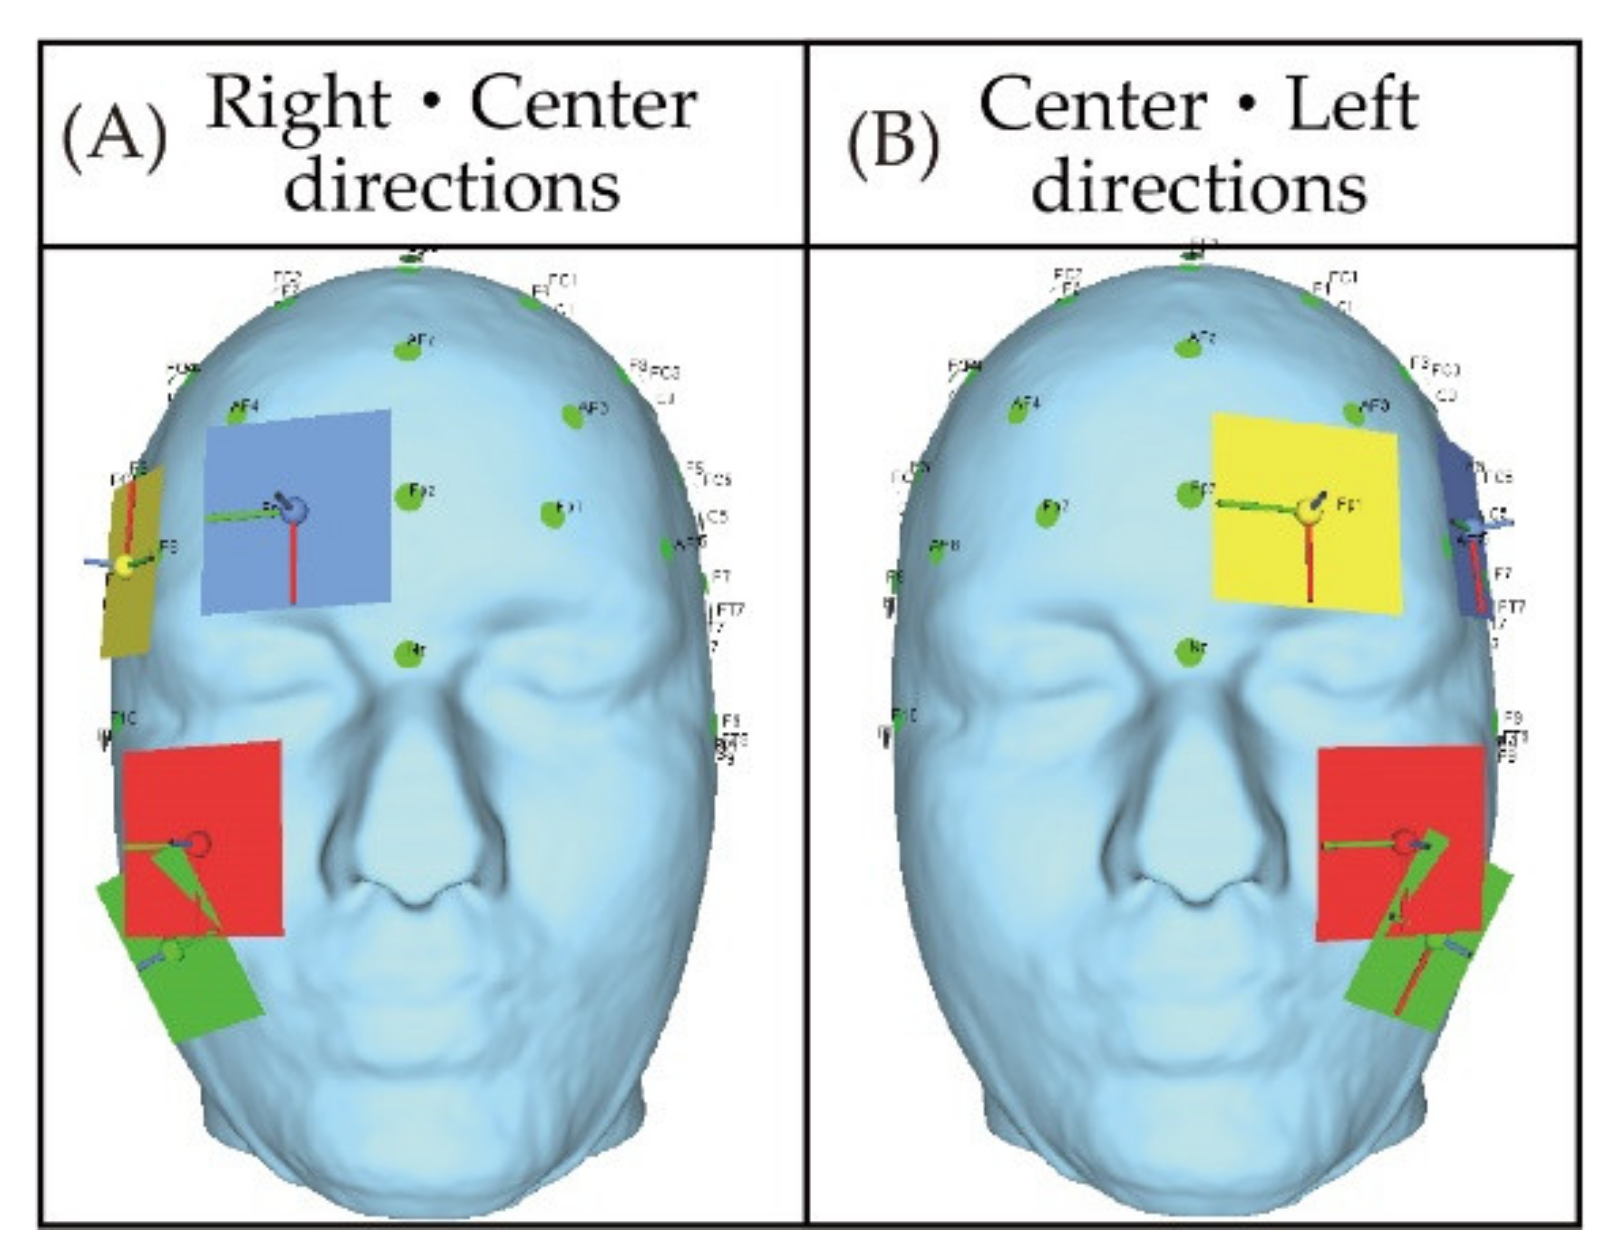
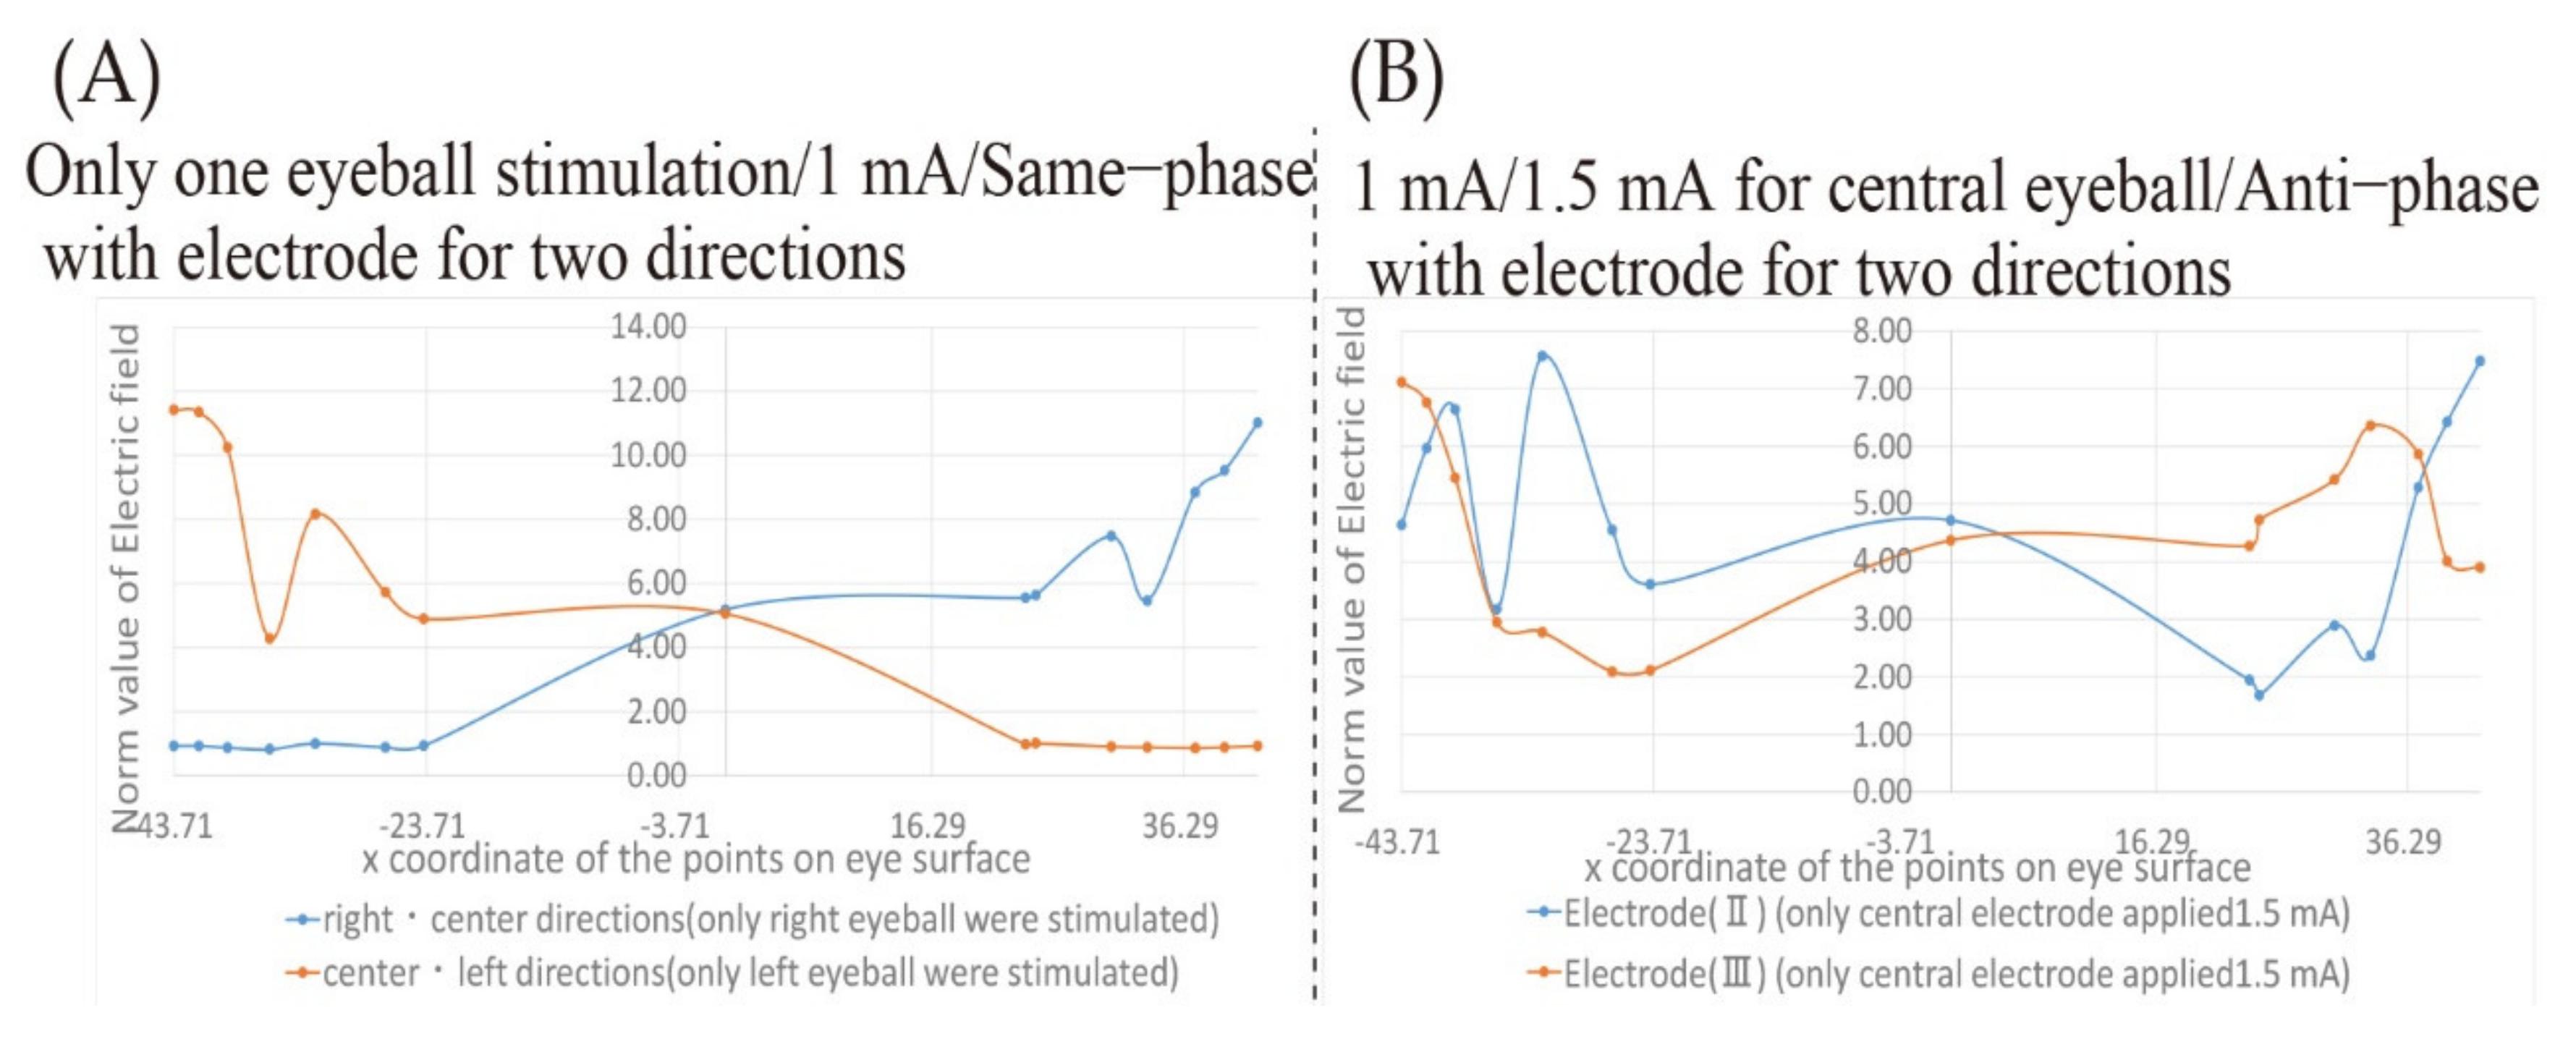
- Stimulate only the right eyeball when presenting the phosphene in the “right/center direction” and stimulate only the left eyeball when presenting the phosphene in the “center/left direction.”
- Set the stimulation current intensity of the electrode that presents the phosphene toward the center of the visual field higher than the other electrodes.
6. Conclusions
Author Contributions
Funding
Institutional Review Board Statement
Informed Consent Statement
Conflicts of Interest
References
- Cowey, A.; Walsh, V. Magnetically induced phosphenes in sighted blind and blindsighted observers. Neuroreport 2000, 11, 3269–3273. [Google Scholar] [CrossRef]
- Tanaka, S.; Watanabe, K. Transcranial direct current stimulation: A new tool for human cognitive neuroscience. Brain Nerve 2009, 61, 53–64. [Google Scholar]
- Miyauchi, S. Non-invasive study of human brain function and psychophysiology. Jpn. Psychol. Rev. 2013, 56, 414–454. (In Japanese) [Google Scholar]
- Morimoto, T.; Fukui, T.; Matsushita, K.; Okawa, Y.; Shimojyo, H.; Kusaka, S.; Tano, Y.; Fujikado, T. Evaluation of residual retinal function by pupillary constrictions and phosphenes using transcorneal electrical stimulation in patients with retinal degeneration. Graefes Arch. Clin. Exp. Ophthalmol. 2006, 244, 1283–1292. [Google Scholar] [CrossRef] [PubMed]
- Antal, A.; Boros, K.; Poreisz, C.; Chaieb, L.; Terney, D.; Paulus, W. Comparatively weak after-effects of transcranial alternating current stimulation (tACS) on cortical excitability in humans. Brain Stimul. 2008, 1, 97–105. [Google Scholar] [CrossRef]
- Matsumoto, H.; Ugawa, Y. Adverse events of tDCS and tACS A review. Clin. Neurophysiol. Pract. 2017, 2, 19–25. [Google Scholar] [CrossRef]
- Brunoni, A.R.; Amadera, J.; Berbel, B.; Volz, M.S.; Rizzerio, B.G.; Fregni, F. A systematic review on reporting and assessment of adverse effects associated with transcranial direct current stimulation. Int. J. Neuropsychopharmacol. 2011, 14, 1133–1145. [Google Scholar] [CrossRef]
- Sasaki, T. Electronics for Walking Support for Blind People. BME 1993, 7, 15–20. (In Japanese) [Google Scholar]
- Saito, M.; Kamioka, E. Navi Hat: Collision Avoidance Wearable Device for Blind People. Bachelor’s Thesis, Shibaura Institute of Technology, Tokyo, Japan, 2015. (In Japanese). [Google Scholar]
- Higuchi, D.; Aoyama, K.; Furukawa, M.; Maeda, T.; Ando, H. Position shift of phosphene and attention attraction in arbitrary direction with galvanic retina stimulation. In Proceedings of the 8th Augmented Human International Conference, Mountain View, CA, USA, 16 March 2017; Association for Computing Machinery: New York, NY, USA, 2017; Volume 10, pp. 1–6. [Google Scholar] [CrossRef]
- Laakso, I.; Hirata, A. Computational analysis shows why transcranial alternating current stimulation induces retinal phosphenes. J. Neural Eng. 2013, 10, 046009. [Google Scholar] [CrossRef]
- Bear, M.F. The central visual system. In Neuroscience: Exploring the Brain, 4th ed.; Bear, M.F., Connors, B.W., Paradiso, M.A., Eds.; Lippincott Williams & Wilkins: Philadelphia, PA, USA, 2015; pp. 336–337. [Google Scholar]
- Kanamaru, M.; Phan, X.T.; Kamioka, E. Clarification of Perceived Phosphenes Positions by tACS considering Electrical Current flow and Exposed Visual Retinae. In Proceedings of the IEEE R10 Humanitarian Technology Conference 2020 (HTC2020), Kuching, Malaysia, 1–3 December 2020; IEEE: Piscataway, NJ, USA, 2020; pp. 1–6. [Google Scholar]
- Kanamaru, M.; Phan, X.T.; Kamioka, E. Electrodes Placement Design for Controlling Perceived Phosphene Positions Based on Electric Field Simulation. Int. J. Adv. Res. Eng. Technol. 2020, 11, 1202–1214. [Google Scholar]
- Tan, J.; Wansbrough, K.; Williams, A.G.; Nitche, M.A.; Vallence, A.M.; Fujiyama, H. The importance of model-driven approaches to set stimulation intensity for multi-channel transcranial alternating current stimulation (tACS). Brain Stimul. 2020, 13, 1002–1004. [Google Scholar] [CrossRef] [PubMed]
- Lillie, E.M.; Urban, J.E.; Weaver, A.A.; Powers, A.K.; Stitzel, J.D. Estimation of skull table thickness with clinical CT and validation with microCT. J. Anat. 2015, 226, 73–80. [Google Scholar] [CrossRef] [PubMed] [Green Version]
- Saturnino, G.B.; Madsen, K.H.; Siebner, H.R.; Thielscher, A. How to target inter-regional phase synchronization with dual-site Transcranial Alternating Current Stimulation. NeuroImage 2017, 163, 68–80. [Google Scholar] [CrossRef] [PubMed] [Green Version]
- Alekseichuk, I.; Falchier, A.Y.; Linn, G.; Xu, T.; Milham, M.P.; Schroeder, C.E.; Opitz, A. Electric field dynamics in the brain during multi-electrode transcranial electric stimulation. Nat. Commun. 2019, 10, 2573. [Google Scholar] [CrossRef] [Green Version]
- Fujikado, T.; Morimoto, T.; Kanda, H.; Kusaka, S.; Nakauchi, K.; Ozawa, M.; Matsushita, K.; Sakaguchi, H.; Ikuno, Y.; Kamei, M.; et al. Evaluation of phosphenes elicited by extraocular stimulation in normals and by suprachoroidal-transretinal stimulation in patients with retinitis pigmentosa. Graefes Arch. Clin. Exp. Ophthalmol. 2007, 245, 1411–1419. [Google Scholar] [CrossRef]
- Mihashi, T.; Okawa, Y.; Miyoshi, T.; Kitaguchi, Y.; Hirohara, Y.; Fujikado, T. Comparing Retinal Refl ectance Changes Elicited by Transcorneal Electrical Retinal Stimulation with Those of Optic Chiasma Stimulation in Cats. Jpn. J. Ophthal. 2011, 55, 49–56. [Google Scholar] [CrossRef]
- Mihashi, T.; Hirohara, Y.; Kanda, H.; Okawa, Y.; Miyoshi, T.; Morimoto, T.; Fujikado, T. Retinal Intrinsic Signal to Four Different Stimuli Analyzed with Independent Component Analysis. Jpn. J. Vis. Sci. 2016, 37, 7–17. (In Japanese) [Google Scholar] [CrossRef]
- Nielsen, J.D.; Madsen, K.H.; Puonti, O.; Siebner, H.R.; Bauer, C.; Madsen, C.G.; Saturnino, G.B.; Thielscher, A. Automatic skull segmentation from MR images for realistic volume conductor models of the head: Assessment of the state-of-the-art. NeuroImage 2018, 174, 587–598. [Google Scholar] [CrossRef] [Green Version]
- Thielscher, A.; Antunes, A.; Saturnino, G.B. Field modeling for transcranial magnetic stimulation: A useful tool to understand the physiological effects of TMS. In Proceedings of the Annual International Conference of the IEEE Engineering in Medicine and Biology Society (EMBC), Milan, Italy, 25–29 August 2015; IEEE: Piscataway, NJ, USA, 2015; pp. 222–225. [Google Scholar] [CrossRef]
- Saturnino, G.B.; Puonti, O.; Nielsen, J.D.; Antonenko, D.; Madsen, K.H.; Thielscher, A. SimNIBS 2.1: A Comprehensive Pipeline for Individualized Electric Field Modelling for Transcranial Brain Stimulation. In Brain and Human Body Modeling; Makarov, S., Horner, M., Noetscher, G., Eds.; Springer: Cham, Switzerland, 2019; pp. 3–25. [Google Scholar]
- Saturnino, G.B.; Madsen, K.H.; Thielscher, A. Efficient Electric Field Simulations for Transcranial Brain Stimulation. J. Neural Eng. 2019, 16, 066032. [Google Scholar] [CrossRef]
- Fish, J.; Belytschko, T. Introduction. In A First Course in Finite Elements, 1st ed.; Wiley: Hoboken, NJ, USA, 2008; pp. 1–6. [Google Scholar]
- Gabriel, S.; Lau, R.W.; Gabriel, C. The dielectric properties of biological tissues: II. Measurements in the frequency range 10 Hz to 20 GHz. Phys. Med. Biol. 1996, 41, 2251–2269. [Google Scholar] [CrossRef] [Green Version]
- Gabriel, S.; Lau, R.W.; Gabriel, C. The dielectric properties of biological tissues: III. Parametric models for the dielectric spectrum of tissue. Phys. Med. Biol. 1996, 41, 2271–2293. [Google Scholar] [CrossRef] [PubMed] [Green Version]
- Focus V3. Available online: https;//foc.us/v3/ (accessed on 20 June 2021).
- Ienca, M.; Haselager, P.; Emanuel, E. Brain leaks and consumer neurotechnology. Nat. Biotechnol. 2018, 36, 805–810. [Google Scholar] [CrossRef] [PubMed]
- Shinomiya, K.; Iysuki, N.; Kubo, M.; Shiota, H. Analyses of the characteristics of potential and cross-talk at each electro-oculogram. J. Med. Investig. 2008, 55, 120–126. [Google Scholar] [CrossRef] [PubMed] [Green Version]


| Tissues | Electrical Conductivity |
|---|---|
| White matter | 0.027656 |
| Gray Matter | 0.027512 |
| CSF 1 | 2.0000 |
| Bone | 0.020028 |
| Head skin | 2.0000 × |
| Eye ball | 0.41113 |
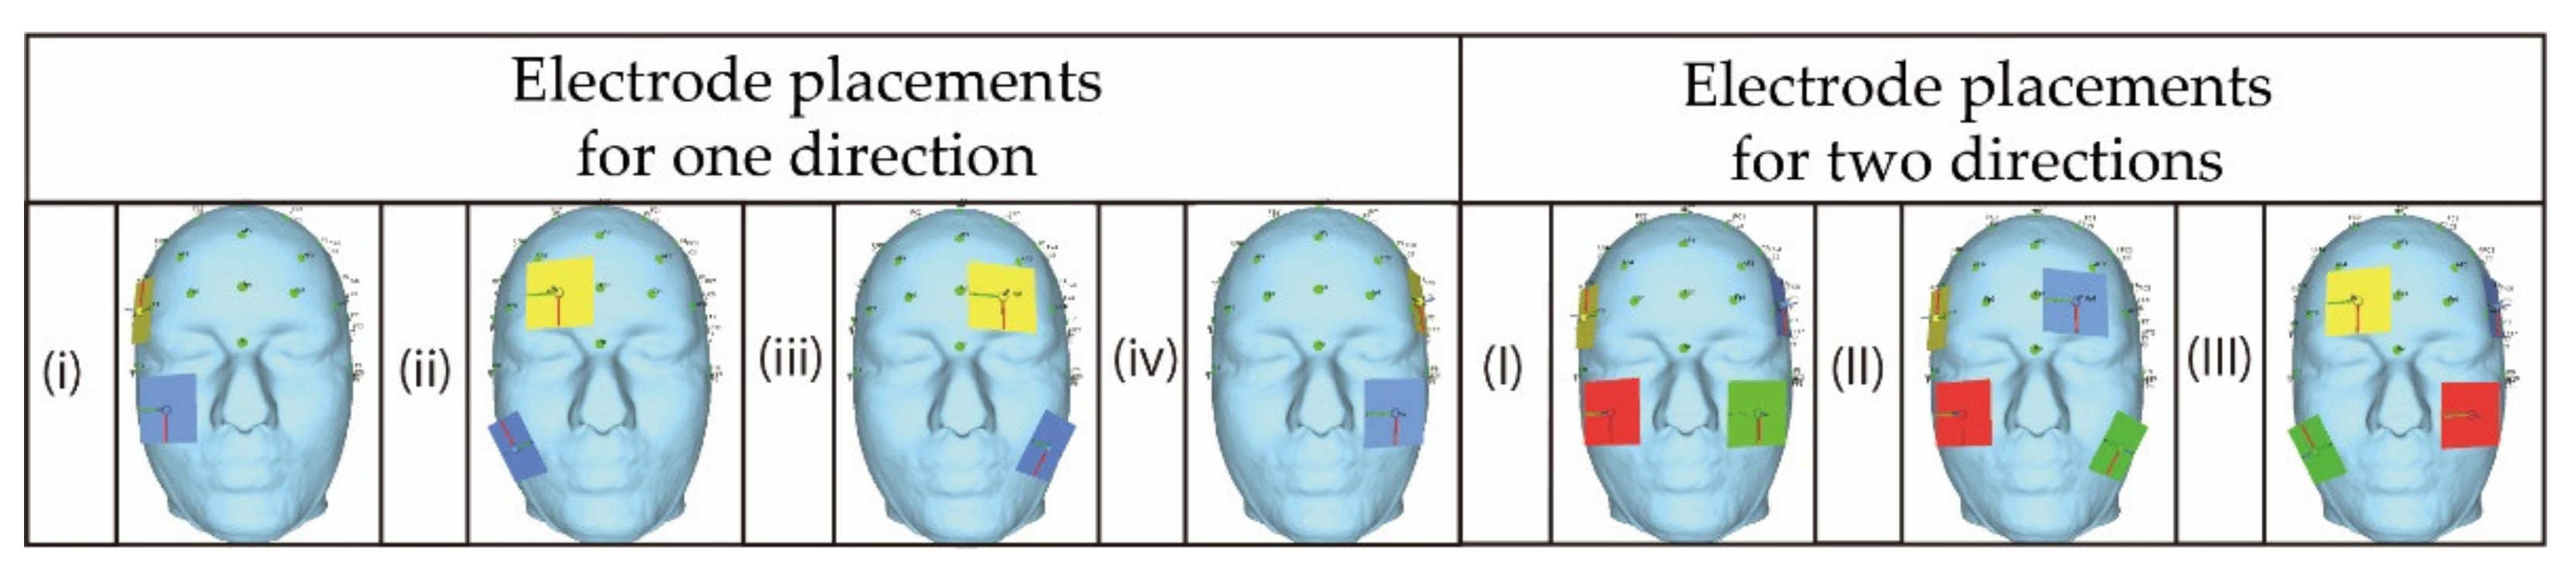
| Electrode Placement | The Potential Position of the Phosphene in the Visual Field |
|---|---|
| i | Right hand of the visual field |
| ii | Central visual field |
| iii | Central visual field |
| iv | Left hand of the visual field |
| I | Right and left hand of the visual field |
| II | Right and center of the visual field |
| III | Center and left of the visual field |
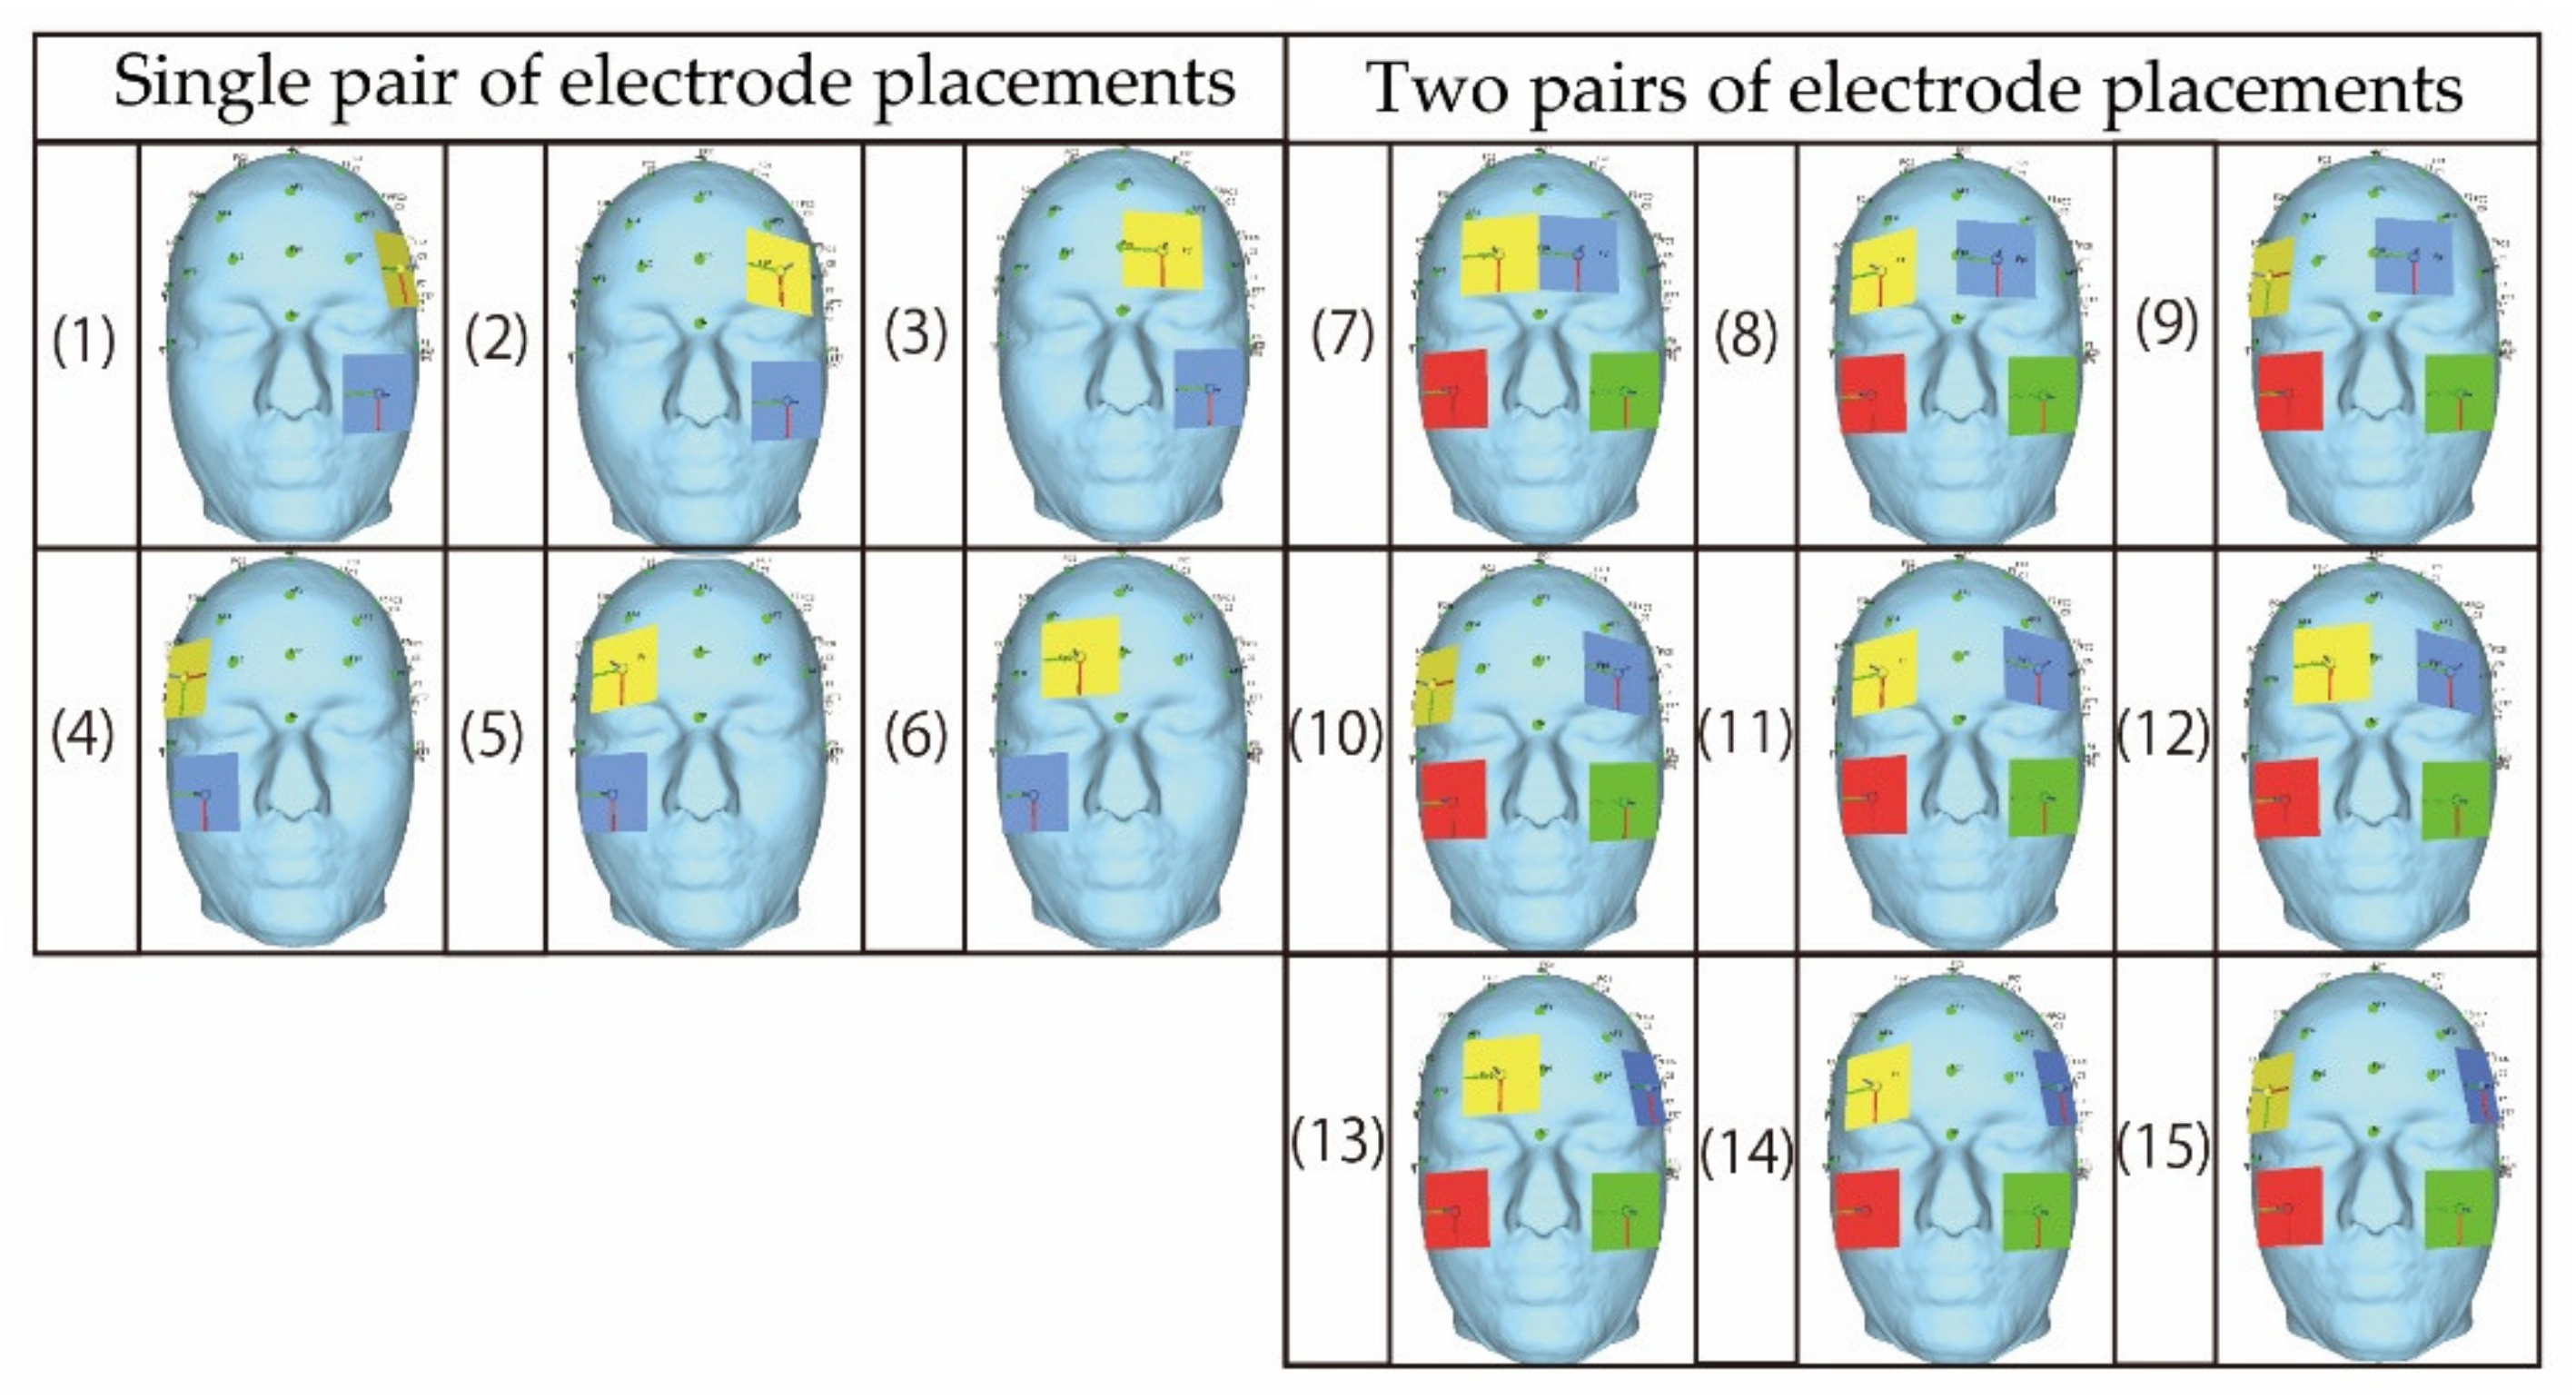
| Electrode Placement | Coordinate of the Electrode on the Forehead | Coordinate of the Electrode on the Cheek | Coordinate of the Electrode on the Other Forehead | Coordinate of the Electrode on the Other Cheek |
|---|---|---|---|---|
| 1 | (−56.65, 68.06, 31.40) | (−45.91, 77.21, −35.86) | - | - |
| 2 | (−41.17, 81.53, 31.84) | (−45.91, 77.21, −35.86) | - | - |
| 3 | (−20.83, 88.39, 35.82) | (−45.91, 77.21, −35.86) | - | - |
| 4 | (55.27, 69.06, 27.18) | (44.43, 76.69, −36.22) | - | - |
| 5 | (37.57, 83.32, 30.48) | (44.43, 76.69, −36.22) | - | - |
| 6 | (19.97, 89.36, 35.38) | (44.43, 76.69, −36.22) | - | - |
| 7 | (19.97, 89.36, 35.38) | (44.43, 76.69, −36.22) | (−20.83, 88.39, 35.82) | (−45.91, 77.21, −35.86) |
| 8 | (37.57, 83.32, 30.48) | (44.43, 76.69, −36.22) | (−20.83, 88.39, 35.82) | (−45.91, 77.21, −35.86) |
| 9 | (55.27, 69.06, 27.18) | (44.43, 76.69, −36.22) | (−20.83, 88.39, 35.82) | (−45.91, 77.21, −35.86) |
| 10 | (55.27, 69.06, 27.18) | (44.43, 76.69, −36.22) | (−41.17, 81.53, 31.84) | (−45.91, 77.21, −35.86) |
| 11 | (37.57, 83.32, 30.48) | (44.43, 76.69, −36.22) | (−41.17, 81.53, 31.84) | (−45.91, 77.21, −35.86) |
| 12 | (19.97, 89.36, 35.38) | (44.43, 76.69, −36.22) | (−41.17, 81.53, 31.84) | (−45.91, 77.21, −35.86) |
| 13 | (19.97, 89.36, 35.38) | (44.43, 76.69, −36.22) | (−56.65, 68.06, 31.40) | (−45.91, 77.21, −35.86) |
| 14 | (37.57, 83.32, 30.48) | (44.43, 76.69, −36.22) | (−56.65, 68.06, 31.40) | (−45.91, 77.21, −35.86) |
| 15 | (55.27, 69.06, 27.18) | (44.43, 76.69, −36.22) | (−56.65, 68.06, 31.40) | (−45.91, 77.21, −35.86) |
| Electrode Placement | Coordinate of the Electrode on the Forehead | Coordinate of the Electrode on the Cheek | Coordinate of the Electrode on the Other Forehead | Coordinate of the Electrode on the Other Cheek |
|---|---|---|---|---|
| i | (62.68, 57.05, 27.99) | (44.43, 76.69, −36.22) | - | - |
| ii | (23.16, 88.73, 34.62) | (51.05, 66.06, −59.22) | - | - |
| iii | (−24.47, 88.32, 33.67) | (−53.77, 65.46, −56.93) | - | - |
| iv | (−64.06, 54.13, 28.95) | (−45.91, 77.21, −35.86) | - | - |
| I | (62.68, 57.05, 27.99) | (44.43, 76.69, −36.22) | (−64.06, 54.13, 28.95) | (−45.91, 77.21, −35.86) |
| II | (62.68, 57.05, 27.99) | (44.43, 76.69, −36.22) | (−24.47, 88.32, 33.67) | (−53.77, 65.46, −56.93) |
| III | (23.16, 88.73, 34.62) | (51.05, 66.06, −59.22) | (−64.06, 54.13, 28.95) | (−45.91, 77.21, −35.86) |
| Point on the Eyeball Surface | Coordinate of Each Point |
|---|---|
| Point 1 | (42.09, 67.86, 3.46) |
| Point 2 | (39.46, 69.97, 4.62) |
| Point 3 | (37.15, 70.94, 7.02) |
| Point 4 | (33.36, 70.69, 10.94) |
| Point 5 | (30.51, 71.00, 6.57) |
| Point 6 | (24.51, 70.50, 7.92) |
| Point 7 | (23.71, 70.62, 6.51) |
| Point 8 | (−0.05, 87.00, 4.83) |
| Point 9 | (−23.92, 67.85, 3.6) |
| Point 10 | (−26.97, 69.96, 6.29) |
| Point 11 | (−32.52, 71.87, 8.17) |
| Point 12 | (−36.13, 70.88, 10.3) |
| Point 13 | (−39.46, 71.41, 3.32) |
| Point 14 | (−41.73, 70.19, 2.63) |
| Point 15 | (−43.71, 67.36, 2.24) |
| Phosphene Presentation Position | Appropriate Electrode Placement | Current Intensity | Phase Condition |
|---|---|---|---|
| right/left direction | Electrode (I), which stimulates temporal side of both eyeballs | 1 mA | Anti-phase |
| right/center direction | The electrode placements which stimulate only the right eyeball | 1 mA | Same-phase |
| The electrode placements which stimulate the temporal side of the right eyeball and the vicinity of the center of the left eyeball surface | Vicinity of the center: 1.5 mA Temporal side: 1 mA | Anti-phase | |
| center/left direction | The electrode placements which stimulate only the left eyeball | 1 mA | Same-phase |
| The electrode placements which stimulate the temporal side of the left eyeball and the vicinity of the center of the right eyeball surface | Vicinity of the center: 1.5 mA Temporal side: 1 mA | Anti-phase |
Publisher’s Note: MDPI stays neutral with regard to jurisdictional claims in published maps and institutional affiliations. |
© 2021 by the authors. Licensee MDPI, Basel, Switzerland. This article is an open access article distributed under the terms and conditions of the Creative Commons Attribution (CC BY) license (https://creativecommons.org/licenses/by/4.0/).
Share and Cite
Kanamaru, M.; Tan, P.X.; Kamioka, E. Simulation-Based Clarification of Appropriate Factors for Presenting Phosphene in Two Directions Avoiding Electrical Interference. Bioengineering 2021, 8, 111. https://doi.org/10.3390/bioengineering8080111
Kanamaru M, Tan PX, Kamioka E. Simulation-Based Clarification of Appropriate Factors for Presenting Phosphene in Two Directions Avoiding Electrical Interference. Bioengineering. 2021; 8(8):111. https://doi.org/10.3390/bioengineering8080111
Chicago/Turabian StyleKanamaru, Manami, Phan Xuan Tan, and Eiji Kamioka. 2021. "Simulation-Based Clarification of Appropriate Factors for Presenting Phosphene in Two Directions Avoiding Electrical Interference" Bioengineering 8, no. 8: 111. https://doi.org/10.3390/bioengineering8080111