
Deciphering Metabolic Pathways in High-Seeding-Density Fed-Batch Processes for Monoclonal Antibody Production: A Computational Modeling Perspective

Abstract
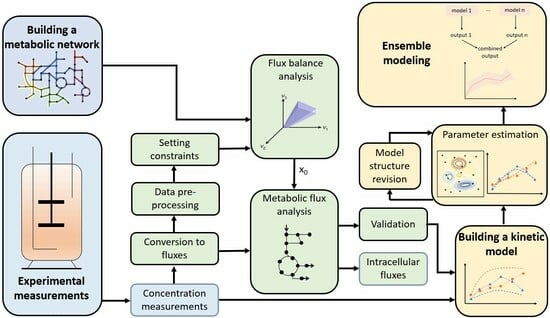
:
1. Introduction
2. Materials and Methods
2.1. Cell Line, Cultivation, and Analytics
2.2. Model Reconstruction and Analysis
3. Results
3.1. Flux Balance Analysis—Effect of Supplements on the Metabolism
3.1.1. Extracellular Fluxes
3.1.2. Intracellular Fluxes
3.2. Ensemble Model Calibration
3.3. Room for Improvement—The Lactate Shift
3.4. Effect of Changing Media Composition on the Metabolism of CHO Cells
4. Discussion
5. Conclusions
Supplementary Materials
Author Contributions
Funding
Institutional Review Board Statement
Informed Consent Statement
Data Availability Statement
Acknowledgments
Conflicts of Interest
References
- Arora, P.; Singh, V.; Kumar, A. Mammalian Cell Culture: An Edge to Biopharmaceutical Industry. In Biomanufacturing for Sustainable Production of Biomolecules; Singh, V., Show, P.L., Eds.; Springer Nature: Singapore, 2023; pp. 297–313. ISBN 978-981-19791-0-1. [Google Scholar]
- Huebbers, J.W.; Buyel, J.F. On the Verge of the Market–Plant Factories for the Automated and Standardized Production of Biopharmaceuticals. Biotechnol. Adv. 2021, 46, 107681. [Google Scholar] [CrossRef]
- Pan, X.; Dalm, C.; Wijffels, R.H.; Martens, D.E. Metabolic Characterization of a CHO Cell Size Increase Phase in Fed-Batch Cultures. Appl. Microbiol. Biotechnol. 2017, 101, 8101–8113. [Google Scholar] [CrossRef]
- Handlogten, M.W.; Lee-O’Brien, A.; Roy, G.; Levitskaya, S.V.; Venkat, R.; Singh, S.; Ahuja, S. Intracellular Response to Process Optimization and Impact on Productivity and Product Aggregates for a High-Titer CHO Cell Process. Biotechnol. Bioeng. 2018, 115, 126–138. [Google Scholar] [CrossRef] [PubMed]
- Huang, Y.-M.; Hu, W.; Rustandi, E.; Chang, K.; Yusuf-Makagiansar, H.; Ryll, T. Maximizing Productivity of CHO Cell-Based Fed-Batch Culture Using Chemically Defined Media Conditions and Typical Manufacturing Equipment. Biotechnol. Prog. 2010, 26, 1400–1410. [Google Scholar] [CrossRef]
- Xu, J.; Rehmann, M.S.; Xu, M.; Zheng, S.; Hill, C.; He, Q.; Borys, M.C.; Li, Z.J. Development of an Intensified Fed-Batch Production Platform with Doubled Titers Using N-1 Perfusion Seed for Cell Culture Manufacturing. Bioresour. Bioprocess. 2020, 7, 17. [Google Scholar] [CrossRef]
- Ramos, J.R.C.; Rath, A.G.; Genzel, Y.; Sandig, V.; Reichl, U. A Dynamic Model Linking Cell Growth to Intracellular Metabolism and Extracellular By-product Accumulation. Biotechnol. Bioeng. 2020, 117, 1533–1553. [Google Scholar] [CrossRef] [PubMed]
- Stepper, L.; Filser, F.A.; Fischer, S.; Schaub, J.; Gorr, I.; Voges, R. Pre-Stage Perfusion and Ultra-High Seeding Cell Density in CHO Fed-Batch Culture: A Case Study for Process Intensification Guided by Systems Biotechnology. Bioprocess Biosyst. Eng. 2020, 43, 1431–1443. [Google Scholar] [CrossRef]
- Legmann, R.; Schreyer, H.B.; Combs, R.G.; McCormick, E.L.; Russo, A.P.; Rodgers, S.T. A Predictive High-Throughput Scale-down Model of Monoclonal Antibody Production in CHO Cells. Biotechnol. Bioeng. 2009, 104, 1107–1120. [Google Scholar] [CrossRef] [PubMed]
- Nolan, R.P.; Lee, K. Dynamic Model of CHO Cell Metabolism. Metab. Eng. 2011, 13, 108–124. [Google Scholar] [CrossRef]
- Hefzi, H.; Ang, K.S.; Hanscho, M.; Bordbar, A.; Ruckerbauer, D.; Lakshmanan, M.; Orellana, C.A.; Baycin-Hizal, D.; Huang, Y.; Ley, D.; et al. A Consensus Genome-Scale Reconstruction of Chinese Hamster Ovary Cell Metabolism. Cell Syst. 2016, 3, 434–443.e8. [Google Scholar] [CrossRef]
- Robitaille, J.; Chen, J.; Jolicoeur, M. A Single Dynamic Metabolic Model Can Describe mAb Producing CHO Cell Batch and Fed-Batch Cultures on Different Culture Media. PLoS ONE 2015, 10, e0136815. [Google Scholar] [CrossRef] [PubMed]
- Huang, Z.; Lee, D.-Y.; Yoon, S. Quantitative Intracellular Flux Modeling and Applications in Biotherapeutic Development and Production Using CHO Cell Cultures. Biotechnol. Bioeng. 2017, 114, 2717–2728. [Google Scholar] [CrossRef] [PubMed]
- Xing, Z.; Nguyen, T.B.; Kanai-Bai, G.; Yamano-Adachi, N.; Omasa, T. Construction of a Novel Kinetic Model for the Production Process of a CVA6 VLP Vaccine in CHO Cells. Cytotechnology 2024, 76, 69–83. [Google Scholar] [CrossRef] [PubMed]
- Monteiro, M.; Kontoravdi, C. Hybrid Dynamic Model of Monoclonal Antibody Production Using CHO Cells. In Computer Aided Chemical Engineering; Elsevier: Amsterdam, The Netherlands, 2023; Volume 52, pp. 375–380. ISBN 978-0-443-15274-0. [Google Scholar]
- Okamura, K.; Badr, S.; Murakami, S.; Sugiyama, H. Hybrid Modeling of CHO Cell Cultivation in Monoclonal Antibody Production with an Impurity Generation Module. Ind. Eng. Chem. Res. 2022, 61, 14898–14909. [Google Scholar] [CrossRef]
- Brunner, M.; Kolb, K.; Keitel, A.; Stiefel, F.; Wucherpfennig, T.; Bechmann, J.; Unsoeld, A.; Schaub, J. Application of Metabolic Modeling for Targeted Optimization of High Seeding Density Processes. Biotechnol. Bioeng. 2021, 118, 1793–1804. [Google Scholar] [CrossRef] [PubMed]
- Hartley, F.; Walker, T.; Chung, V.; Morten, K. Mechanisms driving the lactate switch in Chinese hamster ovary cells. Biotechnol. Bioeng. 2018, 115, 1890–1903. [Google Scholar] [CrossRef] [PubMed]
- Luo, Y.; Lovelett, R.J.; Price, J.V.; Radhakrishnan, D.; Barnthouse, K.; Hu, P.; Schaefer, E.; Cunningham, J.; Lee, K.H.; Shivappa, R.B.; et al. Modeling the Effect of Amino Acids and Copper on Monoclonal Antibody Productivity and Glycosylation: A Modular Approach. Biotechnol. J. 2021, 16, 2000261. [Google Scholar] [CrossRef] [PubMed]
- Pan, X.; Streefland, M.; Dalm, C.; Wijffels, R.H.; Martens, D.E. Selection of Chemically Defined Media for CHO Cell Fed-Batch Culture Processes. Cytotechnology 2017, 69, 39–56. [Google Scholar] [CrossRef] [PubMed]
- Zamorano, F.; Vande Wouwer, A.; Jungers, R.M.; Bastin, G. Dynamic Metabolic Models of CHO Cell Cultures through Minimal Sets of Elementary Flux Modes. J. Biotechnol. 2013, 164, 409–422. [Google Scholar] [CrossRef]
- Gašperšič, J.; Kastelic, M.; Novak, U.; Likozar, B. Metabolic Network Modelling of Chinese Hamster Ovary (CHO) Culture Bioreactors Operated as Microbial Cell Factories. Acta Chim. Slov. 2018, 65, 769–786. [Google Scholar] [CrossRef]
- Krumm, T.L.; Ehsani, A.; Schaub, J.; Stiefel, F. An Investigation into the Metabolic Differences between Conventional and High Seeding Density Fed-Batch Cell Cultures by Applying a Segmented Modeling Approach. Processes 2023, 11, 1094. [Google Scholar] [CrossRef]
- Mohabbat, T.; Drew, B. Simultaneous Determination of 33 Amino Acids and Dipeptides in Spent Cell Culture Media by Gas Chromatography-Flame Ionization Detection Following Liquid and Solid Phase Extraction. J. Chromatogr. B 2008, 862, 86–92. [Google Scholar] [CrossRef] [PubMed]
- Schaub, J.; Clemens, C.; Kaufmann, H.; Schulz, T.W. Advancing Biopharmaceutical Process Development by System-Level Data. In Genomics and Systems Biology of Mammalian Cell Culture; Hu, W.S., Zeng, A.-P., Eds.; Springer: Berlin/Heidelberg, Germany, 2011; pp. 133–163. ISBN 978-3-642-28349-9. [Google Scholar]
- Hagrot, E.; Oddsdóttir, H.Æ.; Mäkinen, M.; Forsgren, A.; Chotteau, V. Novel Column Generation-Based Optimization Approach for Poly-Pathway Kinetic Model Applied to CHO Cell Culture. Metab. Eng. Commun. 2019, 8, e00083. [Google Scholar] [CrossRef] [PubMed]
- Zamorano Riveros, F. Metabolic Flux Analysis of CHO Cell Cultures. Ph.D. Thesis, University of Mons, Mons, Belgium, 2012. [Google Scholar]
- Kanehisa, M.; Furumichi, M.; Sato, Y.; Ishiguro-Watanabe, M.; Tanabe, M. KEGG: Integrating Viruses and Cellular Organisms. Nucleic Acids Res. 2021, 49, D545–D551. [Google Scholar] [CrossRef] [PubMed]
- Bairoch, A. The ENZYME Database in 2000. Nucleic Acids Res. 2000, 28, 304–305. [Google Scholar] [CrossRef] [PubMed]
- Kim, S.; Chen, J.; Cheng, T.; Gindulyte, A.; He, J.; He, S.; Li, Q.; Shoemaker, B.A.; Thiessen, P.A.; Yu, B.; et al. PubChem 2019 Update: Improved Access to Chemical Data. Nucleic Acids Res. 2019, 47, D1102–D1109. [Google Scholar] [CrossRef] [PubMed]
- Cleveland, W.S. LOWESS: A Program for Smoothing Scatterplots by Robust Locally Weighted Regression. Am. Stat. 1981, 35, 54. [Google Scholar] [CrossRef]
- Chen, N.; Bennett, M.H.; Kontoravdi, C. Analysis of Chinese Hamster Ovary Cell Metabolism through a Combined Computational and Experimental Approach. Cytotechnology 2014, 66, 945–966. [Google Scholar] [CrossRef]
- Kontoravdi, C.; Asprey, S.P.; Pistikopoulos, E.N.; Mantalaris, A. Application of Global Sensitivity Analysis to Determine Goals for Design of Experiments: An Example Study on Antibody-Producing Cell Cultures. Biotechnol. Prog. 2008, 21, 1128–1135. [Google Scholar] [CrossRef]
- Schalk, A.M.; Lavie, A. Structural and Kinetic Characterization of Guinea Pig L-Asparaginase Type III. Biochemistry 2014, 53, 2318–2328. [Google Scholar] [CrossRef]
- Rakhmanova, T.I.; Popova, T.N. Regulation of 2-Oxoglutarate Metabolism in Rat Liver by NADP-Isocitrate Dehydrogenase and Aspartate Aminotransferase. Biochemistry 2006, 71, 211–217. [Google Scholar] [CrossRef]
- Kido, R. [35] Pancreatic Branched-Chain-Amino-Acid Aminotransferase. In Methods in Enzymology; Elsevier: Amsterdam, The Netherlands, 1988; Volume 166, pp. 275–281. ISBN 978-0-12-182067-1. [Google Scholar]
- Schadewaldt, P.; Adelmeyer, F. Coupled Enzymatic Assay for Estimation of Branched-Chainl-Amino Acid Aminotransferase Activity with 2-Oxo Acid Substrates. Anal. Biochem. 1996, 238, 65–71. [Google Scholar] [CrossRef] [PubMed]
- Kashii, T.; Gomi, T.; Oya, T.; Ishii, Y.; Oda, H.; Maruyama, M.; Kobayashi, M.; Masuda, T.; Yamazaki, M.; Nagata, T.; et al. Some Biochemical and Histochemical Properties of Human Liver Serine Dehydratase. Int. J. Biochem. Cell Biol. 2005, 37, 574–589. [Google Scholar] [CrossRef] [PubMed]
- Egea, J.A.; Henriques, D.; Cokelaer, T.; Villaverde, A.F.; MacNamara, A.; Danciu, D.-P.; Banga, J.R.; Saez-Rodriguez, J. MEIGO: An Open-Source Software Suite Based on Metaheuristics for Global Optimization in Systems Biology and Bioinformatics. BMC Bioinform. 2014, 15, 136. [Google Scholar] [CrossRef] [PubMed]
- Akaike, H. Information Theory and an Extension of the Maximum Likelihood Principle. In Proceedings of the 2nd International Symposium on Information Theory, Tsahkadsor, Armenia, 2–8 September 1971; Akademiai Kiado: Budapest, Hungary, 1973; pp. 267–281. [Google Scholar]
- Zamora-Sillero, E.; Hafner, M.; Ibig, A.; Stelling, J.; Wagner, A. Efficient Characterization of High-Dimensional Parameter Spaces for Systems Biology. BMC Syst. Biol. 2011, 5, 142. [Google Scholar] [CrossRef] [PubMed]
- Li, J.; Wong, C.L.; Vijayasankaran, N.; Hudson, T.; Amanullah, A. Feeding Lactate for CHO Cell Culture Processes: Impact on Culture Metabolism and Performance. Biotechnol. Bioeng. 2012, 109, 1173–1186. [Google Scholar] [CrossRef] [PubMed]
- Wilkens, C.A.; Altamirano, C.; Gerdtzen, Z.P. Comparative Metabolic Analysis of Lactate for CHO Cells in Glucose and Galactose. Biotechnol. Bioprocess Eng. 2011, 16, 714–724. [Google Scholar] [CrossRef]
- Mulukutla, B.C.; Gramer, M.; Hu, W.-S. On Metabolic Shift to Lactate Consumption in Fed-Batch Culture of Mammalian Cells. Metab. Eng. 2012, 14, 138–149. [Google Scholar] [CrossRef] [PubMed]
- Brunner, M.; Doppler, P.; Klein, T.; Herwig, C.; Fricke, J. Elevated pCO 2 Affects the Lactate Metabolic Shift in CHO Cell Culture Processes. Eng. Life Sci. 2018, 18, 204–214. [Google Scholar] [CrossRef]
- Hong, J.K.; Nargund, S.; Lakshmanan, M.; Kyriakopoulos, S.; Kim, D.Y.; Ang, K.S.; Leong, D.; Yang, Y.; Lee, D.-Y. Comparative Phenotypic Analysis of CHO Clones and Culture Media for Lactate Shift. J. Biotechnol. 2018, 283, 97–104. [Google Scholar] [CrossRef]
- Young, J.D. Metabolic Flux Rewiring in Mammalian Cell Cultures. Curr. Opin. Biotechnol. 2013, 24, 1108–1115. [Google Scholar] [CrossRef] [PubMed]
- Warburg, O. On the Origin of Cancer Cells. Science 1956, 123, 309–314. [Google Scholar] [CrossRef] [PubMed]
- Martínez, V.S.; Dietmair, S.; Quek, L.-E.; Hodson, M.P.; Gray, P.; Nielsen, L.K. Flux Balance Analysis of CHO Cells before and after a Metabolic Switch from Lactate Production to Consumption. Biotechnol. Bioeng. 2013, 110, 660–666. [Google Scholar] [CrossRef] [PubMed]
- Wahrheit, J. Metabolic Dynamics and Compartmentation in the Central Metabolism of Chinese Hamster Ovary Cells. Ph.D. Thesis, der Universität des Saarlandes, Saarbrücken, Germany, 2014. [Google Scholar] [CrossRef]
- Glacken, M.W.; Fleischaker, R.J.; Sinskey, A.J. Reduction of Waste Product Excretion via Nutrient Control: Possible Strategies for Maximizing Product and Cell Yields on Serum in Cultures of Mammalian Cells. Biotechnol. Bioeng. 1986, 28, 1376–1389. [Google Scholar] [CrossRef] [PubMed]
- Simon, L.; Karim, M.N. Control of Starvation-Induced Apoptosis in Chinese Hamster Ovary Cell Cultures. Biotechnol. Bioeng. 2002, 78, 645–657. [Google Scholar] [CrossRef] [PubMed]
- Wahrheit, J.; Niklas, J.; Heinzle, E. Metabolic Control at the Cytosol–Mitochondria Interface in Different Growth Phases of CHO Cells. Metab. Eng. 2014, 23, 9–21. [Google Scholar] [CrossRef] [PubMed]
- Galleguillos, S.N.; Ruckerbauer, D.; Gerstl, M.P.; Borth, N.; Hanscho, M.; Zanghellini, J. What Can Mathematical Modelling Say about CHO Metabolism and Protein Glycosylation? Comput. Struct. Biotechnol. J. 2017, 15, 212–221. [Google Scholar] [CrossRef] [PubMed]
- Mulcahy, P.; O’Flaherty, M.; Jennings, L.; Griffin, T. Application of Kinetic-Based Biospecific Affinity Chromatographic Systems to ATP-Dependent Enzymes: Studies with Yeast Hexokinase. Anal. Biochem. 2002, 309, 279–292. [Google Scholar] [CrossRef] [PubMed]
- Röber, B.; Stolle, J.; Reuter, G. Eigenschaften Der Hexokinase Aus Der SCP Hefe Candida Maltosa H. Z. Für Allg. Mikrobiol. 2007, 24, 619–627. [Google Scholar] [CrossRef]
- Zhao, R.; Zheng, S.; Duan, C.; Liu, F.; Yang, L.; Huo, G. NAD-Dependent Lactate Dehydrogenase Catalyses the First Step in Respiratory Utilization of Lactate by Lactococcus lactis. FEBS Open Bio 2013, 3, 379–386. [Google Scholar] [CrossRef]
- Le, H.; Kabbur, S.; Pollastrini, L.; Sun, Z.; Mills, K.; Johnson, K.; Karypis, G.; Hu, W.-S. Multivariate Analysis of Cell Culture Bioprocess Data—Lactate Consumption as Process Indicator. J. Biotechnol. 2012, 162, 210–223. [Google Scholar] [CrossRef] [PubMed]
- Hamada, M.; Hiraoka, T.; Koike, K.; Ogasahara, K.; Kanzaki, T.; Koike, M. Properties and Subunit Structure of Pig Heart Pyruvate Dehydrogenase. J. Biochem. 1976, 79, 1273–1285. [Google Scholar] [CrossRef] [PubMed]
- Lao, M.-S.; Toth, D. Effects of Ammonium and Lactate on Growth and Metabolism of a Recombinant Chinese Hamster Ovary Cell Culture. Biotechnol. Prog. 1997, 13, 688–691. [Google Scholar] [CrossRef] [PubMed]
- Cruz, H.J.; Freitas, C.M.; Alves, P.M.; Moreira, J.L.; Carrondo, M.J.T. Effects of Ammonia and Lactate on Growth, Metabolism, and Productivity of BHK Cells. Enzyme Microb. Technol. 2000, 27, 43–52. [Google Scholar] [CrossRef] [PubMed]


Disclaimer/Publisher’s Note: The statements, opinions and data contained in all publications are solely those of the individual author(s) and contributor(s) and not of MDPI and/or the editor(s). MDPI and/or the editor(s) disclaim responsibility for any injury to people or property resulting from any ideas, methods, instructions or products referred to in the content. |
© 2024 by the authors. Licensee MDPI, Basel, Switzerland. This article is an open access article distributed under the terms and conditions of the Creative Commons Attribution (CC BY) license (https://creativecommons.org/licenses/by/4.0/).
Share and Cite
Bokelmann, C.; Ehsani, A.; Schaub, J.; Stiefel, F. Deciphering Metabolic Pathways in High-Seeding-Density Fed-Batch Processes for Monoclonal Antibody Production: A Computational Modeling Perspective. Bioengineering 2024, 11, 331. https://doi.org/10.3390/bioengineering11040331
Bokelmann C, Ehsani A, Schaub J, Stiefel F. Deciphering Metabolic Pathways in High-Seeding-Density Fed-Batch Processes for Monoclonal Antibody Production: A Computational Modeling Perspective. Bioengineering. 2024; 11(4):331. https://doi.org/10.3390/bioengineering11040331
Chicago/Turabian StyleBokelmann, Carolin, Alireza Ehsani, Jochen Schaub, and Fabian Stiefel. 2024. "Deciphering Metabolic Pathways in High-Seeding-Density Fed-Batch Processes for Monoclonal Antibody Production: A Computational Modeling Perspective" Bioengineering 11, no. 4: 331. https://doi.org/10.3390/bioengineering11040331