
Volumetric Imitation Generative Adversarial Networks for Anatomical Human Body Modeling
Abstract
:
1. Introduction
2. Related Works
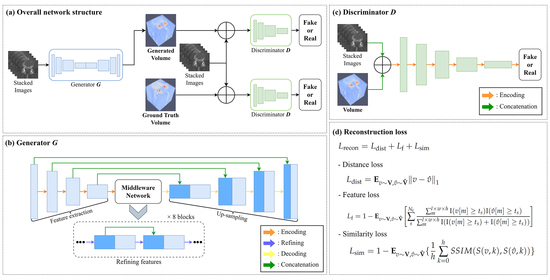
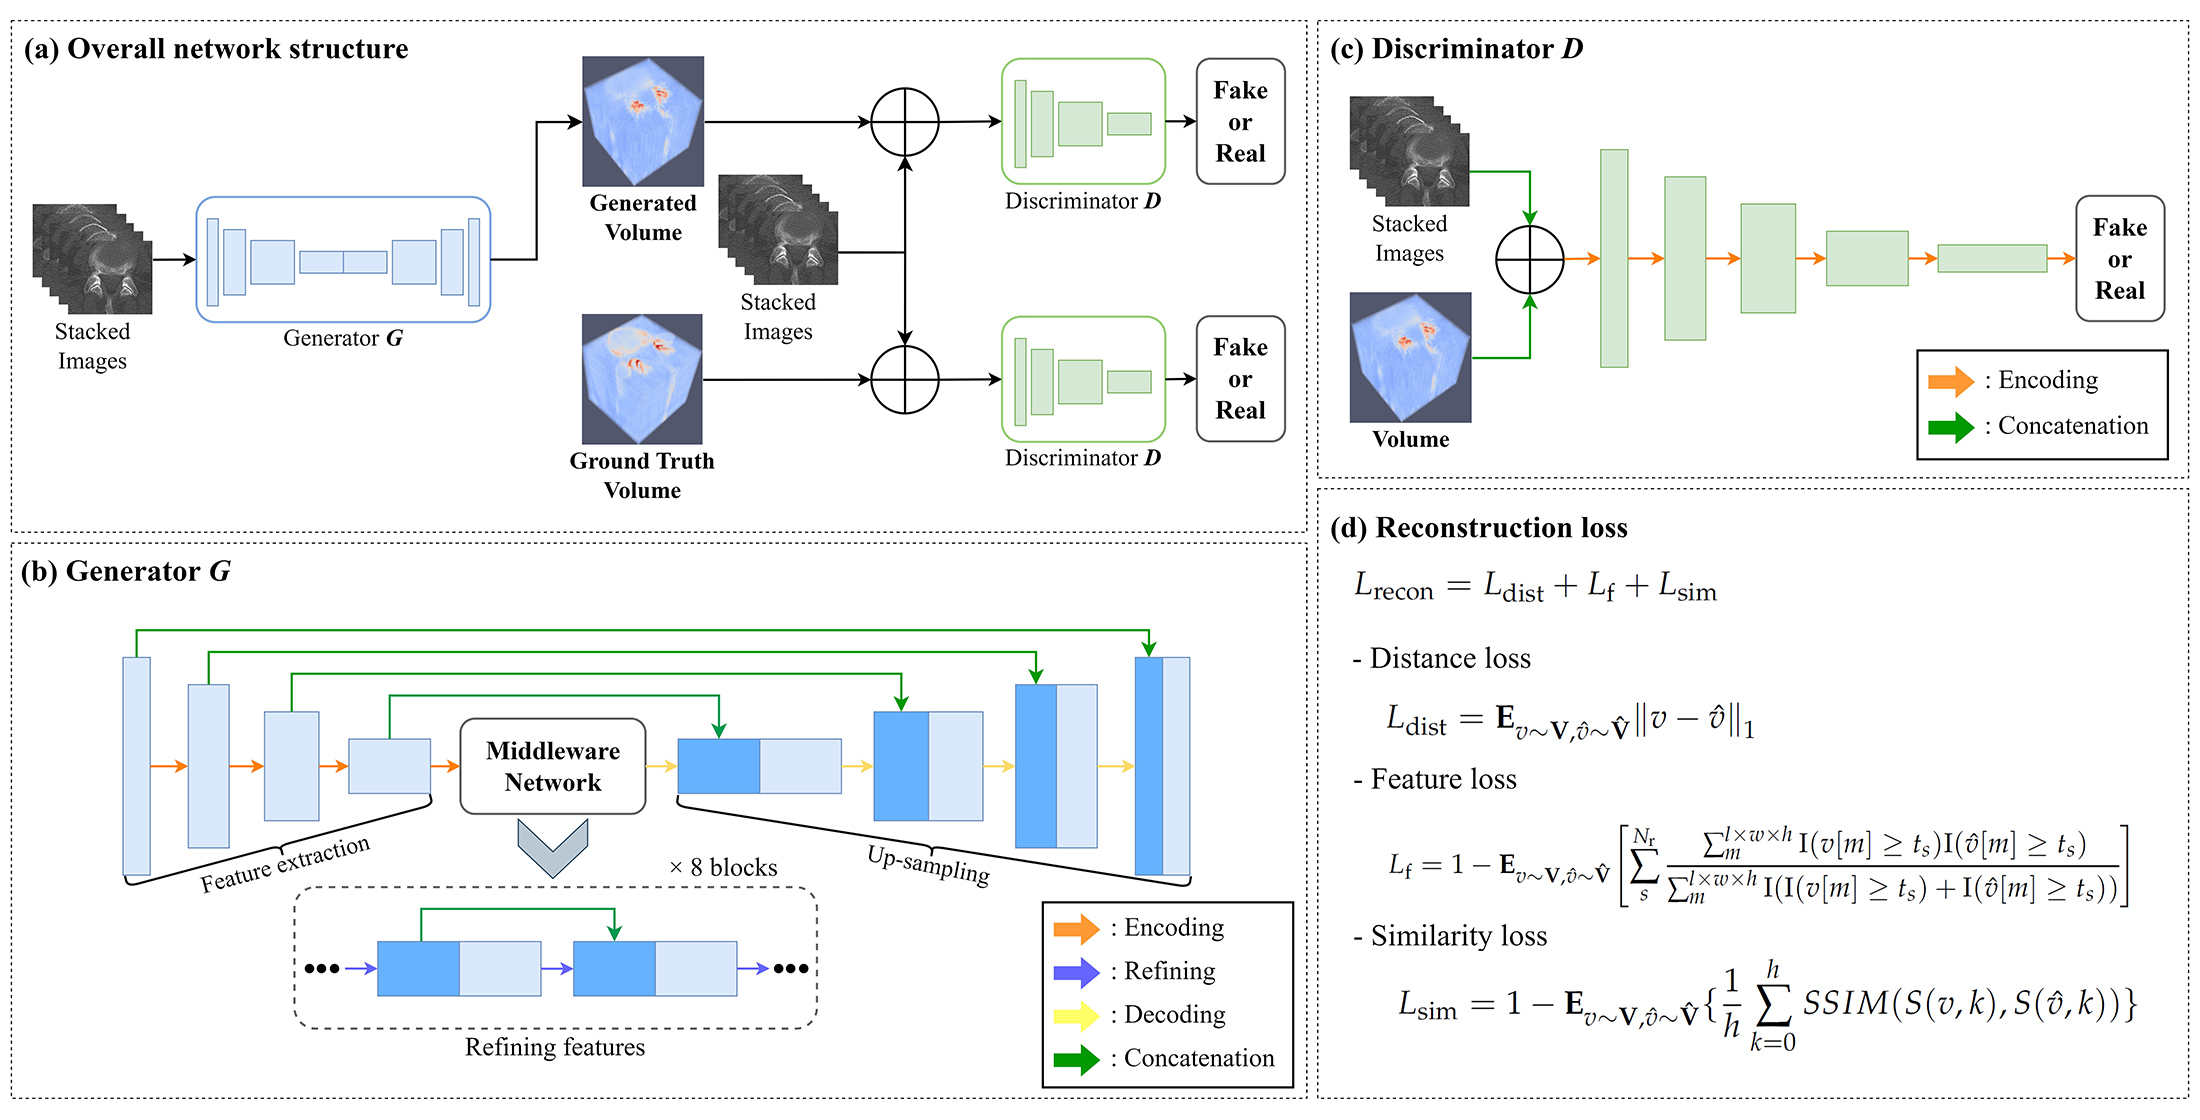
3. Methods
3.1. Training Process
3.2. Loss Function
3.3. Experimental Setting
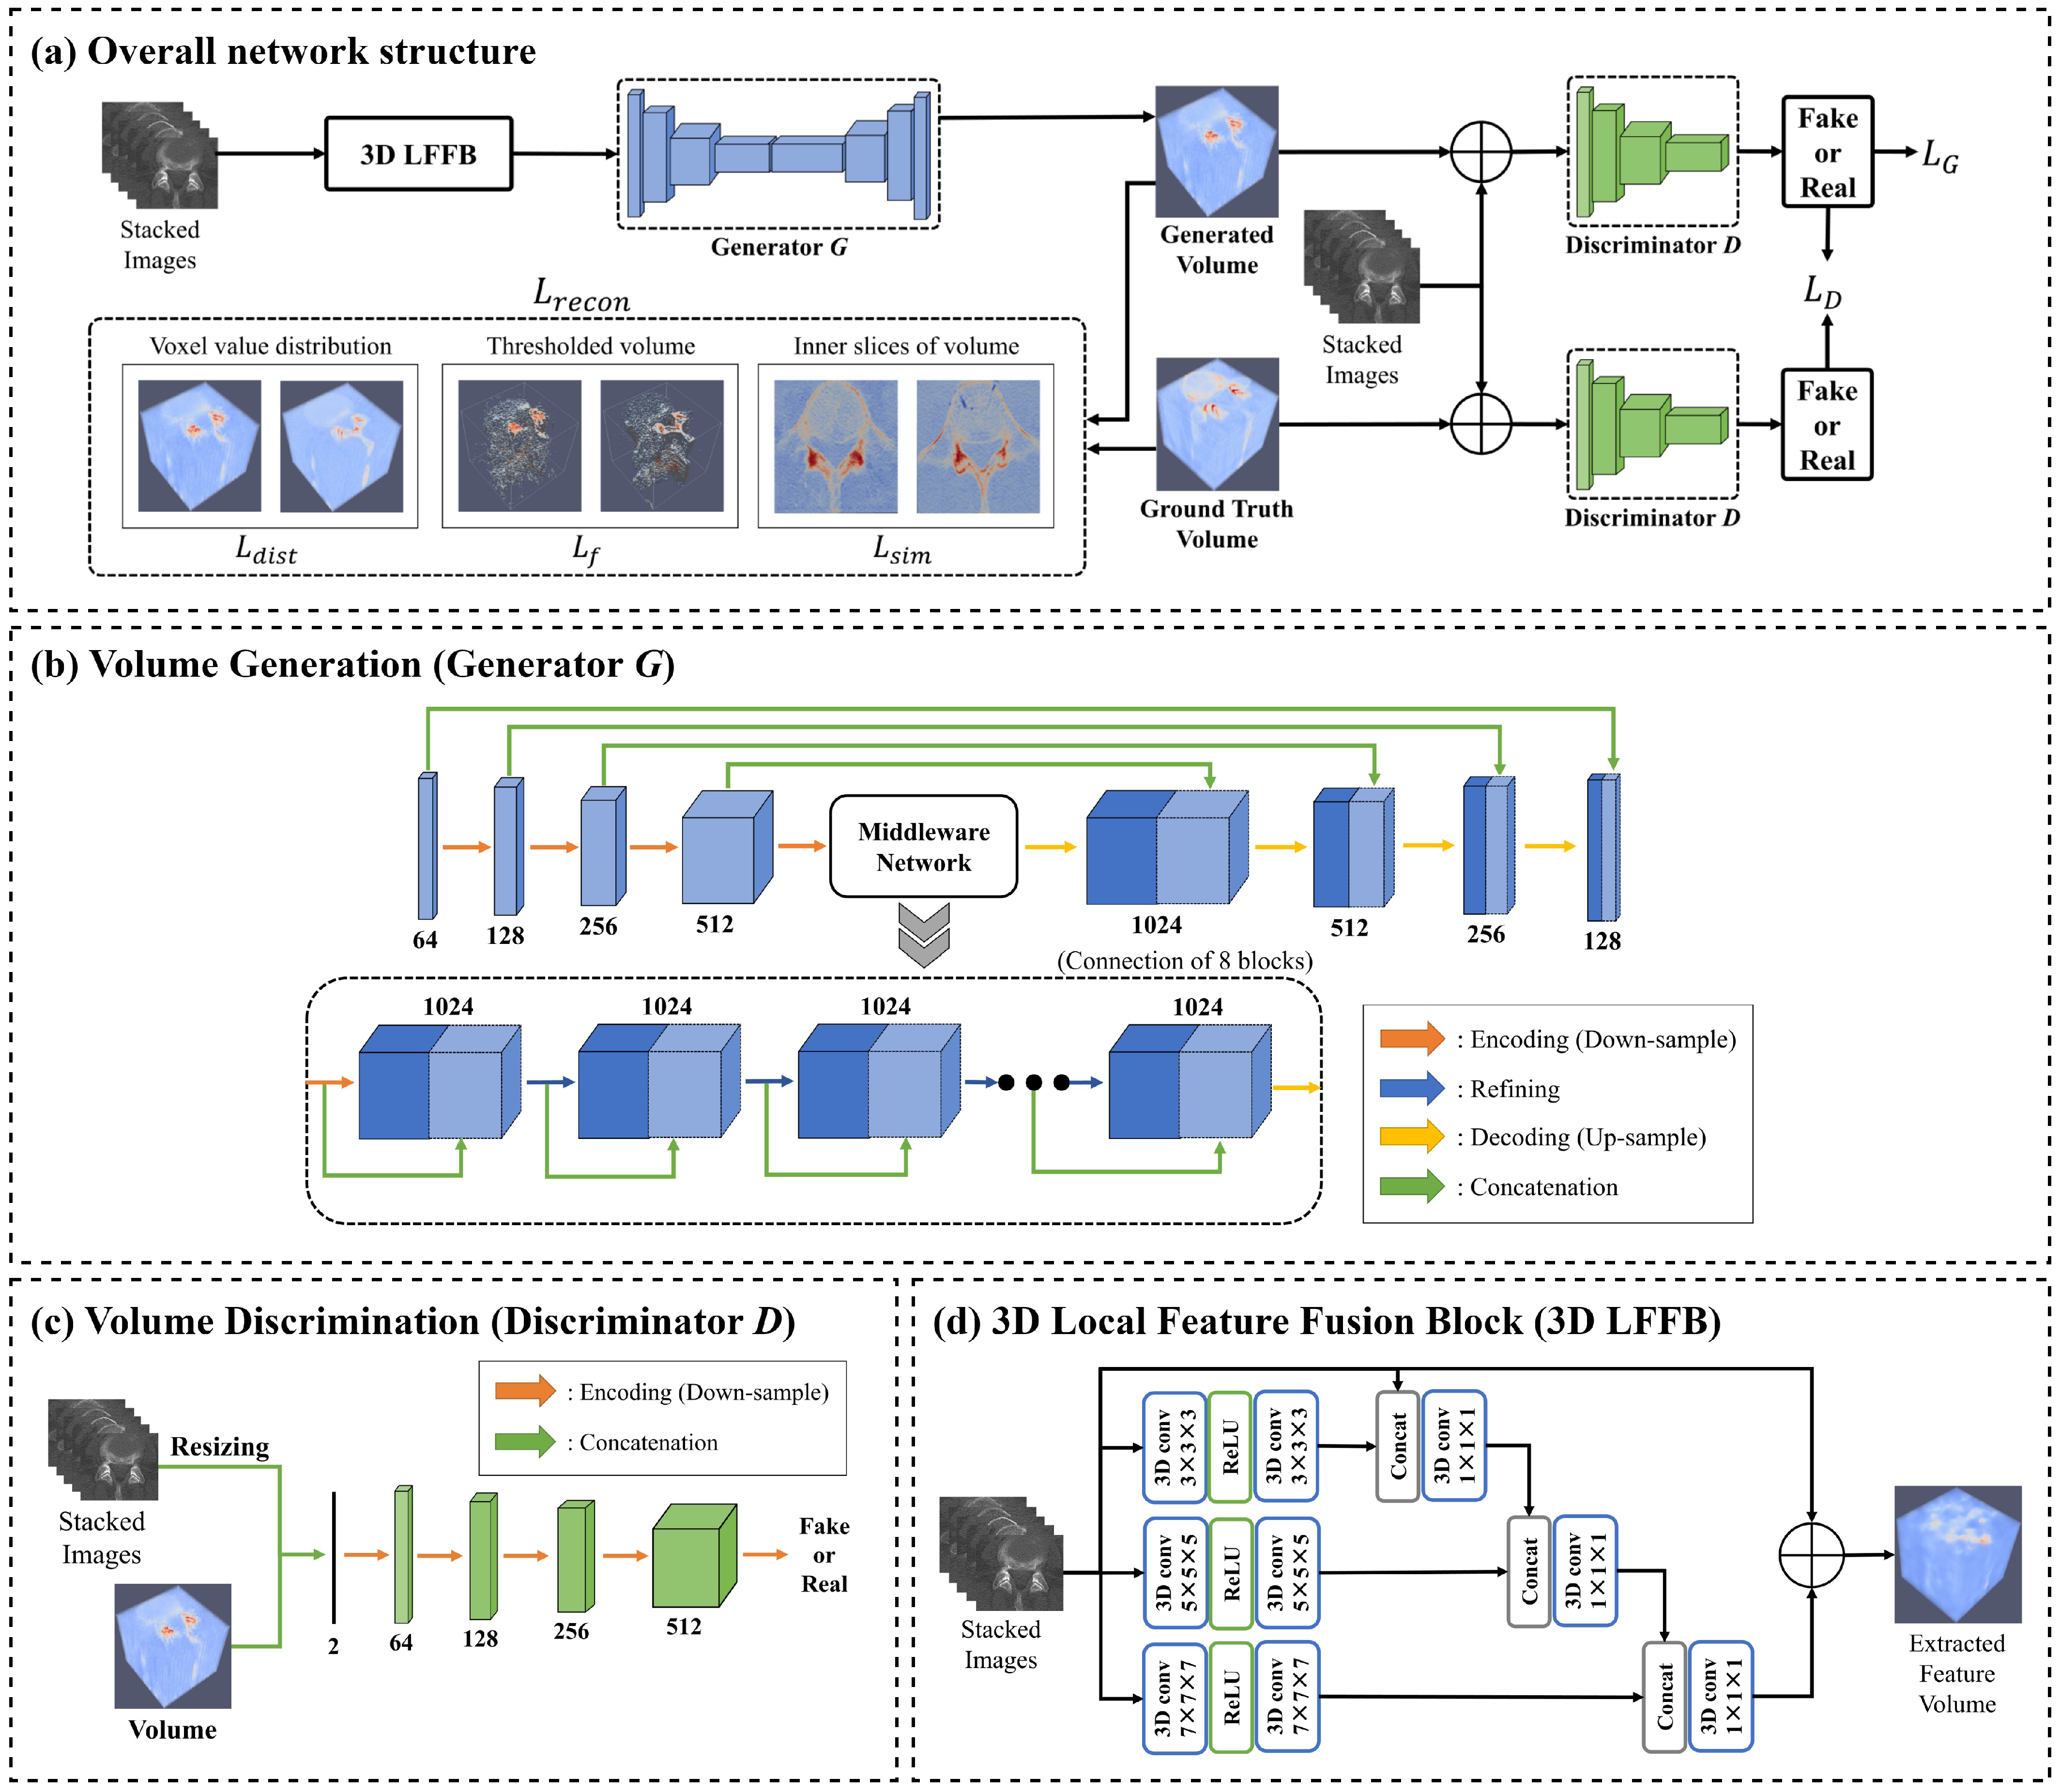
4. Results
5. Conclusions
Author Contributions
Funding
Institutional Review Board Statement
Informed Consent Statement
Data Availability Statement
Acknowledgments
Conflicts of Interest
References
- Li, R.; Huang, T.; Zhang, X.; Liao, H. 4: Interactive Volume Rendering Method Using Dynamic Ray Casting for Autostereoscopic Display. In SID Symposium Digest of Technical Papers; Wiley Online Library: Hoboken, NJ, USA, 2021; Volume 52, pp. 26–29. [Google Scholar]
- Fang, C.; An, J.; Bruno, A.; Cai, X.; Fan, J.; Fujimoto, J.; Golfieri, R.; Hao, X.; Jiang, H.; Jiao, L.R.; et al. Consensus recommendations of three-dimensional visualization for diagnosis and management of liver diseases. Hepatol. Int. 2020, 14, 437–453. [Google Scholar] [CrossRef]
- Nakao, M.; Nakamura, M.; Mizowaki, T.; Matsuda, T. Statistical deformation reconstruction using multi-organ shape features for pancreatic cancer localization. Med. Image Anal. 2021, 67, 101829. [Google Scholar] [CrossRef]
- Kavur, A.E.; Gezer, N.S.; Barış, M.; Aslan, S.; Conze, P.H.; Groza, V.; Pham, D.D.; Chatterjee, S.; Ernst, P.; Özkan, S.; et al. CHAOS challenge-combined (CT-MR) healthy abdominal organ segmentation. Med. Image Anal. 2021, 69, 101950. [Google Scholar] [CrossRef]
- Zhao, J.; Zhang, Y.; He, X.; Xie, P. Covid-ct-Dataset: A ct Scan Dataset about COVID-19. arXiv 2020, arXiv:2003.13865. [Google Scholar]
- Wisse, L.E.; Chételat, G.; Daugherty, A.M.; de Flores, R.; la Joie, R.; Mueller, S.G.; Stark, C.E.; Wang, L.; Yushkevich, P.A.; Berron, D.; et al. Hippocampal subfield volumetry from structural isotropic 1 mm3 MRI scans: A note of caution. Hum. Brain Mapp. 2021, 42, 539–550. [Google Scholar] [CrossRef]
- Costa, P.; Galdran, A.; Meyer, M.I.; Niemeijer, M.; Abràmoff, M.; Mendonça, A.M.; Campilho, A. End-to-end adversarial retinal image synthesis. IEEE Trans. Med. Imaging 2017, 37, 781–791. [Google Scholar] [CrossRef]
- Beers, A.; Brown, J.; Chang, K.; Campbell, J.P.; Ostmo, S.; Chiang, M.F.; Kalpathy-Cramer, J. High-resolution medical image synthesis using progressively grown generative adversarial networks. arXiv 2018, arXiv:1805.03144. [Google Scholar]
- Balashova, E.; Wang, J.; Singh, V.; Georgescu, B.; Teixeira, B.; Kapoor, A. 3D Organ Shape Reconstruction from Topogram Images. In Proceedings of the International Conference on Information Processing in Medical Imaging, Hong Kong, China, 2–7 June 2019; Springer: Berlin/Heidelberg, Germany, 2019; pp. 347–359. [Google Scholar]
- Kasten, Y.; Doktofsky, D.; Kovler, I. End-to-end convolutional neural network for 3D reconstruction of knee bones from bi-planar X-ray images. In Proceedings of the International Workshop on Machine Learning for Medical Image Reconstruction, Lima, Peru, 8 October 2020; Springer: Berlin/Heidelberg, Germany, 2020; pp. 123–133. [Google Scholar]
- Çiçek, Ö.; Abdulkadir, A.; Lienkamp, S.S.; Brox, T.; Ronneberger, O. 3D U-Net: Learning dense volumetric segmentation from sparse annotation. In Proceedings of the International Conference on Medical Image Computing and Computer-Assisted Intervention, Athens, Greece, 17–21 October 2016; Springer: Berlin/Heidelberg, Germany, 2016; pp. 424–432. [Google Scholar]
- He, K.; Zhang, X.; Ren, S.; Sun, J. Deep residual learning for image recognition. In Proceedings of the IEEE Conference on Computer Vision and Pattern Recognition, Las Vegas, NV, USA, 27–30 June 2016; pp. 770–778. [Google Scholar]
- Jiang, M.; Zhi, M.; Wei, L.; Yang, X.; Zhang, J.; Li, Y.; Wang, P.; Huang, J.; Yang, G. FA-GAN: Fused attentive generative adversarial networks for MRI image super-resolution. Comput. Med. Imaging Graph. 2021, 92, 101969. [Google Scholar] [CrossRef] [PubMed]
- Odena, A.; Olah, C.; Shlens, J. Conditional image synthesis with auxiliary classifier gans. In Proceedings of the International Conference on Machine Learning, PMLR, Sydney, Australia, 6–11 August 2017; pp. 2642–2651. [Google Scholar]
- Setiadi, D.R.I.M. PSNR vs. SSIM: Imperceptibility quality assessment for image steganography. Multimed. Tools Appl. 2021, 80, 8423–8444. [Google Scholar] [CrossRef]
- Lee, S.H.; Lee, S.B. Production and usage of Korean human information in KISTI. J. Korea Contents Assoc. 2010, 10, 416–421. [Google Scholar] [CrossRef]
- Rister, B.; Yi, D.; Shivakumar, K.; Nobashi, T.; Rubin, D.L. CT-ORG, a new dataset for multiple organ segmentation in computed tomography. Sci. Data 2020, 7, 381. [Google Scholar] [CrossRef]
- Dai, W.C.; Zhang, H.W.; Yu, J.; Xu, H.J.; Chen, H.; Luo, S.P.; Zhang, H.; Liang, L.H.; Wu, X.L.; Lei, Y.; et al. CT imaging and differential diagnosis of COVID-19. Can. Assoc. Radiol. J. 2020, 71, 195–200. [Google Scholar] [CrossRef] [PubMed]
- Byl, J.; Nelliadi, S.S.; Samuel, B.; Vettukattil, J. True 3D Viewer facilitates accurate diagnosis of lung infarction. Vasc. Dis. Manag. 2021, 18, E267–E268. [Google Scholar]
- Shi, W.; Liu, P.X.; Zheng, M. Cutting procedures with improved visual effects and haptic interaction for surgical simulation systems. Comput. Methods Programs Biomed. 2020, 184, 105270. [Google Scholar] [CrossRef] [PubMed]
- Munawar, A.; Li, Z.; Nagururu, N.; Trakimas, D.; Kazanzides, P.; Taylor, R.H.; Creighton, F.X. Fully Immersive Virtual Reality for Skull-base Surgery: Surgical Training and Beyond. arXiv 2023, arXiv:2302.13878. [Google Scholar] [CrossRef] [PubMed]
- Henzler, P.; Rasche, V.; Ropinski, T.; Ritschel, T. Single-image Tomography: 3D Volumes from 2D Cranial X-Rays. In Computer Graphics Forum; Wiley Online Library: Hoboken, NJ, USA, 2018; Volume 37, pp. 377–388. [Google Scholar]
- Xu, Y.; Li, Y.; Shin, B.S. Medical image processing with contextual style transfer. Hum.-Centric Comput. Inf. Sci. 2020, 10, 46. [Google Scholar] [CrossRef]
- Qiao, Z.; Qian, Z.; Tang, H.; Gong, G.; Yin, Y.; Huang, C.; Fan, W. CorGAN: Context aware Recurrent Generative Adversarial Network for Medical Image Generation. In Proceedings of the 2020 IEEE International Conference on Bioinformatics and Biomedicine (BIBM), Seoul, Republic of Korea, 16–19 December 2020; IEEE: Piscataway, NJ, USA, 2020; pp. 1100–1103. [Google Scholar]
- Wang, Q.; Zhang, X.; Zhang, W.; Gao, M.; Huang, S.; Wang, J.; Zhang, J.; Yang, D.; Liu, C. Realistic lung nodule synthesis with multi-target co-guided adversarial mechanism. IEEE Trans. Med. Imaging 2021, 40, 2343–2353. [Google Scholar] [CrossRef] [PubMed]
- Masutani, E.M.; Bahrami, N.; Hsiao, A. Deep learning single-frame and multiframe super-resolution for cardiac MRI. Radiology 2020, 295, 552–561. [Google Scholar] [CrossRef] [PubMed]
- Kitchen, A.; Seah, J. Deep generative adversarial neural networks for realistic prostate lesion MRI synthesis. arXiv 2017, arXiv:1708.00129. [Google Scholar]
- Chuquicusma, M.J.; Hussein, S.; Burt, J.; Bagci, U. How to fool radiologists with generative adversarial networks? A visual turing test for lung cancer diagnosis. In Proceedings of the 2018 IEEE 15th International Symposium on Biomedical Imaging (ISBI 2018), Washington, DC, USA, 4–7 April 2018; IEEE: Piscataway, NJ, USA, 2018; pp. 240–244. [Google Scholar]
- Frid-Adar, M.; Diamant, I.; Klang, E.; Amitai, M.; Goldberger, J.; Greenspan, H. GAN-based synthetic medical image augmentation for increased CNN performance in liver lesion classification. Neurocomputing 2018, 321, 321–331. [Google Scholar] [CrossRef]
- Karras, T.; Aila, T.; Laine, S.; Lehtinen, J. Progressive growing of gans for improved quality, stability, and variation. arXiv 2017, arXiv:1710.10196. [Google Scholar]
- Wu, J.; Zhang, C.; Xue, T.; Freeman, B.; Tenenbaum, J. Learning a probabilistic latent space of object shapes via 3D generative-adversarial modeling. Adv. Neural Inf. Process. Syst. 2016, 29, 2–9. [Google Scholar]
- Smith, E.J.; Meger, D. Improved adversarial systems for 3D object generation and reconstruction. In Proceedings of the Conference on Robot Learning, PMLR, Mountain View, CA, USA, 13–15 November 2017; pp. 87–96. [Google Scholar]
- Kruthika, K.; Maheshappa, H.; Initiative, A.D.N. CBIR system using Capsule Networks and 3D CNN for Alzheimer’s disease diagnosis. Inform. Med. Unlocked 2019, 14, 59–68. [Google Scholar] [CrossRef]
- Xu, C.; Xu, L.; Ohorodnyk, P.; Roth, M.; Chen, B.; Li, S. Contrast agent-free synthesis and segmentation of ischemic heart disease images using progressive sequential causal GANs. Med. Image Anal. 2020, 62, 101668. [Google Scholar] [CrossRef]
- Ran, M.; Hu, J.; Chen, Y.; Chen, H.; Sun, H.; Zhou, J.; Zhang, Y. Denoising of 3D magnetic resonance images using a residual encoder—Decoder Wasserstein generative adversarial network. Med. Image Anal. 2019, 55, 165–180. [Google Scholar] [CrossRef] [PubMed]
- Han, C.; Rundo, L.; Murao, K.; Noguchi, T.; Shimahara, Y.; Milacski, Z.Á.; Koshino, S.; Sala, E.; Nakayama, H.; Satoh, S. MADGAN: Unsupervised medical anomaly detection GAN using multiple adjacent brain MRI slice reconstruction. BMC Bioinform. 2021, 22, 31. [Google Scholar] [CrossRef]
- Cirillo, M.D.; Abramian, D.; Eklund, A. Vox2Vox: 3D-GAN for brain tumour segmentation. In Proceedings of the International MICCAI Brainlesion Workshop, Lima, Peru, 4–8 October 2020; Springer: Berlin/Heidelberg, Germany, 2020; pp. 274–284. [Google Scholar]
- Kingma, D.P.; Ba, J. Adam: A method for stochastic optimization. arXiv 2014, arXiv:1412.6980. [Google Scholar]
- Visa, S.; Ramsay, B.; Ralescu, A.L.; Van Der Knaap, E. Confusion matrix-based feature selection. Maics 2011, 710, 120–127. [Google Scholar]
- Taha, A.A.; Hanbury, A. Metrics for evaluating 3D medical image segmentation: Analysis, selection, and tool. BMC Med. Imaging 2015, 15, 29. [Google Scholar] [CrossRef]
- Roschger, P.; Gupta, H.; Berzlanovich, A.; Ittner, G.; Dempster, D.; Fratzl, P.; Cosman, F.; Parisien, M.; Lindsay, R.; Nieves, J.; et al. Constant mineralization density distribution in cancellous human bone. Bone 2003, 32, 316–323. [Google Scholar] [CrossRef]
- Xie, H.; Yao, H.; Sun, X.; Zhou, S.; Zhang, S. Pix2vox: Context-aware 3d reconstruction from single and multi-view images. In Proceedings of the IEEE/CVF International Conference on Computer Vision, Seoul, Republic of Korea, 27 October–2 November 2019; pp. 2690–2698. [Google Scholar]
- Bertels, J.; Eelbode, T.; Berman, M.; Vandermeulen, D.; Maes, F.; Bisschops, R.; Blaschko, M.B. Optimizing the dice score and jaccard index for medical image segmentation: Theory and practice. In Proceedings of the International Conference on Medical Image Computing and Computer-Assisted Intervention, Shenzhen, China, 13–17 October 2019; Springer: Berlin/Heidelberg, Germany, 2019; pp. 92–100. [Google Scholar]
- Wang, Z.; Bovik, A.C. A universal image quality index. IEEE Signal Process. Lett. 2002, 9, 81–84. [Google Scholar] [CrossRef]
- Zhang, L.; Shen, Y.; Li, H. VSI: A visual saliency-induced index for perceptual image quality assessment. IEEE Trans. Image Process. 2014, 23, 4270–4281. [Google Scholar] [CrossRef] [PubMed]


| Method | Fifth Lumber Vertebra | Right Hip Bone | Liver | |||||||||
|---|---|---|---|---|---|---|---|---|---|---|---|---|
| IoU | DC | F1 | L1 | IoU | DC | F1 | L1 | IoU | DC | F1 | L1 | |
| Pix2Vox | 0.501 | 0.670 | 0.662 | 0.121 | 0.381 | 0.553 | 0.551 | 0.131 | 0.264 | 0.488 | 0.402 | 0.139 |
| End-to-end CNN | 0.524 | 0.681 | 0.686 | 0.121 | 0.372 | 0.544 | 0.541 | 0.114 | 0.231 | 0.484 | 0.346 | 0.155 |
| Vox2Vox | 0.596 | 0.743 | 0.742 | 0.096 | 0.457 | 0.628 | 0.626 | 0.075 | 0.393 | 0.612 | 0.555 | 0.053 |
| VI-GAN | 0.712 | 0.832 | 0.831 | 0.102 | 0.865 | 0.929 | 0.927 | 0.075 | 0.552 | 0.741 | 0.685 | 0.056 |
| Method | Fifth Lumber Vertebra | Right Hip Bone | Liver | |||||||||
| PSNR | UQI | VSI | SSIM | PSNR | UQI | VSI | SSIM | PSNR | UQI | VSI | SSIM | |
| Pix2Vox | 16.226 | 0.839 | 0.827 | 0.329 | 15.764 | 0.729 | 0.829 | 0.279 | 15.486 | 0.884 | 0.831 | 0.284 |
| End-to-end CNN | 16.573 | 0.849 | 0.836 | 0.244 | 16.676 | 0.817 | 0.872 | 0.613 | 14.804 | 0.839 | 0.776 | 0.409 |
| Vox2Vox | 18.249 | 0.876 | 0.875 | 0.483 | 24.615 | 0.817 | 0.872 | 0.613 | 20.942 | 0.900 | 0.880 | 0.652 |
| VI-GAN | 18.189 | 0.883 | 0.874 | 0.505 | 24.518 | 0.816 | 0.865 | 0.600 | 26.661 | 0.886 | 0.874 | 0.669 |
Disclaimer/Publisher’s Note: The statements, opinions and data contained in all publications are solely those of the individual author(s) and contributor(s) and not of MDPI and/or the editor(s). MDPI and/or the editor(s) disclaim responsibility for any injury to people or property resulting from any ideas, methods, instructions or products referred to in the content. |
© 2024 by the authors. Licensee MDPI, Basel, Switzerland. This article is an open access article distributed under the terms and conditions of the Creative Commons Attribution (CC BY) license (https://creativecommons.org/licenses/by/4.0/).
Share and Cite
Kim, J.; Li, Y.; Shin, B.-S. Volumetric Imitation Generative Adversarial Networks for Anatomical Human Body Modeling. Bioengineering 2024, 11, 163. https://doi.org/10.3390/bioengineering11020163
Kim J, Li Y, Shin B-S. Volumetric Imitation Generative Adversarial Networks for Anatomical Human Body Modeling. Bioengineering. 2024; 11(2):163. https://doi.org/10.3390/bioengineering11020163
Chicago/Turabian StyleKim, Jion, Yan Li, and Byeong-Seok Shin. 2024. "Volumetric Imitation Generative Adversarial Networks for Anatomical Human Body Modeling" Bioengineering 11, no. 2: 163. https://doi.org/10.3390/bioengineering11020163