
Bi-Exponential 3D UTE-T1ρ Relaxation Mapping of Ex Vivo Human Knee Patellar Tendon at 3T
 , , ,
, , ,
Abstract
:1. Introduction
2. Methods
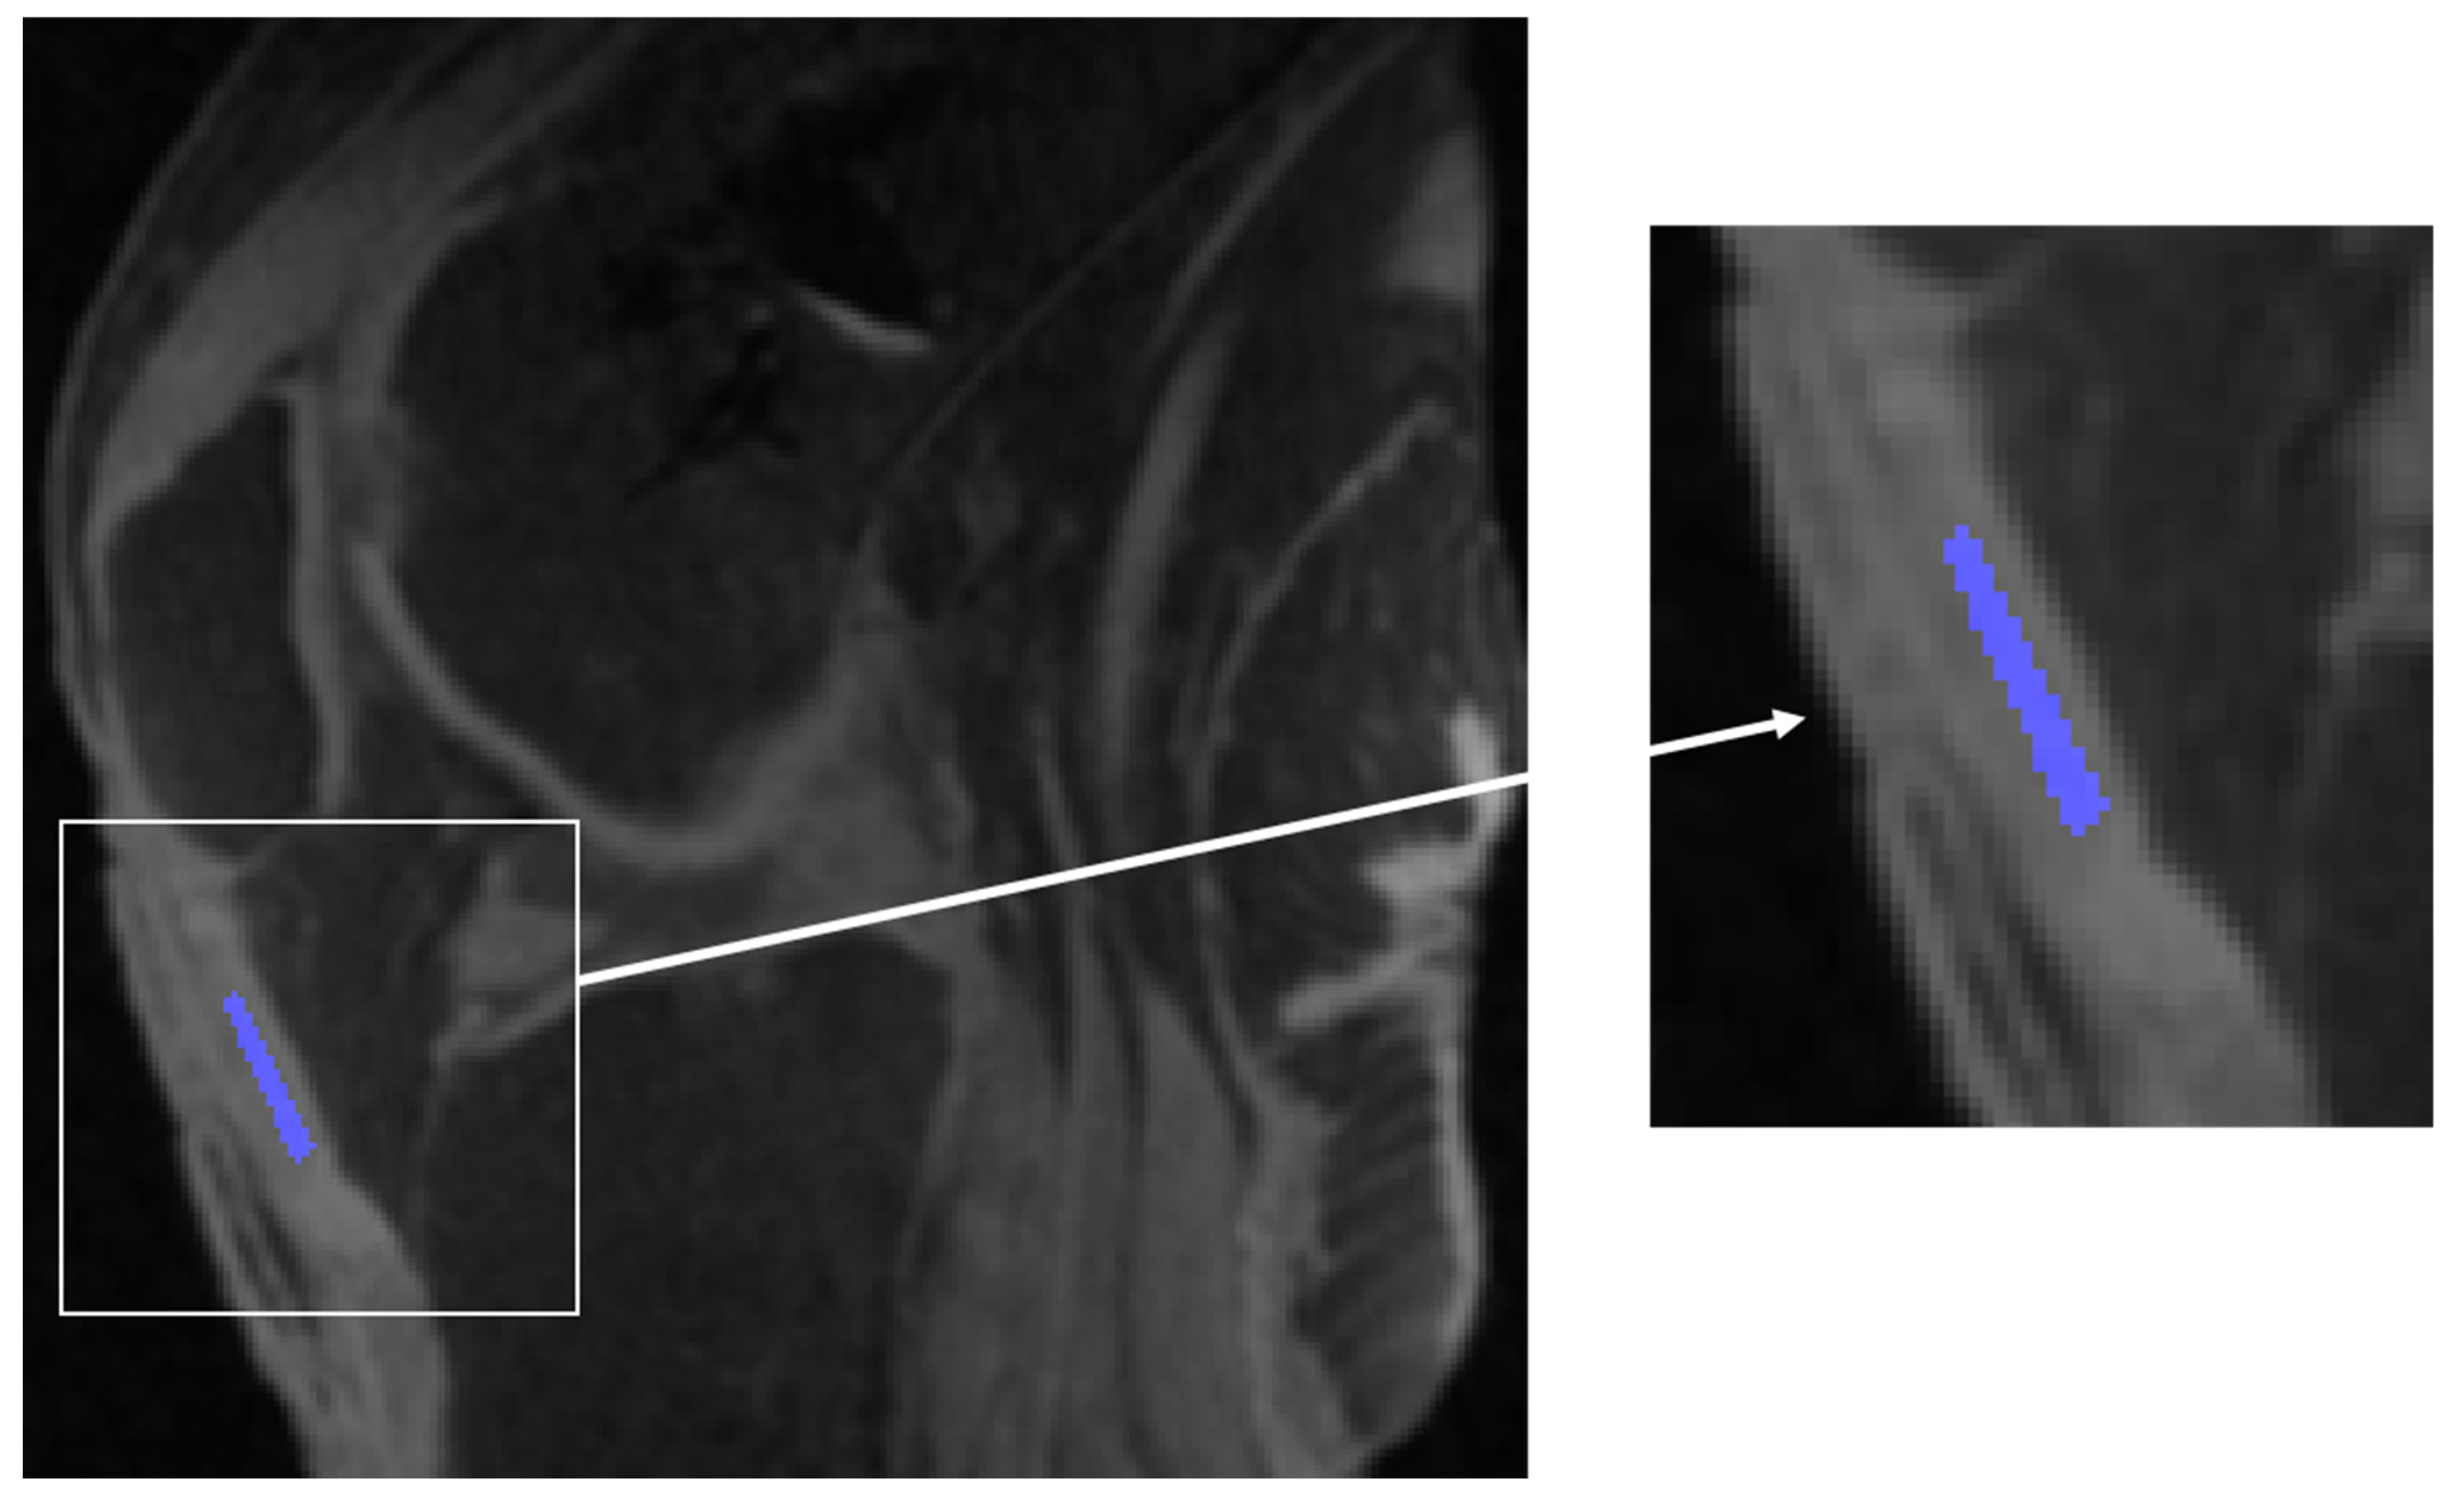
2.1. Specimens
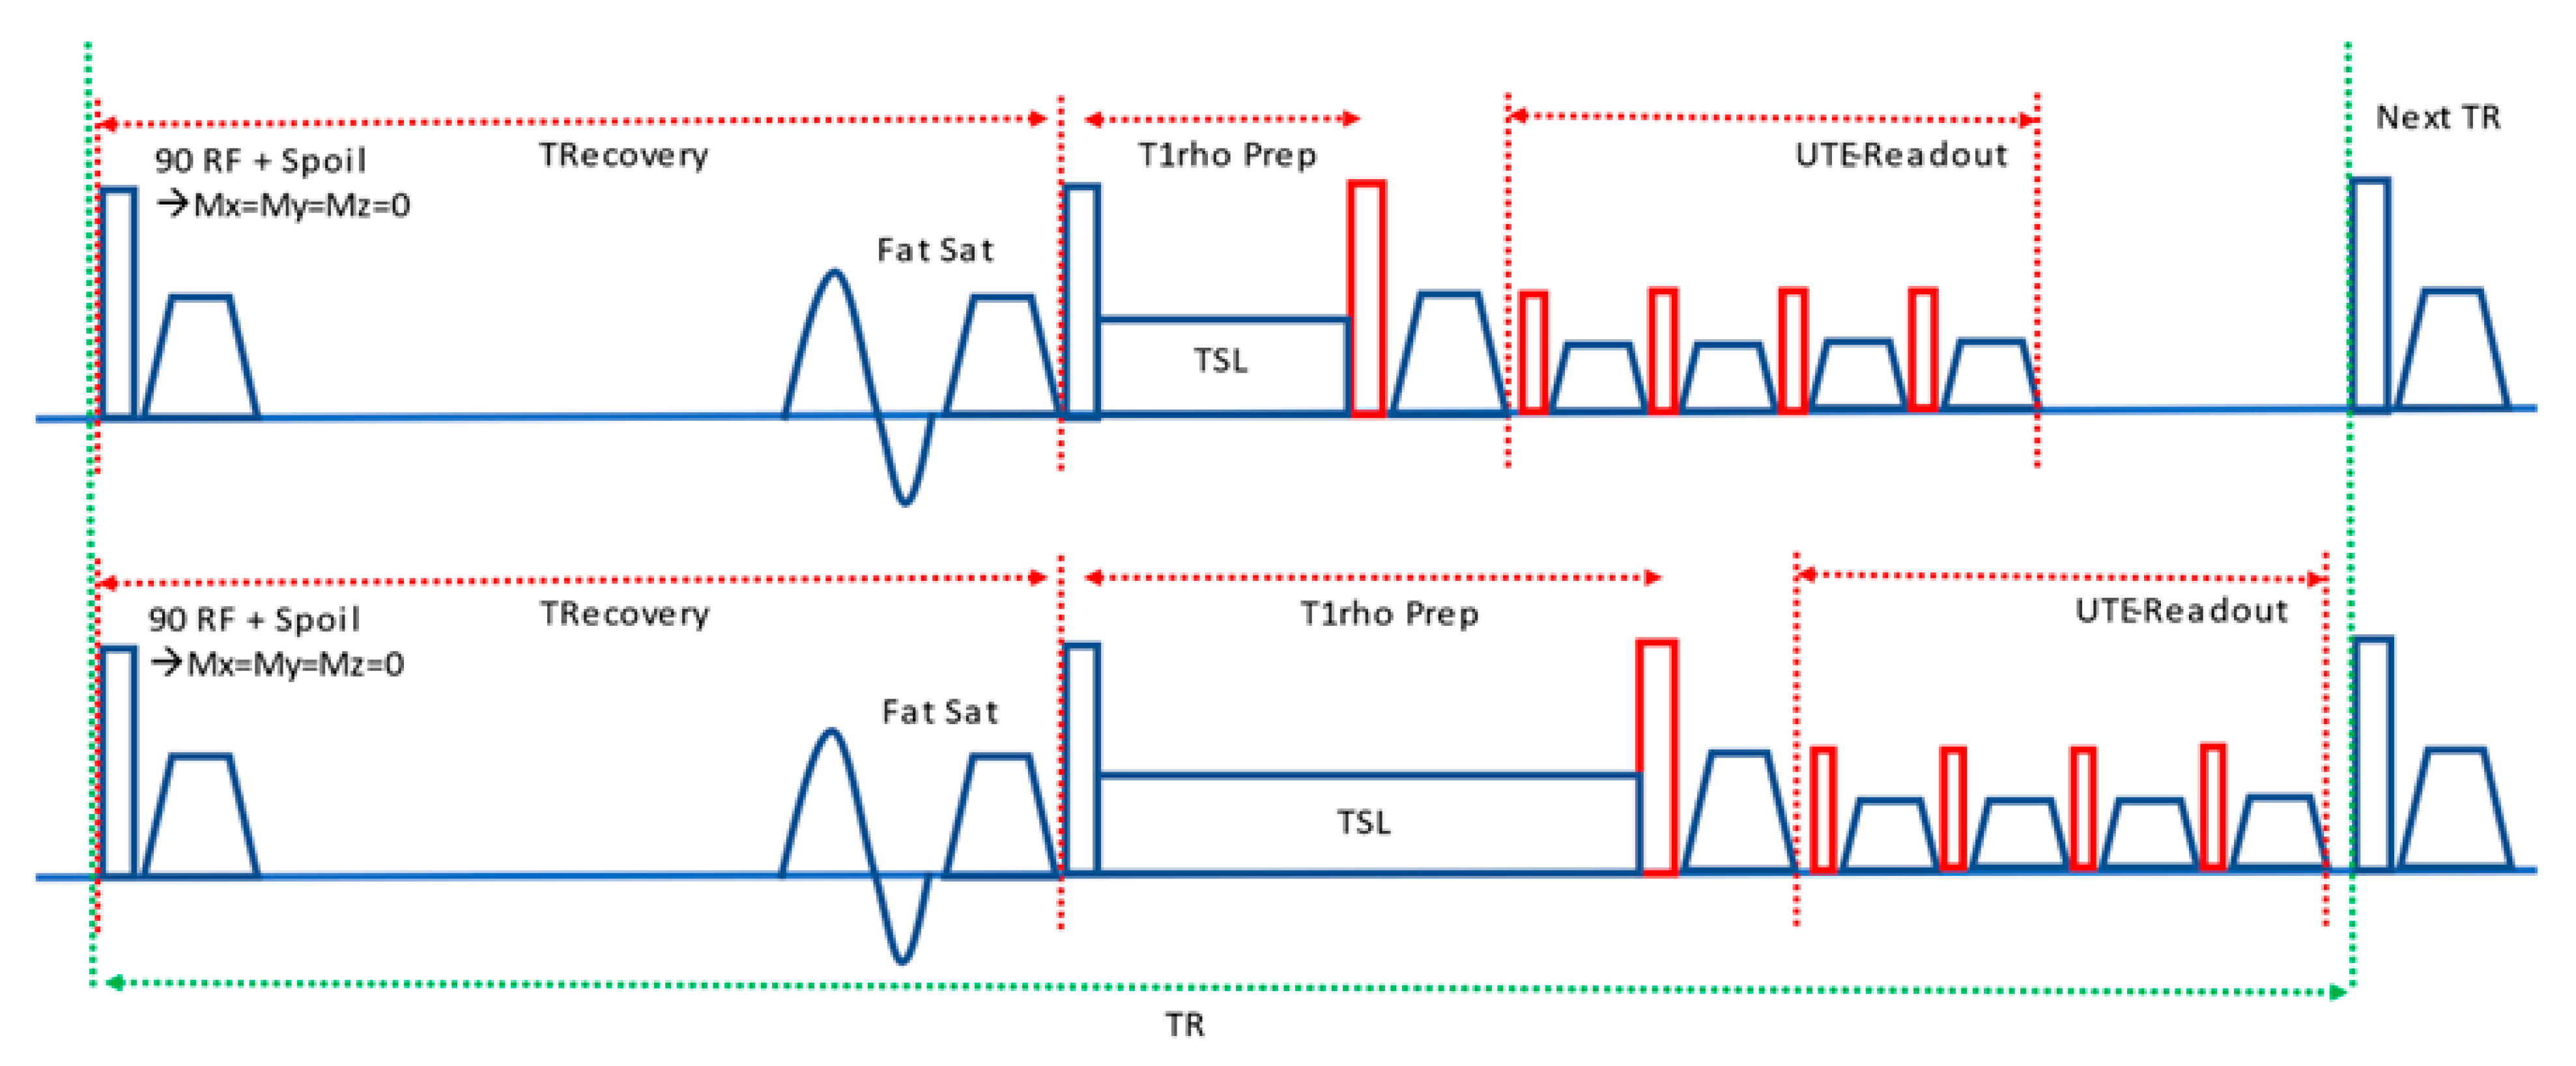
2.2. MRI Acquisition
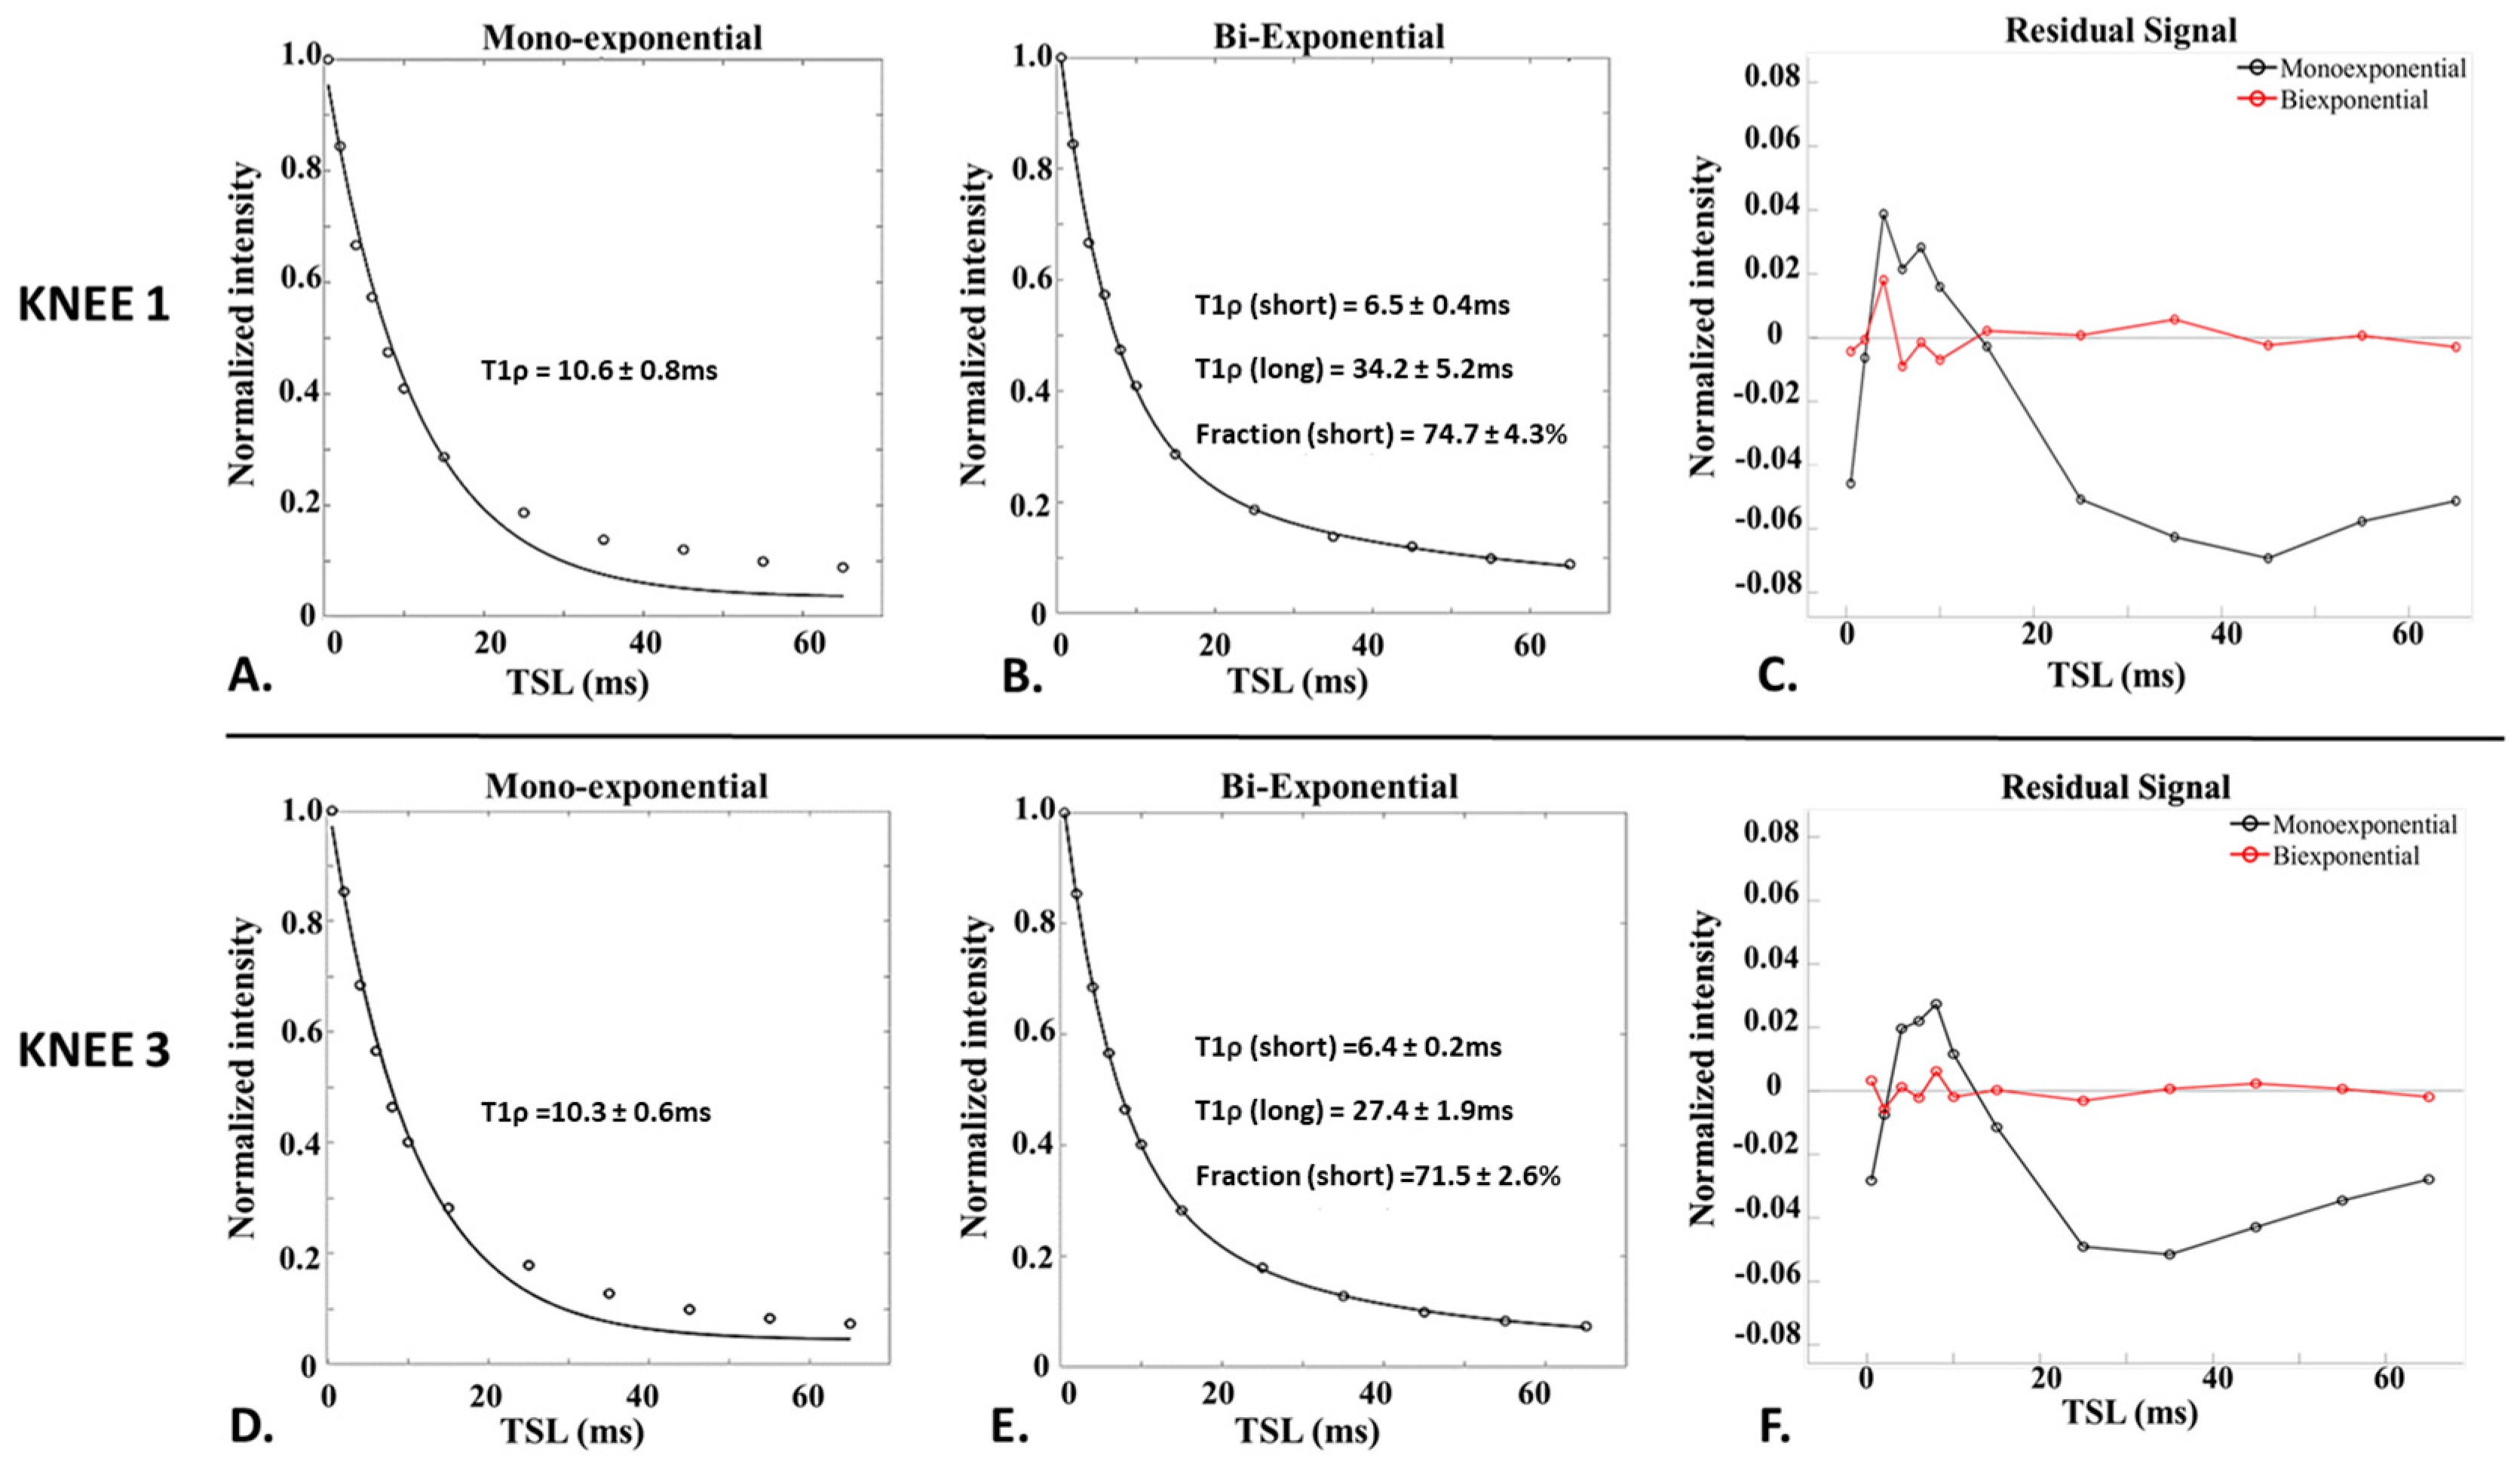
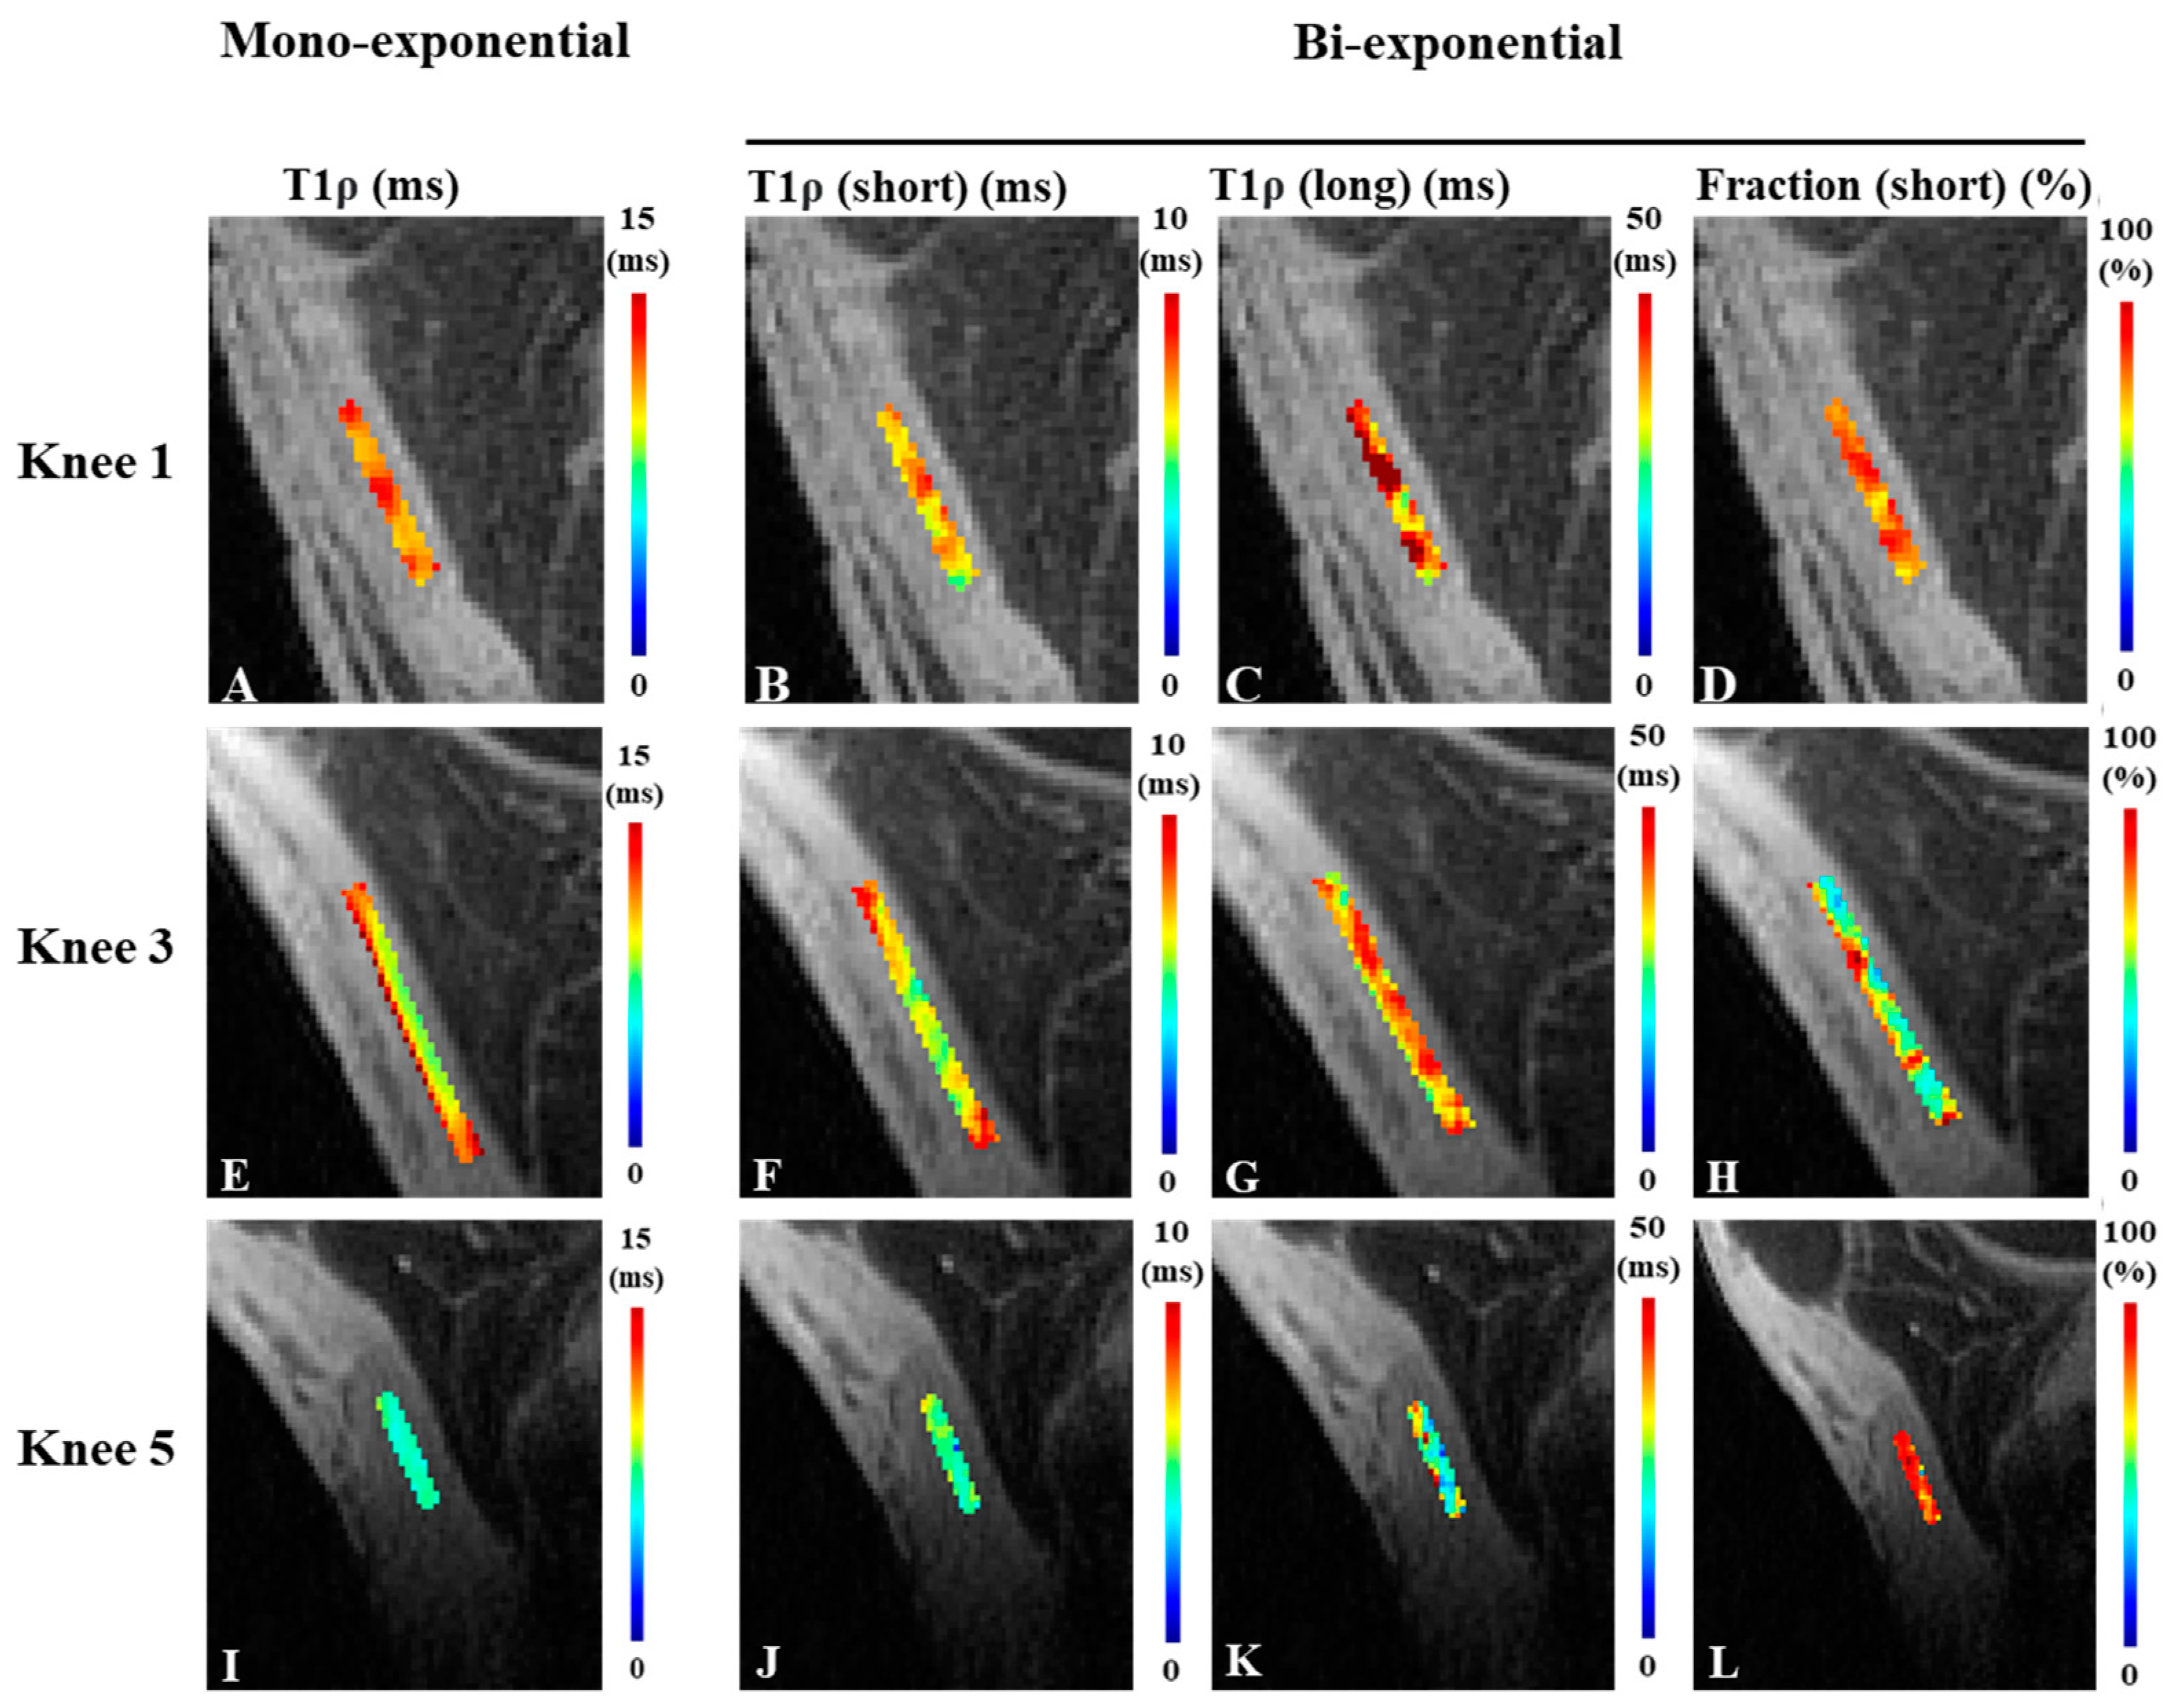
2.3. Single- and Bi-Exponential Analysis
3. Results
4. Discussion
Author Contributions
Funding
Institutional Review Board Statement
Informed Consent Statement
Data Availability Statement
Conflicts of Interest
Abbreviations
| CW | continuous wave |
| PETRA | pointwise encoding time reduction with radial acquisition |
| TE | echo time |
| TR | repetition time |
| UTE | ultrashort echo time |
References
- Ahmad, Z.; Parkar, A.; Shepherd, J.; Rushton, N. Revolving doors of tendinopathy: Definition, pathogenesis and treatment. Postgrad. Med. J. 2020, 96, 94–101. [Google Scholar] [CrossRef] [PubMed]
- Maffulli, N.; Khan, K.M.; Puddu, G. Overuse tendon conditions: Time to change a confusing terminology. Arthroscopy 1998, 14, 840–843. [Google Scholar] [CrossRef] [PubMed]
- Hopkins, C.; Fu, S.-C.; Chua, E.; Hu, X.; Rolf, C.; Mattila, V.M.; Qin, L.; Yung, P.S.-H.; Chan, K.-M. Critical review on the socio-economic impact of tendinopathy. Asia-Pac. J. Sports Med. Arthrosc. Rehabil. Technol. 2016, 4, 9–20. [Google Scholar] [CrossRef] [PubMed]
- Warden, S.J.; Brukner, P. Patellar tendinopathy. Clin. Sports Med. 2003, 22, 743–759. [Google Scholar] [CrossRef] [PubMed]
- Depalma, M.J.; Perkins, R.H. Patellar Tendinosis: Acute Patellar Tendon Rupture and Jumper’s Knee. Phys. Sportsmed. 2004, 32, 41–45. [Google Scholar] [CrossRef] [PubMed]
- Fredberg, U.; Bolvig, L. Jumper’s knee. Review of the literature. Scand. J. Med. Sci. Sports 1999, 9, 66–73. [Google Scholar] [CrossRef]
- Zwerver, J.; Bredeweg, S.W.; van den Akker-Scheek, I. Prevalence of Jumper’s knee among nonelite athletes from different sports: A cross-sectional survey. Am. J. Sports Med. 2011, 39, 1984–1988. [Google Scholar] [CrossRef]
- Lian, O.B.; Engebretsen, L.; Bahr, R. Prevalence of jumper’s knee among elite athletes from different sports: A cross-sectional study. Am. J. Sports Med. 2005, 33, 561–567. [Google Scholar] [CrossRef]
- Parkinson, J.; Samiric, T.; Ilic, M.Z.; Cook, J.; Handley, C.J. Involvement of proteoglycans in tendinopathy. J. Musculoskelet. Neuronal Interact. 2011, 11, 86–93. [Google Scholar]
- Riley, G. The pathogenesis of tendinopathy. A molecular perspective. Rheumatology 2004, 43, 131–142. [Google Scholar] [CrossRef]
- Tom, S.; Parkinson, J.; Ilic, M.Z.; Cook, J.; Feller, J.A.; Handley, C.J. Changes in the composition of the extracellular matrix in patellar tendinopathy. Matrix Biol. 2009, 28, 230–236. [Google Scholar] [CrossRef] [PubMed]
- Kojima, T.; Mwale, F.; Yasuda, T.; Girard, C.; Poole, A.R.; Laverty, S. Early degradation of type IX and type II collagen with the onset of experimental inflammatory arthritis. Arthritis Rheum. 2001, 44, 120–127. [Google Scholar] [CrossRef] [PubMed]
- Chang, A.; Miller, T.T. Imaging of tendons. Sports Health 2009, 1, 293–300. [Google Scholar] [CrossRef] [PubMed]
- Serai, S.D. Basics of magnetic resonance imaging and quantitative parameters T1, T2, T2*, T1rho and diffusion-weighted imaging. Pediatr. Radiol. 2022, 52, 217–227. [Google Scholar] [CrossRef] [PubMed]
- Wáng, Y.-X.J.; Zhang, Q.; Li, X.; Chen, W.; Ahuja, A.; Yuan, J. T1ρ magnetic resonance: Basic physics principles and applications in knee and intervertebral disc imaging. Quant. Imaging Med. Surg. 2015, 5, 858–885. [Google Scholar] [CrossRef] [PubMed]
- Regatte, R.R.; Akella, S.V.S.; Wheaton, A.J.; Lech, G.; Borthakur, A.; Kneeland, J.B.; Reddy, R. 3D-T1r-relaxation mapping of articular cartilage: In vivo assessment of early degenerative changes in symptomatic osteoarthritic subjects. Acad. Radiol. 2004, 11, 741–749. [Google Scholar] [PubMed]
- Li, X.; Ma, B.; Link, T.M.; Castillo, D.D.; Blumenkrantz, G.; Lozano, J. In vivo T(1rho) and T(2) mapping of articular cartilage in osteoarthritis of the knee using 3T MRI. Osteoarthr. Cartilage 2007, 15, 789–797. [Google Scholar] [CrossRef]
- Ma, Y.; Jang, H.; Jerban, S.; Chang, E.Y.; Chung, C.B.; Bydder, G.M.; Du, J. Making the invisible visible—Ultrashort echo time magnetic resonance imaging: Technical developments and applications. Appl. Phys. Rev. 2022, 9, 041303. [Google Scholar] [CrossRef]
- Sharafi, A.; Xia, D.; Chang, G.; Regatte, R.R. Biexponential T1ρ relaxation mapping of human knee cartilage in vivo at 3 T. NMR Biomed. 2017, 30, e3760. [Google Scholar] [CrossRef]
- Sharafi, A.; Chang, G.; Regatte, R.R. Bi-component T1ρ and T2 relaxation mapping of skeletal muscle in-vivo. Sci. Rep. 2017, 7, 14115. [Google Scholar] [CrossRef]
- Menon, R.G.; Sharafi, A.; Windschuh, J.; Regatte, R.R. Bi-exponential 3D-T1ρ mapping of whole brain at 3 T. Sci. Rep. 2018, 8, 1176. [Google Scholar] [CrossRef] [PubMed]
- Kijowski, R.; Wilson, J.J.; Liu, F. Bicomponent ultrashort echo time T2* analysis for assessment of patients with patellar tendinopathy. J. Magn. Reson. Imaging 2017, 46, 1441–1447. [Google Scholar] [CrossRef] [PubMed]
- Chang, E.Y.; Du, J.; Iwasaki, K.; Biswas, R.; Statum, S.; He, Q.; Bae, W.C.; Chung, C.B. Single- and Bi-component T2* analysis of tendon before and during tensile loading, using UTE sequences. J. Magn. Reson. Imaging 2015, 42, 114–120. [Google Scholar] [CrossRef] [PubMed]
- Breda, S.J.; Poot, D.H.; Papp, D.; de Vries, B.A.; Kotek, G.; Krestin, G.P.; Hernández-Tamames, J.A.; de Vos, R.; Oei, E.H. Tissue-Specific T2* Biomarkers in Patellar Tendinopathy by Subregional Quantification Using 3D Ultrashort Echo Time MRI. J. Magn. Reson. Imaging 2020, 52, 420–430. [Google Scholar] [CrossRef] [PubMed]
- Liu, J.; Nazaran, A.; Ma, Y.; Chen, H.; Zhu, Y.; Du, J.; Li, S.; Zhou, Q.; Zhao, Y. Single- and Bicomponent Analyses of T2⁎ Relaxation in Knee Tendon and Ligament by Using 3D Ultrashort Echo Time Cones (UTE Cones) Magnetic Resonance Imaging. BioMed Res. Int. 2019, 2019, 8597423. [Google Scholar] [CrossRef] [PubMed]
- Chang, E.; Du, J.; Statum, S.; Pauli, C.; Chung, C. Quantitative bi-component T2* analysis of histologically normal Achilles tendons. Muscle Ligaments Tendons J. 2015, 5, 58–62. [Google Scholar] [CrossRef]
- Juras, V.; Apprich, S.; Szomolanyi, P.; Bieri, O.; Deligianni, X.; Trattnig, S. Bi-exponential T2* analysis of healthy and diseased Achilles tendons: An in vivo preliminary magnetic resonance study and correlation with clinical score. Eur. Radiol. 2013, 23, 2814–2822. [Google Scholar] [CrossRef] [PubMed]
- Zeineb, T.; Mokhtar, M.; Chelli, M.B. Estimation of T2* values in healthy and pathologic achilles tendon: Mono and bi exponential analysis. In Proceedings of the 2018 15th International Multi-Conference on Systems, Signals & Devices (SSD), Yasmine Hammamet, Tunisia, 19–22 March 2018; pp. 269–273. [Google Scholar]
- Wang, J.H.-C. Mechanobiology of tendon. J. Biomech. 2006, 39, 1563–1582. [Google Scholar] [CrossRef]
- Godinho, M.S.C.; Thorpe, C.T.; Greenwald, S.E.; Screen, H.R.C. Elastin is localised to the interfascicular matrix of energy storing tendons and becomes increasingly disorganised with ageing. Sci. Rep. 2017, 7, 9713. [Google Scholar] [CrossRef]
- Peto, S.; Gillis, P.; Henri, V. Structure and dynamics of water in tendon from NMR relaxation measurements. Biophys. J. 1990, 57, 71–84. [Google Scholar] [CrossRef]
- Sharafi, A.; Baboli, R.; Chang, G.; Regatte, R.R. 3D-T1ρ prepared zero echo time-based PETRA sequence for in vivo biexponential relaxation mapping of semisolid short-T2 tissues at 3 T. J. Magn. Reson. Imaging 2019, 50, 1207–1218. [Google Scholar] [CrossRef] [PubMed]
- Du, J.; Carl, M.; Diaz, E.; Takahashi, A.; Han, E.; Szeverenyi, N.M.; Chung, C.B.; Bydder, G.M. Ultrashort TE T1rho (UTE T1rho) imaging of the Achilles tendon and meniscus. Magn. Reson. Med. 2010, 64, 834–842. [Google Scholar] [CrossRef] [PubMed]
- Du, J.; Statum, S.; Znamirowski, R.; Bydder, G.M.; Chung, C.B. Ultrashort TE T1ρ magic angle imaging. Magn. Reson. Med. 2013, 69, 682–687. [Google Scholar] [CrossRef] [PubMed]
- Ma, Y.; Carl, M.; Shao, H.; Tadros, A.S.; Chang, E.Y.; Du, J. Three-dimensional ultrashort echo time cones T1ρ (3D UTE-cones-T1ρ) imaging. NMR Biomed. 2017, 30, e3709. [Google Scholar] [CrossRef] [PubMed]
- Li, X.; Han, E.T.; Ma, B.; Busse, R.F.; Majumdar, S. In vivo T1ρ mapping in cartilage using 3D magnetization-prepared angle-modulated partitioned k-space spoiled gradient echo snapshots (3D MAPSS). Magn. Reson. Med. 2008, 59, 298–307. [Google Scholar] [CrossRef] [PubMed]
- Juras, V.; Zbyn, S.; Pressl, C.; Valkovic, L.; Szomolanyi, P.; Frollo, I.; Trattnig, S. Regional variations of T2* in healthy and pathologic achilles tendon in vivo at 7 Tesla: Preliminary results. Magn. Reson. Med. 2012, 68, 1607–1613. [Google Scholar] [CrossRef] [PubMed]
- Liu, F.; Kijowski, R. Assessment of different fitting methods for in-vivo bi-component T2* analysis of human patellar tendon in magnetic resonance imaging. Muscle Ligaments Tendons J. 2017, 7, 163. [Google Scholar] [CrossRef] [PubMed]
- Jang, H.; McMillan, A.B.; Ma, Y.; Jerban, S.; Chang, E.Y.; Du, J.; Kijowski, R. Rapid single scan ramped hybrid-encoding for bicomponent T2* mapping in a human knee joint: A feasibility study. NMR Biomed. 2020, 33, e4391. [Google Scholar] [CrossRef]
- Bydder, M.; Carl, M.; Bydder, G.M.; Du, J. MRI chemical shift artifact produced by center-out radial sampling of k-space: A potential pitfall in clinical diagnosis. Quant. Imaging Med. Surg. 2021, 11, 3677–3683. [Google Scholar] [CrossRef]
- Chen, Y.; Li, L.; Le, N.; Chang, E.Y.; Huang, W.; Ma, Y. On the fat saturation effect in quantitative ultrashort TE MR imaging. Magn. Reson. Med. 2022, 87, 2388–2397. [Google Scholar] [CrossRef]
- Ma, Y.; Jerban, S.; Jang, H.; Chang, E.Y.; Du, J. Fat suppression for ultrashort echo time imaging using a novel soft-hard composite radiofrequency pulse. Magn. Reson. Med. 2019, 82, 2178–2187. [Google Scholar] [CrossRef] [PubMed]
- Jang, H.; Carl, M.; Ma, Y.; Jerban, S.; Guo, T.; Zhao, W.; Chang, E.Y.; Du, J. Fat suppression for ultrashort echo time imaging using a single-point Dixon method. NMR Biomed. 2019, 32, e4069. [Google Scholar] [CrossRef] [PubMed]
- Wang, N.; Xia, Y. Anisotropic analysis of multi-component T2 and T1ρ relaxations in achilles tendon by NMR spectroscopy and microscopic MRI. J. Magn. Reson. Imaging 2013, 38, 625–633. [Google Scholar] [CrossRef] [PubMed]
- Hager, B.; Schreiner, M.M.; Walzer, S.M.; Hirtler, L.; Mlynarik, V.; Berg, A.; Deligianni, X.; Bieri, O.; Windhager, R.; Trattnig, S.; et al. Transverse relaxation anisotropy of the Achilles and patellar tendon studied by MR microscopy. J. Magn. Reson. Imaging 2022, 56, 1091–1103. [Google Scholar] [CrossRef] [PubMed]
- Wang, N.; Xia, Y. Dependencies of multi-component T2 and T1ρ relaxation on the anisotropy of collagen fibrils in bovine nasal cartilage. J. Magn. Reson. 2011, 212, 124–132. [Google Scholar] [CrossRef] [PubMed]
- Wu, M.; Ma, Y.; Wan, L.; Jerban, S.; Jang, H.; Chang, E.Y.; Du, J. Magic angle effect on adiabatic T 1ρ imaging of the Achilles tendon using 3D ultrashort echo time cones trajectory. NMR Biomed. 2020, 33, e4322. [Google Scholar] [CrossRef] [PubMed]
- Wu, M.; Ma, Y.; Kasibhatla, A.; Chen, M.; Jang, H.; Jerban, S.; Chang, E.Y.; Du, J. Convincing evidence for magic angle less-sensitive quantitative T1ρ imaging of articular cartilage using the 3D ultrashort echo time cones adiabatic T1ρ (3D UTE Cones-AdiabT1ρ) Sequence. Magn. Reson. Med. 2020, 84, 2551–2560. [Google Scholar] [CrossRef]
- Hänninen, N.; Rautiainen, J.; Rieppo, L.; Saarakkala, S.; Nissi, M.J. Orientation anisotropy of quantitative MRI relaxation parameters in ordered tissue. Sci. Rep. 2017, 7, 9606. [Google Scholar] [CrossRef]
- Athertya, J.S.; Ma, Y.; Afsahi, A.M.; Lombardi, A.F.; Moazamian, D.; Jerban, S.; Sedaghat, S.; Jang, H. Accelerated Quantitative 3D UTE-Cones Imaging Using Compressed Sensing. Sensors 2022, 22, 7459. [Google Scholar] [CrossRef]
- Nelson, T.; Tung, S. Temperature dependence of proton relaxation times in vitro. Magn. Reson. Imaging 1987, 5, 189–199. [Google Scholar] [CrossRef]


| Sample ID | Monoexponential Analysis | Bi-Exponential Analysis | ||
|---|---|---|---|---|
| T1ρ (ms) | T1ρ (Short) (ms) | T1 ρ (Long) (ms) | Fraction (Short) (%) | |
| Knee 1 | 10.6 ± 0.8 | 6.5 ± 0.4 | 34.2 ± 5.2 | 74.7 ± 4.3 |
| Knee 2 | 7.1 ± 0.3 | 5.1 ± 0.1 | 26.6 ± 1.9 | 82.5 ± 1.5 |
| Knee 3 | 10.3 ± 0.6 | 6.4 ± 0.2 | 27.4 ± 1.9 | 71.5 ± 2.6 |
| Knee 4 | 7.6 ± 0.6 | 4.6 ± 0.3 | 26.2 ± 3.4 | 75.2 ± 3.6 |
| Knee 5 | 6.5 ± 0.3 | 4.9 ± 0.3 | 22.7 ± 6.2 | 83.9 ± 5.7 |
| Mean ± SD | 8.4 ± 1.7 | 5.5 ± 0.8 | 27.4 ± 3.8 | 77.6 ± 4.8 |
Disclaimer/Publisher’s Note: The statements, opinions and data contained in all publications are solely those of the individual author(s) and contributor(s) and not of MDPI and/or the editor(s). MDPI and/or the editor(s) disclaim responsibility for any injury to people or property resulting from any ideas, methods, instructions or products referred to in the content. |
© 2024 by the authors. Licensee MDPI, Basel, Switzerland. This article is an open access article distributed under the terms and conditions of the Creative Commons Attribution (CC BY) license (https://creativecommons.org/licenses/by/4.0/).
Share and Cite
Malhi, B.S.; Moazamian, D.; Shin, S.H.; Athertya, J.S.; Silva, L.; Jerban, S.; Jang, H.; Chang, E.; Ma, Y.; Carl, M.; et al. Bi-Exponential 3D UTE-T1ρ Relaxation Mapping of Ex Vivo Human Knee Patellar Tendon at 3T. Bioengineering 2024, 11, 66. https://doi.org/10.3390/bioengineering11010066
Malhi BS, Moazamian D, Shin SH, Athertya JS, Silva L, Jerban S, Jang H, Chang E, Ma Y, Carl M, et al. Bi-Exponential 3D UTE-T1ρ Relaxation Mapping of Ex Vivo Human Knee Patellar Tendon at 3T. Bioengineering. 2024; 11(1):66. https://doi.org/10.3390/bioengineering11010066
Chicago/Turabian StyleMalhi, Bhavsimran Singh, Dina Moazamian, Soo Hyun Shin, Jiyo S. Athertya, Livia Silva, Saeed Jerban, Hyungseok Jang, Eric Chang, Yajun Ma, Michael Carl, and et al. 2024. "Bi-Exponential 3D UTE-T1ρ Relaxation Mapping of Ex Vivo Human Knee Patellar Tendon at 3T" Bioengineering 11, no. 1: 66. https://doi.org/10.3390/bioengineering11010066