

Evidence in Clinical Studies for the Role of Wall Thickness in Ascending Thoracic Aortic Aneurysms: A Scoping Review

Abstract
:
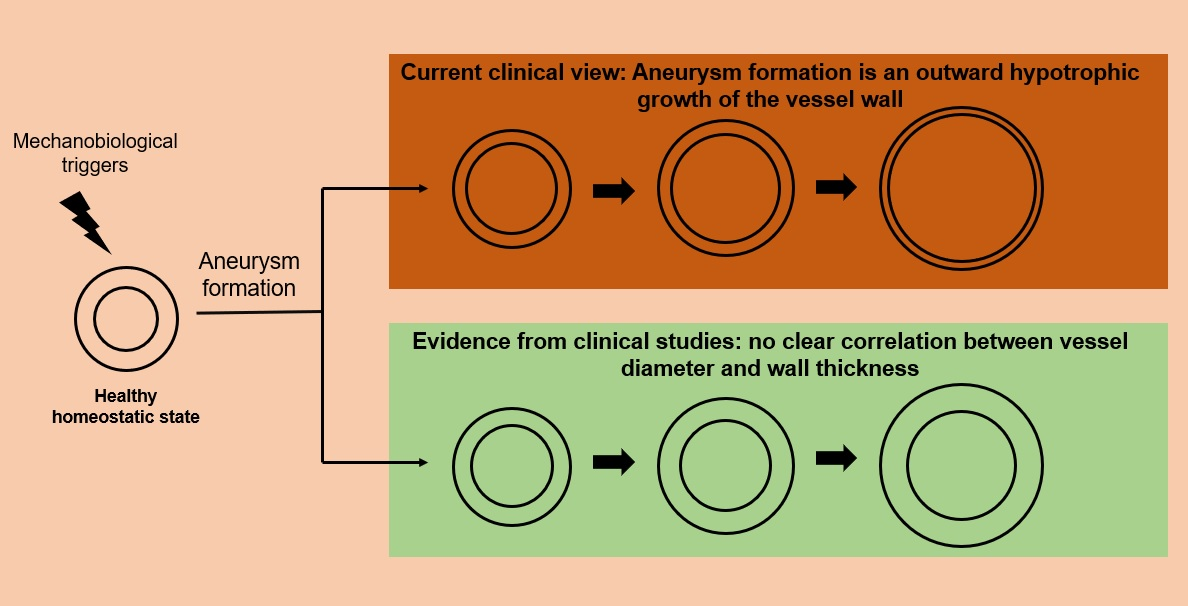
1. Introduction
2. Methods
2.1. Protocol and Registration
2.2. Search Strategy and Study Selection
2.3. Study Selection and Data Extraction
2.4. Risk of Bias
2.5. Summary of Measures
3. Results
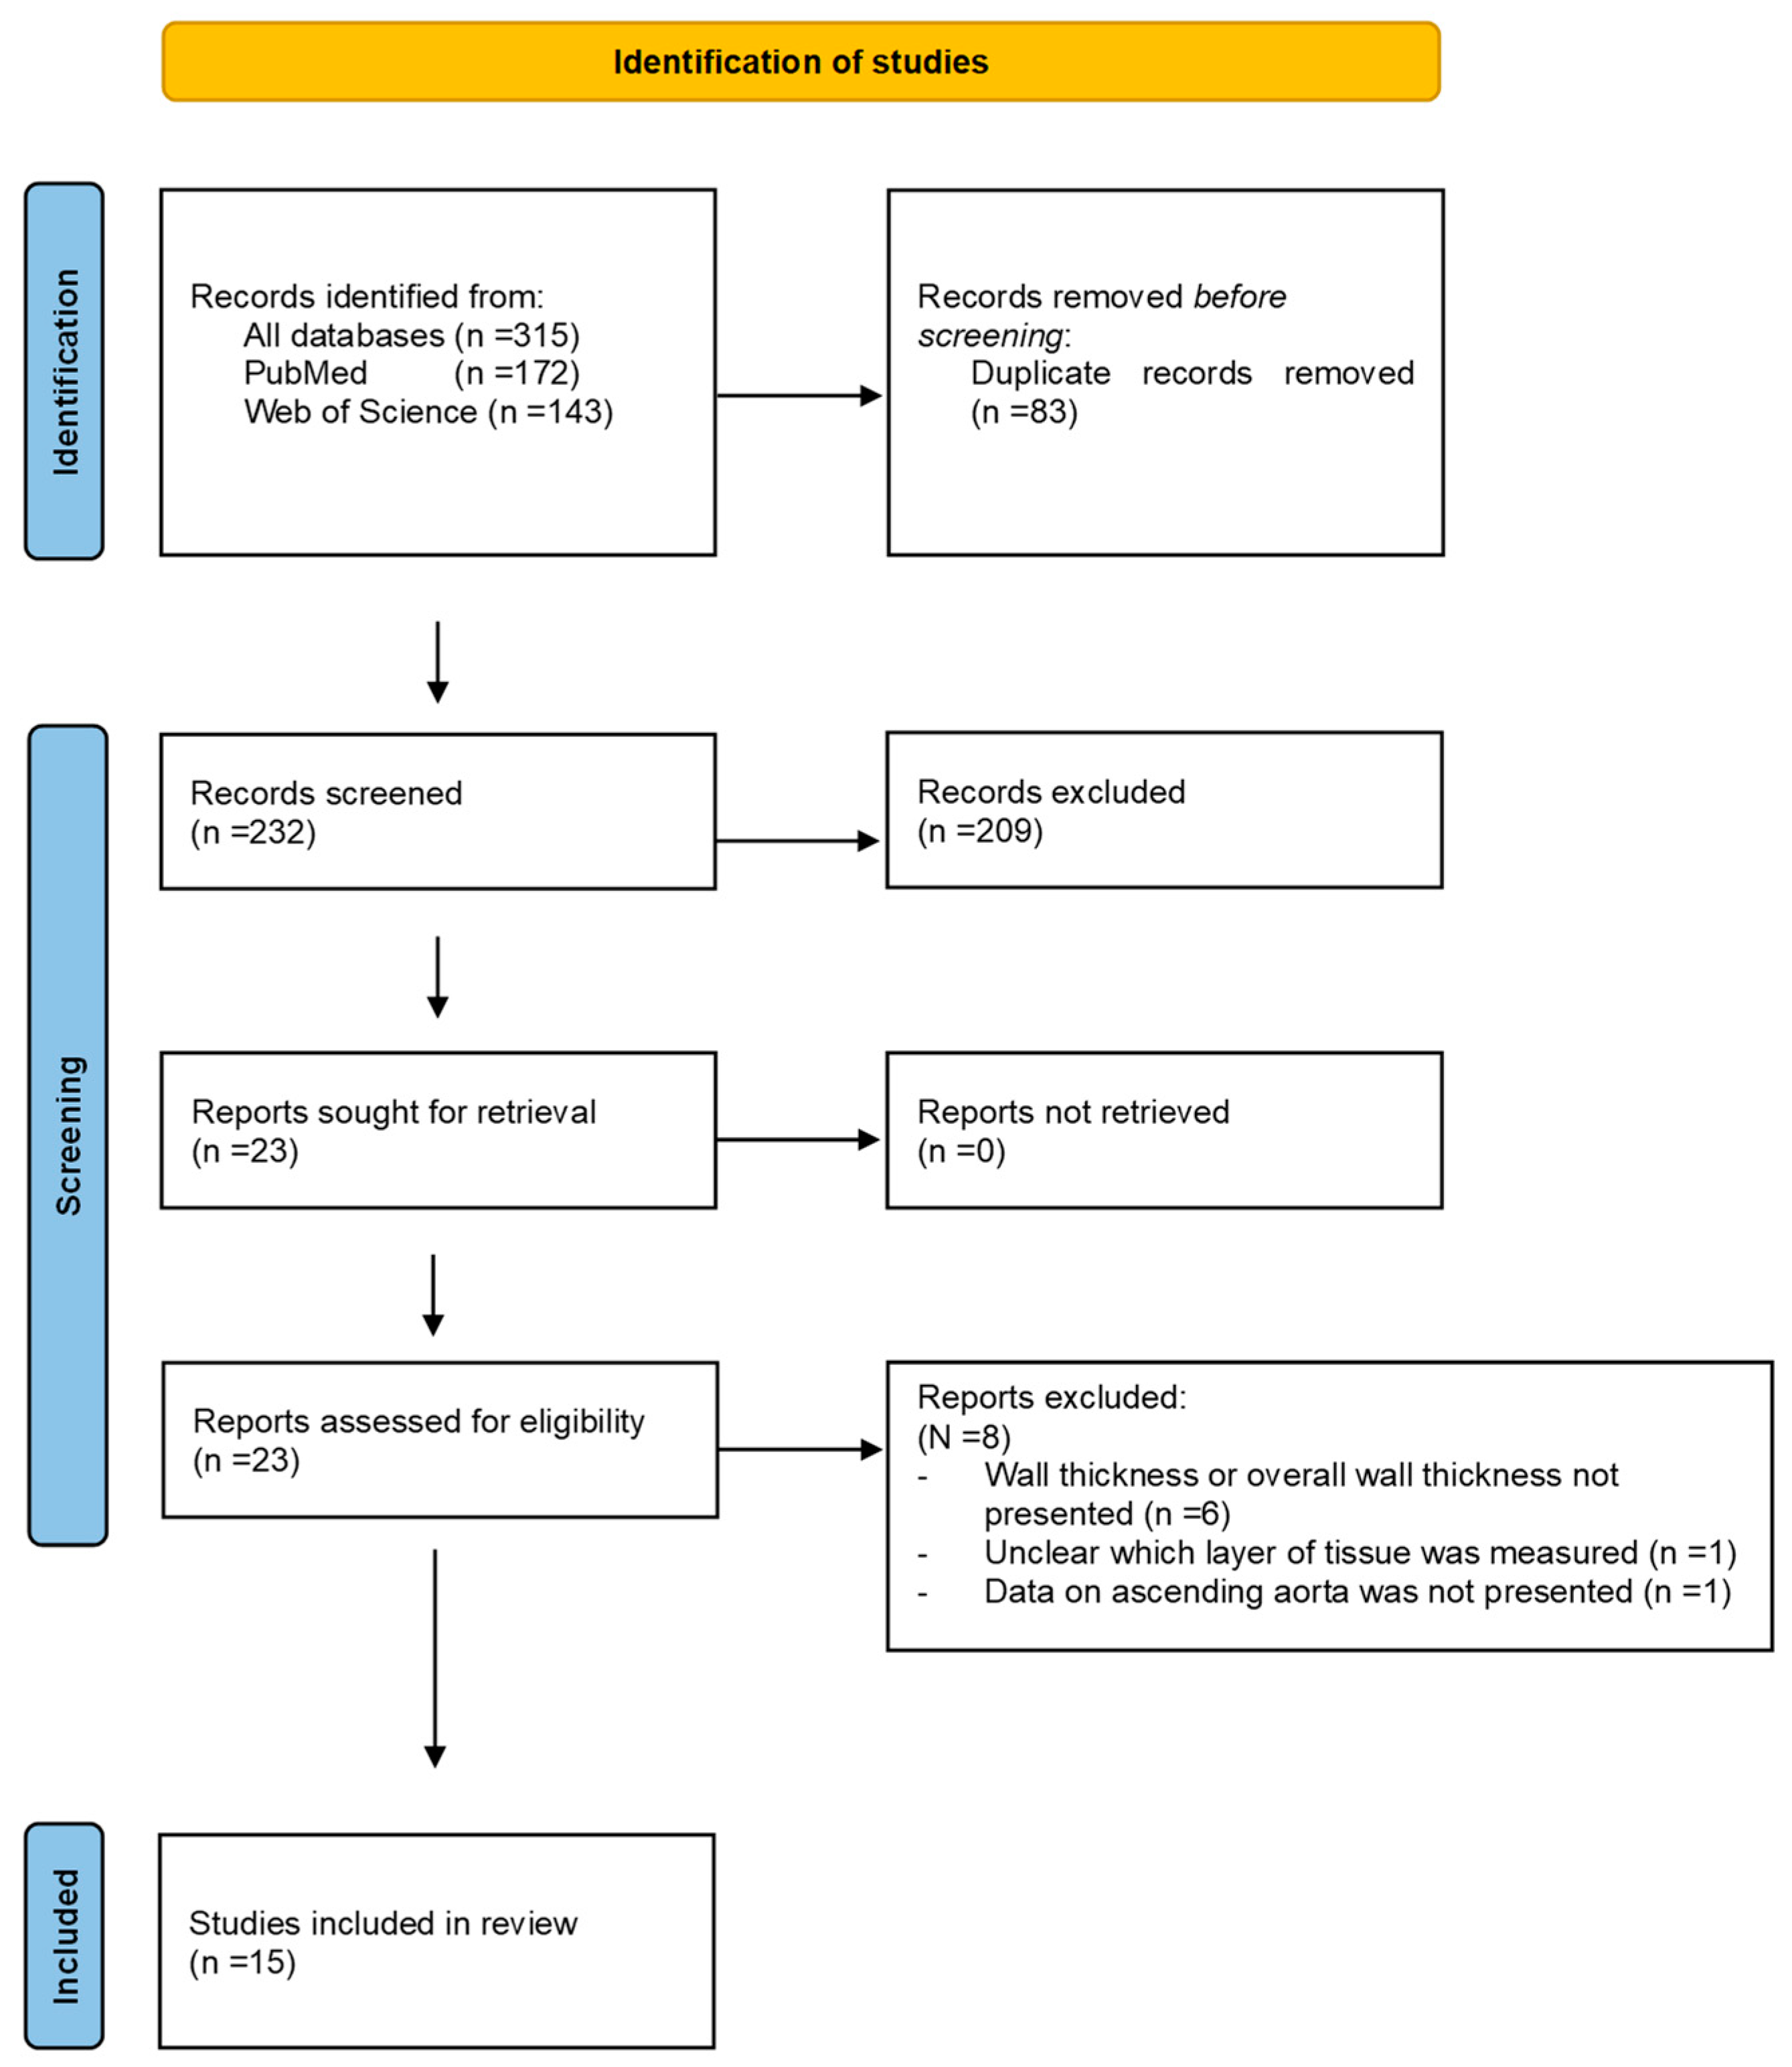
3.1. Study Selection
3.2. Risk of Bias
3.3. Study Characteristics
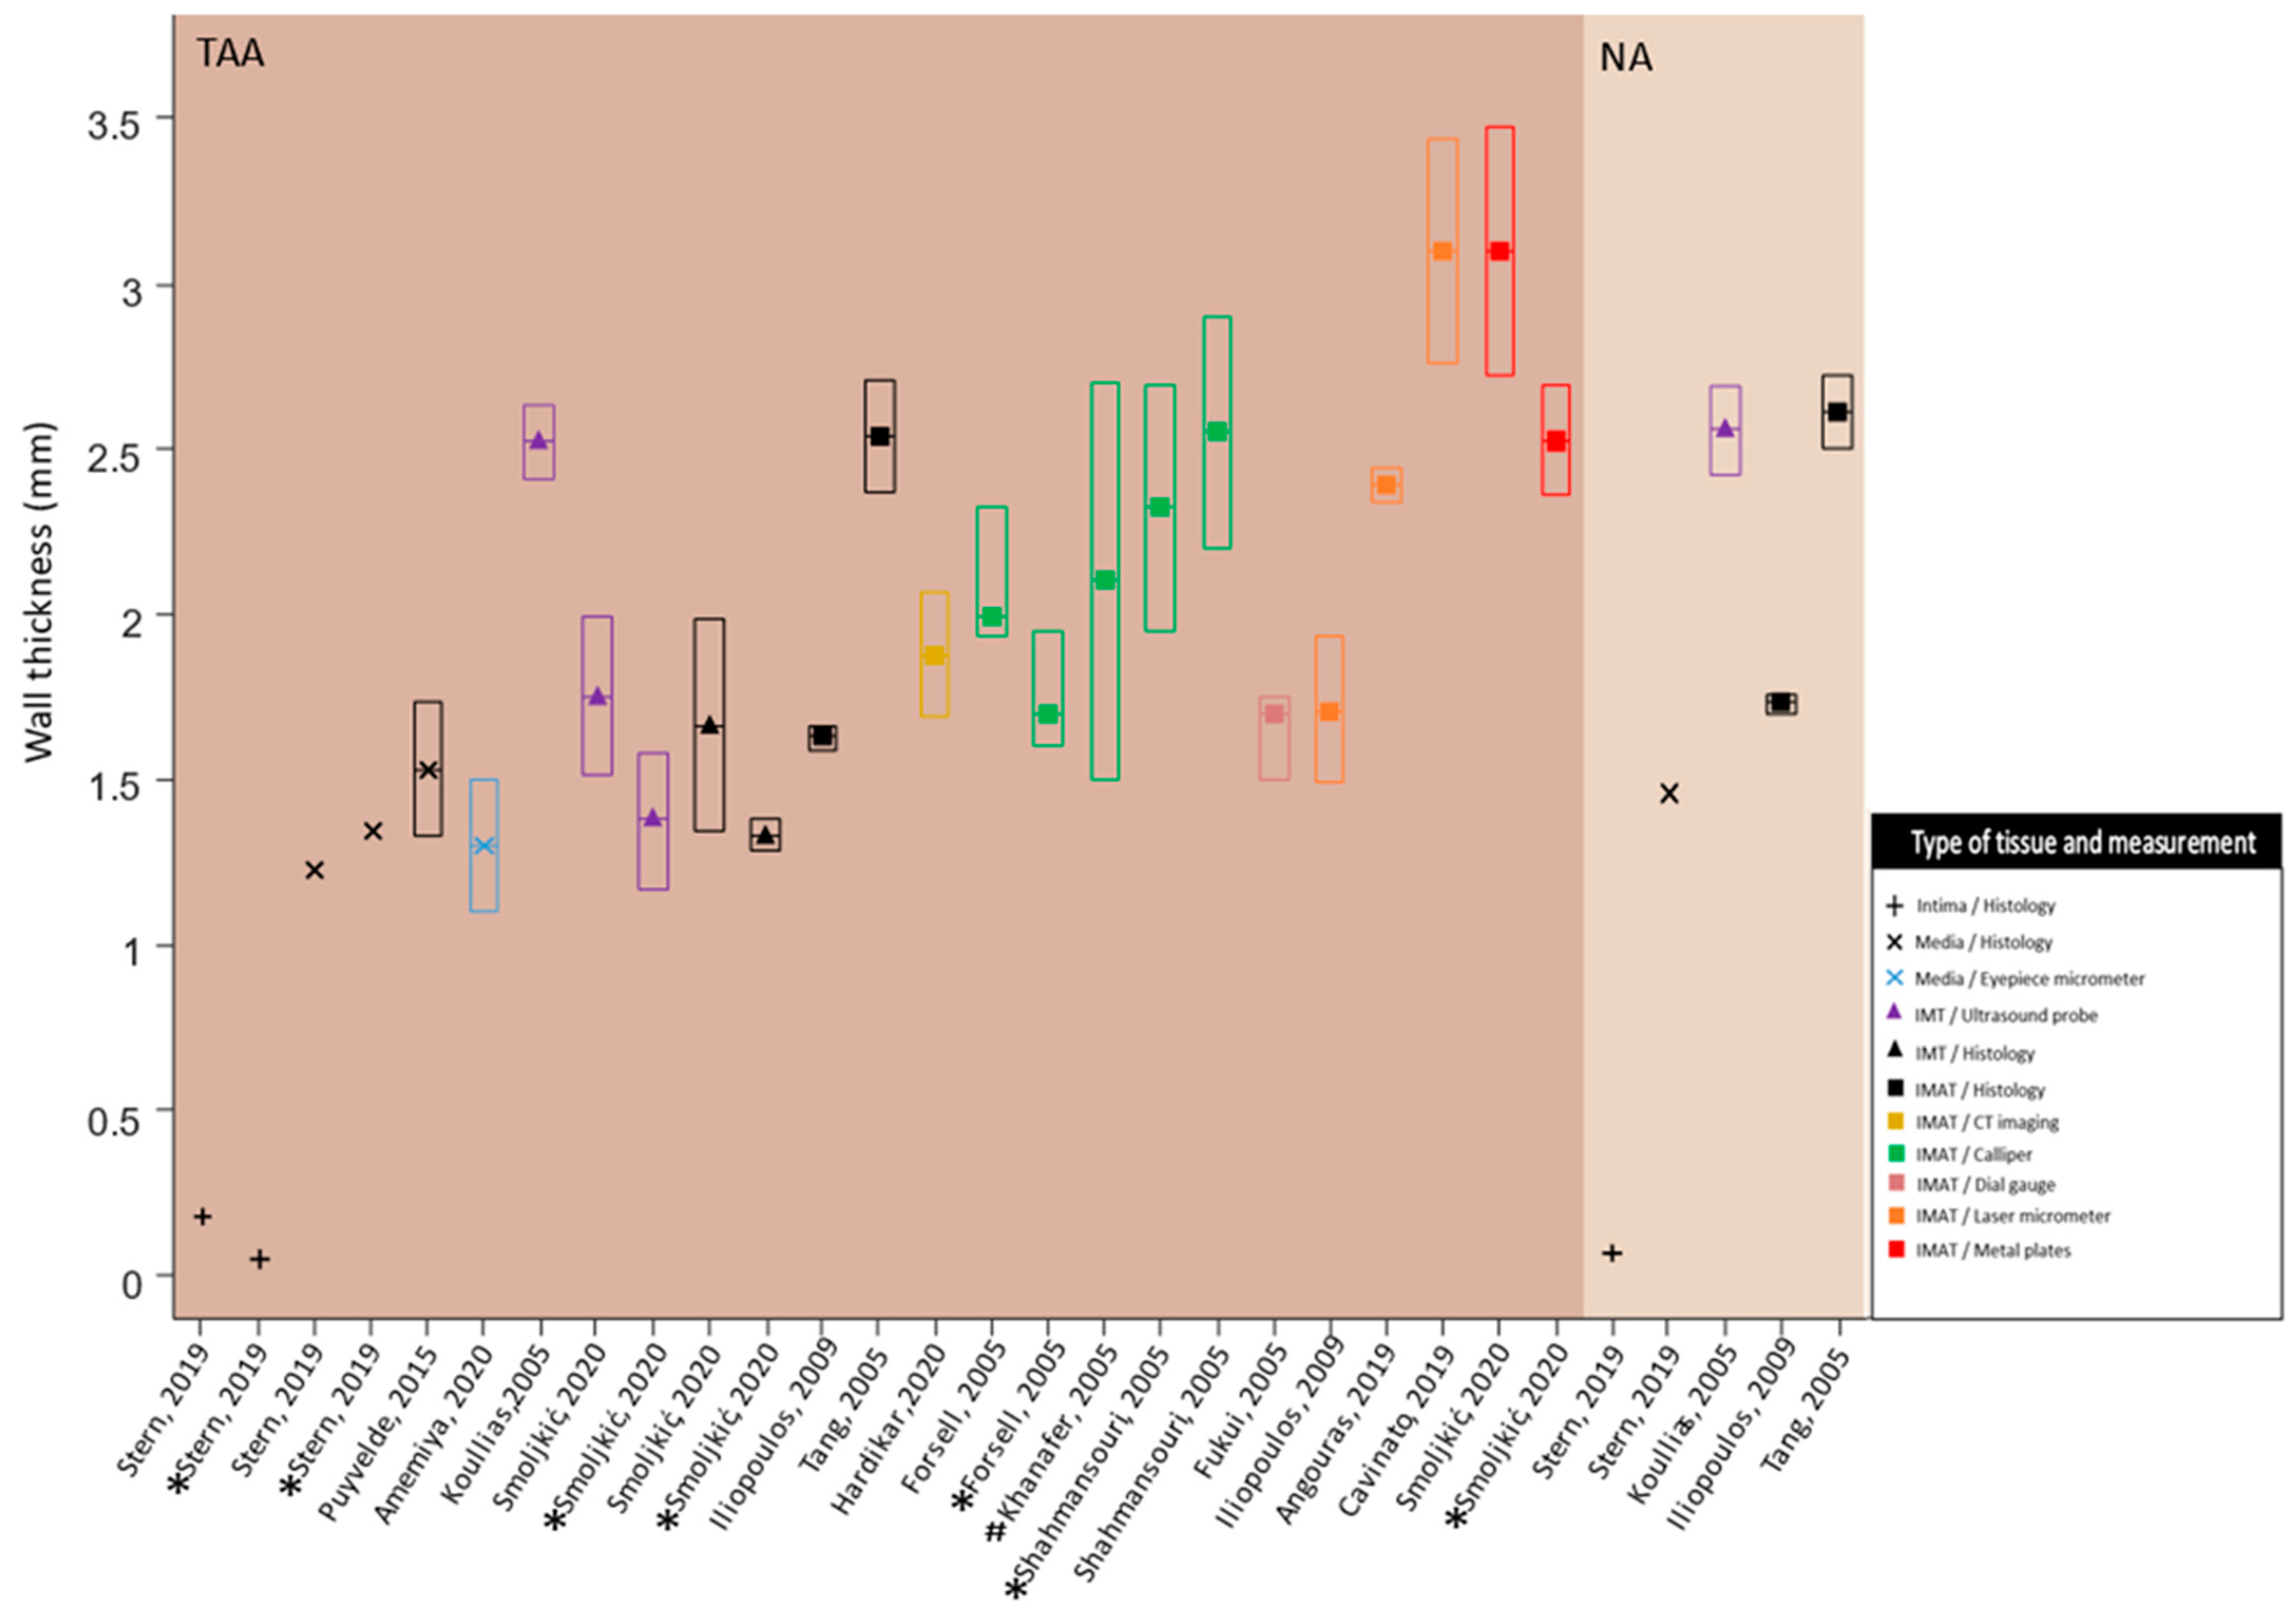
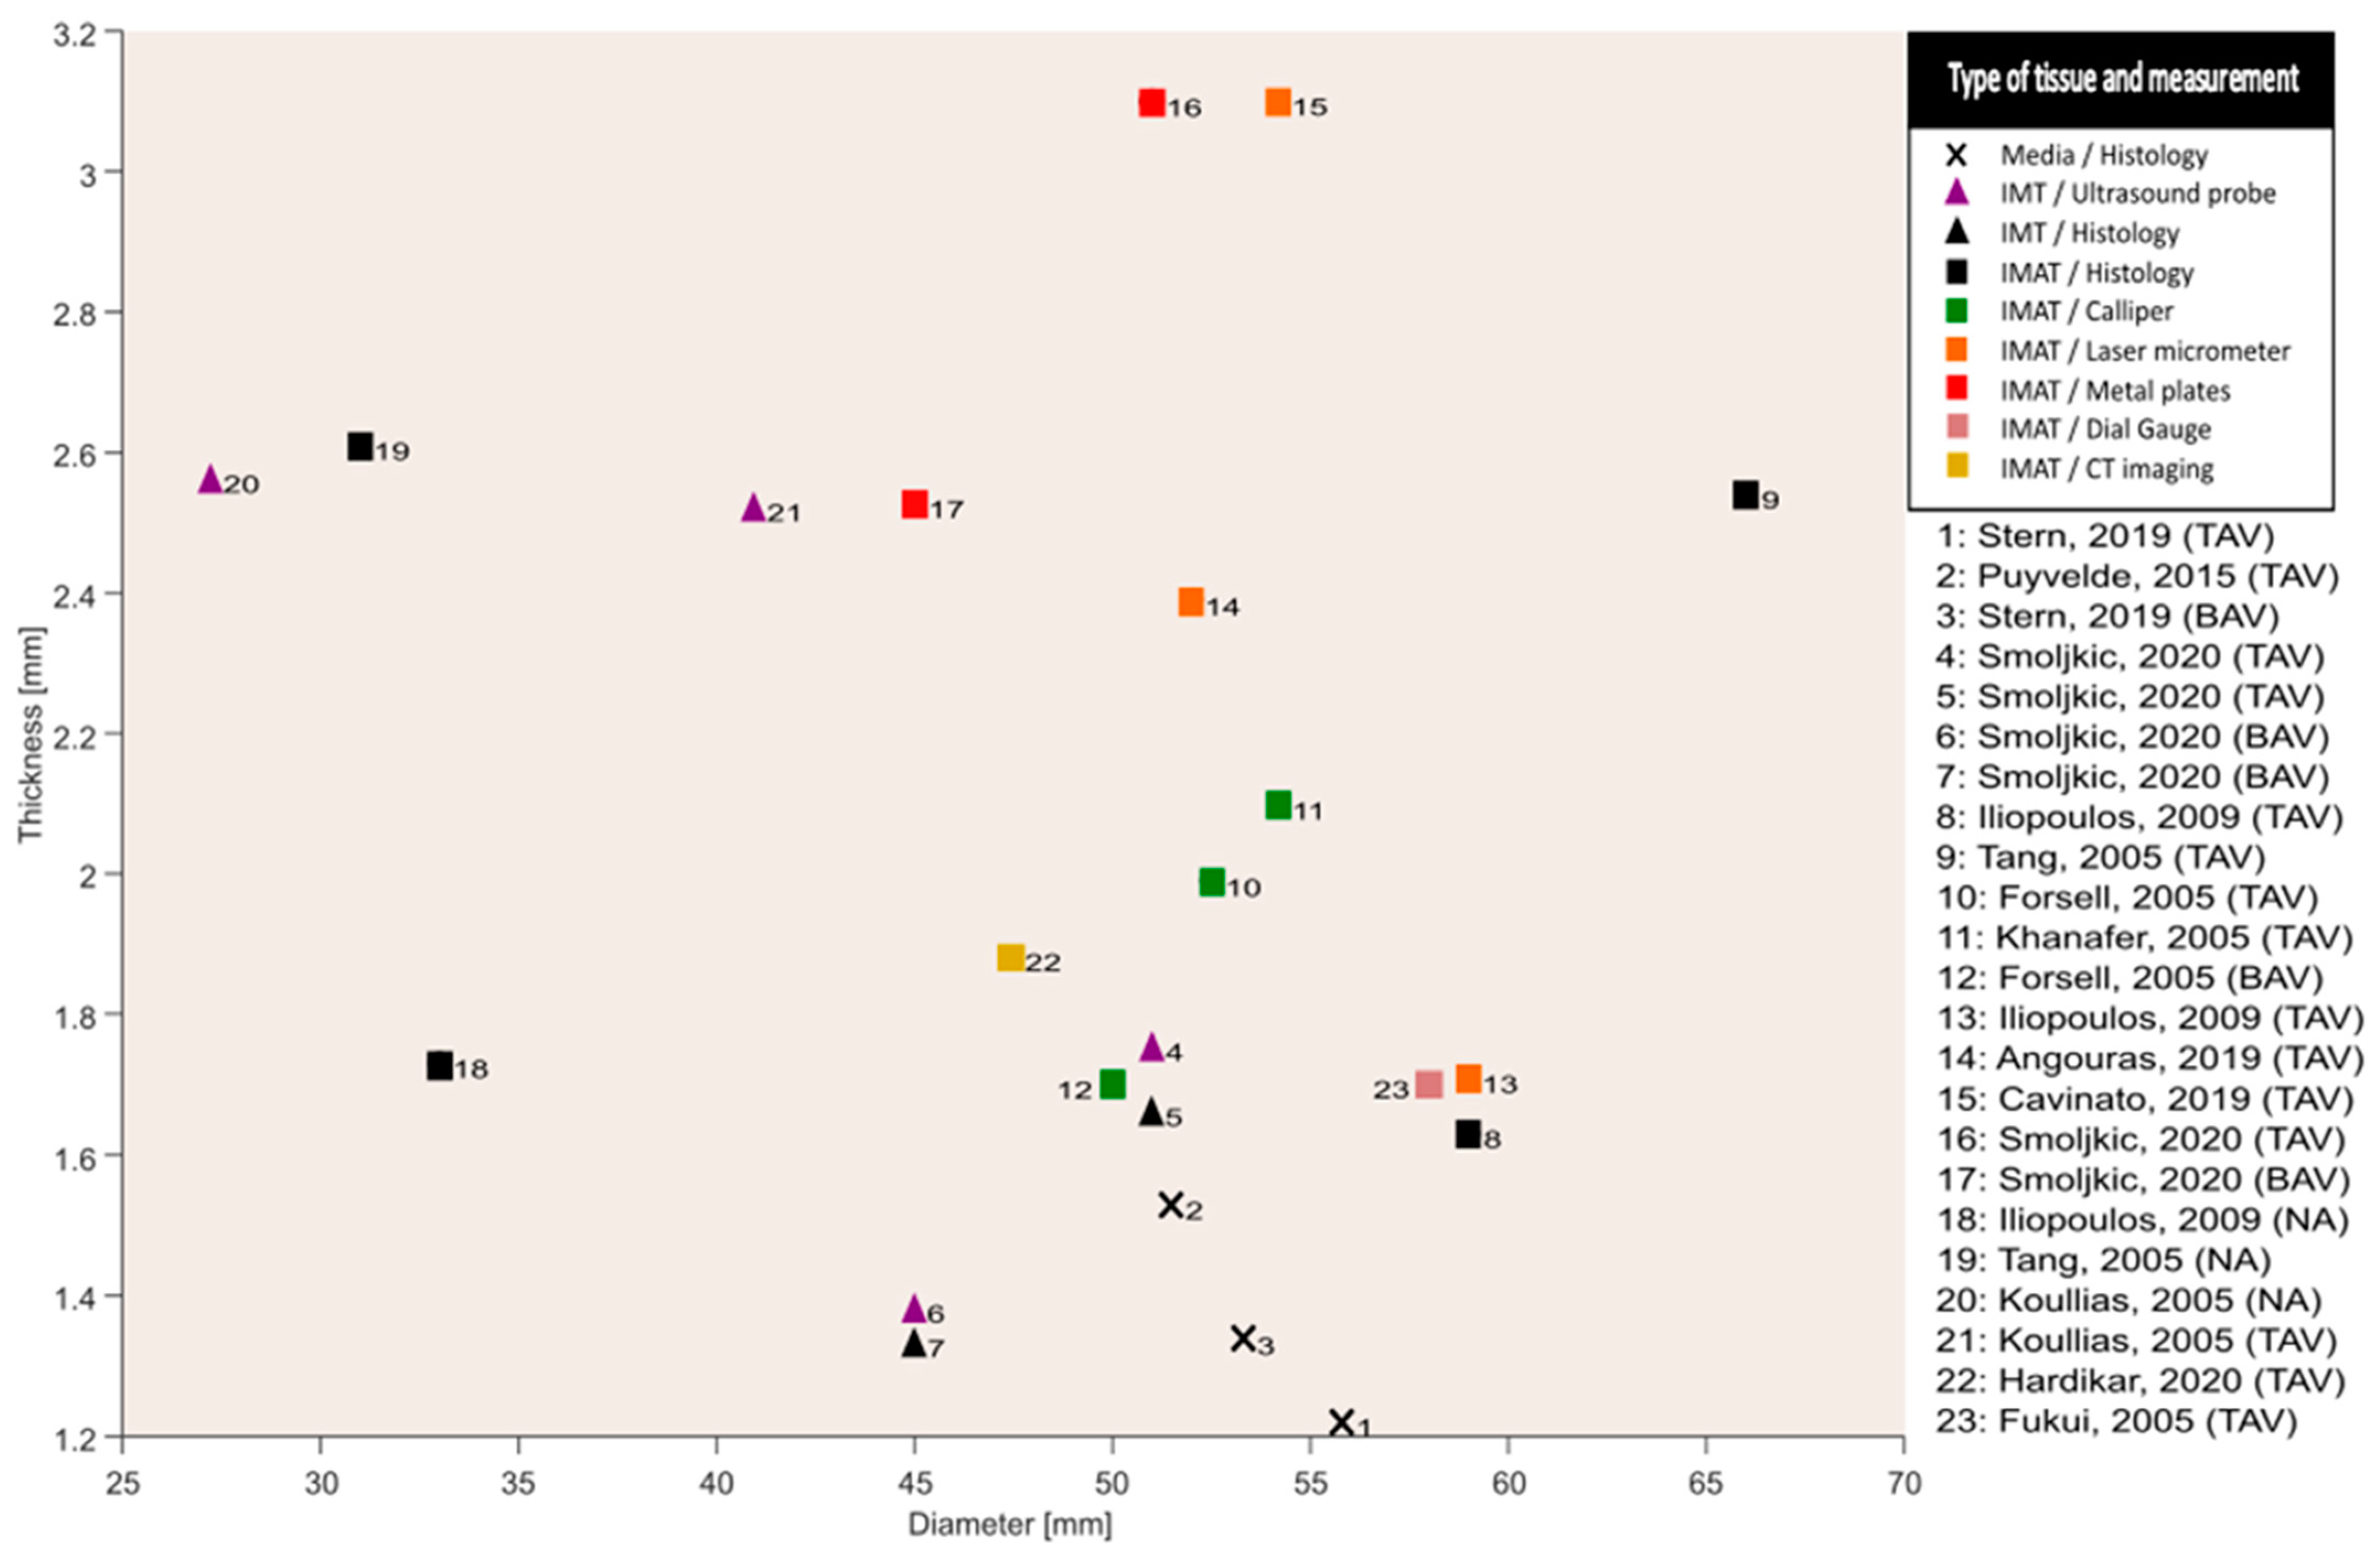
3.4. Wall Thickness Characteristics
4. Discussion
4.1. Wall Thickness Data
4.2. Interpretation
4.3. Limitations
5. Conclusions
Supplementary Materials
Author Contributions
Funding
Institutional Review Board Statement
Informed Consent Statement
Data Availability Statement
Conflicts of Interest
References
- Saliba, E.; Sia, Y. In collaboration w. The ascending aortic aneurysm: When to intervene? Int. J. Cardiol. Heart Vasc. 2015, 6, 91–100. [Google Scholar]
- Hiratzka, L.F.; Bakris, G.L.; Beckman, J.A.; Bersin, R.M.; Carr, V.F.; Casey, D.E., Jr.; Eagle, K.A.; Hermann, L.K.; Isselbacher, E.M.; Kazerooni, E.A.; et al. 2010 ACCF/AHA/AATS/ACR/ASA/SCA/SCAI/SIR/STS/SVM Guidelines for the diagnosis and management of patients with thoracic aortic disease. A Report of the American College of Cardiology Foundation/American Heart Association Task Force on Practice Guidelines, American Association for Thoracic Surgery, American College of Radiology, American Stroke Association, Society of Cardiovascular Anesthesiologists, Society for Cardiovascular Angiography and Interventions, Society of Interventional Radiology, Society of Thoracic Surgeons, and Society for Vascular Medicine. J. Am. Coll. Cardiol. 2010, 55, e27–e129. [Google Scholar]
- Guo, D.; Papke, C.L.; He, R.; Milewicz, D.M. Pathogenesis of Thoracic and Abdominal Aortic Aneurysms. Ann. N. Y. Acad. Sci. 2006, 1085, 339–352. [Google Scholar] [CrossRef]
- Gomez, A.; Wang, Z.; Xuan, Y.; Hope, M.D.; Saloner, D.A.; Guccione, J.M.; Ge, L.; Tseng, E.E. Association of diameter and wall stresses of tricuspid aortic valve ascending thoracic aortic aneurysms. J. Thorac. Cardiovasc. Surg. 2021, 164, 1365–1375. [Google Scholar] [CrossRef]
- Tozzi, P.; Gunga, Z.; Niclauss, L.; Delay, D.; Roumy, A.; Pfister, R.; Colombier, S.; Patella, F.; Qanadli, S.D.; Kirsch, M. Type A aortic dissection in aneurysms having modelled pre-dissection maximum diameter below 45 mm: Should we implement current guidelines to improve the survival benefit of prophylactic surgery? Eur. J. Cardio-Thorac. Surg. Off. J. Eur. Assoc. Cardio-Thorac. Surg. 2021, 59, 473–478. [Google Scholar] [CrossRef]
- Papakonstantinou, N.A.; Rorris, F.P. Elective replacement of the ascending aorta: Is the 5.5-cm threshold appropriate? The insidious, small aorta. Eur. J. Cardio-Thorac. Surg. Off. J. Eur. Assoc. Cardio-Thorac. Surg. 2021, 59, 554–561. [Google Scholar] [CrossRef]
- Rylski, B.; Branchetti, E.; Bavaria, J.E.; Vallabhajosyula, P.; Szeto, W.Y.; Milewski, R.K.; Desai, N.D. Modeling of predissection aortic size in acute type A dissection: More than 90% fail to meet the guidelines for elective ascending replacement. J. Thorac. Cardiovasc. Surg. 2014, 148, 944–948.e1. [Google Scholar] [CrossRef] [Green Version]
- Hayashi, K.; Naiki, T. Adaptation and remodeling of vascular wall; biomechanical response to hypertension. J. Mech. Behav. Biomed. Mater. 2009, 2, 3–19. [Google Scholar] [CrossRef]
- Humphrey, J.D.; Milewicz, D.M.; Tellides, G.; Schwartz, M.A. Dysfunctional Mechanosensing in Aneurysms. Science 2014, 344, 477–479. [Google Scholar] [CrossRef] [Green Version]
- Kassab, G.S. Biomechanics of the cardiovascular system: The aorta as an illustratory example. J. R. Soc. Interface 2006, 3, 719–740. [Google Scholar] [CrossRef] [Green Version]
- Page, M.J.; McKenzie, J.E.; Bossuyt, P.M.; Boutron, I.; Hoffmann, T.C.; Mulrow, C.D.; Shamseer, L.; Tetzlaff, J.M.; Akl, E.A.; Brennan, S.E.; et al. The PRISMA 2020 statement: An updated guideline for reporting systematic reviews. BMJ 2021, 372, n71. [Google Scholar] [CrossRef]
- National Heart Lung, and Blood Institute. Study Quality Assessment Tools: National Heart, Lung, and Blood Institute. 2021. Available online: https://www.nhlbi.nih.gov/health-topics/study-quality-assessment-tools (accessed on 20 October 2021).
- Mahdieh, A.; Mohsen, S. Practical calculation of mean, pooled variance, variance, and standard deviation, in meta-analysis studies. Nurs. Pract. Today 2020, 7, 5–11. [Google Scholar]
- Roberts, D.; Roberts, F. Standard Normal Distribution Fulton, New York, USA. 2014. Available online: https://mathbitsnotebook.com/Algebra2/Statistics/STstandardNormalDistribution.html (accessed on 10 October 2021).
- Amemiya, K.; Mousseaux, E.; Ishibashi-Ueda, H.; Achouh, P.; Ochiai, M.; Bruneval, P. Impact of histopathological changes in ascending aortic diseases. Int. J. Cardiol. 2020, 311, 91–96. [Google Scholar] [CrossRef]
- Angouras, D.C.; Kritharis, E.P.; Sokolis, D.P. Regional distribution of delamination strength in ascending thoracic aortic aneurysms. J. Mech. Behav. Biomed. Mater. 2019, 98, 58–70. [Google Scholar] [CrossRef]
- Cavinato, C.; Molimard, J.; Curt, N.; Campisi, S.; Orgéas, L.; Badel, P. Does the Knowledge of the Local Thickness of Human Ascending Thoracic Aneurysm Walls Improve Their Mechanical Analysis? Front. Bioeng. Biotechnol. 2019, 7, 169. [Google Scholar] [CrossRef] [Green Version]
- Forsell, C.; Björck, H.M.; Eriksson, P.; Franco-Cereceda, A.; Gasser, T.C. Biomechanical Properties of the Thoracic Aneurysmal Wall: Differences Between Bicuspid Aortic Valve and Tricuspid Aortic Valve Patients. Ann. Thorac. Surg. 2014, 98, 65–71. [Google Scholar] [CrossRef]
- Fukui, T.; Matsumoto, T.; Tanaka, T.; Ohashi, T.; Kumagai, K.; Akimoto, H.; Tabayashi, K.; Sato, M. In vivo mechanical properties of thoracic aortic aneurysmal wall estimated from in vitro biaxial tensile test. Bio.-Med. Mater. Eng. 2005, 15, 295–305. [Google Scholar]
- Hardikar, A.; Harle, R.; Marwick, T.H. Aortic Thickness: A Forgotten Paradigm in Risk Stratification of Aortic Disease. AORTA 2020, 08, 132–140. [Google Scholar] [CrossRef]
- Iliopoulos, D.C.; Kritharis, E.P.; Giagini, A.T.; Papadodima, S.A.; Sokolis, D.P. Ascending thoracic aortic aneurysms are associated with compositional remodeling and vessel stiffening but not weakening in age-matched subjects. J. Thorac. Cardiovasc. Surg. 2009, 137, 101–109. [Google Scholar] [CrossRef] [Green Version]
- Iliopoulos, D.C.; Deveja, R.P.; Kritharis, E.P.; Perrea, D.; Sionis, G.D.; Toutouzas, K.; Stefanadis, C.; Sokolis, D.P. Regional and directional variations in the mechanical properties of ascending thoracic aortic aneurysms. Med. Eng. Phys. 2009, 31, 1–9. [Google Scholar] [CrossRef]
- Khanafer, K.; Duprey, A.; Zainal, M.; Schlicht, M.; Williams, D.; Berguer, R. Determination of the elastic modulus of ascending thoracic aortic aneurysm at different ranges of pressure using uniaxial tensile testing. J. Thorac. Cardiovasc. Surg. 2011, 142, 682–686. [Google Scholar] [CrossRef] [Green Version]
- Koullias, G.; Modak, R.; Tranquilli, M.; Korkolis, D.P.; Barash, P.; Elefteriades, J.A. Mechanical deterioration underlies malignant behavior of aneurysmal human ascending aorta. J. Thorac. Cardiovasc. Surg. 2005, 130, 677–683. [Google Scholar] [CrossRef] [Green Version]
- Van Puyvelde, J.; Verbeken, E.; Verbrugghe, P.; Herijgers, P.; Meuris, B. Aortic wall thickness in patients with ascending aortic aneurysm versus acute aortic dissection. Eur. J. Cardio-Thorac. Surg. Off. J. Eur. Assoc. Cardio-Thorac. Surg. 2016, 49, 756–762. [Google Scholar] [CrossRef] [Green Version]
- Shahmansouri, N.; Alreshidan, M.; Emmott, A.; Lachapelle, K.; Cartier, R.; Leask, R.L.; Mongrain, R. Evaluating ascending aortic aneurysm tissue toughness: Dependence on collagen and elastin contents. J. Mech. Behav. Biomed. Mater. 2016, 64, 262–271. [Google Scholar] [CrossRef]
- Smoljkić, M.; Fehervary, H.; Bergh, P.V.D.; Jorge-Peñas, A.; Kluyskens, L.; Dymarkowski, S.; Verbrugghe, P.; Meuris, B.; Sloten, J.V.; Famaey, N. Biomechanical Characterization of Ascending Aortic Aneurysms. Biomech. Model. Mechanobiol. 2017, 16, 705–720. [Google Scholar] [CrossRef]
- Stern, C.; Scharinger, B.; Tuerkcan, A.; Nebert, C.; Mimler, T.; Baranyi, U.; Doppler, C.; Aschacher, T.; Andreas, M.; Stelzmueller, M.-E.; et al. Strong Signs for a Weak Wall in Tricuspid Aortic Valve Associated Aneurysms and a Role for Osteopontin in Bicuspid Aortic Valve Associated Aneurysms. Int. J. Mol. Sci. 2019, 20, 4782. [Google Scholar] [CrossRef] [Green Version]
- Tang, P.C.; Coady, M.A.; Lovoulos, C.; Dardik, A.; Aslan, M.; Elefteriades, J.A.; Tellides, G. Hyperplastic Cellular Remodeling of the Media in Ascending Thoracic Aortic Aneurysms. Circulation 2005, 112, 1098–1105. [Google Scholar] [CrossRef]
- Jaminon, A.; Reesink, K.; Kroon, A.; Schurgers, L. The Role of Vascular Smooth Muscle Cells in Arterial Remodeling: Focus on Calcification-Related Processes. Int. J. Mol. Sci. 2019, 20, 5694. [Google Scholar] [CrossRef] [Green Version]
- Bersi, M.R.; Khosravi, R.; Wujciak, A.J.; Harrison, D.G.; Humphrey, J.D. Differential cell-matrix mechanoadaptations and inflammation drive regional propensities to aortic fibrosis, aneurysm or dissection in hypertension. J. R. Soc. Interface 2017, 14, 20170327. [Google Scholar] [CrossRef] [Green Version]
- Goriely, A. The Mathematics and Mechanics of Biological Growth; Springer: Berlin/Heidelberg, Germany, 2017. [Google Scholar]
- Humphrey, J.D. Towards a Theory of Vascular Growth and Remodeling. In Mechanics of Biological Tissue; Springer: Berlin/Heidelberg, Germany, 2006; pp. 3–15. [Google Scholar] [CrossRef]
- Stålhand, J. Determination of human arterial wall parameters from clinical data. Biomech. Model. Mechanobiol. 2009, 8, 141–148. [Google Scholar] [CrossRef]
- D’Cruz, R.T.; Wee, I.J.Y.; Syn, N.L.; Choong, A. The association between diabetes and thoracic aortic aneurysms. J. Vasc. Surg. 2019, 69, 263–268.e1. [Google Scholar] [CrossRef]
- Burns, P.B.M.; Rohrich, R.J.M.; Chung, K.C.M. The Levels of Evidence and Their Role in Evidence-Based Medicine. Plast. Reconstr. Surg. 2011, 128, 305–310. [Google Scholar] [CrossRef] [Green Version]


| Cohort and Cross-Sectional Studies | 1. Research Question Clearly Described | 2. Study Population Clearly Described | 3. At Least 50%? Participation Rate | 4. In- and Exclusion Criteria Clearly Described | 5. Sample Size Justification Provided | 6. Exposure Measured Prior to outcome | 7. Timeframe Sufficient to See Association | 8. Different Levels of Exposure Measured | 9. Exposure Measures Clearly Defined | 10. Multiple Exposure Assessments over time | 11. Outcome Measures Clearly Defined | 12. Outcome Assessors Blinded to Exposure | 13. Loss to Follow-Up 20% or Less | 14. Correction for Confounding Variables | 15. Overall Rating of Quality |
|---|---|---|---|---|---|---|---|---|---|---|---|---|---|---|---|
| Angouras, 2019 [16] | Y | Y | NR | Y | N | Y | Y | Y | Y | NA | Y | NA | Y | N | F |
| Cavinato, 2019 [17] | Y | Y | NR | Y | N | Y | Y | Y | Y | NA | Y | NA | Y | NA | G |
| Forsell, 2014 [18] | Y | Y | NR | Y | N | Y | Y | Y | Y | NA | Y | NA | Y | Y | G |
| Fukui, 2005 [19] | Y | N | NR | Y | N | Y | Y | Y | Y | NA | Y | NA | N | N | P |
| Hardikar, 2020 [20] | Y | Y | Y | Y | N | Y | Y | Y | Y | N | Y | NA | Y | Y | G |
| Iliopoulos, 2009 [22] | Y | Y | NR | Y | N | Y | Y | Y | Y | NA | Y | NA | Y | NA | G |
| Khanafer, 2011 [23] | Y | N | NR | Y | N | Y | Y | Y | Y | NA | Y | NA | Y | N | F |
| Puyvelde, 2016 [25] | Y | Y | Y | N | N | Y | Y | Y | Y | NA | Y | NR | Y | Y | G |
| Shahmansouri, 2016 [26] | Y | N | NR | Y | N | Y | Y | Y | Y | NA | Y | Y | CD | Y | F |
| Smoljkić, 2017 [27] | Y | Y | NR | Y | N | Y | Y | Y | Y | NA | Y | N | NR | N | F |
| Case Control Studies | 1. Research Question clearly Described | 2. Study Population Clearly Described | 3. Sample Size Justification | 4. Controls from Same Population as Cases | 5. In- and Exclusion Criteria Clearly Described | 6. Cases/Controls Clearly Defined | 7. Randomization in Selecting Participants | 8. Concurrent Controls | 9. Exposure Occurred prior to Condition | 10. Exposure Clearly Defined | 11. Assessors of Exposure Blinded for Status | 12. Correction for Confounding Variables | 13. Overall Rating of Quality |
|---|---|---|---|---|---|---|---|---|---|---|---|---|---|
| Amemiya, 2020 [15] | Y | N | N | N | Y | Y | NA | N | NA | Y | Y | N | P |
| Iliopoulos, 2009 [21] | Y | Y | N | Y | Y | Y | NA | N | NA | NA | Y | Y | G |
| Koullias, 2005 [24] | Y | Y | N | Y | Y | Y | NA | N | Y | Y | N | Y | G |
| Stern, 2019 [28] | Y | Y | N | Y | Y | Y | NR | N | Y | Y | Y | Y | G |
| Tang, 2005 [29] | Y | Y | N | NR | Y | Y | NR | N | Y | Y | N | Y | F |
| No. | Study | Study Design | Study Population | Conclusion | |||
|---|---|---|---|---|---|---|---|
| Method | Result | Discussion | Total Score | ||||
| 1 | Amemiya et al., 2020 [15] | Case-control | 351 ATAA patient tissue samples with BAV (183, age 56 [46, 66], 21% female), and without BAV (168, age 66 [59, 74], 21% female). In total, 145 TAD patient tissue samples with BAV (8, age 43 [38, 53], 0% females), and without BAV (137, age 65 [55, 76], 37% female). | Media thickness of 5 μm thick paraffin-embedded tissue slices measured using an eyepiece micrometer | Medial wall thickness (TAA) = 1.3 [1.1, 1.5]; Medial wall thickness (TAD) = 1.5 [1.3, 1.8] | Medial degenerative changes (MDC) were observed. Non-BAV is associated with higher MDC scores as compared to BAV aortas. Higher MDC scores are correlated with increased aortic diameters. | 1 |
| 2 | Angouras et al., 2019 [16] | Cross-sectional | 17 ATAA patient tissue samples. Age 70 ± 3, 24% female. | Laser micrometer was made (Ls-3100; Keyence Corp, Osaka, Japan). Analysis performed for all four circumferential anatomical locations of the aortic ring. | Anterior = 2.37 ± 0.06; Right lateral = 2.19 ± 0.06; Posterior = 2.33 ± 0.08; Left lateral = 2.66 ± 0.07 | Region and not the wall thickness was the cause of reduced delamination strength of aortic tissue. Aortic diameter, which is the main indicator for surgical intervention had no effect on delamination and tensile strength of the tissue. | 1 |
| 3 | Cavinato et al., 2019 [17] | Cross-sectional | 12 unruptured ATAA tissue specimens obtained from 19 patients. No mean age available. | High spatial resolution line laser triangulation sensors (optoNCDT 1700BL, Micro-Epsilon Messtechnik GmbH & Co. KG, Germany) | The mean thickness of tissue specimens was 3.10 mm (please refer the paper for local variations in tissue thickness measurements). | No significant correlation found between in vivo rupture pressure and specimen mean or minimum thickness or maximum stresses. | 1 |
| 4 | Forsell et al., 2014 [18] | Cross-sectional | 27 tissue specimens from 24 patients undergoing aortic, valve disease, or both surgeries (13 BAV, age 60.4 ± 14.1) (11 TAV, age 59.2 ± 9.4) | Calliper measurements on excised tissue | Increased wall thickness observed in TAV patients (2.0 [1.9, 2.3]) as compared to BAV patients (1.7 [1.6, 2.0]) | BAV aneurysmal tissue depicted lower wall thickness as compared to TAV aneurysmal tissue. BAV aneurysmal tissues showed higher strength as compared to TAV aneurysmal tissues. | 0 |
| 5 | Fukui et al., 2005 [19] | Cross-sectional | 29 ATAA specimens were obtained from 18 patients undergoing aneurysm replacement surgery. No clinical characteristics mentioned | Measurements on tissue specimens were performed using a dial gauge. | Wall thickness of ascending aortic specimens was 1.7 [1.5, 1.8]. | No significant correlations among maximum diameter, wall thickness, and mean infinitesimal strain in the in vivo state. | 0 |
| 6 | Hardikar et al., 2020 [20] | Cross-sectional | 72 consecutive patients undergoing aortic surgeries. (58 ATAA, age 61.95 ± 12.1, 16% female) (14 TAD, age 62.40 ± 9.7, 36% female) | Thickness of all four quadrants at mid-ascending level of the aorta was measured using two methods: surgical vernier caliper (after resection of tissue), and from CT images pre-operatively. | Average wall thickness was different for aneurysm (1.88 ± 0.28) and dissection (2.02 ± 0.39). Preferential thinning on the convexity of the aorta was observed with increase in diameter. | Risk of acute aortic events must not be based only on diameter. Aortic wall thickness is an important parameter for risk assessment. | 0 |
| 7 | Iliopoulos et al., 2009 [21] | Case-control | Fresh tissue wall thickness calculation (ATAA n = 490; Control n = 212). Histomorphometry wall thickness calculation (ATAA n = 104; Control n = 60). ATAA age 69 ± 2, 35% female. Control age 69 ± 2, 33% female) | Histomorphometry—5 μm thick section images captured using digital camera (Altra20) and analyzed using image analysis software (Image-Pro Plus). Fresh biomechanical testing—non-contacting laser micrometer (LS-3100) | Overall thickness questionable (see Figure 8 in [21]). The unit of thickness is in cm. | Measurements on fresh tissue displayed lower wall thickness in ATAA specimens as compared to controls. No significant differences in overall wall thickness between ATAA and controls from histological analysis. Failure stress and peak elastic modulus correlated negatively with wall thickness (strongly), and ATAA diameter (weakly). | 2 |
| 8 | Iliopoulos et al., 2009 [22] | Cross-sectional | 12 ATAA patients, age 69 ± 9, 42% female. In total, 279 specimens of which 271 were submitted for mechanical testing. | Laser beam micrometer (LS3100, Keyence Corp, Osaka, Japan) with resolution of 1 μm. Analysis performed for all four circumferential anatomical locations of the aortic ring. | Anterior = 1.76 ± 0.37; Right lateral = 1.66 ± 0.34; Posterior = 1.66 ± 0.28; Left lateral = 1.79 ± 0.28 | No regional variations in wall thickness and failure strain were observed in the ATAA tissue. Negative correlations were found between failure stress and wall thickness in longitudinal and circumferential directions. | 1 |
| 9 | Khanafer et al., 2011 [23] | Cross-sectional | 97 aneurysm tissue specimens from 13 patients with age ranging from 39 to 75 years—68 circumferential-oriented specimens (42 greater curvature; 26 lesser curvature) and 29 longitudinal-oriented specimens (16 greater curvature; 13 lesser curvature) | Digital caliper | Range for wall thickness was 1.5–2.7 mm (refer Figure 5 in the [23]) | Inverse correlation between peak stress and wall thickness was observed in both—circumferential and longitudinal directions. | 2 |
| 10 | Koullias et al., 2005 [24] | Case-control | 20 patients undergoing coronary artery bypass graft surgery, age 64.0 ± 2.61, 30% female. In total, 33 patients undergoing elective aneurysm repair surgery, age 64.8 ± 4.7, 12% female. Patients with a documented diagnosis of Marfan syndrome or evidence of dissection or aortitis of any etiology were excluded. | 6- to 15-MHz echocardiographic probe (Phillips model 21390A, Andover, Mass) | Mean value of wall thickness measurement for all non-aneurysmatic tissues was 0.26 ± 0.02 and 0.25 ± 0.02 for aneurysmatic tissues. | Dramatic level of aortic tissue deterioration is observed when the diameter reaches a critical value of 6 cm. | 0 |
| 11 | Puyvelde et al., 2015 [25] | Retrospective cohort | 94 ATAA patients, age 62 ± 12.6, 28% female and 87 TAD, age 57.8 ± 15.1, 31% female. | Digitalized histological images processing (software-AxioVision, CarlZeiss Meditec AG, Jena, Germany) of medial wall thickness. | Medial wall thickness ATAA = 1.53 ± 0.29; TAD = 1.50 ± 0.31 | Patients with TAD exhibited a significant inverse association between medial wall thickness and aortic diameter, while in ATAA this relation was absent. | 2 |
| 12 | Shahmansouri et al., 2016 [26] | Cross-sectional | Patients with BAV (6 males) and TAV (7 male, 1 female) undergoing aneurysmal repair surgery. Average age of study population is 68 ± 12 years. | Digital caliper | TAV: IC = 2.39 ± 0.43; Anterior = 2.18 ± 0.49; Posterior = 2.72 ± 0.68; OC = 1.992 ± 0.578 BAV: IC = 2.47 ± 0.37; Anterior = 2.56 ± 0.67; Posterior = 2.68 ± 0.49; OC = 2.48 ± 0.50 | Regional variation in thickness observed; however, such regional variation for toughness and incremental modulus was not observed. Toughness measure correlates with collagen fiber content in the tissue. | 1 |
| 13 | Smoljkić et al., 2017 [27] | Cross-sectional | 6 ATAA patients in total. BAV patients with age 58.25 ± 6. 1 CABG patient aged 60. In total, 2 female patients. | In vivo IMT measurement by images obtained through epiaortic ultrasound probe; Ex vivo IMT measurement on histological samples (at 20 locations and then averaged) through ImageJ; Ex situ IMAT measurement through metal plates and image analysis using MATLAB. | Means of each technique not mentioned. Range for in vivo (IMT): 1–2; ex vivo (IMT): 1.3–2; ex situ (IMAT): 2.2–3.5 | Mechanical or geometrical information only cannot provide sufficient information regarding rupture risk. Wall thickness measurements show high variability between patients but also between measurement methods. | 1 |
| 14 | Stern et al., 2019 [28] | Case-control | TAV-ATAA (28, age 65.7 ± 11.3, 43% female); BAV-ATAA (19, age 52.8 ± 14, 5% female); non-aneurysmal (30, age 54.4 ± 12.8, 33% female). | Image acquisitions were performed using Zeiss AxioVision microscope (Carl Zeiss, Oberkochen, Germany) to measure intima and media thickness. | Media thickness significantly reduced in TAV-ATAA patients (1.22) compared to the control group (1.46). The media thickness in patients with a BAV (1.35 mm) displayed no significant differences compared to TAV patients and the control group. Intimal thickness significantly increased in TAV-ATAAs (1.80) compared to BAV-ATAA patients (0.50). No significant intimal thickness difference was observed between TAV-ATAAs and control group (0.75). | BAV-ATAA and the TAV-ATAA are two independent diseases. The TAV-associated aneurysm is characterized by a pronounced aortic wall degeneration suggesting strong wall weakening, whereas BAV aneurysm-associated wall changes are limited to a tendency towards increased calcification. | 1 |
| 15 | Tang et al., 2005 [29] | Case-control | Patients with ATAA (29) age 67.5 ± 14.4, 31% female; patients with non–aneurysmal aortas included CABG (10) + cardiac transplantation (3) + cadaveric organ donors (15). Age of the control group is 60.9 ± 11.1, 21% female. | Wall thickness was determined from elastin van Gieson (EVG)–stained, transverse sections of aortic specimens under magnification using Image 1.62c software (Scion). | Total wall thickness of—non-aneurysmal: 2.61 ± 0.17; smaller aneurysms (15): 2.66 ± 0.15; larger aneurysms (14): 2.54 ± 0.25. | Media becomes thinner as aneurysm develops. Actual mass of media is increased, not decreased. Density of medial VSMCs is preserved in ascending thoracic aortic aneurysms. Increased destruction, most likely via MMP-9, and not decreased synthetic activity, underlies the impaired presence of matrix proteins in the aneurysmal aortic wall. | 2 |
Disclaimer/Publisher’s Note: The statements, opinions and data contained in all publications are solely those of the individual author(s) and contributor(s) and not of MDPI and/or the editor(s). MDPI and/or the editor(s) disclaim responsibility for any injury to people or property resulting from any ideas, methods, instructions or products referred to in the content. |
© 2023 by the authors. Licensee MDPI, Basel, Switzerland. This article is an open access article distributed under the terms and conditions of the Creative Commons Attribution (CC BY) license (https://creativecommons.org/licenses/by/4.0/).
Share and Cite
Debeij, G.P.; Parikh, S.; Delhaas, T.; Bidar, E.; Reesink, K.D. Evidence in Clinical Studies for the Role of Wall Thickness in Ascending Thoracic Aortic Aneurysms: A Scoping Review. Bioengineering 2023, 10, 882. https://doi.org/10.3390/bioengineering10080882
Debeij GP, Parikh S, Delhaas T, Bidar E, Reesink KD. Evidence in Clinical Studies for the Role of Wall Thickness in Ascending Thoracic Aortic Aneurysms: A Scoping Review. Bioengineering. 2023; 10(8):882. https://doi.org/10.3390/bioengineering10080882
Chicago/Turabian StyleDebeij, Gijs P., Shaiv Parikh, Tammo Delhaas, Elham Bidar, and Koen D. Reesink. 2023. "Evidence in Clinical Studies for the Role of Wall Thickness in Ascending Thoracic Aortic Aneurysms: A Scoping Review" Bioengineering 10, no. 8: 882. https://doi.org/10.3390/bioengineering10080882