
Prediction of Fetal Blood Pressure during Labour with Deep Learning Techniques
 , and
, and
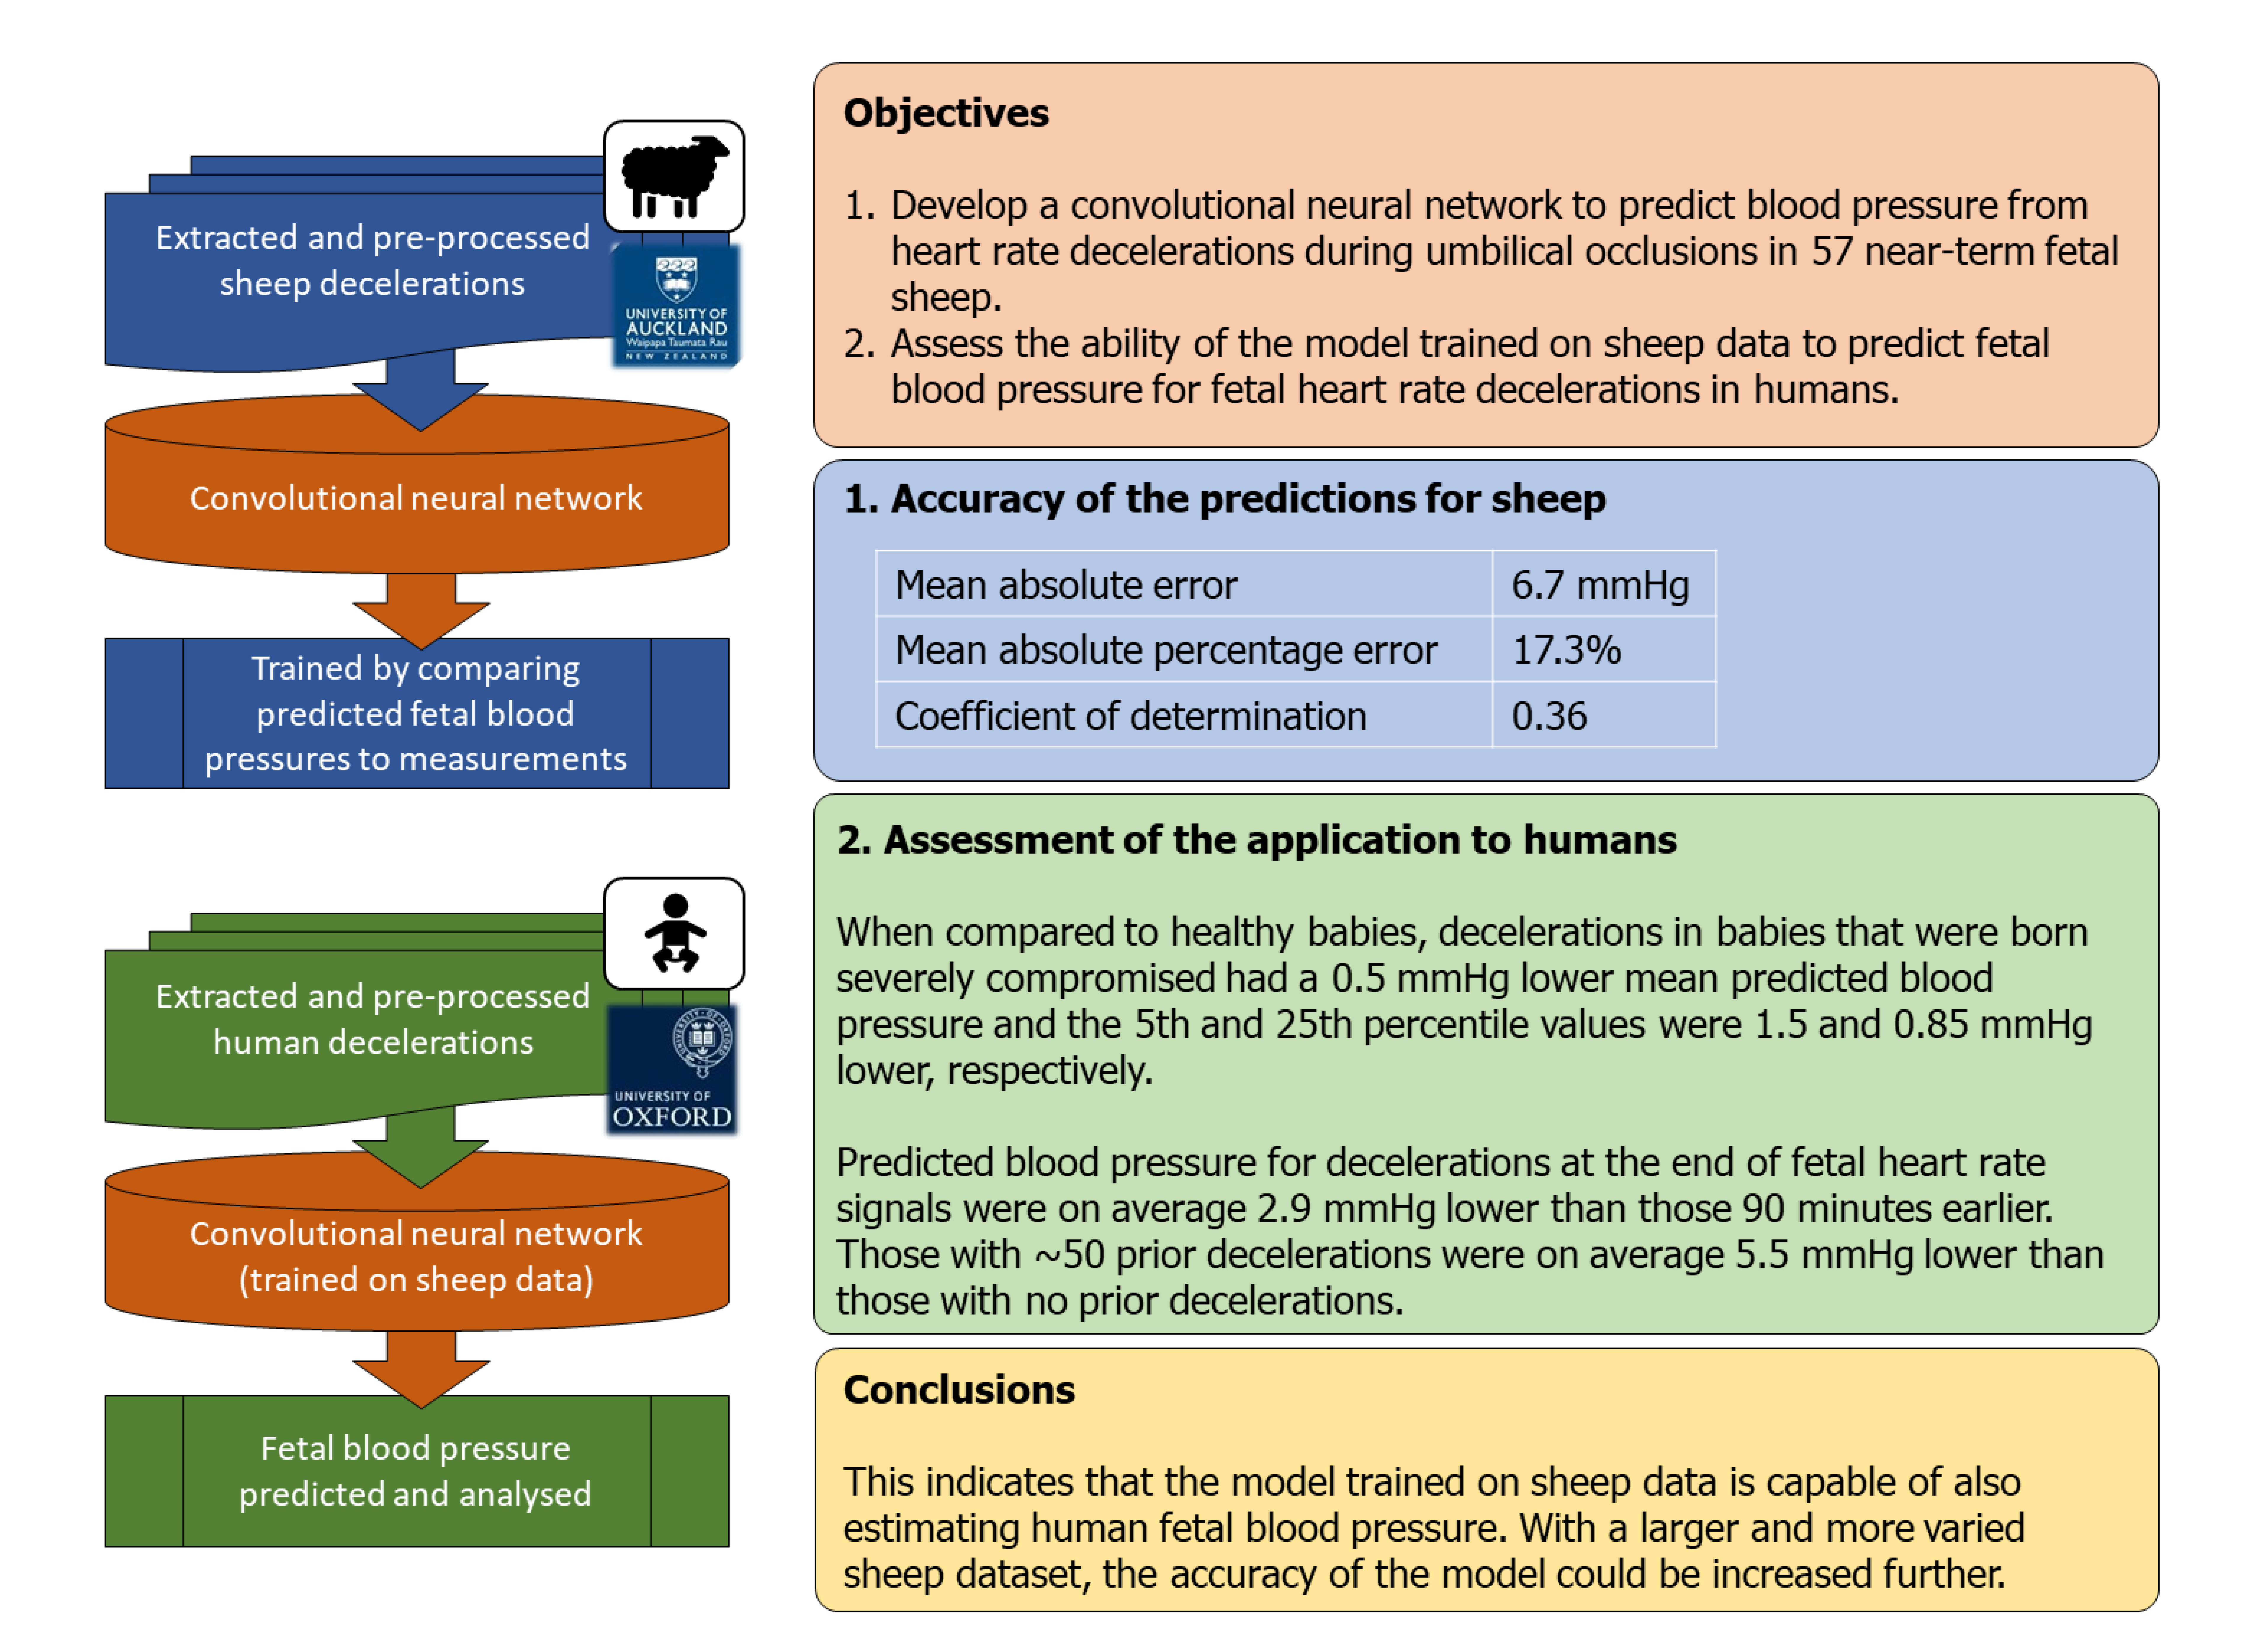
Abstract
:
1. Introduction
2. Methods
2.1. Experimental Data for the Fetal Sheep
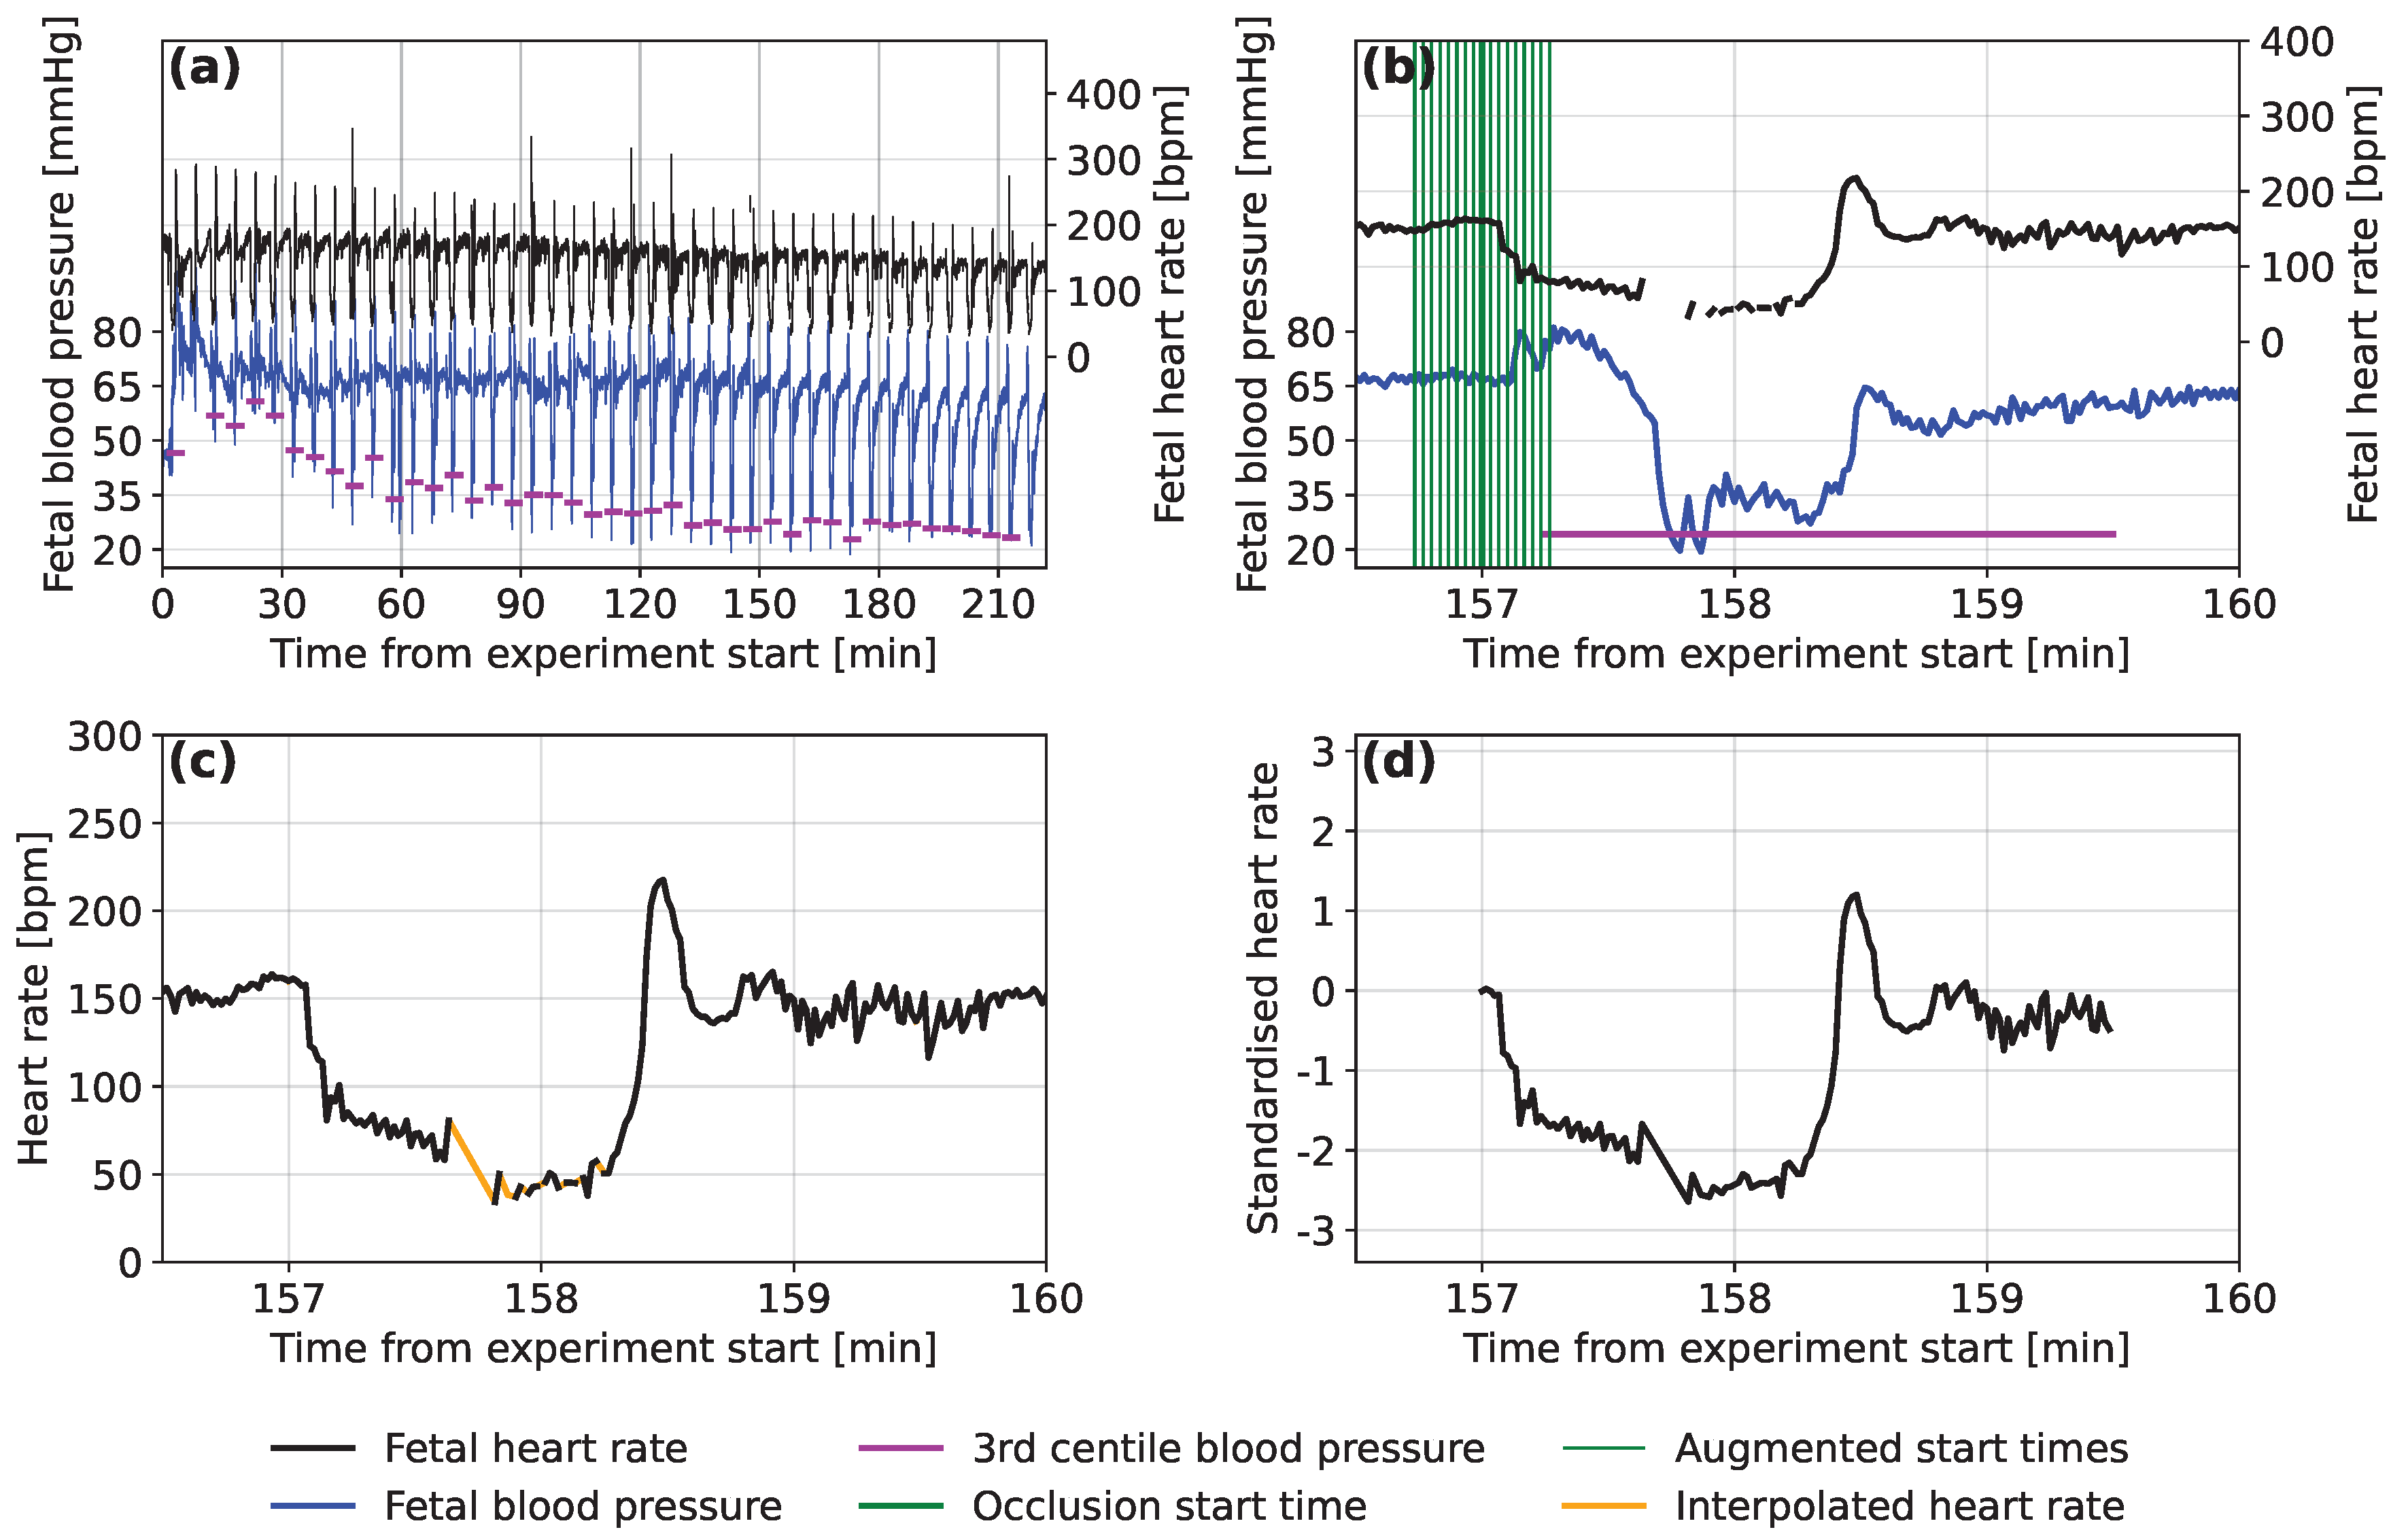
2.2. Extracting the Fetal Sheep Data
2.3. Data Pre-Processing
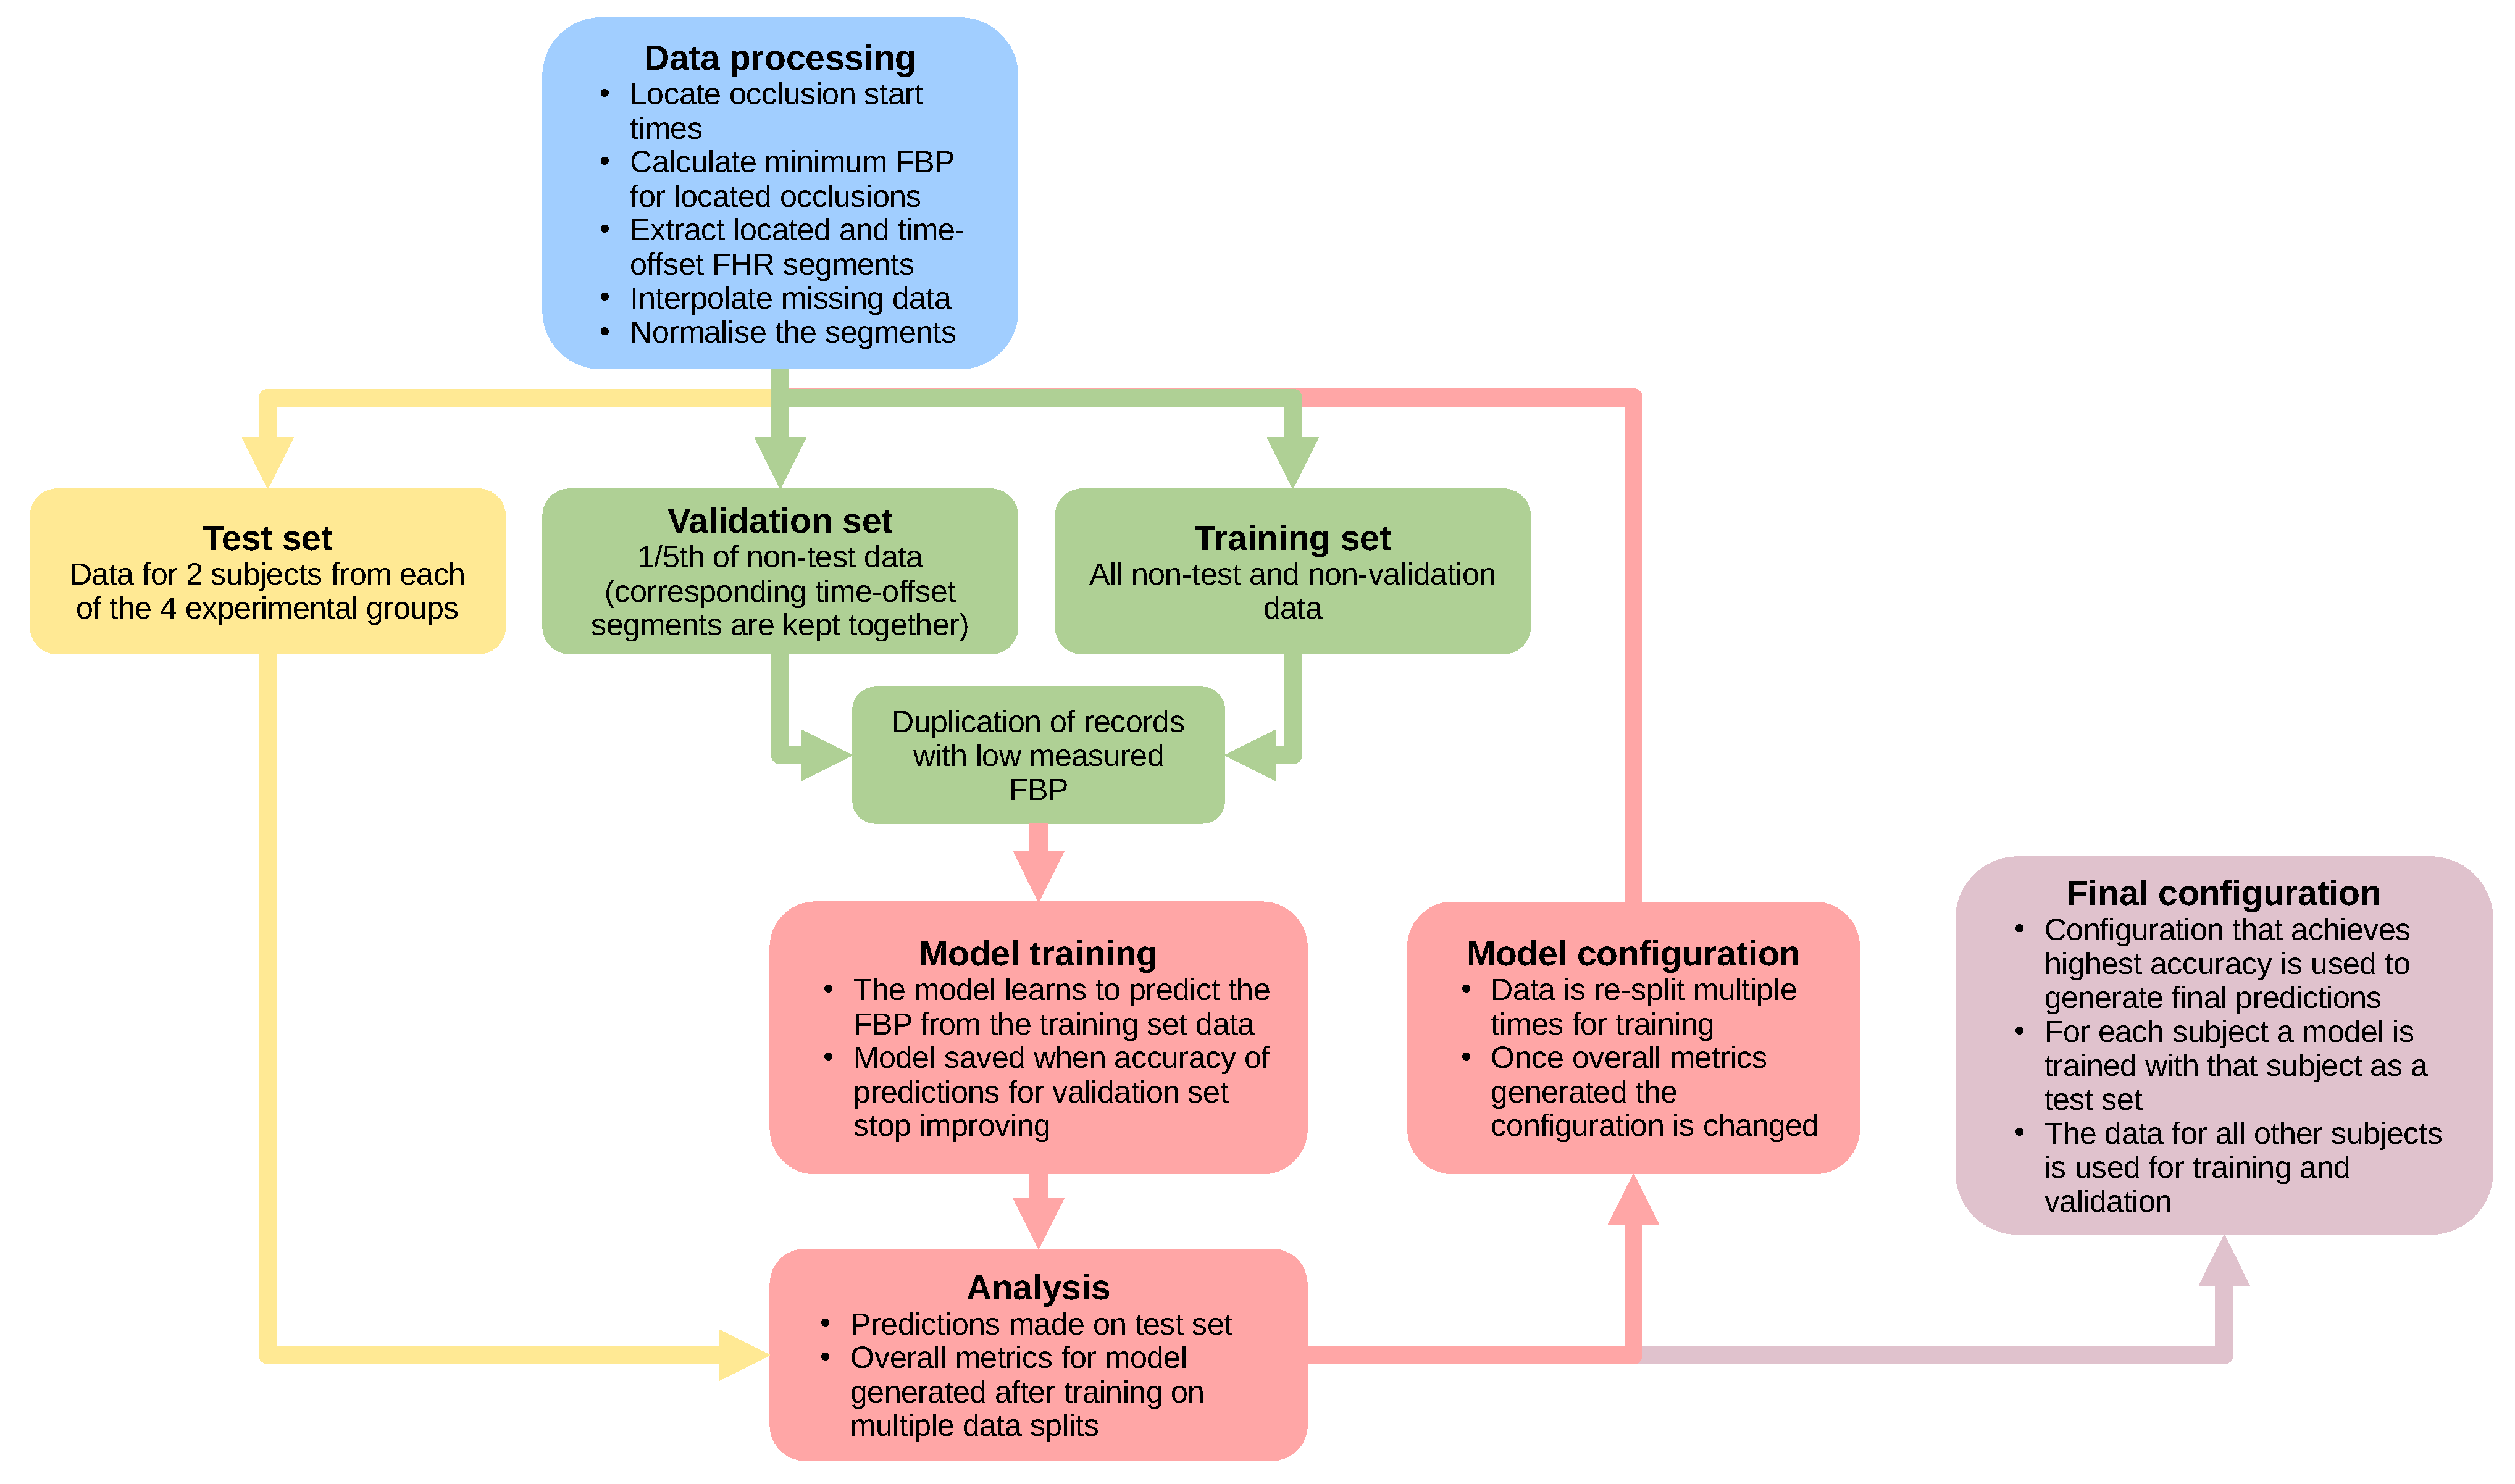
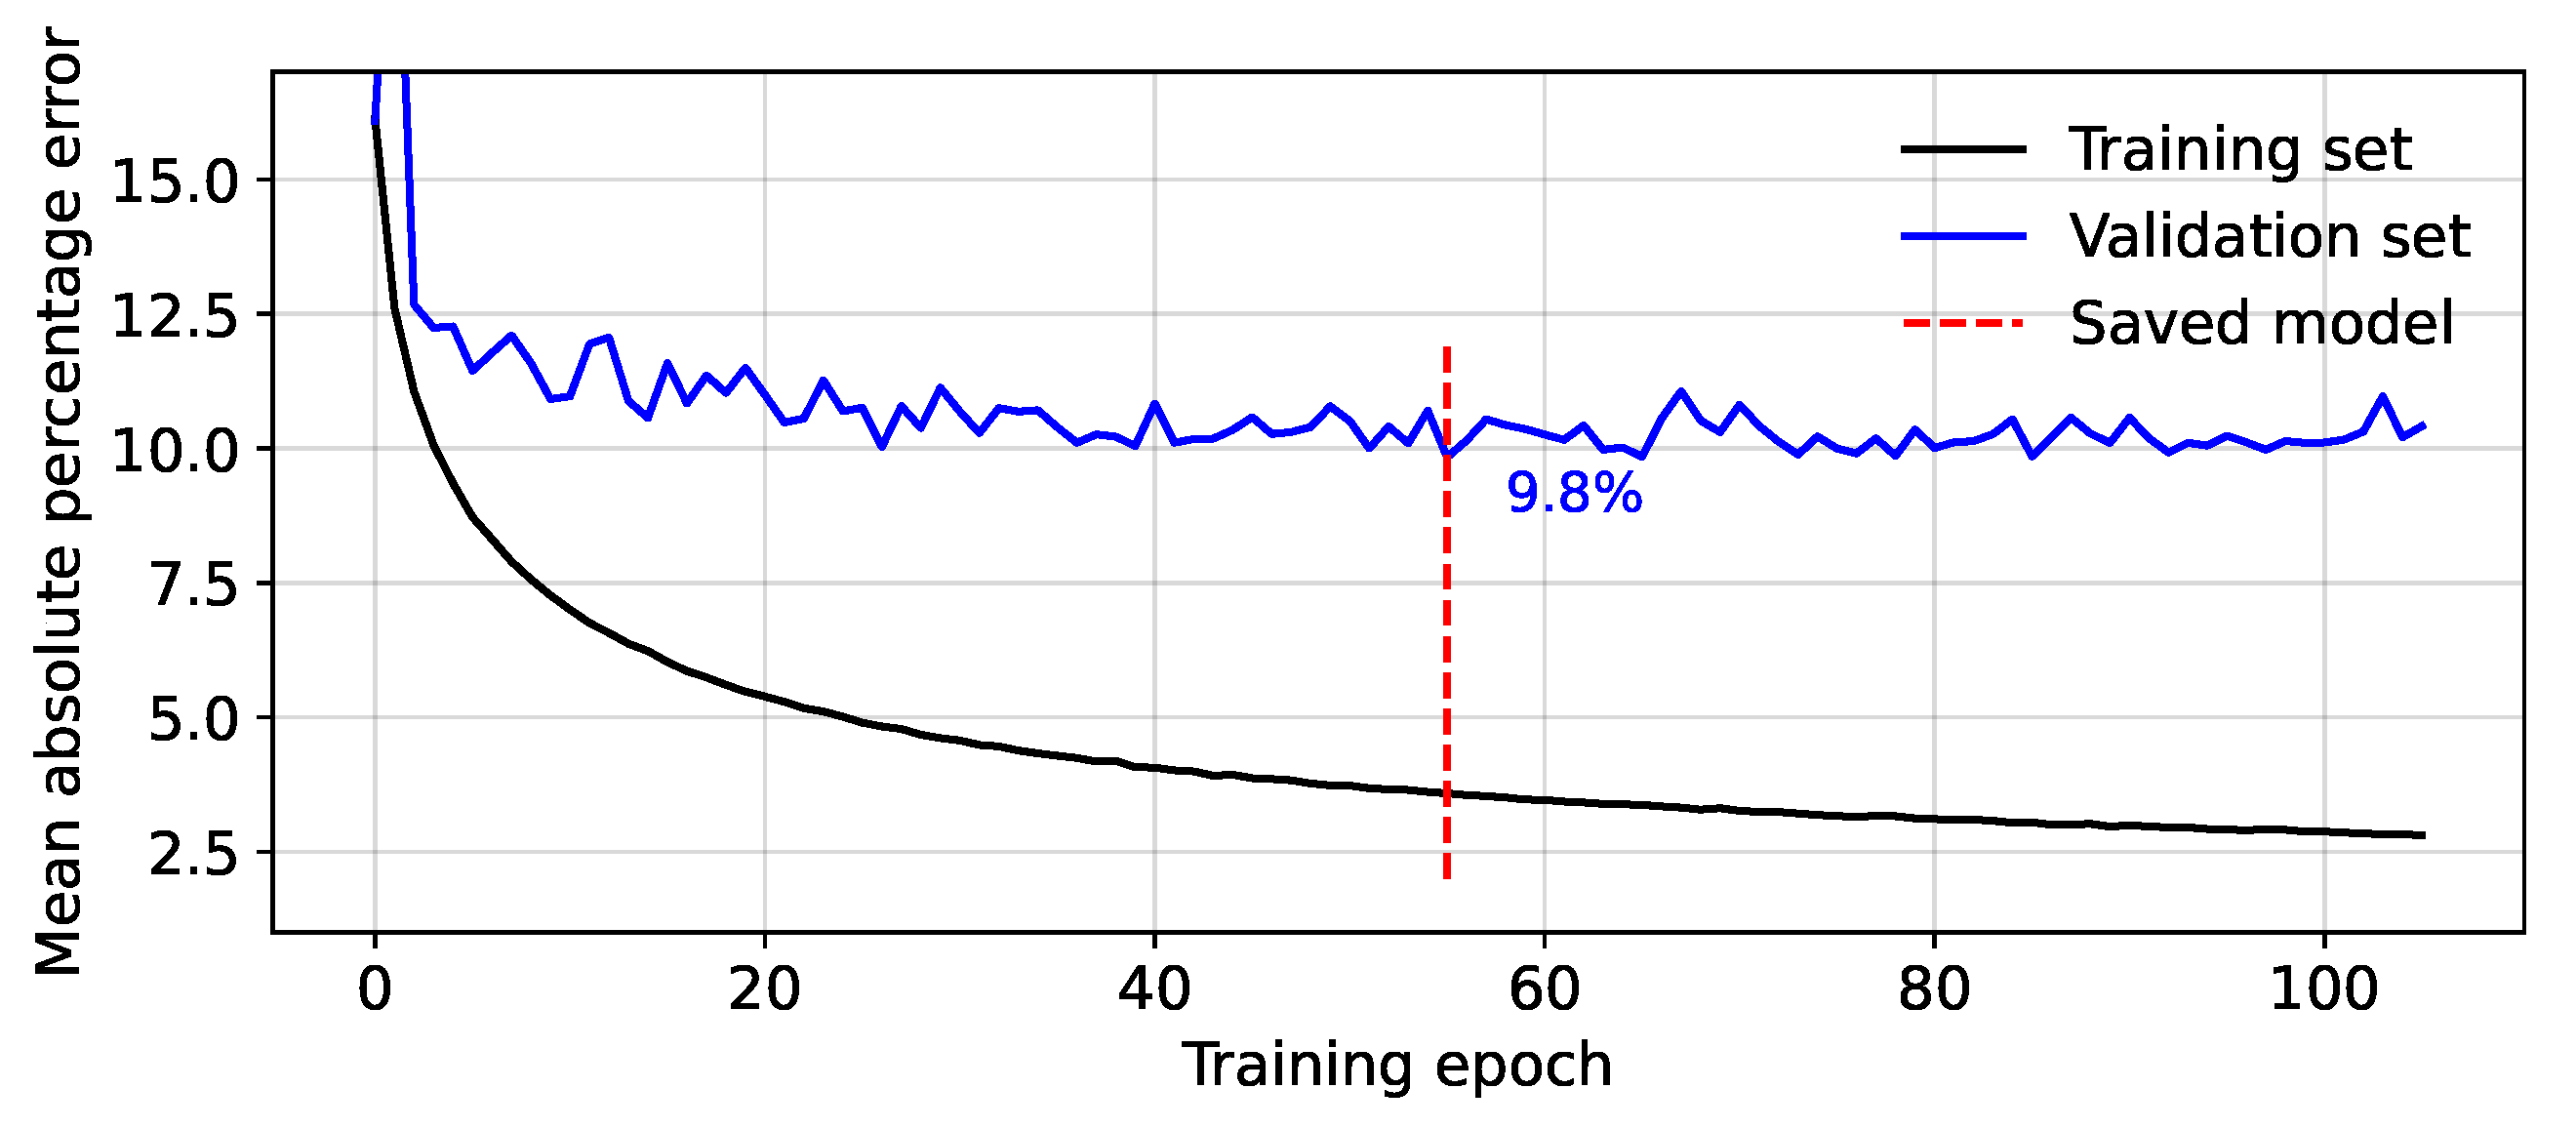
2.4. Model Testing
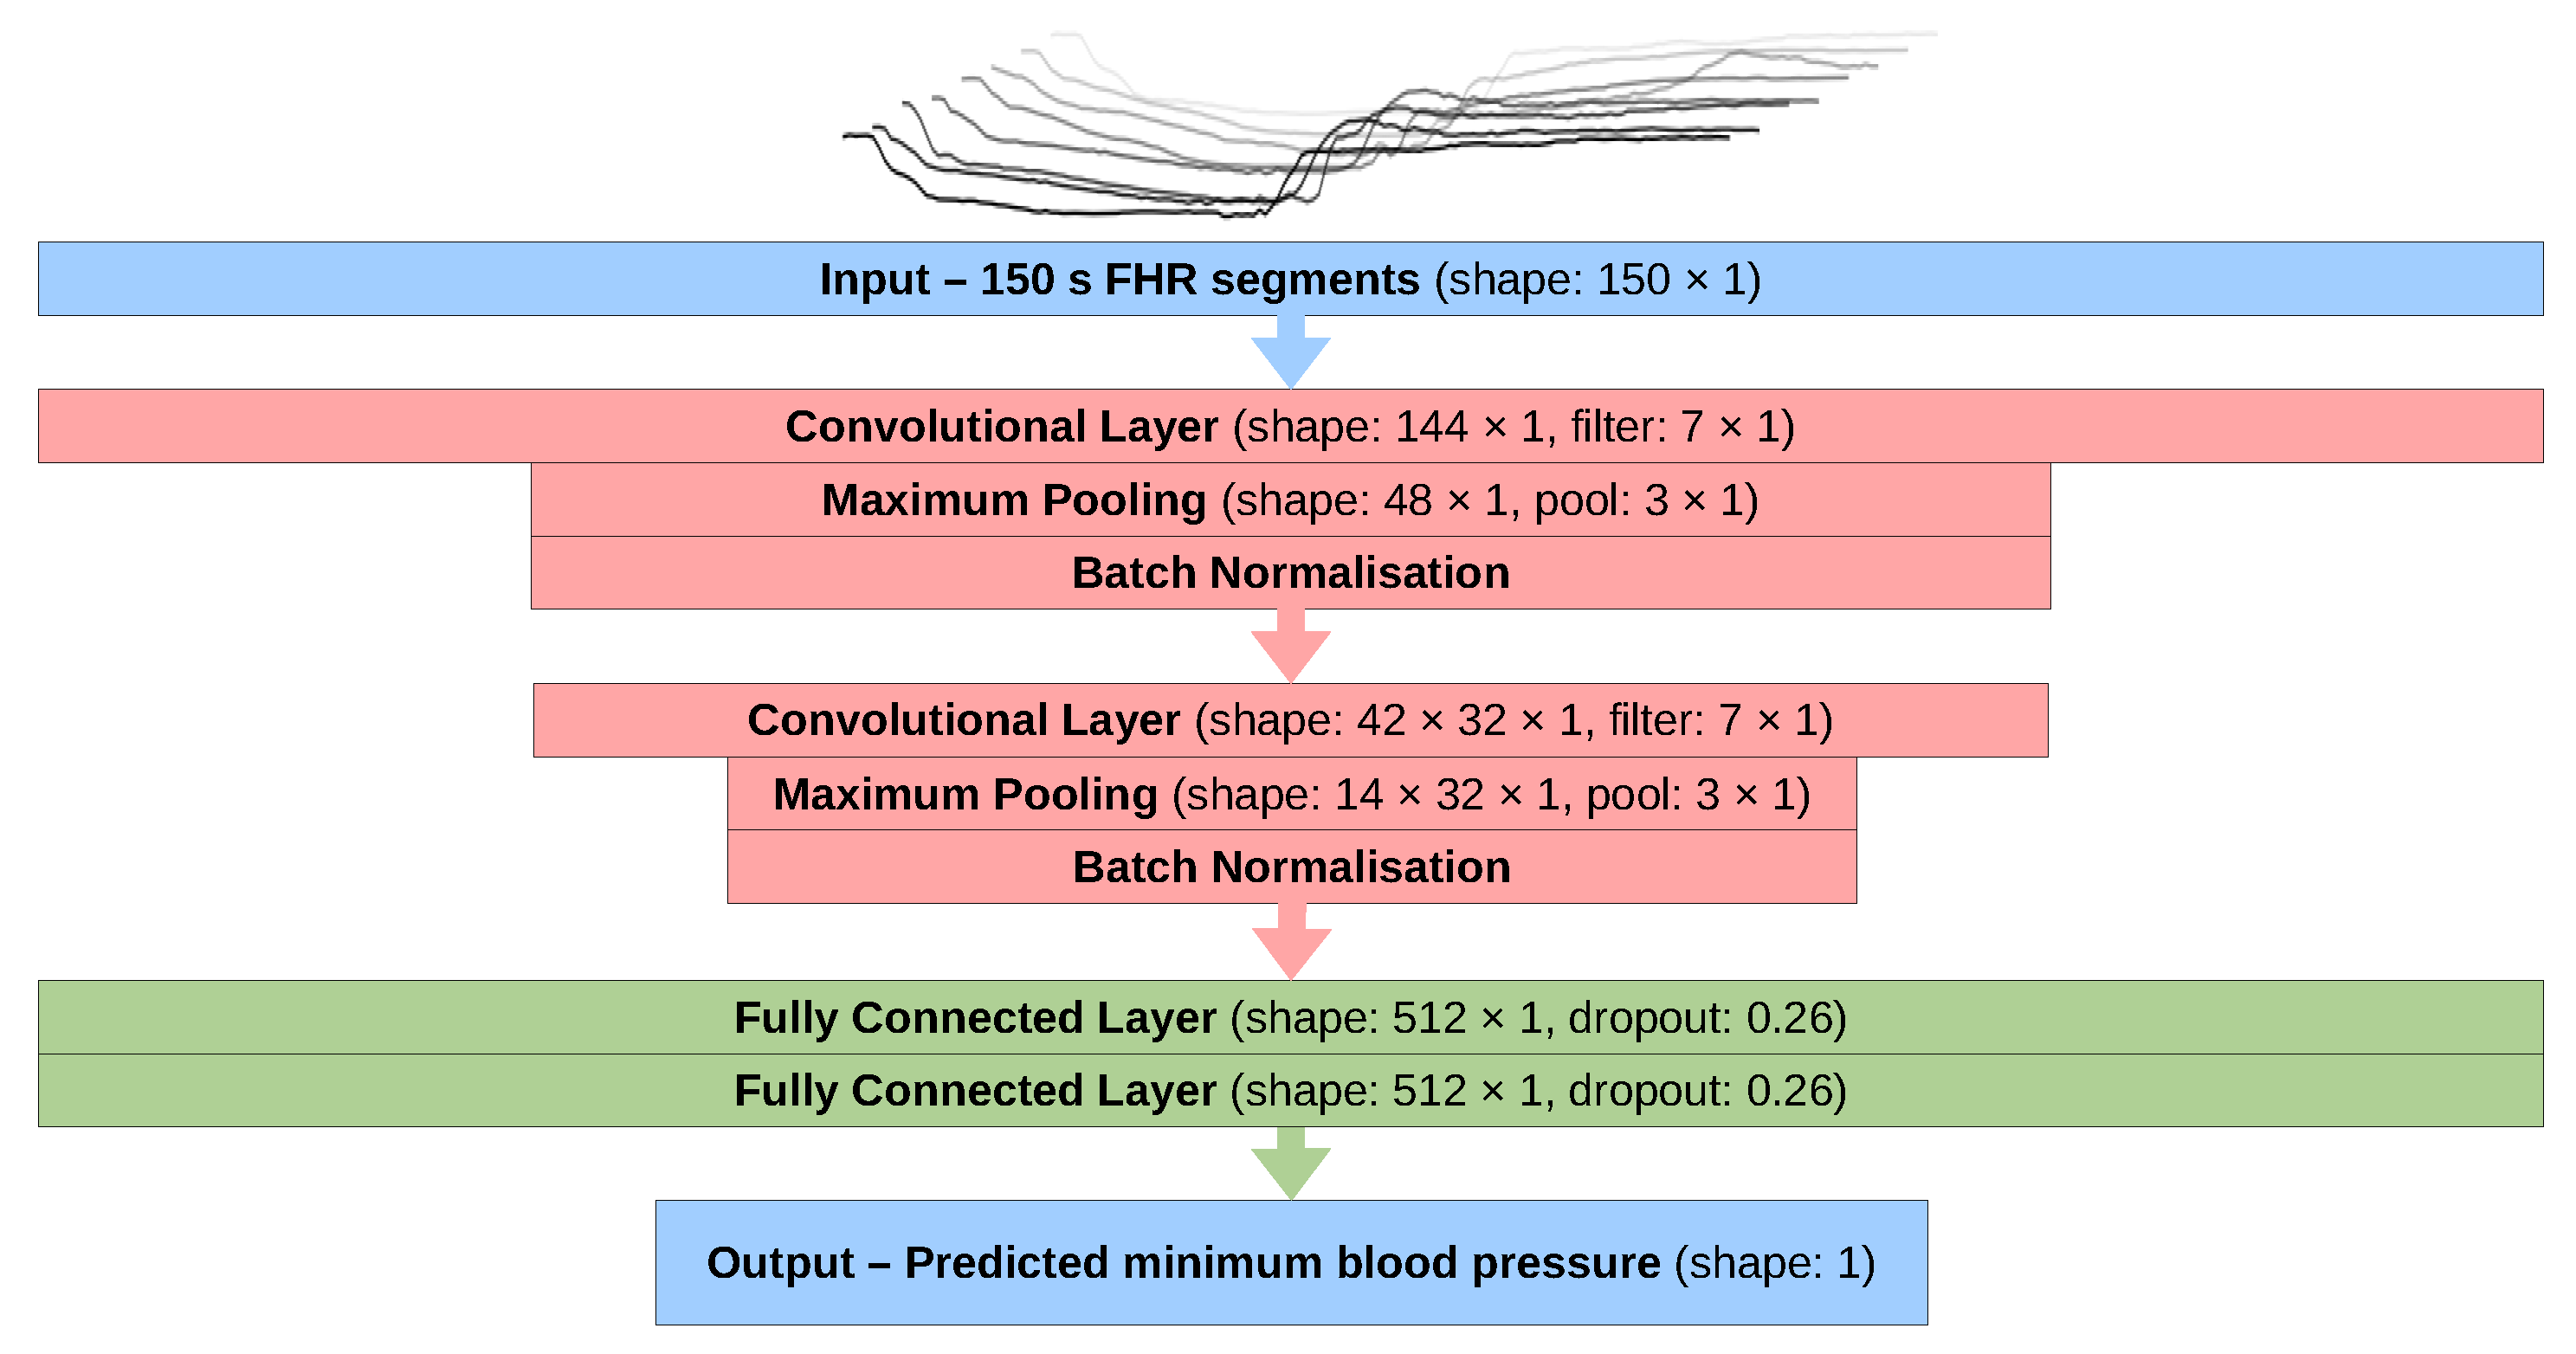
2.5. Final Configuration
2.6. Oxford Dataset
3. Results and Discussion
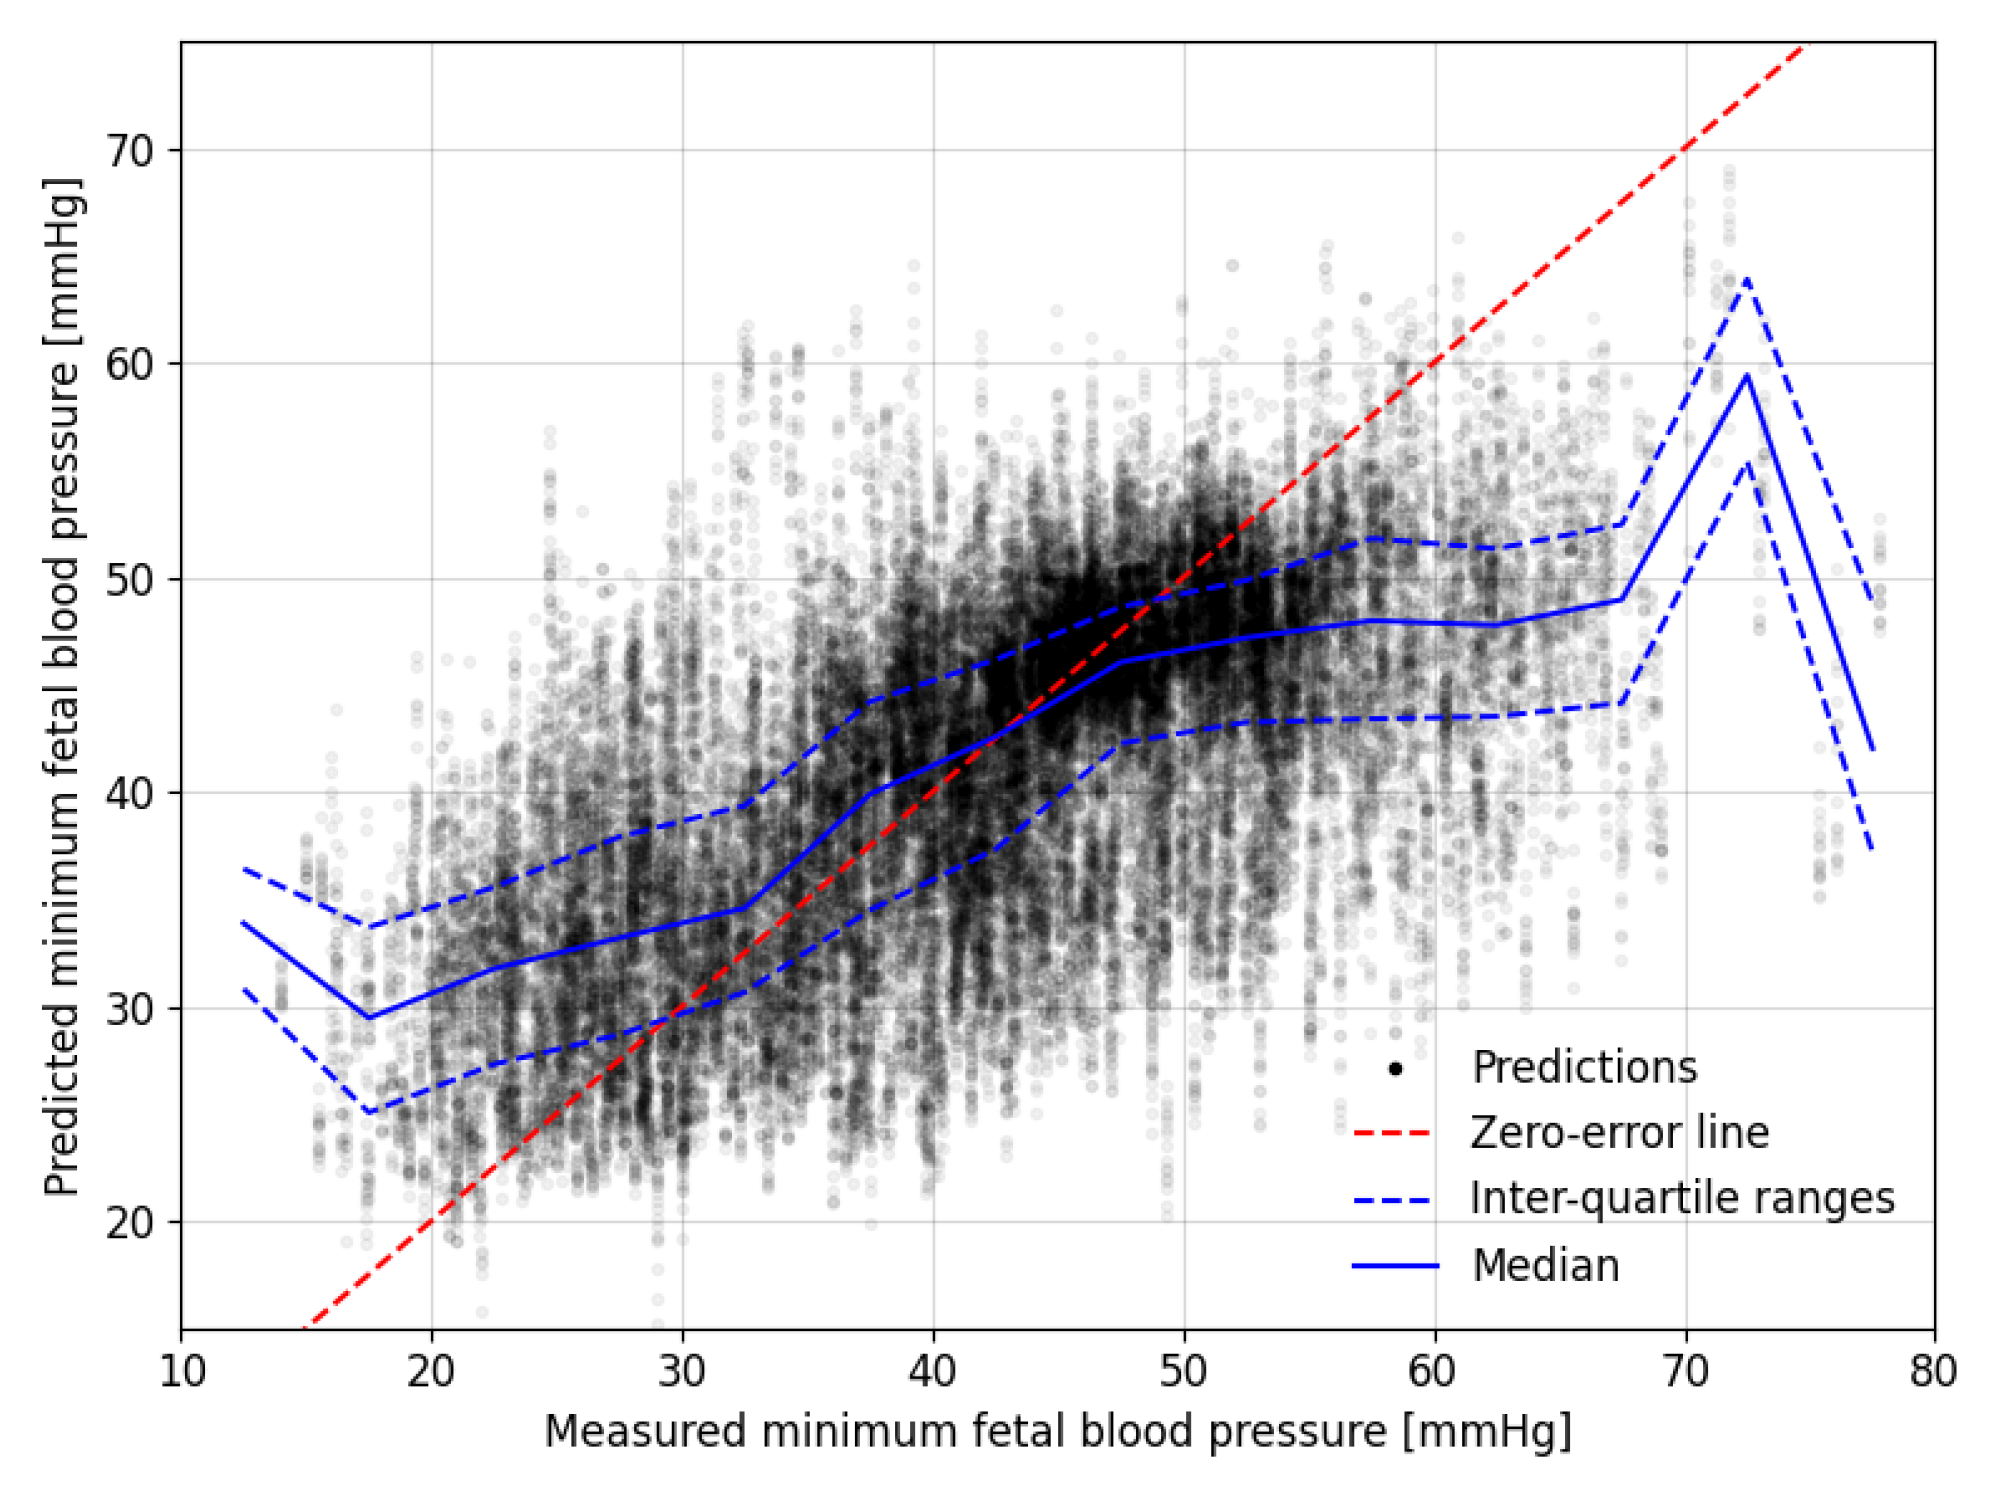
3.1. Overall Predictions for the Auckland Dataset
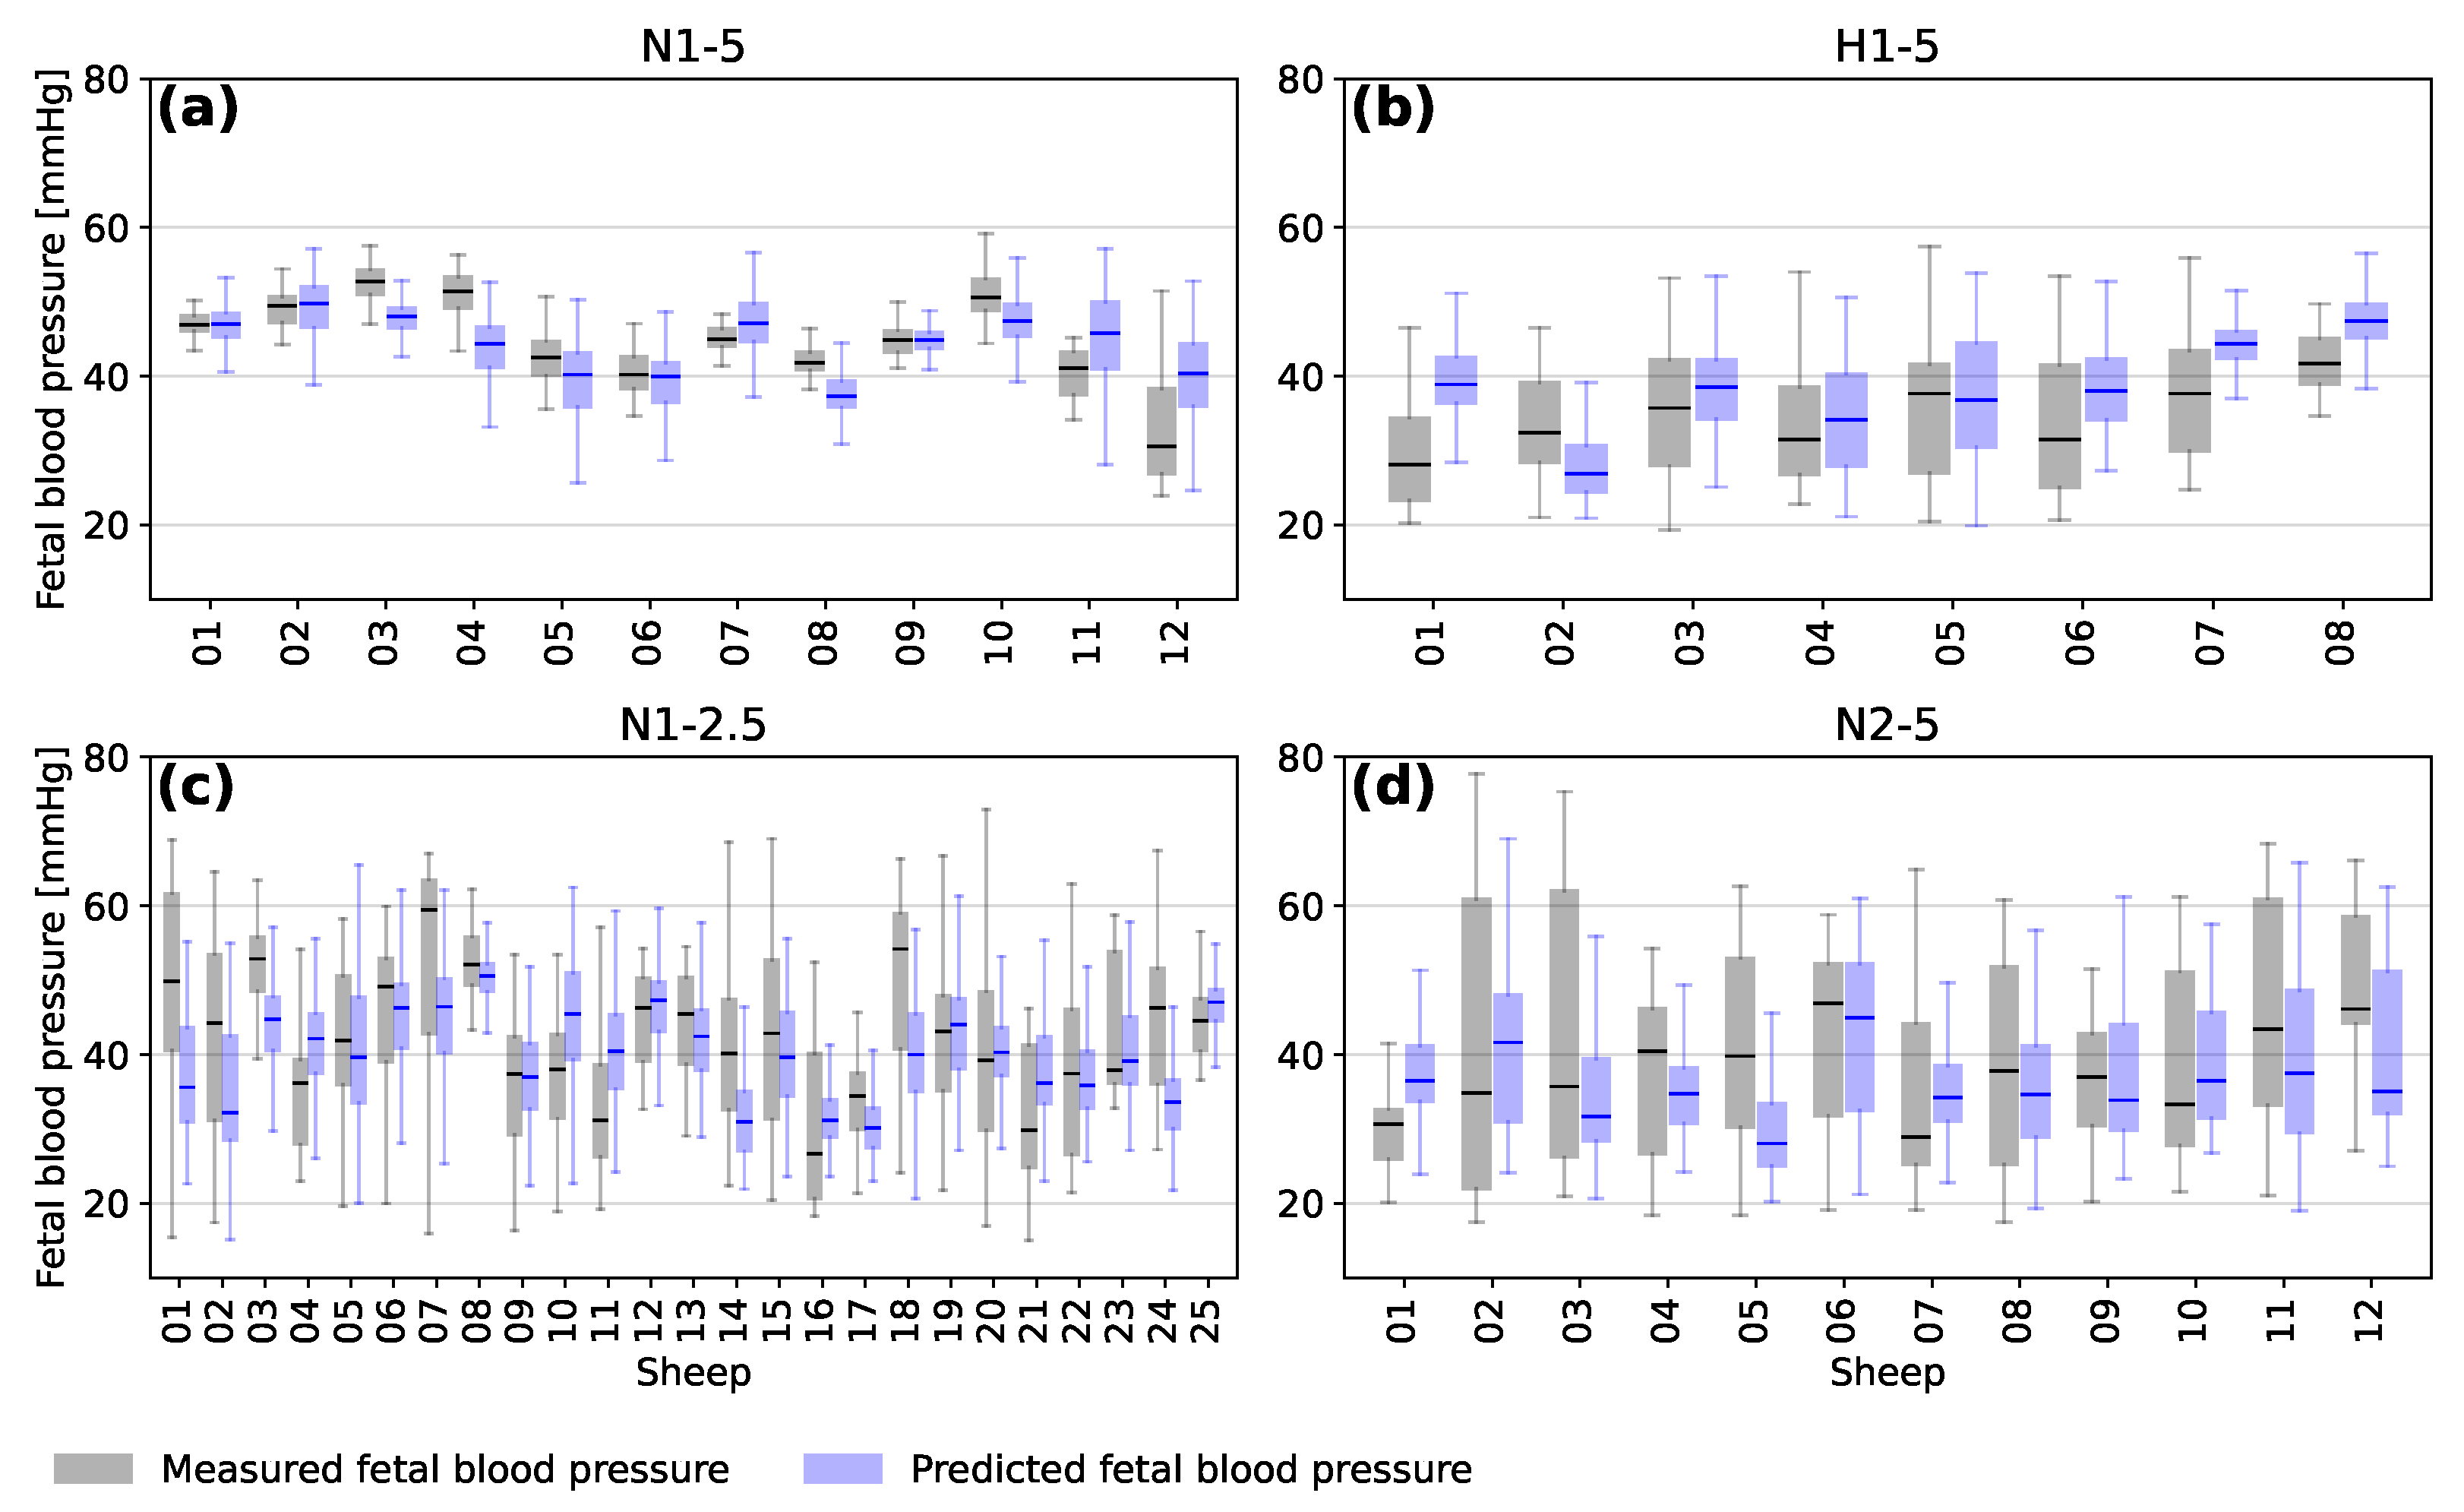
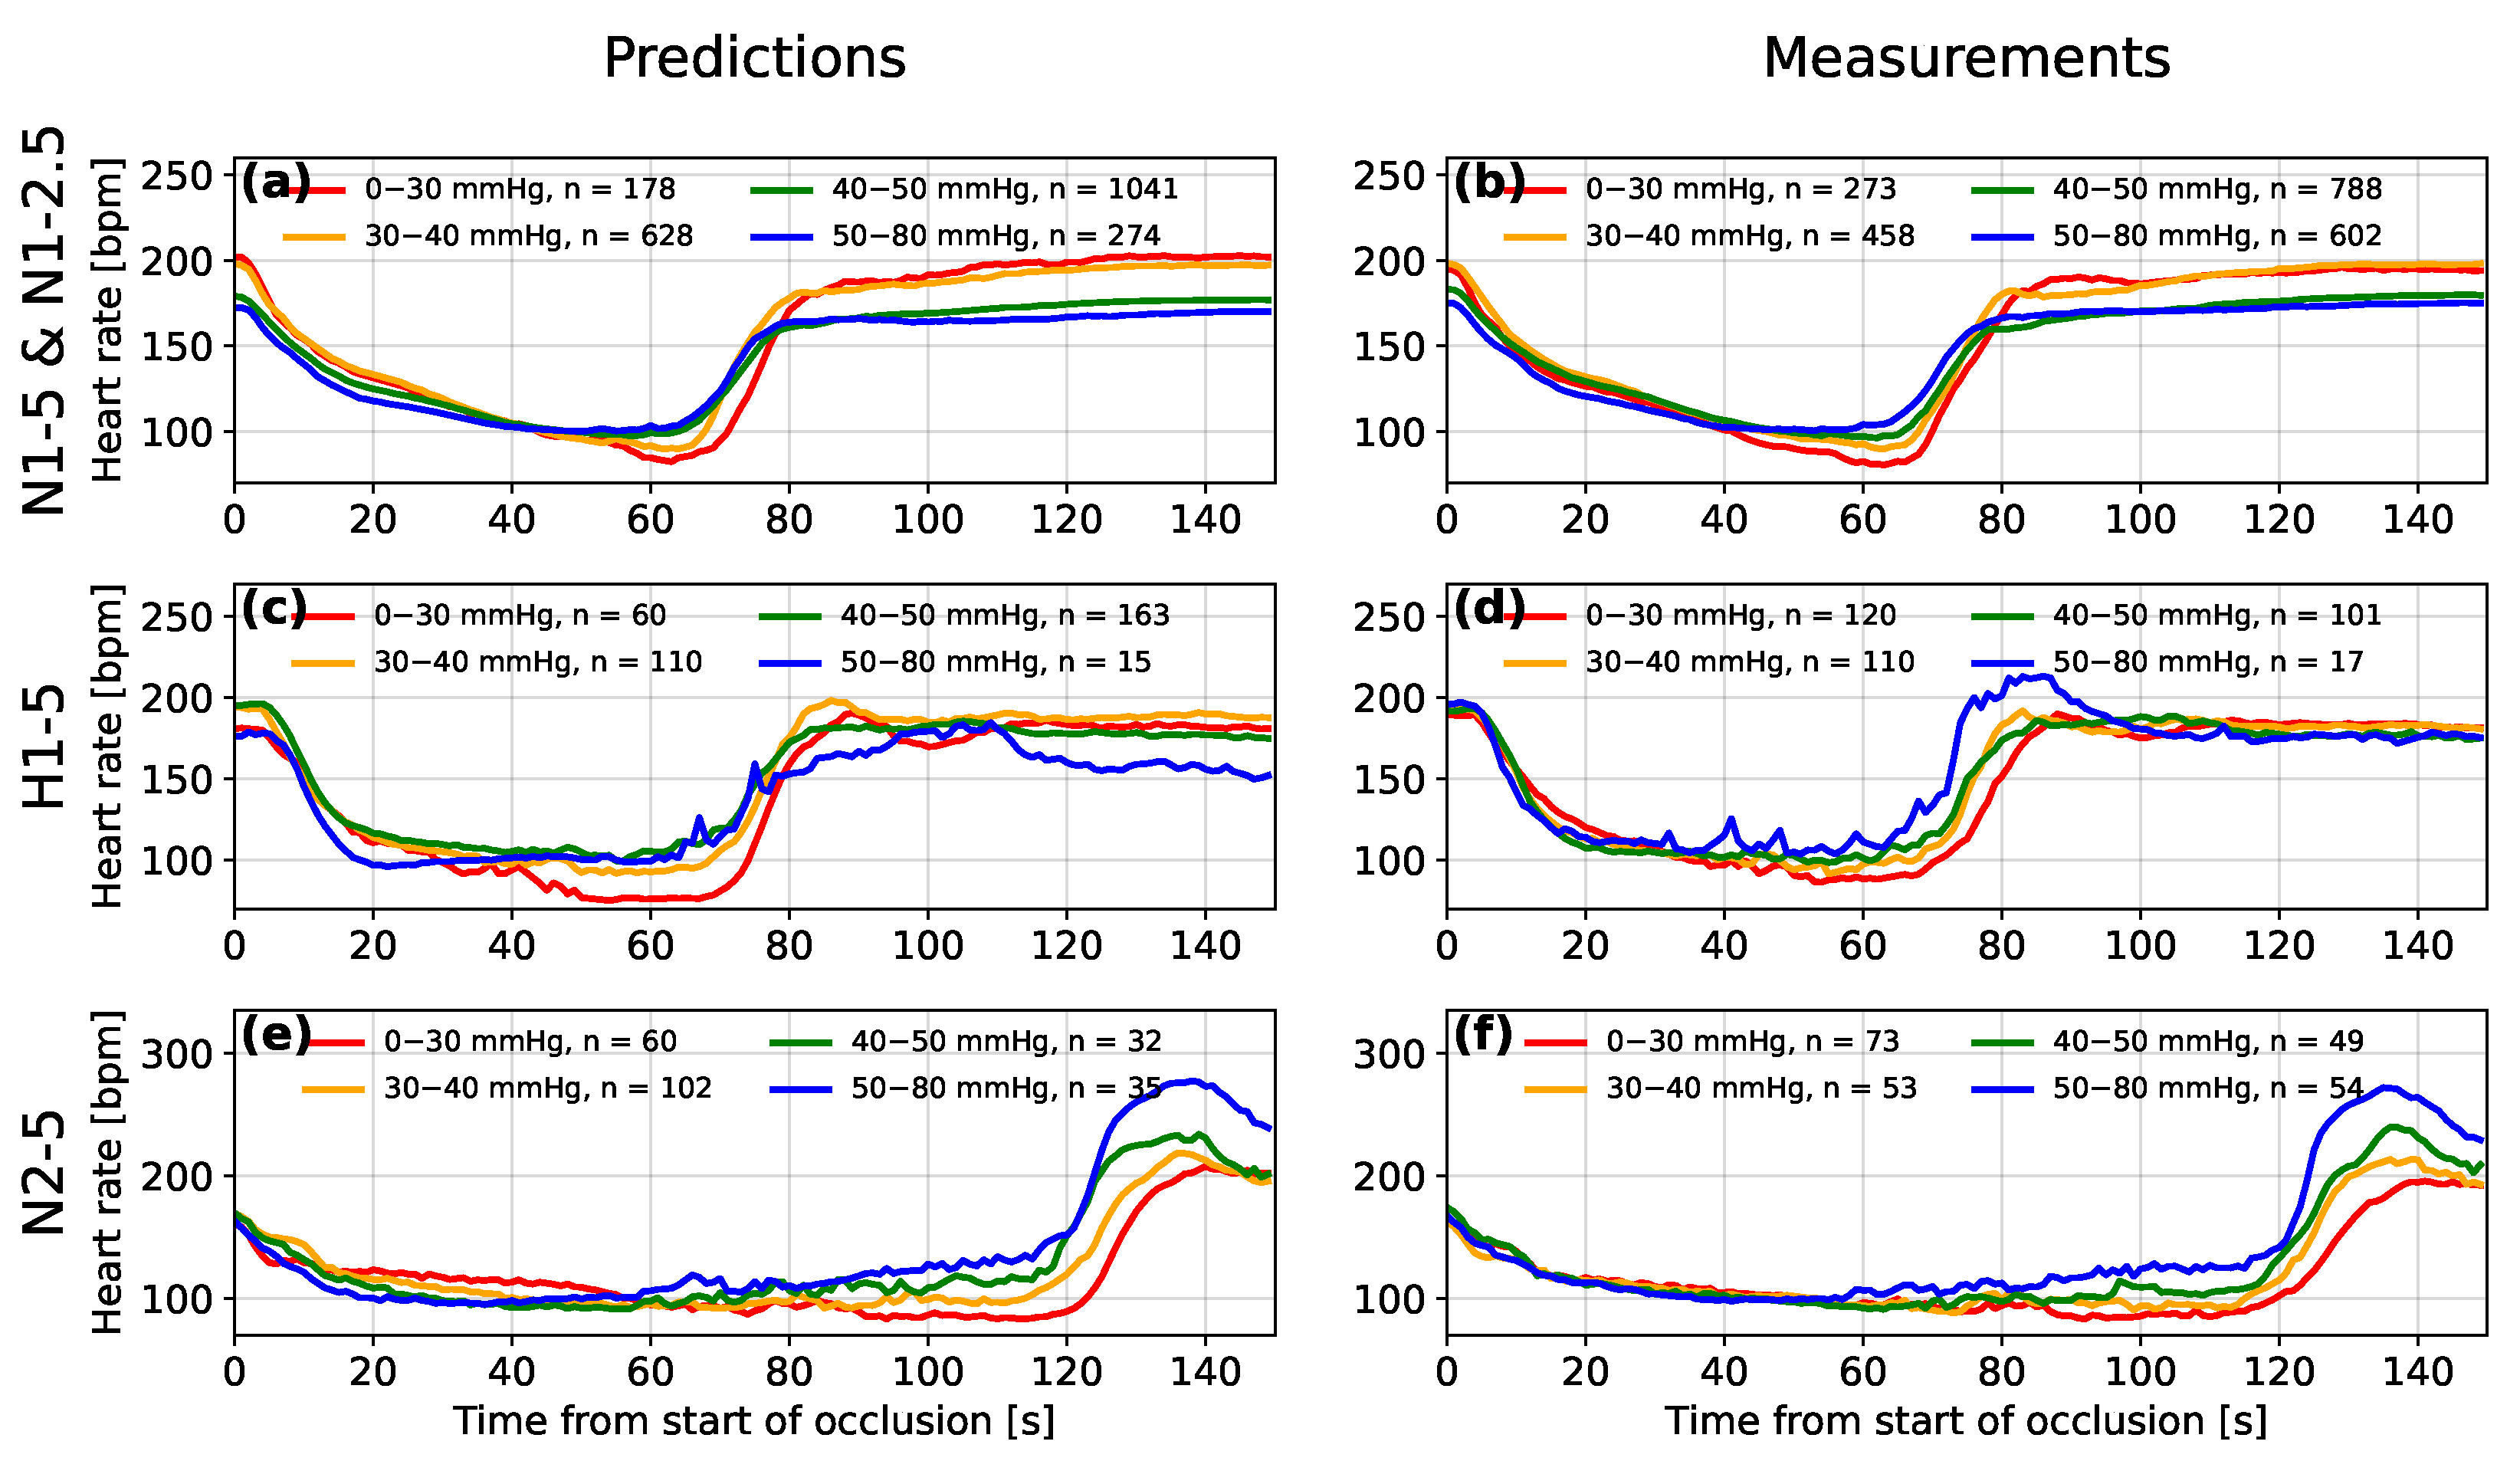
3.2. Predictions for Individual Sheep
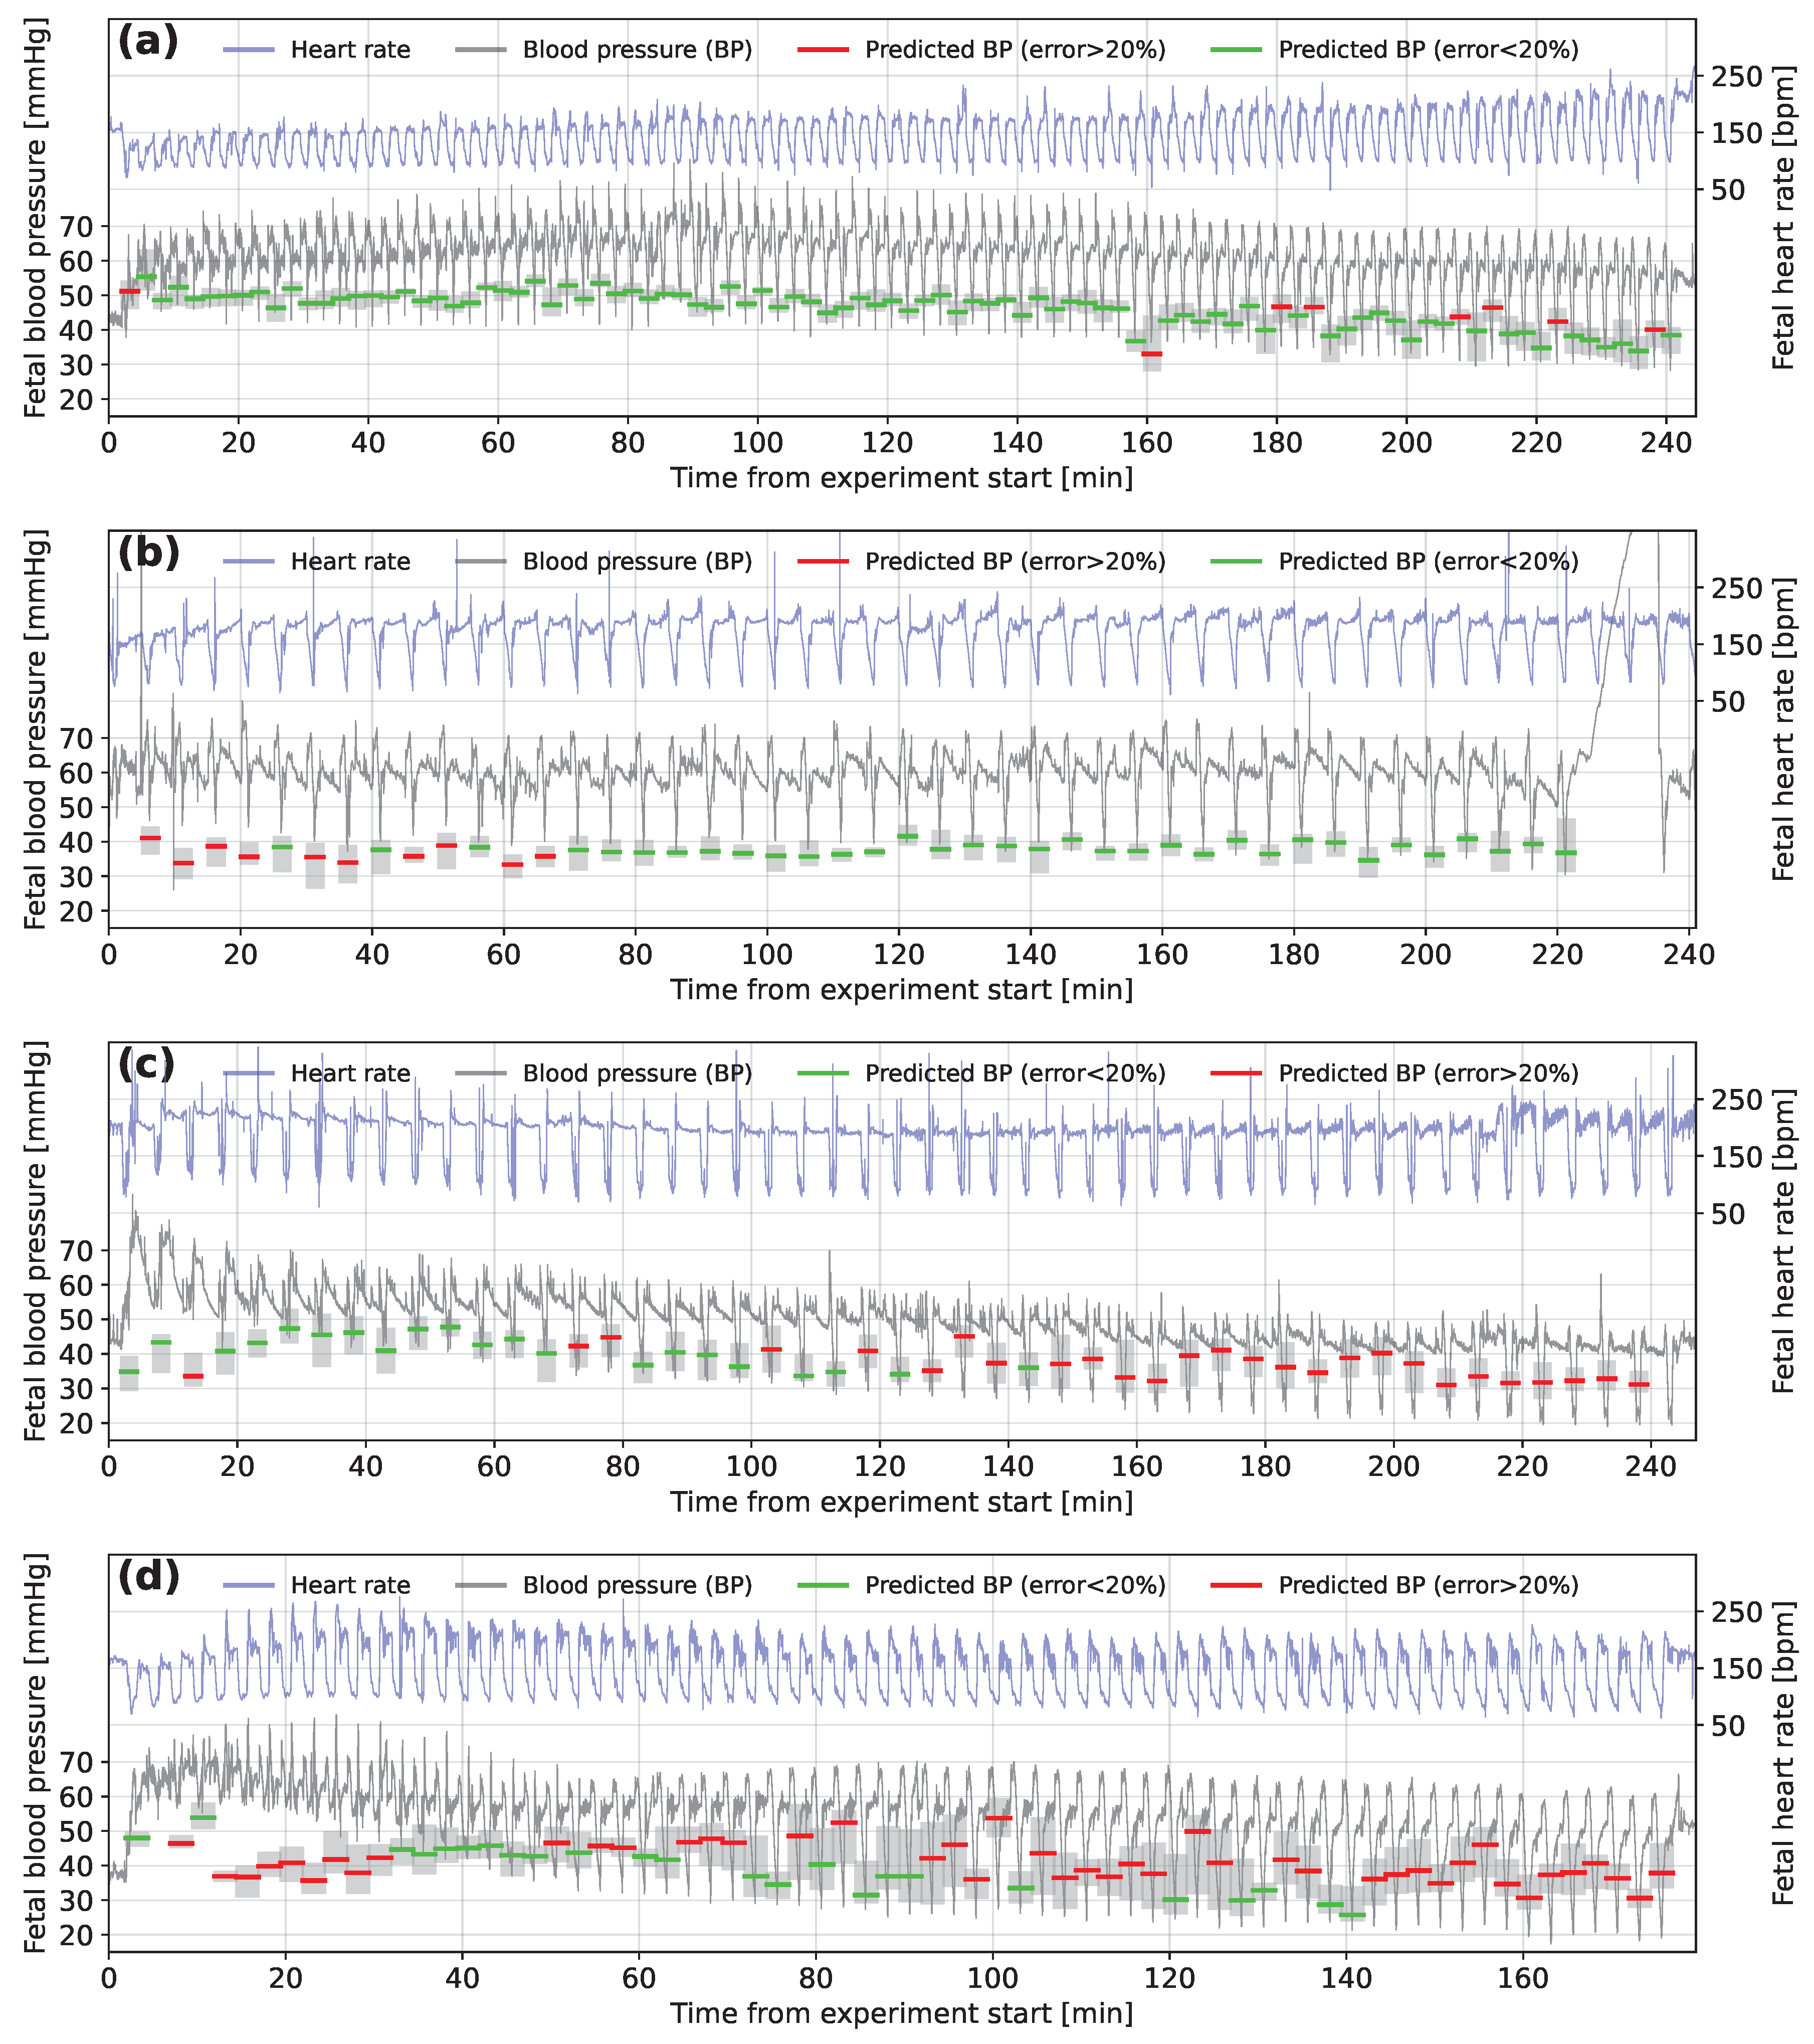
3.3. Interpretation
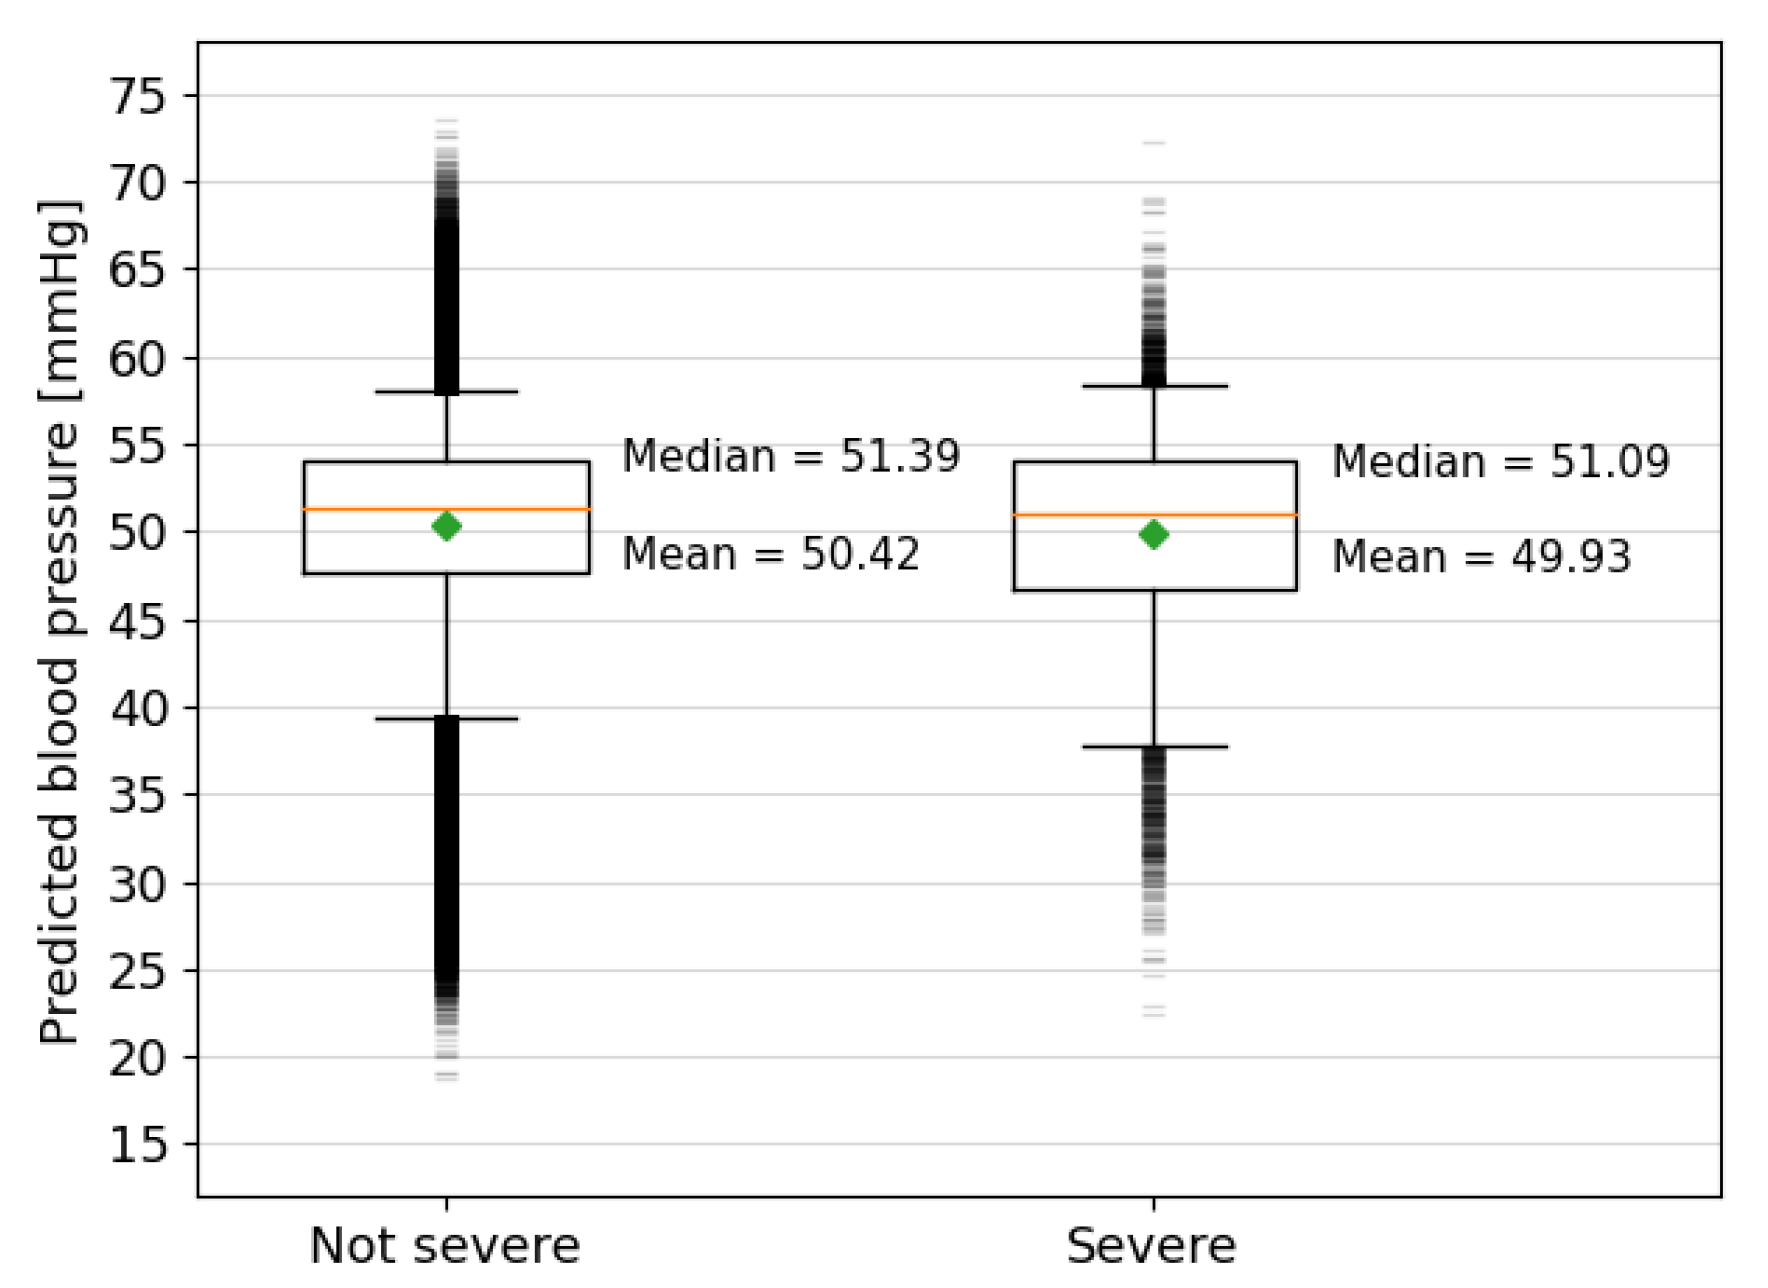
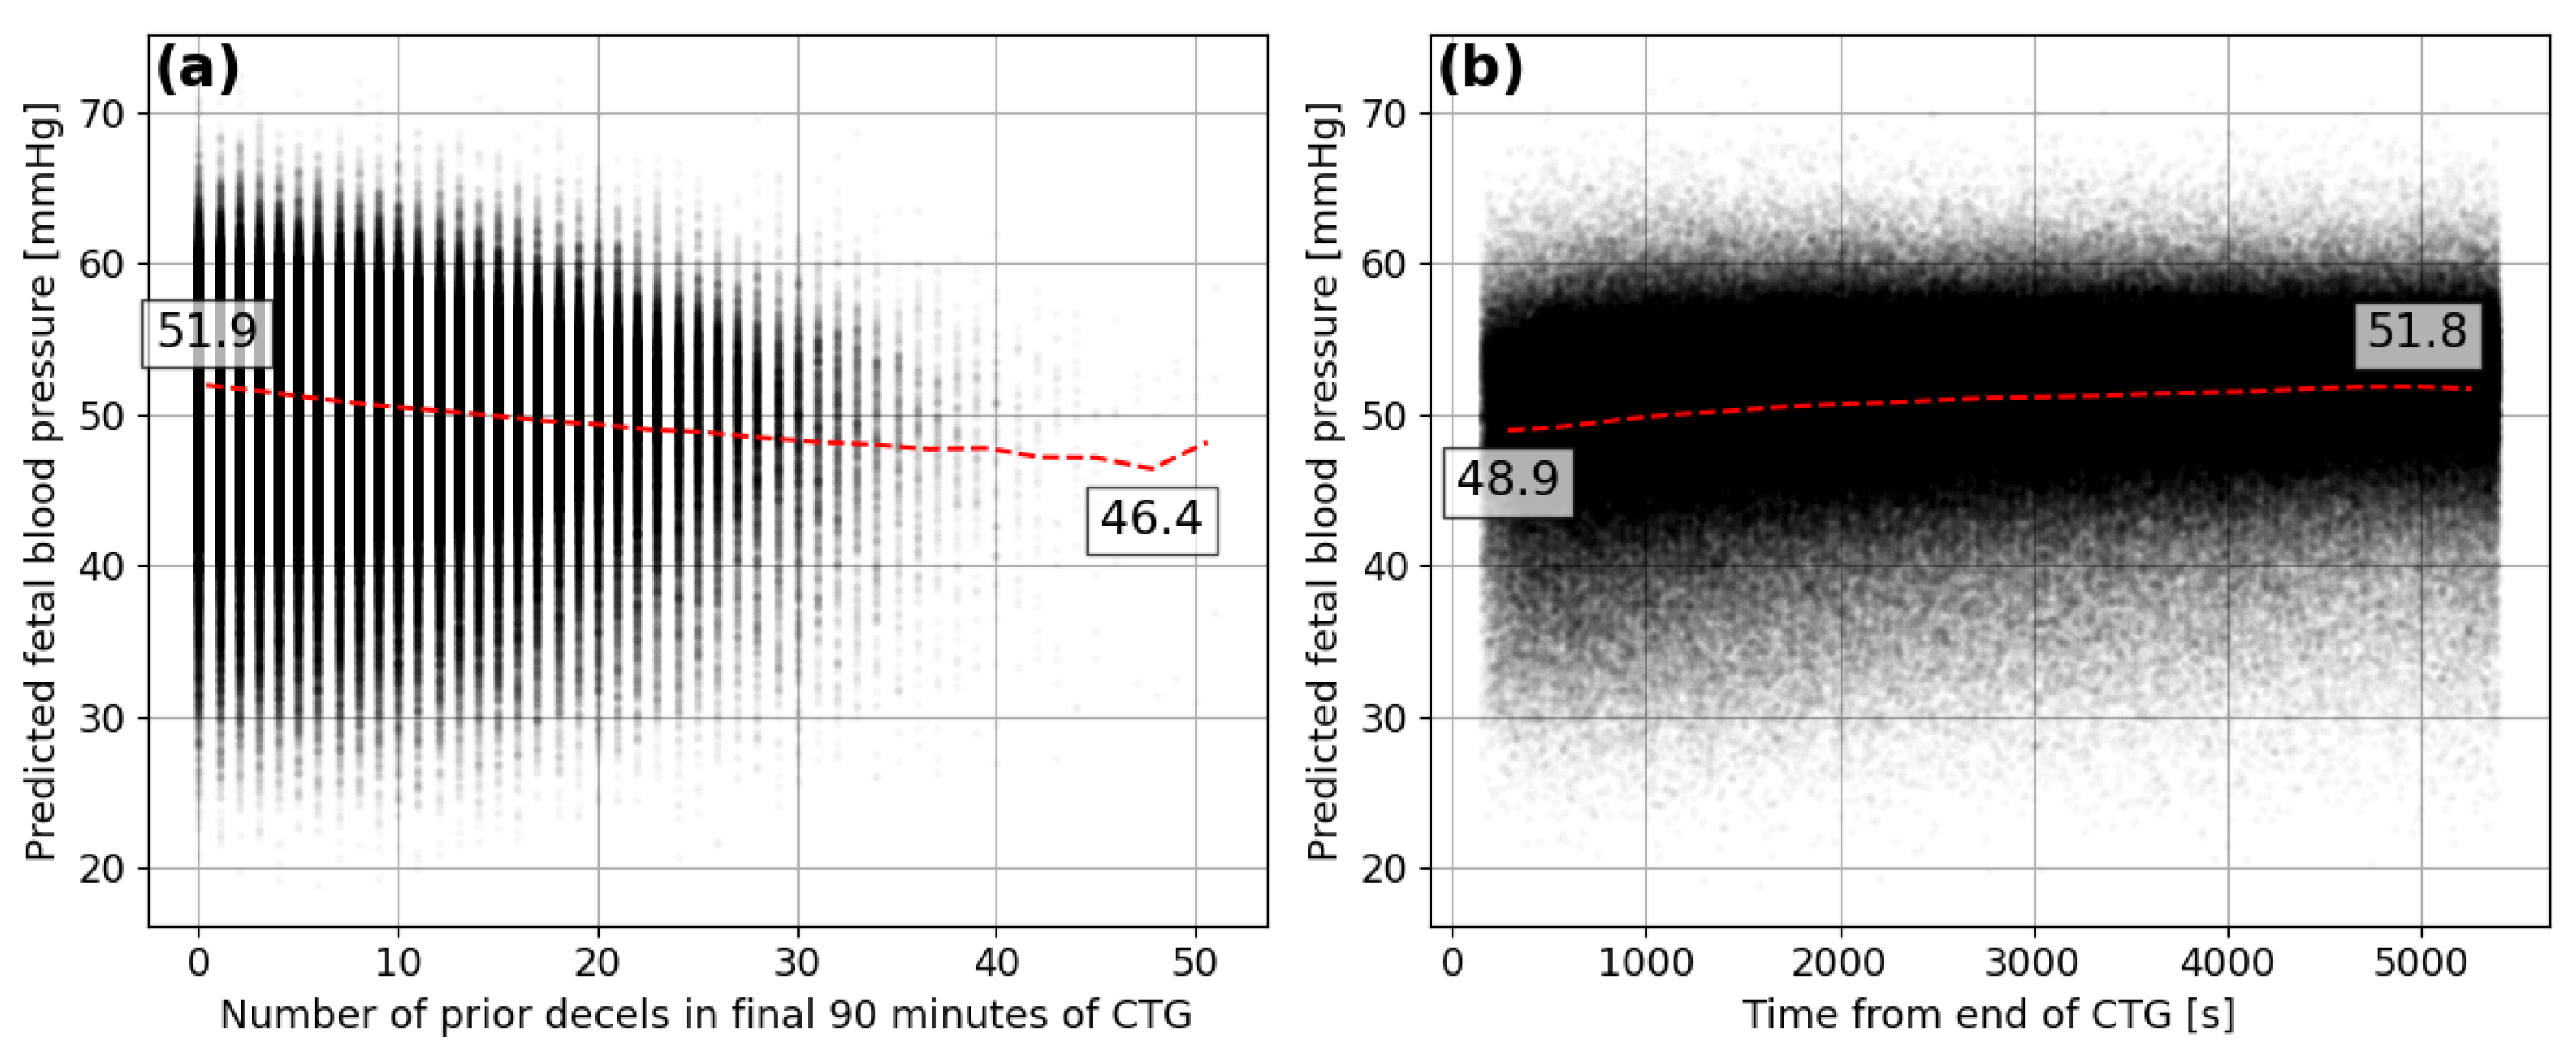
3.4. Analysis of the Oxford Dataset
4. Conclusions
Author Contributions
Funding
Institutional Review Board Statement
Informed Consent Statement
Data Availability Statement
Acknowledgments
Conflicts of Interest
Abbreviations
| FHR | fetal heart rate |
| FBP | fetal blood pressure |
| CTG | cardiotocography |
| CNN | convolutional neural network |
| ReLU | rectified linear unit |
Appendix A. Model Methodology and Development

| Convolutional Layers | Interpretation Layers | Metrics | ||||||||
|---|---|---|---|---|---|---|---|---|---|---|
| Model Type | Filters | Shape | Pooling | Neurons | ||||||
| 150 s FHR | 64, 32 | 7, 7 | 3, 3 | 512, 512 | 6.7 | 17.3 | 0.36 | |||
| 150 s FHR + Ft. | 64, 32 | 7, 7 | 3, 3 | 512, 512 | 6.5 | 16.6 | 0.44 | |||
| Features | - | - | - | 512, 512 | 6.8 | 17.2 | 0.38 | |||
| 10 min. FHR | 64, 32, 16, 8, 8 | 5, 5, 5, 3, 3 | 5, 2, 2, 2, 2 | 40,20 | 6.5 | 18.1 | 0.23 | |||
| 10 min. + Ft. | 64, 32, 16, 8, 8 | 5, 5, 5, 3, 3 | 5, 2, 2, 2, 2 | 74,37 | 6.1 | 16.5 | 0.36 | |||
| 150 s FHR | 16, 8 | 7, 5 | 4, 3 | 512, 256 | 7.2 | 18.2 | 0.27 | |||
| 150 s FHR | 32, 16 | 7, 5 | 4, 3 | 512, 256 | 6.7 | 17.1 | 0.36 | |||
| 150 s FHR | 32, 32 | 7, 5 | 4, 3 | 512, 256 | 6.6 | 16.7 | 0.39 | |||
| 150 s FHR | 64, 32 | 7, 5 | 4, 3 | 512, 256 | 6.4 | 16.0 | 0.43 | |||
| 150 s FHR | 64, 64 | 7, 5 | 4, 3 | 512, 256 | 6.5 | 16.5 | 0.41 | |||
| 150 s FHR | 128, 64 | 7, 5 | 4, 3 | 512, 256 | 6.6 | 16.6 | 0.36 | |||
| 150 s FHR | 128, 128 | 7, 5 | 4, 3 | 512, 256 | 6.5 | 16.6 | 0.37 | |||
| 150 s FHR | 128, 64 | 5, 5 | 4, 3 | 512, 256 | 6.5 | 16.3 | 0.42 | |||
| 150 s FHR | 128, 64 | 7, 7 | 4, 3 | 512, 256 | 6.4 | 16.3 | 0.42 | |||
| 150 s FHR | 128, 64 | 9, 5 | 4, 3 | 512, 256 | 6.6 | 16.7 | 0.40 | |||
| 150 s FHR | 128, 64 | 7, 5 | 0, 0 | 512, 256 | 6.6 | 16.5 | 0.41 | |||
| 150 s FHR | 128, 64 | 7, 5 | 2, 2 | 512, 256 | 6.5 | 16.5 | 0.41 | |||
| 150 s FHR | 128, 64 | 7, 5 | 3, 3 | 512, 256 | 6.4 | 16.3 | 0.43 | |||
| 150 s FHR | 128, 64 | 7, 5 | 4, 4 | 512, 256 | 6.6 | 16.7 | 0.40 | |||
| 150 s FHR | 128, 64 | 7, 5 | 4, 3 | 128, 64 | 6.7 | 17.0 | 0.38 | |||
| 150 s FHR | 128, 64 | 7, 5 | 4, 3 | 256, 512 | 6.6 | 16.6 | 0.40 | |||
| 150 s FHR | 128, 64 | 7, 5 | 4, 3 | 512, 512 | 6.4 | 16.2 | 0.42 | |||
| 150 s FHR | 128, 64 | 7, 5 | 4, 3 | 1024, 512 | 6.5 | 16.5 | 0.40 | |||
References
- Pewowaruk, R.; Racine, J.; Iruretagoyena, J.; Roldán-Alzate, A. Ultrasound Based Computational Fluid Dynamics Assessment of Brachial Artery Wall Shear Stress in Preeclamptic Pregnancy. Cardiovasc. Eng. Technol. 2020, 11, 760–768. [Google Scholar] [CrossRef] [PubMed]
- Chen, Z.; Zhou, Y.; Wang, J.; Liu, X.; Ge, S.; He, Y. Modeling of coarctation of aorta in human fetuses using 3D/4D fetal echocardiography and computational fluid dynamics. Echocardiography 2017, 34, 1858–1866. [Google Scholar] [CrossRef] [PubMed]
- Struijk, P.C.; Mathews, V.J.; Loupas, T.; Stewart, P.A.; Clark, E.B.; Steegers, E.A.P.; Wladimiroff, J.W. Blood pressure estimation in the human fetal descending aorta. Ultrasound Obstet. Gynecol. 2008, 32, 673–681. [Google Scholar] [CrossRef] [PubMed]
- Fujita, Y.; Satoh, S.; Yumoto, Y.; Koga, T.; Kinukawa, N.; Nakano, H. Fetal aortic distension waveforms for evaluating cardiac function and changes in blood pressure: Fetal lamb validation. J. Obstet. Gynaecol. Res. 2006, 32, 155–161. [Google Scholar] [CrossRef]
- De Haan, H.H.; Gunn, A.J.; Gluckman, P.D. Fetal heart rate changes do not reflect cardiovascular deterioration during brief repeated umbilical cord occlusions in near-term fetal lambs. Am. J. Obstet. Gynecol. 1997, 176, 8–17. [Google Scholar] [CrossRef]
- Bennet, L.; Westgate, J.A.; Liu, Y.C.; Wassink, G.; Gunn, A.J. Fetal acidosis and hypotension during repeated umbilical cord occlusions are associated with enhanced chemoreflex responses in near-term fetal sheep. J. Appl. Physiol. 2005, 99, 1477–1482. [Google Scholar] [CrossRef] [Green Version]
- Lear, C.A.; Wassink, G.; Westgate, J.A.; Nijhuis, J.G.; Ugwumadu, A.; Galinsky, R.; Bennet, L.; Gunn, A.J. The peripheral chemoreflex: Indefatigable guardian of fetal physiological adaptation to labour. J. Physiol. 2018, 596, 5611–5623. [Google Scholar] [CrossRef]
- Georgieva, A.; Lear, C.; Westgate, J.; Kasai, M.; Miyagi, E.; Ikeda, T.; Gunn, A.; Bennet, L. Deceleration area and capacity during labour-like umbilical cord occlusions identify evolving hypotension: A controlled study in fetal sheep. BJOG Int. J. Obstet. Gynaecol. 2021, 128, 1433–1442. [Google Scholar] [CrossRef]
- Rivolta, M.W.; Barbieri, M.; Stampalija, T.; Sassi, R.; Frasch, M.G. Relationship Between Deceleration Morphology and Phase Rectified Signal Averaging-Based Parameters During Labor. Front. Med. 2021, 8, 626450. [Google Scholar] [CrossRef]
- Gold, N.; Herry, C.L.; Wang, X.; Frasch, M.G. Fetal Cardiovascular Decompensation During Labor Predicted From the Individual Heart Rate Tracing: A Machine Learning Approach in Near-Term Fetal Sheep Model. Front. Pediatr. 2021, 9, 593889. [Google Scholar] [CrossRef]
- Roux, S.G.; Garnier, N.B.; Abry, P.; Gold, N.; Frasch, M.G. Distance to Healthy Metabolic and Cardiovascular Dynamics From Fetal Heart Rate Scale-Dependent Features in Pregnant Sheep Model of Human Labor Predicts the Evolution of Acidemia and Cardiovascular Decompensation. Front. Pediatr. 2021, 9, 660476. [Google Scholar] [CrossRef] [PubMed]
- Barcroft, J.; Kennedy, J. The distribution of blood between the foetus and the placenta in sheep. J. Physiol. 1939, 95, 173–186. [Google Scholar] [CrossRef] [PubMed]
- Cooper, K.E.; Greenfield, A.D.M.; Huggett, A.S.G. The umbilical blood flow in the foetal sheep. J. Physiol. 1949, 108, 160–166. [Google Scholar] [CrossRef] [PubMed]
- Back, S.; Riddle, A.; Dean, J.A.R.H. The Instrumented Fetal Sheep as a Model of Cerebral White Matter Injury in the Premature Infant. Neurotherapeutics 2012, 9, 359–370. [Google Scholar] [CrossRef] [Green Version]
- van den Heuij, L.; Wassink, G.; Gunn, A.; Bennet, L. Using Pregnant Sheep to Model Developmental Brain Damage. In Prenatal and Postnatal Determinants of Development; Walker, D., Ed.; Humana Press: New York, NY, USA, 2016; Neuromethods Vol. 109. [Google Scholar] [CrossRef]
- Morrison, J.; Berry, M.; Botting, K.; Darby, J.; Frasch, M.; Gartford, K.; Giussani, D.; Gray, C.; Harding, R.; Herrera, E.; et al. Improving pregnancy outcomes in humans through studies in sheep. Am. J. Physiol. Regul. Integr. Comp. Physiol. 2018, 315, 1123–1153. [Google Scholar] [CrossRef] [Green Version]
- Tarvonen, M.J.; Lear, C.A.; Andersson, S.; Gunn, A.J.; Teramo, K.A. Increased variability of fetal heart rate during labour: A review of preclinical and clinical studies. BJOG Int. J. Obstet. Gynaecol. 2022, 129, 2070–2081. [Google Scholar] [CrossRef]
- Lear, C.A.; Westgate, J.A.; Ugwumadu, A.; Nijhuis, J.G.; Stone, P.R.; Georgieva, A.; Ikeda, T.; Wassink, G.; Bennet, L.; Gunn, A.J. Understanding Fetal Heart Rate Patterns That May Predict Antenatal and Intrapartum Neural Injury. Semin. Pediatr. Neurol. 2018, 28, 3–16. [Google Scholar] [CrossRef]
- Barry, J.; Anthony, R. The pregnant sheep as a model for human pregnancy. Theriogenology 2008, 69, 55–67. [Google Scholar] [CrossRef] [Green Version]
- Lear, C.A.; Beacom, M.J.; Dhillon, S.K.; Lear, B.A.; Mills, O.J.; Gunning, M.I.; Westgate, J.A.; Bennet, L.; Gunn, A.J. Dissecting the contributions of the peripheral chemoreflex and myocardial hypoxia to fetal heart rate decelerations in near-term fetal sheep. J. Physiol. 2023, 601, 2017–2041. [Google Scholar] [CrossRef]
- Asfaw, D.; Jordanov, I.; Impey, L.; Namburete, A.; Lee, R.; Georgieva, A. Fetal Heart Rate Classification with Convolutional Neural Networks and the Effect of Gap Imputation on Their Performance. In Machine Learning, Optimization and Data Science, Proceedings of the 8th International Conference, LOD 2022, Certosa di Pontignano, Italy, 18–22 September 2022; Nicosia, G., Ojha, V., La Malfa, E., La Malfa, G., Pardalos, P., Di Fatta, G., Giuffrida, G., Umeton, R., Eds.; Springer Nature: Cham, Switzerland, 2023; pp. 459–469. [Google Scholar] [CrossRef]
- Ogasawara, J.; Ikenoue, S.; Yamamoto, H.; Sata, M.; Yoshifumi, K.; Mitsukura, Y.; Ikegaya, Y.; Yasui, M.; Tanaka, M.; Ochiai, D. Deep neural network-based classification of cardiotocograms outperformed conventional algorithms. Sci. Rep. 2021, 11, 13367. [Google Scholar] [CrossRef]
- Petrozziello, A.; Redman, C.W.G.; Papageorghiou, A.T.; Jordanov, I.; Georgieva, A. Multimodal Convolutional Neural Networks to Detect Fetal Compromise During Labor and Delivery. IEEE Access 2019, 7, 112026–112036. [Google Scholar] [CrossRef]
- Magenes, G.; Signorini, M.; Arduini, D. Classification of cardiotocographic records by neural networks. In Proceedings of the IEEE-INNS-ENNS International Joint Conference on Neural Networks, IJCNN 2000, Neural Computing: New Challenges and Perspectives for the New Millennium, Como, Italy, 27–27 July 2000; Volume 3, pp. 637–641. [Google Scholar] [CrossRef]
- Galinsky, R.; Jensen, E.; Bennet, L.; Mitchell, C.; Gunn, E.; Wassink, G.; Fraser, M.; Westgate, J.; Gunn, A. Sustained sympathetic nervous system support of arterial blood pressure during repeated brief umbilical cord occlusions in near-term fetal sheep. Am. J. Physiol. Regul. Integr. Comp. Physiol. 2014, 306, 787–795. [Google Scholar] [CrossRef] [PubMed]
- Wassink, G.; Bennet, L.; Davidson, J.; Westgate, J.; Gunn, A. Pre-existing hypoxia is associated with greater EEG suppression and early onset of evolving seizure activity during brief repeated asphyxia in near-term fetal sheep. PLOS ONE 2013, 8, e73895. [Google Scholar] [CrossRef]
- Westgate, J.; Bennet, L.; Gunn, A. Fetal heart rate variability changes during brief repeated umbilical cord occlusion in near term fetal sheep. Br. J. Obstet. Gynaecol. 1999, 106, 664–671. [Google Scholar] [CrossRef] [Green Version]
- Lear, C.A.; Georgieva, A.; Beacom, M.J.; Wassink, G.; Dhillon, S.K.; Lear, B.A.; Mills, O.J.; Westgate, J.A.; Bennet, L.; Gunn, A.J. Fetal heart rate responses in chronic hypoxaemia with superimposed repeated hypoxaemia consistent with early labour: A controlled study in fetal sheep. BJOG Int. J. Obstet. Gynaecol. 2023, 130, 881–890. [Google Scholar] [CrossRef] [PubMed]
- Bishop, C.M. Training with Noise is Equivalent to Tikhonov Regularization. Neural Comput. 1995, 7, 108–116. [Google Scholar] [CrossRef]
- Fukushima, K. Neocognitron: A Self-organizing Neural Network Model for a Mechanism of Pattern Recognition Unaffected by Shift in Position. Biol. Cybern. 1980, 36, 193–202. [Google Scholar] [CrossRef] [PubMed]
- Kingma, D.P.; Ba, J. Adam: A Method for Stochastic Optimization. arXiv 2017, arXiv:1412.6980. [Google Scholar] [CrossRef]
- Maas, A.L. Rectifier Nonlinearities Improve Neural Network Acoustic Models. In Proceedings of the 30th International Conference on International Conference on Machine Learning, Atlanta, GA, USA, 16–21 June 2013; Volume 28, p. 3. [Google Scholar]
- Doshi-Velez, F.; Kortz, M.; Budish, R.; Bavitz, C.; Gershman, S.; O’Brien, D.; Scorr, K.; Shieber, S.; Waldo, J.; Weinberger, D.; et al. Accountability of AI Under the Law: The Role of Explanation; Technical Report; Berkman Klein Center Working Group on Explanation and the Law, Harvard University: Cambridge, MA, USA, 2017. [Google Scholar] [CrossRef] [Green Version]
- Salahuddin, Z.; Woodruff, H.C.; Chatterjee, A.; Lambin, P. Transparency of deep neural networks for medical image analysis: A review of interpretability methods. Comput. Biol. Med. 2022, 140, 105111. [Google Scholar] [CrossRef]
- Westgate, J.A.; Bennet, L.; de Haan, H.H.; Gunn, A.J. Fetal heart rate overshoot during repeated umbilical cord occlusion in sheep. Obstet. Gynecol. 2001, 97, 454–459. [Google Scholar] [CrossRef]


| Reference | Number of Sheep | Condition | Occlusion Length | Occlusion Spacing | Number of Occlusions | Segments in Final Dataset |
|---|---|---|---|---|---|---|
| [minutes] | [minutes] | |||||
| N1-5 | 12 | Normoxic | 1 | 5 | 552 | 9384 |
| H1-5 | 8 | Hypoxic | 1 | 5 | 348 | 5916 |
| N1-2.5 | 25 | Normoxic | 1 | 2.5 | 1569 | 26,673 |
| N2-5 | 12 | Normoxic | 2 | 5 | 229 | 3843 |
| Threshold | True | True | False | False | Sensitivity | Specificity |
|---|---|---|---|---|---|---|
| [mmHg] | Positives | Negatives | Positives | Negatives | [%] | [%] |
| 30 | 2845 | 35,790 | 2154 | 5077 | 35.9 | 94.3 |
| 35 | 7419 | 29,495 | 4267 | 4685 | 61.3 | 87.4 |
Disclaimer/Publisher’s Note: The statements, opinions and data contained in all publications are solely those of the individual author(s) and contributor(s) and not of MDPI and/or the editor(s). MDPI and/or the editor(s) disclaim responsibility for any injury to people or property resulting from any ideas, methods, instructions or products referred to in the content. |
© 2023 by the authors. Licensee MDPI, Basel, Switzerland. This article is an open access article distributed under the terms and conditions of the Creative Commons Attribution (CC BY) license (https://creativecommons.org/licenses/by/4.0/).
Share and Cite
Tolladay, J.; Lear, C.A.; Bennet, L.; Gunn, A.J.; Georgieva, A. Prediction of Fetal Blood Pressure during Labour with Deep Learning Techniques. Bioengineering 2023, 10, 775. https://doi.org/10.3390/bioengineering10070775
Tolladay J, Lear CA, Bennet L, Gunn AJ, Georgieva A. Prediction of Fetal Blood Pressure during Labour with Deep Learning Techniques. Bioengineering. 2023; 10(7):775. https://doi.org/10.3390/bioengineering10070775
Chicago/Turabian StyleTolladay, John, Christopher A. Lear, Laura Bennet, Alistair J. Gunn, and Antoniya Georgieva. 2023. "Prediction of Fetal Blood Pressure during Labour with Deep Learning Techniques" Bioengineering 10, no. 7: 775. https://doi.org/10.3390/bioengineering10070775