1. Introduction
Hypothyroidism affects up to 5% of the general population, with an additional 5% remaining undiagnosed and is more common in women than in men [
1,
2]. Iodine deficiency is the most common cause of all thyroid disorders, but in iodine sufficiency, Hashimoto’s thyroiditis is the most common cause of thyroid failure, which results in hypothyroidism [
2].
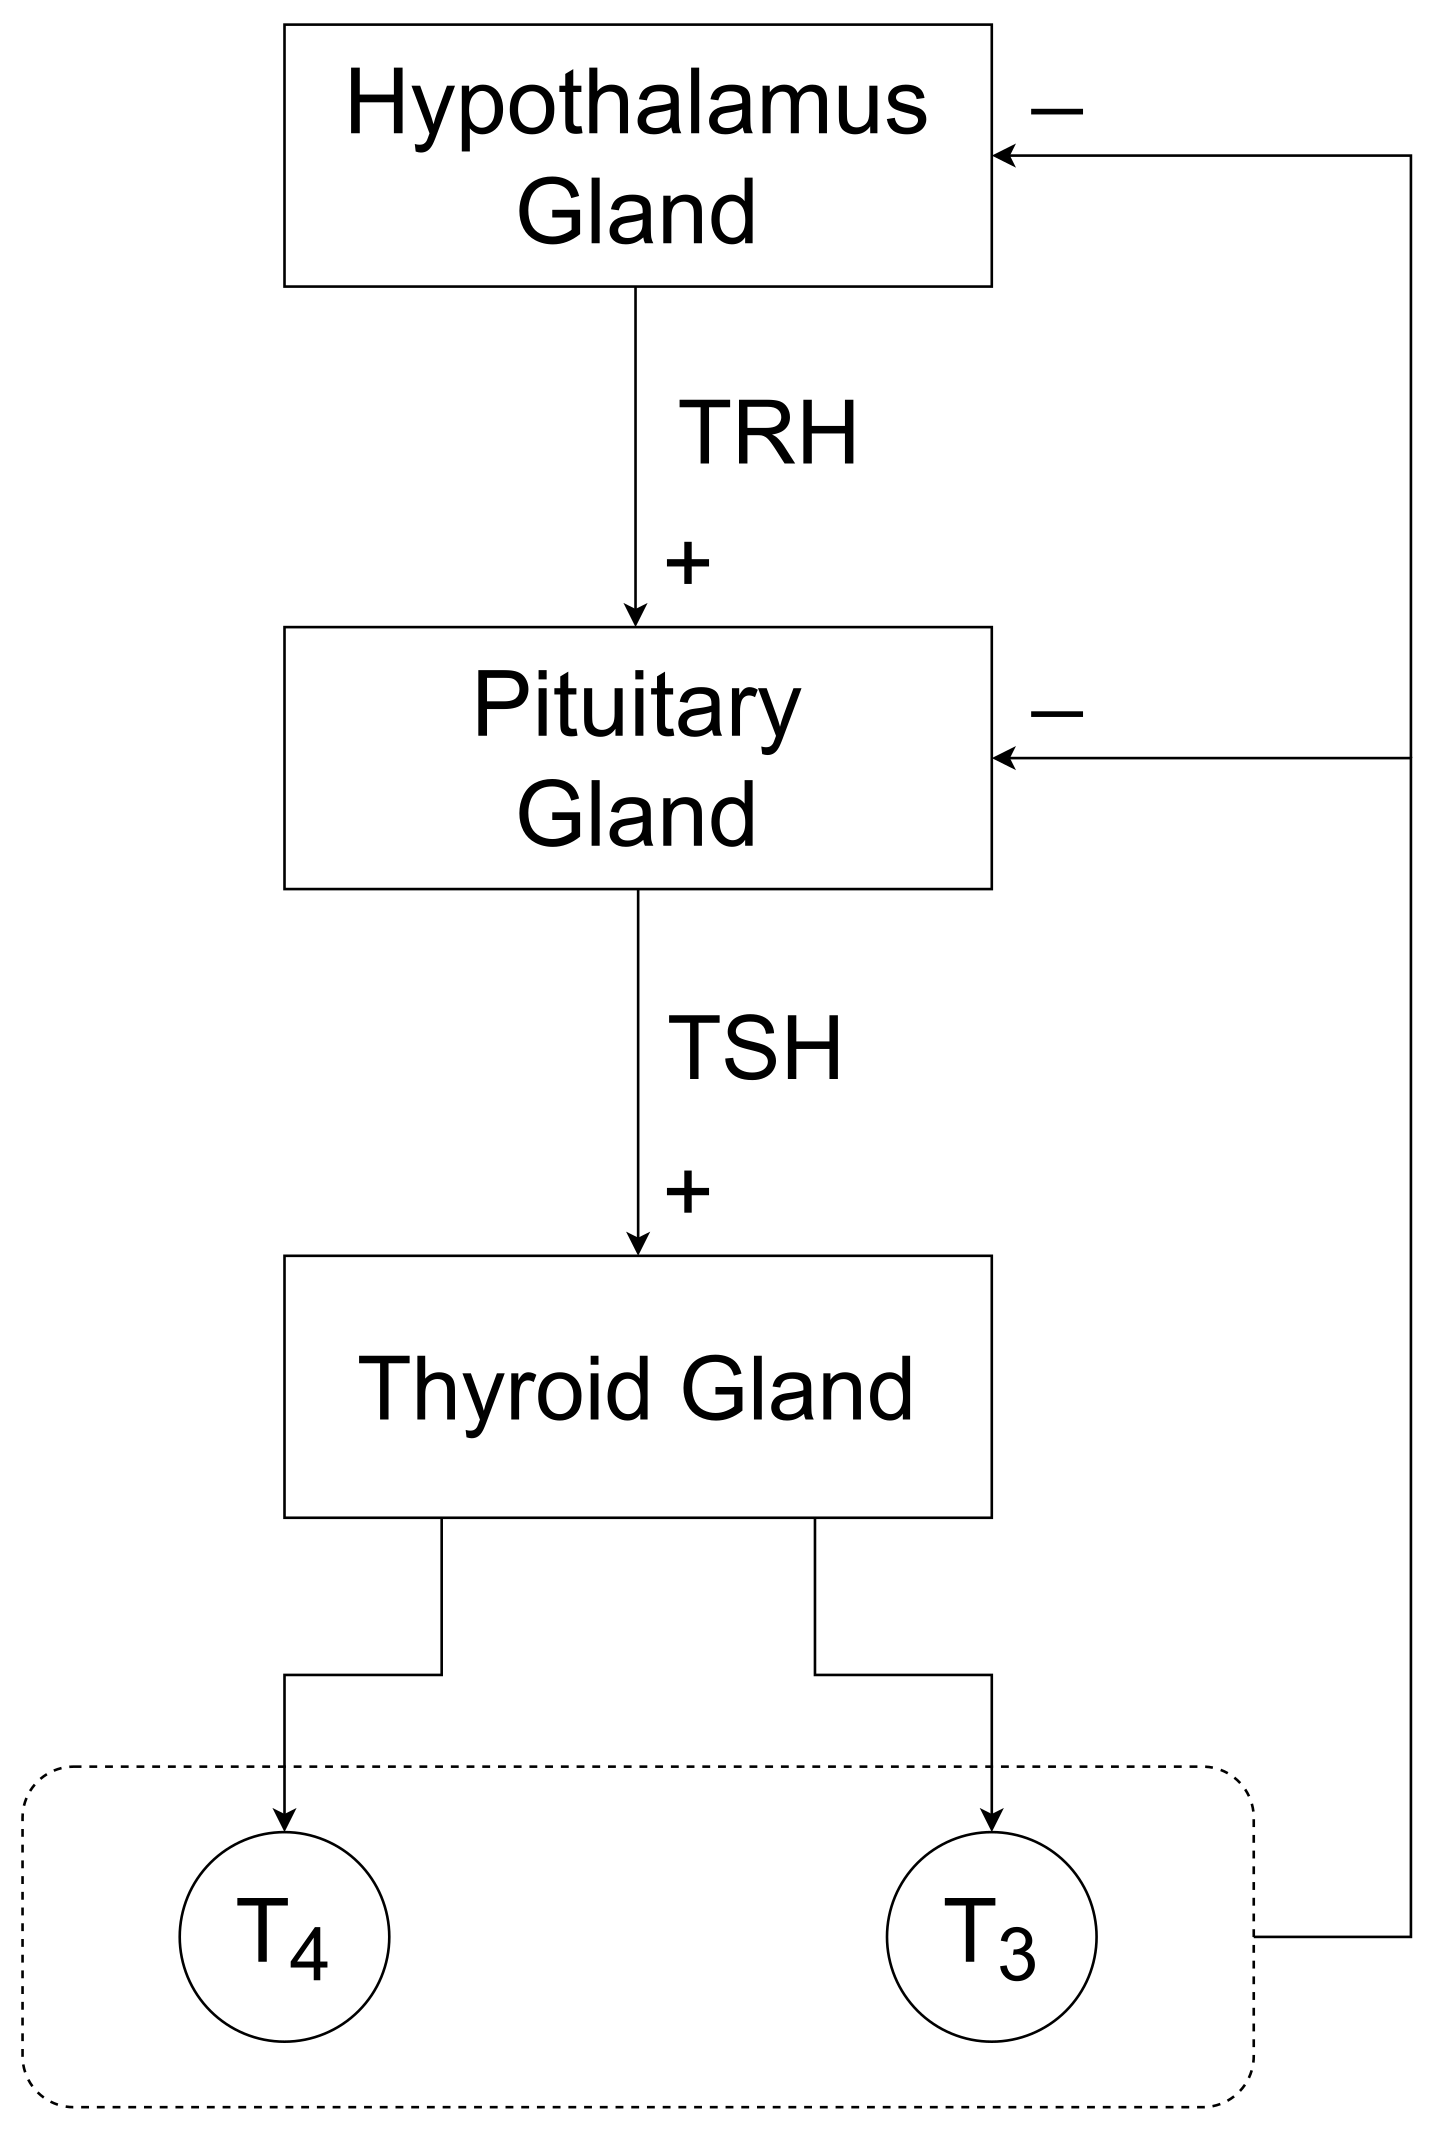
The thyroid gland is a butterfly-shaped gland located in front of our neck. It is responsible for generating the thyroid hormones thyroxine (
) and triiodothyronine (
) mainly. The blood serum concentration of the thyroid hormones is maintained in the human body with the help of the hypothalamic–pituitary–thyroid axis (HPT axis), see
Figure 1. The concentration of
and
hormones acts as a negative feedback signal that feeds to the hypothalamus and pituitary gland. Corresponding to this negative feedback, the hypothalamus and the pituitary gland secrete the thyrotropin-releasing hormone (TRH) and thyroid-stimulating hormone (
TSH), respectively. When the concentration of
and
increases, due to this biological closed-loop (HPT-axis), the concentration of TRH and
TSH decreases, which results in a decrease in
and
hormone concentrations.
1.1. Medical Problem
The thyroid gland consists primarily of follicle cells. These follicle cells are responsible for the production of
and
hormones. When
TSH reaches the follicle cells located in the thyroid gland, it starts stimulating follicle cells to produce
and
hormones. In the case of Hashimoto’s thyroiditis, the human immune system exerts autoimmunological effects on the thyroid gland including, amongst others, the production of thyroid peroxidase antibodies (TPOAb) and thyroglobulin antibodies (TgAb). These antibodies are partially responsible for blocking processes responsible for thyroid hormone production within the follicle cells [
3]. This blocking of
TSH receptors results in a decrease in
and
hormone concentrations (less than the concentration required by human body, i.e.,
and
, 5–12 μg/dL and 0.8–1.9 ng/mL, [
4], correspondingly). Due to the HPT-axis, the hypothalamus and pituitary gland increase TRH and
TSH secretion. Hence, the blood serum concentration of
TSH exceeds its normal range (i.e., 0.5–5.0 mU/L see e.g., [
4]). In the case of Hashimoto’s thyroiditis patients are diagnosed with low
and
concentrations and high
TSH concentration. The diagnosis of Hashimoto’s thyroiditis is usually made by confirming present hypothyroidism (i.e., subclinical hypothyroidism with elevated
TSH and decreased thyroid hormone concentrations) in conjunction with elevated TPOAb and TgAb.
Thyroid hormones play a critical role in, e.g., growth and energy metabolism [
5]. Therefore, changes in the concentration of thyroid hormones can lead to multiple adverse clinical consequences such as reduced quality of life with symptoms such as fatigue, increased cardiovascular risk and weight gain [
6]. A so-called Myxedema coma can be the outcome of a long-standing untreated and severe hypothyroidism [
7].
In clinical routine, hypothyroid patients suffering from Hashimoto’s thyroiditis usually take levothyroxine () oral tablets on a regular, i.e., usually daily, basis. The amount of medication ( dosage) is regulated by physicians according to the blood serum concentration of TSH, free thyroxine () and free triiodothyronine (), as well as some clinical parameters such as body weight. Therefore, a visit to the physician is required under the current treatment procedure. The frequency of these visits depends on the condition of the patient’s thyroid gland (e.g., whether the patient is suffering from overt or subclinical hypothyroidism) and stages of treatment (i.e., at the initial stages, monthly visits are usually required, later, even once or twice a year is also possible).
This study aims to develop an automated dosage recommendation system that obeys all the requirements of
dosing (see
Section 3.3.1). For the systematic construction of the automated dosage recommendation system, a mathematical model is developed that captures the desired human body parameters. Later, with the help of this developed mathematical model, a mathematical model-based control strategy is designed. Both the model and the control strategy are validated using the Thyrosim model [
4,
8,
9,
10] and numerical simulation framework.
The development of an automated levothyroxine dosage recommendation system will decrease patients’ dependency on in-person meetings with physicians. That will eventually lead to an improvement in the current treatment methodology, in which frequent visits to physicians are required (i.e., 4–6 weeks in the initial stages of treatment and twice a year in later stages of treatment).
1.2. Existing Mathematical Models of Human Thyroid Hormone Regulation
A compartment model was developed by Pandiyan [
11] to describe thyroid hormone regulation in patients suffering from Hashimoto’s thyroiditis. This mathematical model does not encapsulate the effect of exogenously administered thyroxine hormone (
) on patient dynamics, which is the main scope of our study. The mathematical model presented in [
12] captures both the effect of
dosage on
TSH and
dynamics. However, the
TSH dynamics is not required in the results presented in this paper.
In [
13], a mathematical model-based optimal
and levotriiodothyronine (
) therapy for patients suffering from hypothyroidism was designed. The study addresses the problem of identifying the optimal dosages of
and
and analysing the effect of
monotherapy over
/
combined therapy on blood serum concentrations of thyroid parameters. A model predictive controller (MPC) is employed as an optimal dosage recommender, which determines the optimal dosage of
and
concerning thyroid hormone concentrations. The model used in the MPC control algorithm is presented in [
14,
15,
16]. In contrast to the model proposed in this paper, this MPC-employing model is much more complex and captures dynamics of human parameters which are typically measured during the regular patient’s appointments (e.g.,
TSH,
). This additionally increases the computational costs of the MPC algorithm. In this paper, it is demonstrated that a control approach which is comparatively less computationally costly is still able to robustly keep the patient’s thyroid hormone concentration within the reference range.
Numerical Simulation of Hashimoto Patients Using Thyrosim
Thyrosim is a web application developed by UCLA laboratory. It was designed and developed primarily for researchers, clinicians and others who are interested in thyroid hormone regulation. It is a well-validated simulation of human thyroid hormone regulation [
17]. Thyrosim has demonstrated its ability to reproduce a wide range of clinical data studies and can display hormonal kinetic responses to different oral dosages of
and
[
17]. Thyrosim provides dynamic responses of total thyroxine (
), total triiodothyronine (
),
,
and
TSH over time, for a 70 kg human [
9,
10]. It has also been upgraded to predict
and
replacement therapy in paediatric patients [
8].
Thyrosim is based on a highly complex mathematical model. This mathematical model consists of 13 differential equations and 60 different mainly patient-specific parameters [
4,
8,
9,
10]. Therefore, designing a controller on the basis of this mathematical model is a highly complicated task. This complexity in Thyrosim’s mathematical model motivated us to develop a mathematical model of human thyroid hormone regulation, which captures the main
-dynamics and can be employed as a controller design model.
3. Results
In this section, the development of the mathematical model-based dosing algorithm is described. In order to evaluate the functioning of this developed dosing algorithm, it is implemented with Thyrosim and simulation-based results are presented.
The results of this study were obtained using MATLAB/Simulink®, version 9.5.0.1298439 (R2018b) on a standard computer (Intel(R) Core(TM) i7-5600U CPU @ 2.60 GHz processor with 8 GB RAM).
3.1. A Control-Oriented Dynamic Model of the Thyroid Gland
A hypothyroid patient suffering from Hashimoto’s thyroiditis is dependent on the exogenous source of
hormones (
tablets mainly). Therefore, the developed mathematical model needs to capture the effect of exogenous thyroxine (
) on the
dynamics. The well-known Michaelis-Menten equation describes enzyme-substrate relations and has been successfully used for modelling reaction dynamics on an abstract level i.e., without a too detailed description of the considered process [
19]. Therefore, the Michaelis–Menten equation [
19] is also used for developing this model. The developed mathematical model consists of two state variables. The total blood serum concentration of exogenous
is represented by the state variable
, the variable
captures the total
concentration in blood serum. The proposed model is given by
where
stands for elimination rate of orally administrated levothyroxine (h),
is the natural elimination rate of (h),
represents the maximum rate achieved by the system (μmol/h),
is the Michaelis constant (μmol),
models the effect of orally administered (ppm).
The dosage input
d (μmol) is the exogenously infused input rate of oral
. This exogenous administration of the
hormone has a significant positive effect on the patient’s total thyroxine (
) concentration. The
concentration in blood serum is approximately 0.02% of
concentration [
20]. Therefore, an increase in
concentration will also increase the patient’s
concentration. The patient’s total
concentration is a combination of
concentration produced endogenously by the thyroid gland (represented by the Michaelis–Menten equation [
19]) and the positive effect of total exogenous
hormone in the blood (with the help of
tablets). For hypothyroid patients, the half-life of
hormone is 9–10 days [
21], which represents the natural elimination rate
of
.
In the developed model, , and are patient-specific constants. The values of these parameters must be identified according to the considered patient. As already mentioned above, Thyrosim is regarded as a “virtual” patient. Therefore, the values of these patient-specific parameters are identified with the help of Thyrosim.
3.1.1. Parameter Identification
Some parameters (
,
and
) of the developed mathematical model need to be identified with respect to an individual patient. In this section, a least-squares algorithm is used to minimise the cost function, see
Figure 2.
with,
where
is the output (
concentration) by Thyrosim for input dosage
d. The signal
represents the output (
concentration) generated by the developed model for the same input dosage
d and
TSH (an output generated by Thyosim corresponding to input dosage
d) at hour
i. The constant
N represents the time duration of the performed simulation.
Optimization Problem
For identifying the parameters
,
and
, the optimization problem
needs to be solved. The implementation of minimization of the cost function
was realized with the Matlab function ‘fminsearch’. The optimization constraints need to be defined in such a manner that the value of estimated parameters must be “realistic” (e.g.,
,
and
must be positive). The identified values of parameters are listed in
Table 1.
Model Assessment
A comparison between the concentration generated by the proposed model and Thyrosim is presented to assess the quality of the proposed model.
In the assessment of the proposed model, we provided the same amount of dosage to Thyrosim and to the proposed model (1). In
Figure 3, both mathematical models received 50 μg/day of dosage in the first month, 80 μg/day in the second month and 110 μg/day in the third month, see
Figure 3a. The values of the identified parameters (
,
and
) are kept constant throughout the simulation. Thyrosim also captures daily hormonal variations of thyroid hormone parameters. Note that the proposed model in Equation (1) does not replicate these daily hormonal variations of
concentration, see
Figure 3b.
From the results depicted in
Figure 3, it is observable that the
concentration generated by the proposed model always lies in the range of daily hormonal variations of
concentration (generated by Thyrosim). As a result, the proposed model can be used as a mathematical model for designing an automated dosage recommendation system for Thyrosim, which prescribes a daily dosage.
3.2. Some Basic Control System-Related Properties of the Model
Analysing control theory-related system properties of the proposed mathematical model is an intended part of controller design. The system’s eigenvalues characterize its response to a given input and non-vanishing initial settings of the state variables, whereas controllability describes whether the system can be guided from an arbitrary initial state to a target state over a finite time interval using the actuating signal [
22]. The system should be controllable to attain the desired final state by using a controlled input. Note that the proposed model can be rewritten as
with,
Some system properties are:
- (a)
The eigenvalues of the system are and , which represent how fast the system will react in response to provided dosage;
- (b)
Controllability: It can be easily checked that the developed system is controllable. Therefore, it is possible to achieve a certain level of concentration in a finite time interval by using a controlled dosage.
3.3. Controller Design
This study aims to develop an automated dosage recommendation system that enables us to automate the dosage of . Exogenous administration of hormones is a highly sophisticated task. The developed controller must follow all the desired guidelines mentioned in the FPI (full prescription information) of dosing (e.g., the dosage must be recommended incrementally, the sampling time must be according to patient condition). Therefore, the designed controller must obey all the following desired requirements:
3.3.1. Requirements for an Automated Dosing Strategy
- (i)
The mathematical model (1) consists of different biological parameters that vary from patient to patient. Therefore, a “robust” dosage administration is mandatory;
- (ii)
Oral administration of hormones will result in a sudden increment of patient blood serum concentration of . Therefore, the designed controller is not allowed to react “too fast”;
- (iii)
A larger daily dosage exceeding 150 μg in children and 500 μg in adults may produce serious or even life-threatening manifestations of toxicity when administered for longer time periods [
23]. Consequently, limitations on the prescribed dosage are essential. Initially, at the beginning of the therapy, a small amount of dosage is prescribed. These dosages are increased incrementally (12.5 μg to 25 μg) until the patient reaches the euthyroid state. Therefore, a defined rate limiter is necessary in the design of an automated dosage recommendation system to control the change in the recommended dosage. Dosages are recommended to the patient with the help of blood serum concentrations of different thyroid hormone parameters (
, TPOAb,
TSH, etc.). Measurement of these parameters initially take place every 4–6 weeks (this sampling time increases in the later stages of treatment, once or twice a year is also possible). Once the parameters are measured, the physician recommends an amount of
dosage. This recommended dosage must be constant until the next measurement of thyroid parameters. Therefore, it is required to design a discrete-time controller with a sampling rate of between 4 and 6 weeks;
- (iv)
A dosage above 200 μg per day must require consultation with a physician before recommendation. Therefore, a saturator is an intended part of this proposed dosage recommendation system that saturates dosage above 200 μg per day;
- (v)
Steady-state requirements: When the patient reaches euthyroid state (normal condition of thyroid hormones), the amount of the dosage recommended to the patient should be constant, unless there are some variations in blood serum concentrations of thyroid hormones.
3.3.2. Selection of the Controller Type
The recommended dosage must be constant between the two diagnoses of patient thyroid parameters (measurement of thyroid gland parameters). Only after the measurement of the thyroid hormones is a change in the recommended amount of dosage possible. Therefore, designing a discrete-time controller is a necessary part of this study. The discrete-time controller’s sampling time must correspond to the patient’s laboratory measurement interval (initially, the diagnosis time is 4–6 weeks, it will increase in the later stages of treatment).
The goal behind designing an automated dosage recommendation is not to achieve a particular
concentration but to achieve the euthyroid state (9.2 to 16.0 ng/L [
24], depending upon patient’s body mass index (BMI) and other parameters such as age or history of chronic disease). Hence, it is recommendable to design a non-integrating discrete-time controller with a sampling time of 30 days (initially, monthly visits to the physician are required).
Calculating the Continuous-Time Transfer Function of the Proposed Model
The proposed model is a so-called linear MISO system (Multi-Input and Single Output). From Equations (3a) and (3b), the output (the Laplace transform of the function
is denoted by
, i.e.,
=
)
in the Laplacian domain can be computed by
with the transfer functions
The transfer function
is regarded as the plant transfer function and
represents the transfer function capturing the dynamics from
TSH to the output
y.
If the patient is suffering from clinical hypothyroidism, most of the concentration presented in the patient body will be due to the recommended dosage (exogenous infusion of thyroxine). Hence, we assume the effect of TSH disturbance (endogenously produced ) to be negligible.
Discretization of Plant
The patient is allowed to take one tablet of
per day. Hence, we use the impulse-invariant discretization [
25] method for discretizing the plant
, which results in the discrete-time transfer function.
with
Due to the high sampling time (≈28 days), the value of
is approximately zero, which yields
Using,
and
yields
Designing the Rate Limiter
The patient’s hormone concentration is maintained with the help of a developed dosage recommendation system. Any sudden change in these hormones (e.g.,
,
TSH etc.) is unaffordable for the patient’s biological condition. The recommended dosage of
must be adjusted according to the mentioned requirements (see
Section 3.3.1). Hence, the development of a designated rate limiter is an intended part of this research. Using the unity feedback loop as depicted in
Figure 4 with the transfer function,
the rate limitation is realized within the automated dosing algorithm. The parameter
is the maximum admissible change in the output (e.g., recommended dosage). Once
is defined, the change in output is ensured to not exceed the defined value of
(the desired change in recommended dosage 12.5 μg to 25 μg).
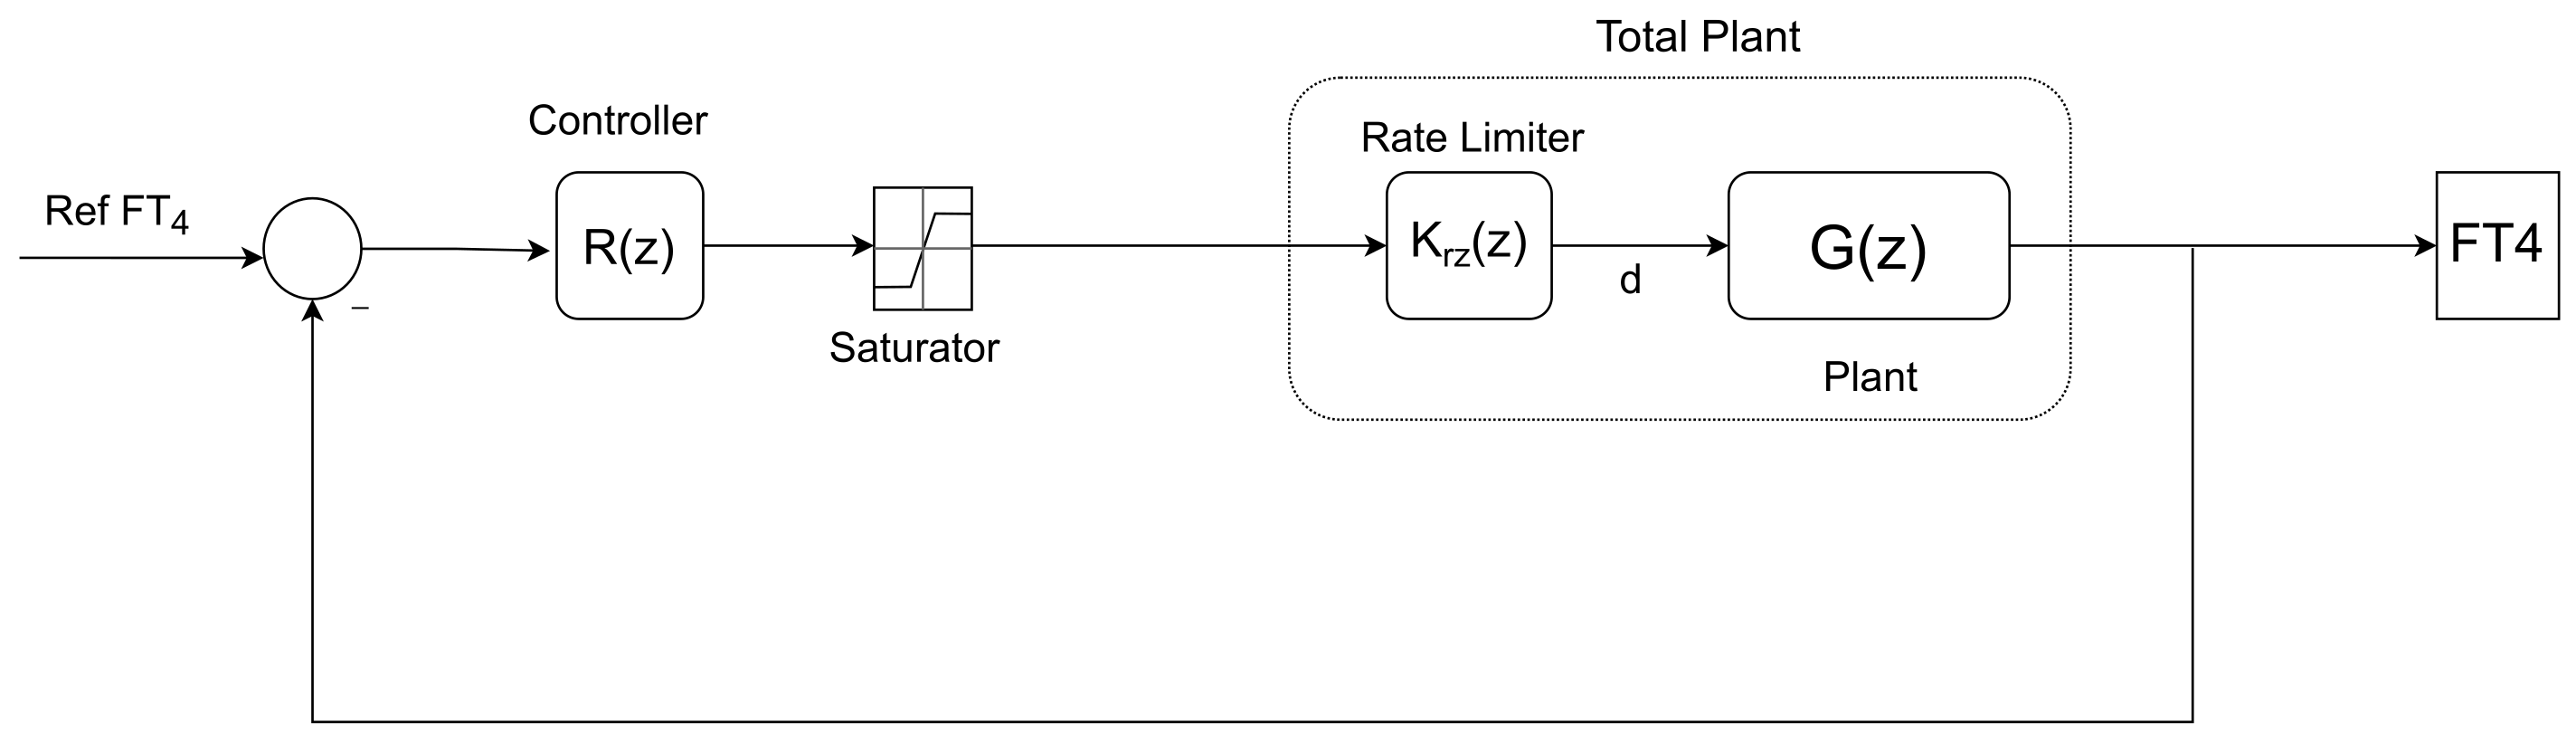
The overall transfer function of the rate limiter describing the dynamics from the controller’s output to the plant’s input is given by
In order to design the controller transfer function
, the rate limiter
and the plant
are considered as controller design transfer function (total plant in
Figure 5).
The values of
A,
and
are mentioned in Equation (5a) and
The pole assignment method, see, e.g., [
26], is used for designing a discrete-time controller
The closed-loop transfer function of the developed system depicted in
Figure 5 is
Denoting
as the is desired characteristic polynomial of
, i.e.,
the poles of the characteristic polynomial can be placed at desired locations specified by
. By solving
the values
,
,
and
and hence the controller
are calculated
When the poles of characteristic polynomial (z) are placed near , then the system will react too fast. That is not recommendable for biological systems. When the poles of are placed near −1 or +1, then the developed system has overshoots and it also negatively effects the robustness of the system, which is undesirable. Currently, all the poles of are placed at , because at this point, the developed system shows less overshoot and the system is not reacting too fast.
3.3.3. Robustness Analysis of the System
The developed controller must be suitable for all patients and must be able to deal with the possible uncertainties in the parameters of the proposed model (1). In the proposed model, the bioavailability of
drug is uncertain, which will vary from slightly above 80% to 64% [
18] (hypothyroidism slightly above 80% and the under-fastened condition bioavailability of
decrease to 64%).
To analyse the robust stability of the developed system for the mentioned uncertainty (bioavailability of
) the Jury, Pavlidis theorem [
27] is used. This theorem states that the polynomial family
with (
)
continuous is Schur-stable if and only if:
- (i)
There exists a ∈ for which the polynomial is Schur-stable;
- (ii)
≠0, ∀ ;
- (iii)
≠0, ∀ ;
- (iv)
det
≠0, ∀
, where
and (omitting the dependency on
q)
where matrix
and
have (
) rows and (
) columns,
n is the order of polynomial
.
The characteristics polynomial
of the developed system is
The values of patient-based parameters
A,
and
are mentioned in Equations (5a) and (5d). The characteristic polynomial family
is Schur-stable, if it follows all the mentioned conditions by Jury and Pavlidis [
27], i.e.:
- (i)
is Schur-stable;
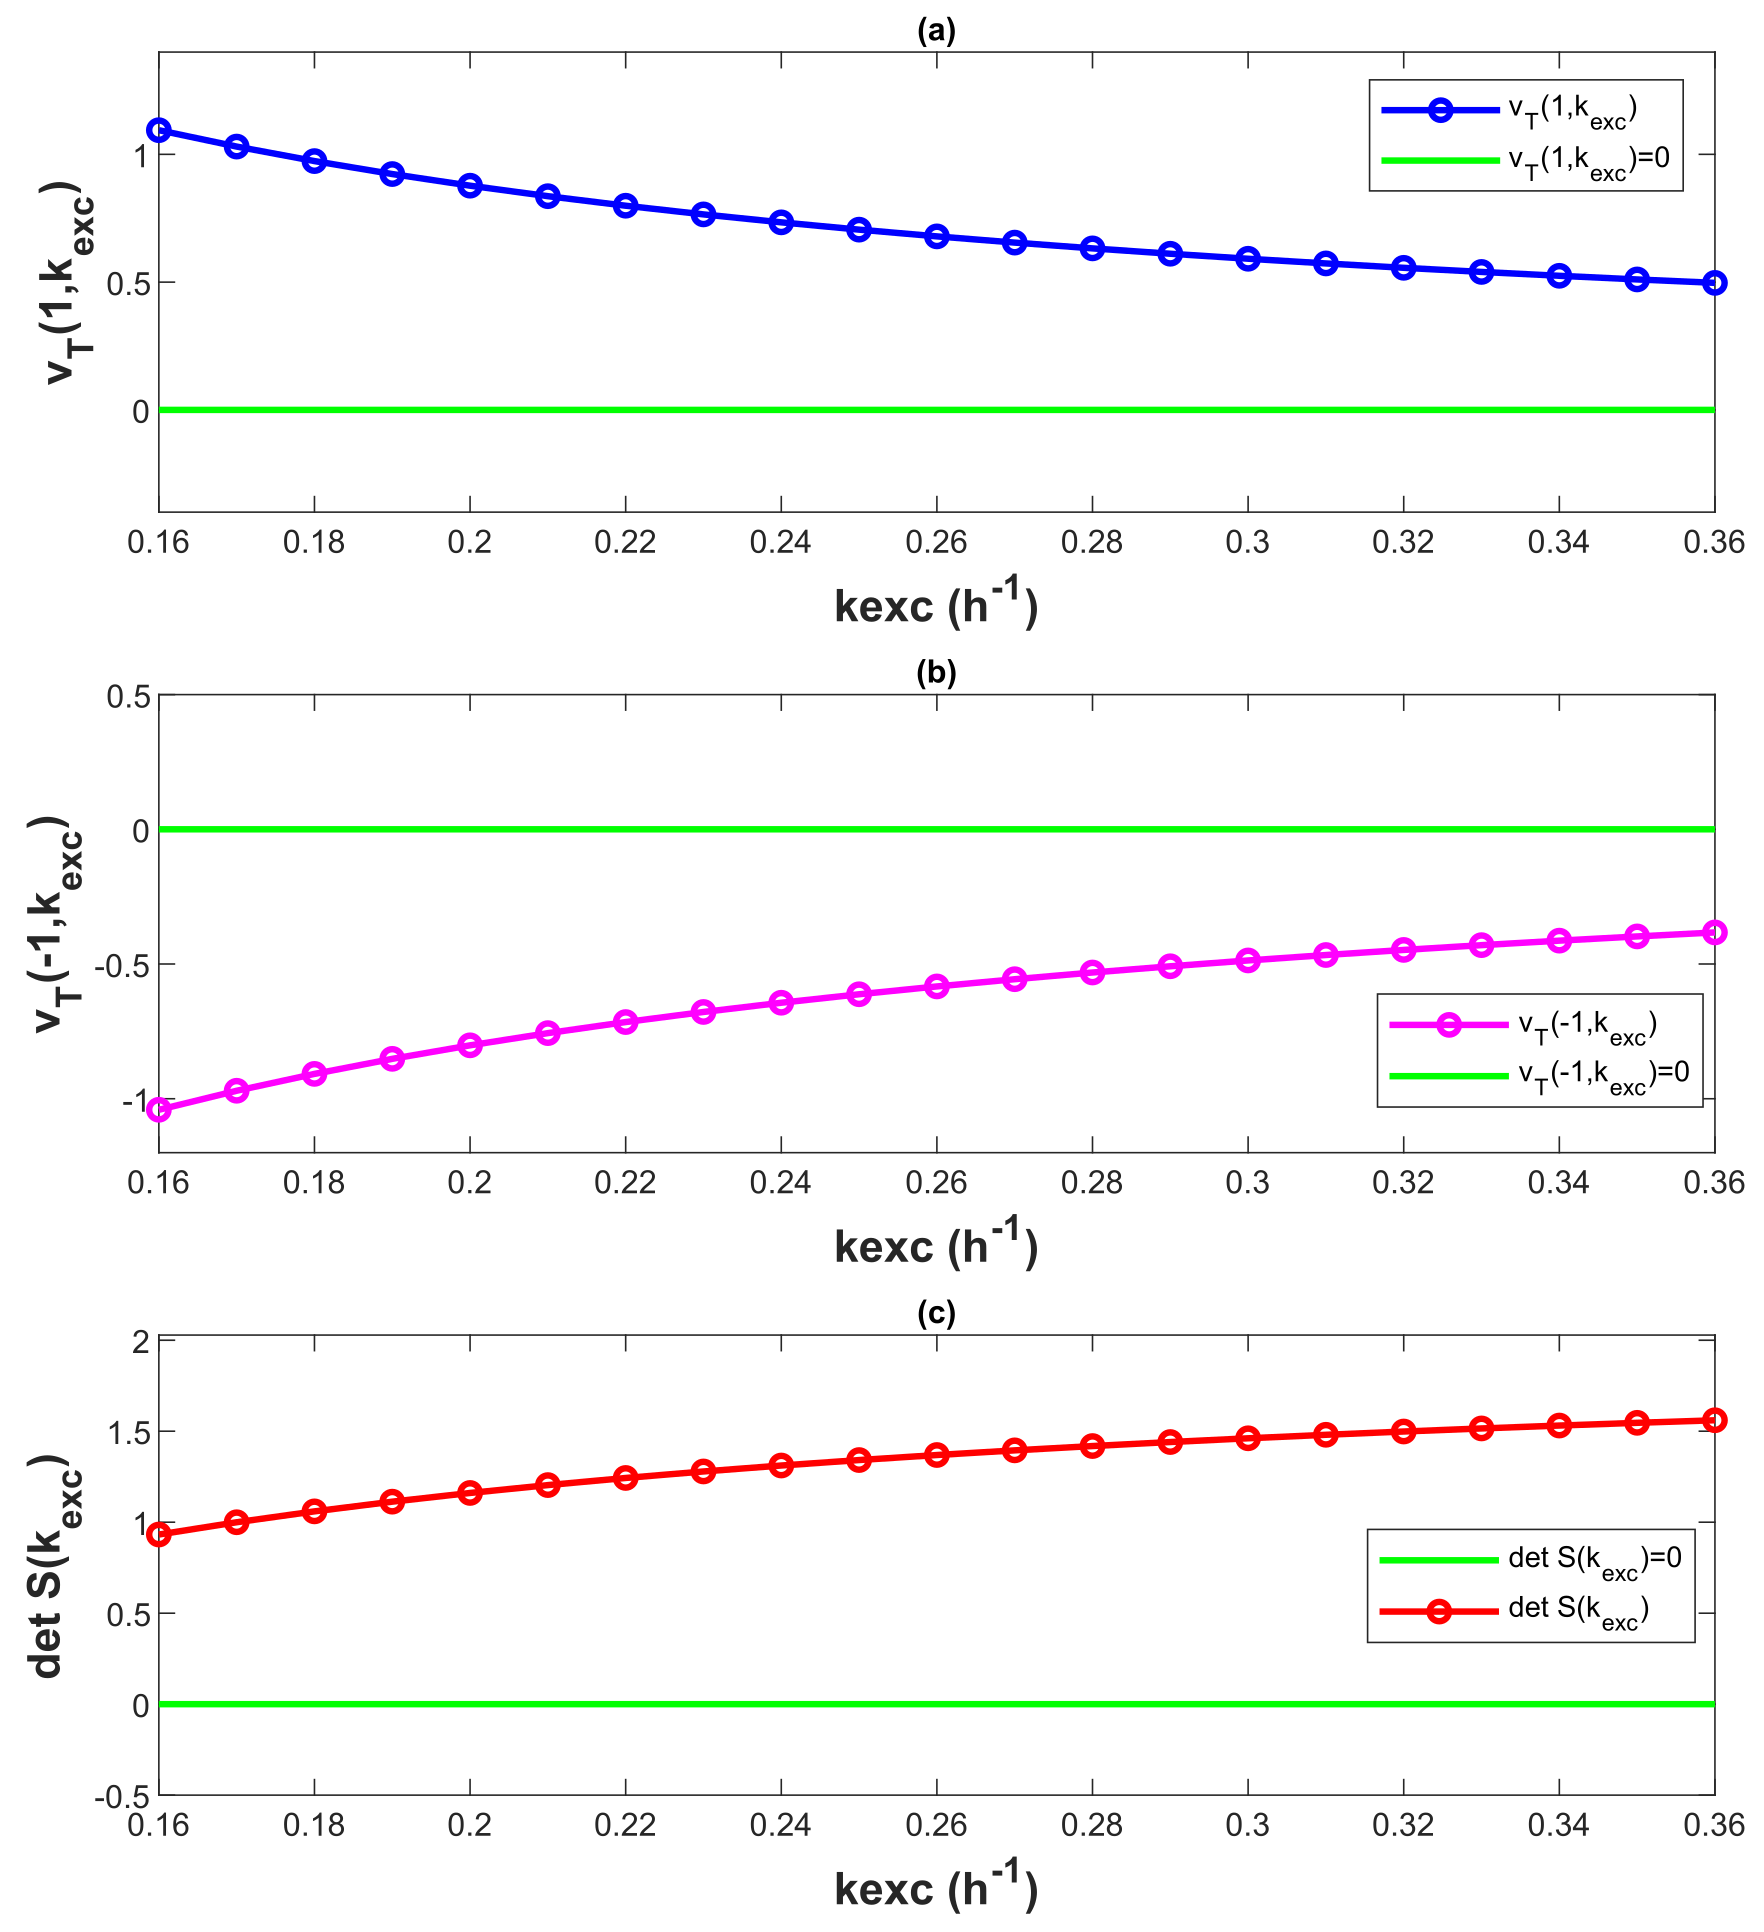
- (ii)
≠ 0, ∀
∈ [0.16, 0.36], see
Figure 6a;
- (iii)
≠ 0, ∀
∈ [0.16, 0.36], see
Figure 6b;
- (iv)
det S(
) ≠ 0, ∀
∈ [0.16, 0.36], where S(
) = X(
) − Y(
), see
Figure 6c.
The characteristic polynomial
obeys all the conditions mention by the Jury, Pavlidis theorem, for
∈ [0.16, 0.36]. This is also illustrated by
Figure 6. Therefore, the system is robust and stable for the provided parameter uncertainty
∈ [0.16, 0.36].
3.4. Evaluation of Automated Dosage Recommendation System
The developed automated dosage recommendation system is used to maintain the
concentration of a patient modelled by Thyrosim, see
Figure 7.
Figure 8a shows the amount of dosage prescribed by the developed automated dosage recommendation system.
Figure 8b represents the
concentration generated by Thyrosim for the corresponding amount of dosage. The total time of the simulation is 12 months. For the entire simulation, the reference
concentration is constant at 13 ng/L. The
dosage recommended to the patient is varied by 12.5 μg/month. The recommended amount of dosage becomes constant once the patient’s
concentration settles within the reference range.
In
Figure 9a, the amount of dosage prescribed by the developed automated dosage recommendation system is presented.
Figure 9b shows the
concentration generated by Thyrosim for the corresponding amount of dosage. The total time of simulation is three years. The reference
concentration is 16 ng/L for the first 18 months and in the last 18 months, it decreases to 12 ng/L. The results from
Figure 8 and
Figure 9 demonstrate that with the help of the developed automated dosage recommendation system, the patient’s
concentration is maintained within the reference range. For maintaining the patient’s
concentration within the reference range, the dosage recommended by the developed automated recommendation system follows all the requirements of
dosing mentioned in the
Section 3.3.1.
Statistical Analysis of 50 Patients
In
Figure 10, the parameters of the Thyrosim model are varied to simulate 50 different virtual patients. The parameters have varied within their possible range of variation. The designed automated dosage recommendation system has been used to treat all simulated patients. The mean and standard deviation of the patients’
concentration and recommended dosage has been calculated monthly. The results reveal that while the variation between the patients’
concentrations is high at the beginning of treatment, by employing the developed automated dosage recommendation system in the latter stages of treatment, all patients acquire the
concentration within the reference range. This demonstrates that with the possible parameter uncertainties, a certain level of
concentration (within the euthyroid range 9.2–16 ng/L [
24]) can be maintained by using the developed automated dosage recommendation system.
The developed automated dosing algorithm sampled with a fixed sampling time (e.g., 28 days). In real-world scenarios, physicians may choose to adjust the recommended amount of dosage for patients at different time intervals (e.g., 4–6 weeks in the initial phase of the treatment, and in the later stages, even twice a year is also possible). Furthermore, the proposed mathematical model (1) does not account for the effects of thyroid antibody concentrations (TPOAb and TgAb) on the system’s dynamics. To encapsulate the effects of these antibody concentrations (TPOAb and TgAb) on the dynamics of the system, further investigation is required.
4. Discussion
The scope of this study is to develop an automated dosage recommendation system that prescribes a daily dosage of
to hypothyroid patients. With the help of the prescribed dosage, patients can maintain their thyroid hormone concentration within the euthyroid state. The recommended dosage must follow all the requirements of
dosing (see
Section 3.3.1). In our model, the reference range of
concentration is 9.2–16 ng/L (mean 12.9 ng/L [
24]), the developed dosage recommendation system must be able to maintain the patient’s
concentration within the reference range.
In
Figure 8, the reference concentration is set at 13 ng/L. The proposed controller is a non-integrating discrete-time controller. As a result, the system’s output will have a steady-state error. However, the goal is not to reach a specific reference concentration; rather, a
concentration within the reference range is suitable for the patient’s biological condition.
Figure 8a represents the dosage recommended by the controller. The recommended dosage follows the mentioned requirements (see
Section 3.3.1). Initially, a small amount of the dosage (e.g., 12.5 μg) is recommended by the developed controller. Later, the recommended dosage is incremented with monthly increments of 12.5 μg. When the
concentration of Thyrosim attains a value within the reference range, the recommended dosage becomes constant (as mentioned in FPI) with no fluctuations.
Figure 8b represents the
concentration of Thyrosim for the corresponding amount of dosage. With the help of the recommended dosage generated by the developed controller, the
concentration of Thyrosim is increased slowly after reaching the desired concentration (within the reference range of
concentration) Thyrosim’s
concentration becomes constant (as demanded in
Section 3.3.1).
In
Figure 9, the reference
concentration varies over time (e.g., first 18 months 16 ng/L, last 18 months 12 ng/L).
Figure 9a represents the dosage recommended by the controller. In the first 18 months, a constant increment of 12.5 μg/month in dosage is observable. When Thyrosim
concentration reaches a value within the reference
concentration, the dosage recommended by the controller gets constant. In the last 18 months, the reference
concentration is decreased to 12 ng/L. Consequently, the dosage recommended by the developed controller decreases with a decrement of 12.5 μg/month. When Thyrosim’s
concentration attains a value within the reference
concentration, the recommended dosage by the controller becomes constant. This demonstrates that the system fulfils the steady-state requirement (recommended dosage must be constant after reaching the desired
concentration “euthyroid state”). Correspondingly,
Figure 9b the
concentration generated by Thyrosim varies according to the recommended dosage by the controller. When Thyrosim
concentration attains a value within the reference
concentration (for both times, initially, 16 ng/L and later 12 ng/L), it becomes constant with no fluctuations. This demonstrates that the developed automated dosage recommendation system adheres to the
dosage administration guidelines (see
Section 3.3.1). Thyrosim’s
concentration can be maintained within the reference range by employing this proposed automated dosage recommendation system.
The biological parameters of patients are different from patient to patient. The proposed automated dosage recommendation system must be able to deal with possible parametric uncertainties and recommend the dosage that obeys all
prescription guidelines (see
Section 3.3.1). In
Figure 10, a statistical analysis is performed to assess the developed system’s capability in dealing with possible parameter uncertainties. The Thyrosim model has 60 biological parameters that can be varied within their possible range of variation. This parameter variation in the Thyrosim model is used to simulate 50 different patients. In
Figure 10a, at the beginning of the treatment, the difference between patients’
concentration is high, as the biological conditions of patients can be different. As treatment progresses, the standard deviation between patients’
concentration decreases, and in the final phases of treatment, the standard deviation between patients’
concentration has been minimized with the help of the dosage recommended by the developed automated dosage recommendation system. Correspondingly, in
Figure 10b, the standard deviation in recommended dosage is low at the beginning of the treatment. Patients with different biological conditions require different amounts of dosage to achieve reference
concentration, therefore, the standard deviation in the recommended dosage increases as treatment progresses. Thus, a reference
concentration is maintained in different patients (simulated by Thyrosim) using the developed automated dosage recommendation system.
Note that the results presented in this study are based on simulation only. Consequently, in a next step, data from real patients need to be incorporated and a clinical validation of the proposed approach is required.


