
Oscillatory ERK Signaling and Morphology Determine Heterogeneity of Breast Cancer Cell Chemotaxis via MEK-ERK and p38-MAPK Signaling Pathways
 , , , and
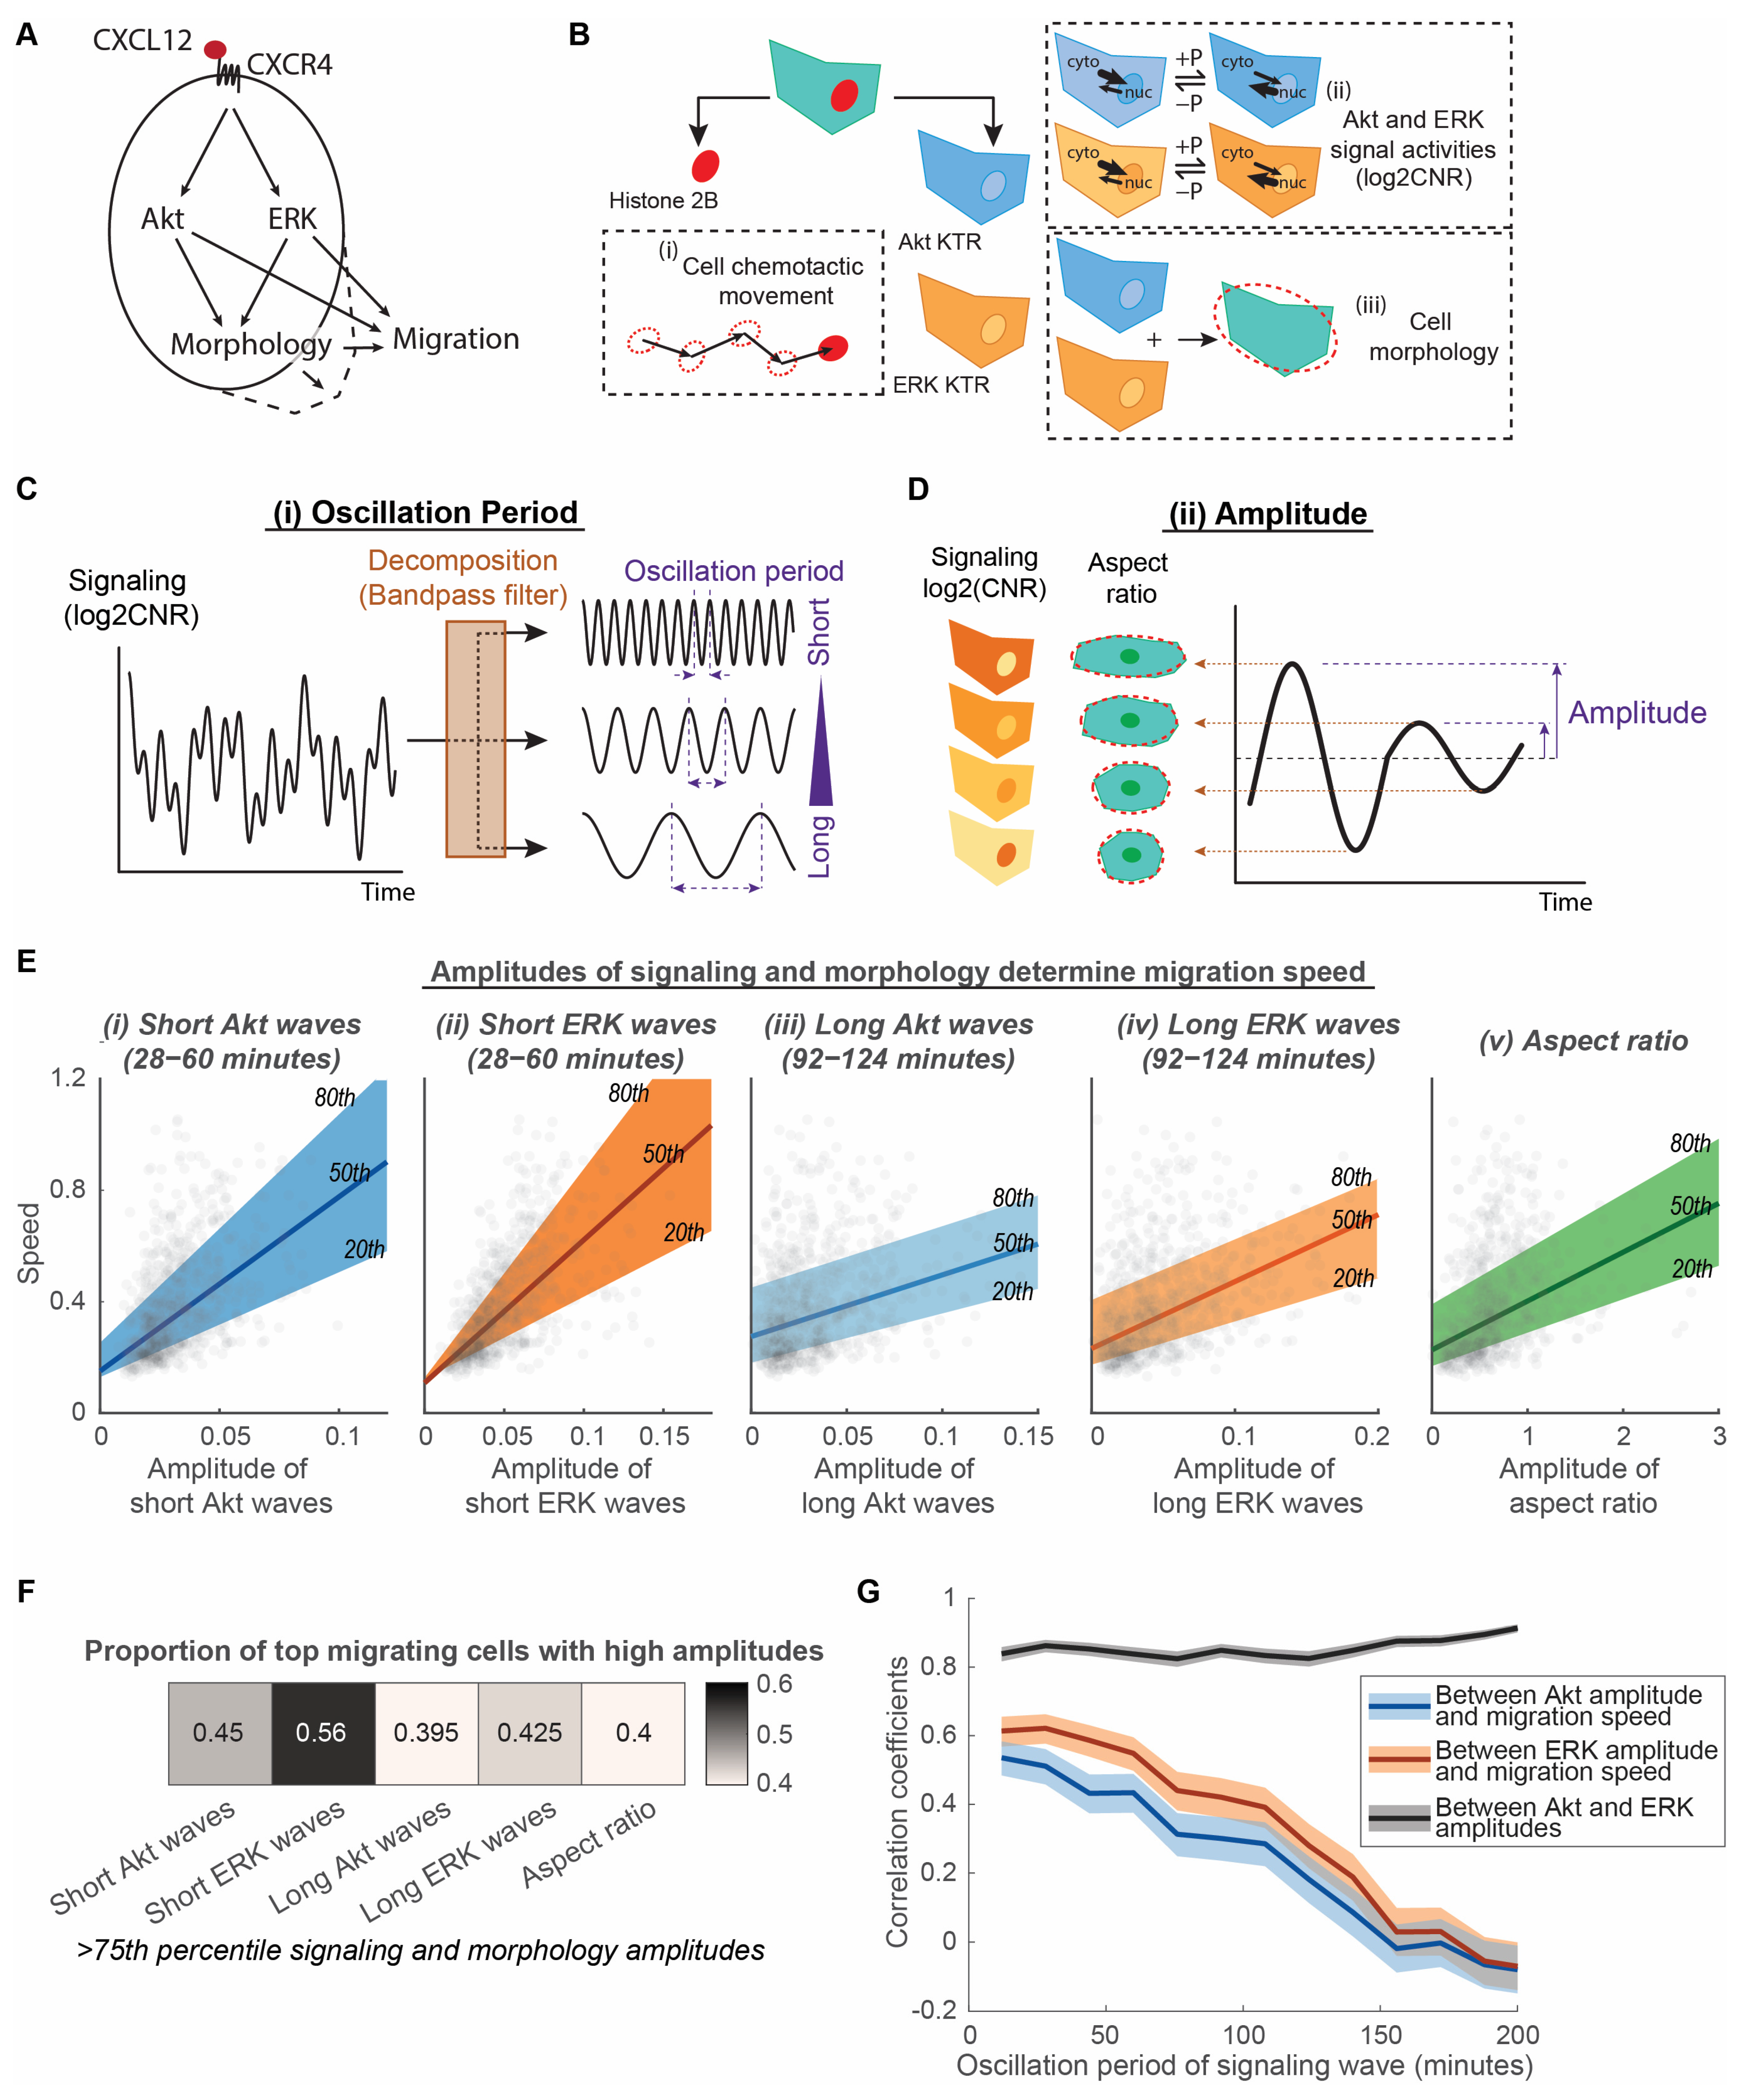
Abstract
:1. Introduction
2. Material and Methods
2.1. Cell Culture and Stable Expression of Fluorescence Reporters in Cells
2.2. Chemotaxis Experiments
2.3. Automated Time-Lapse Fluorescence Imaging and Image Processing
2.4. Single-Cell Analysis
2.5. Quantile Regression
2.6. Earth Mover’s Distance
2.7. Variational System Identification
3. Results
3.1. Amplitudes of Akt and ERK Signaling Waves and Morphological Aspect Ratio Determine Migration Speed of Cancer Cells
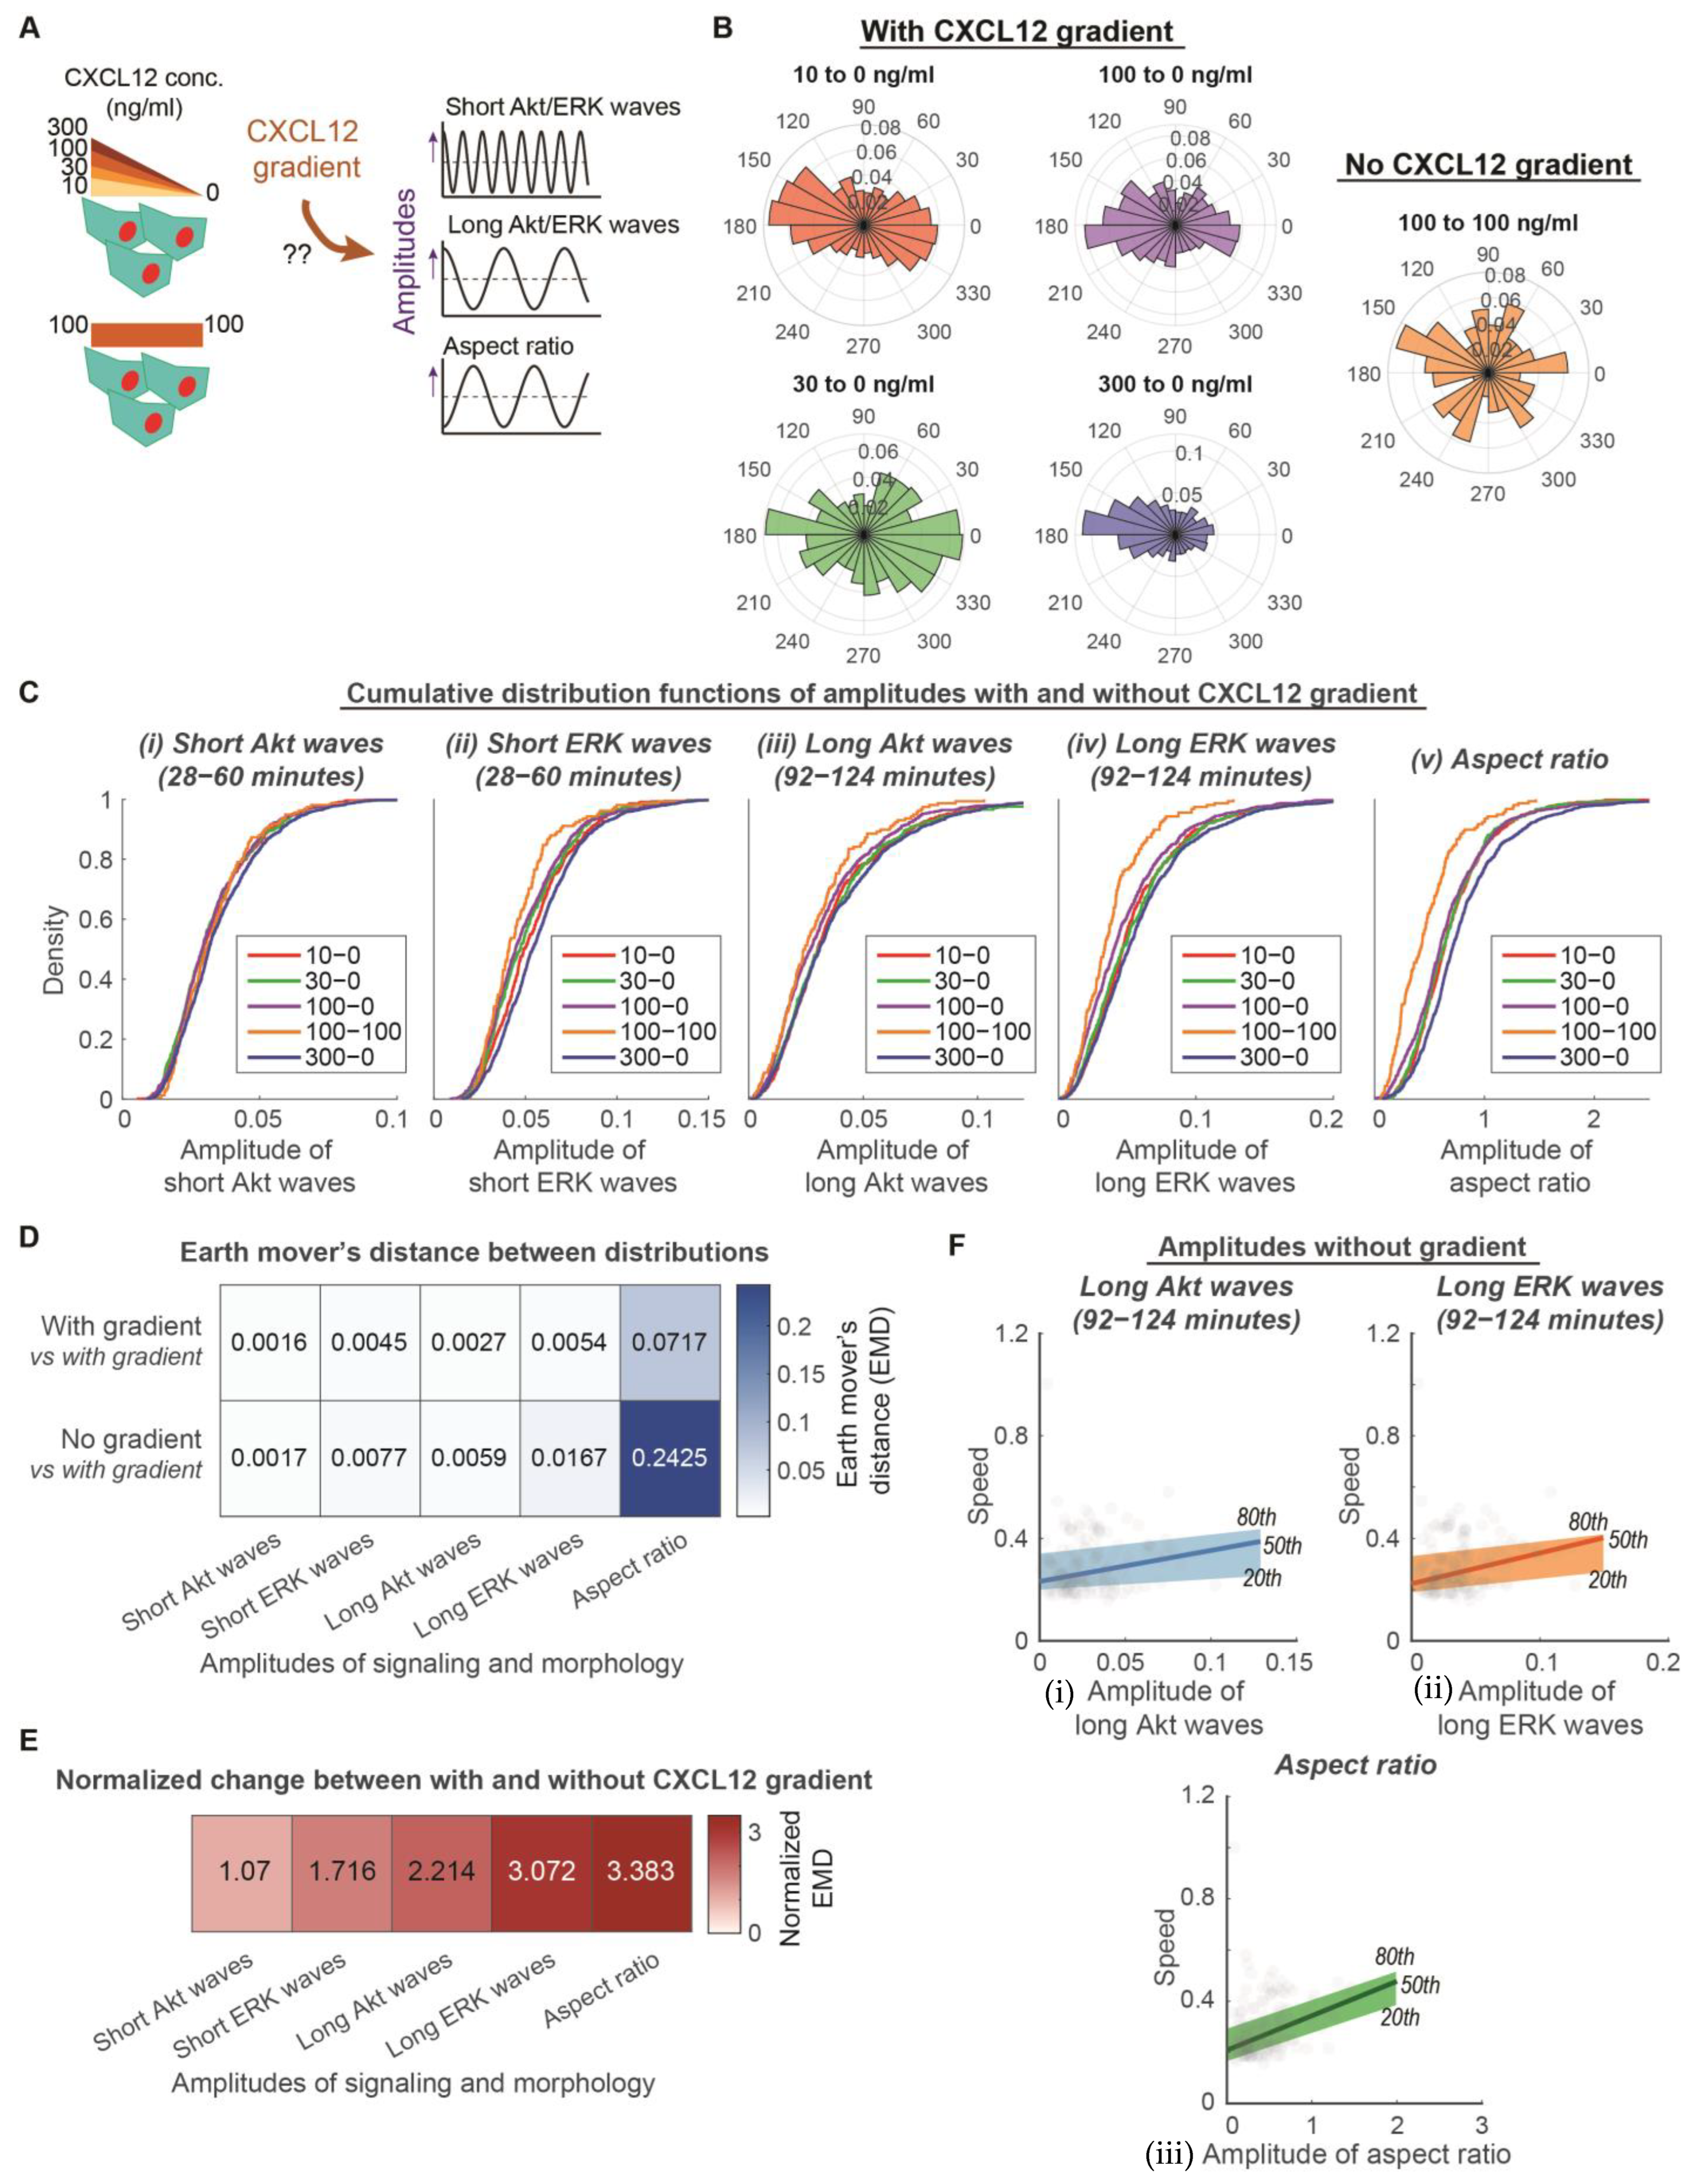
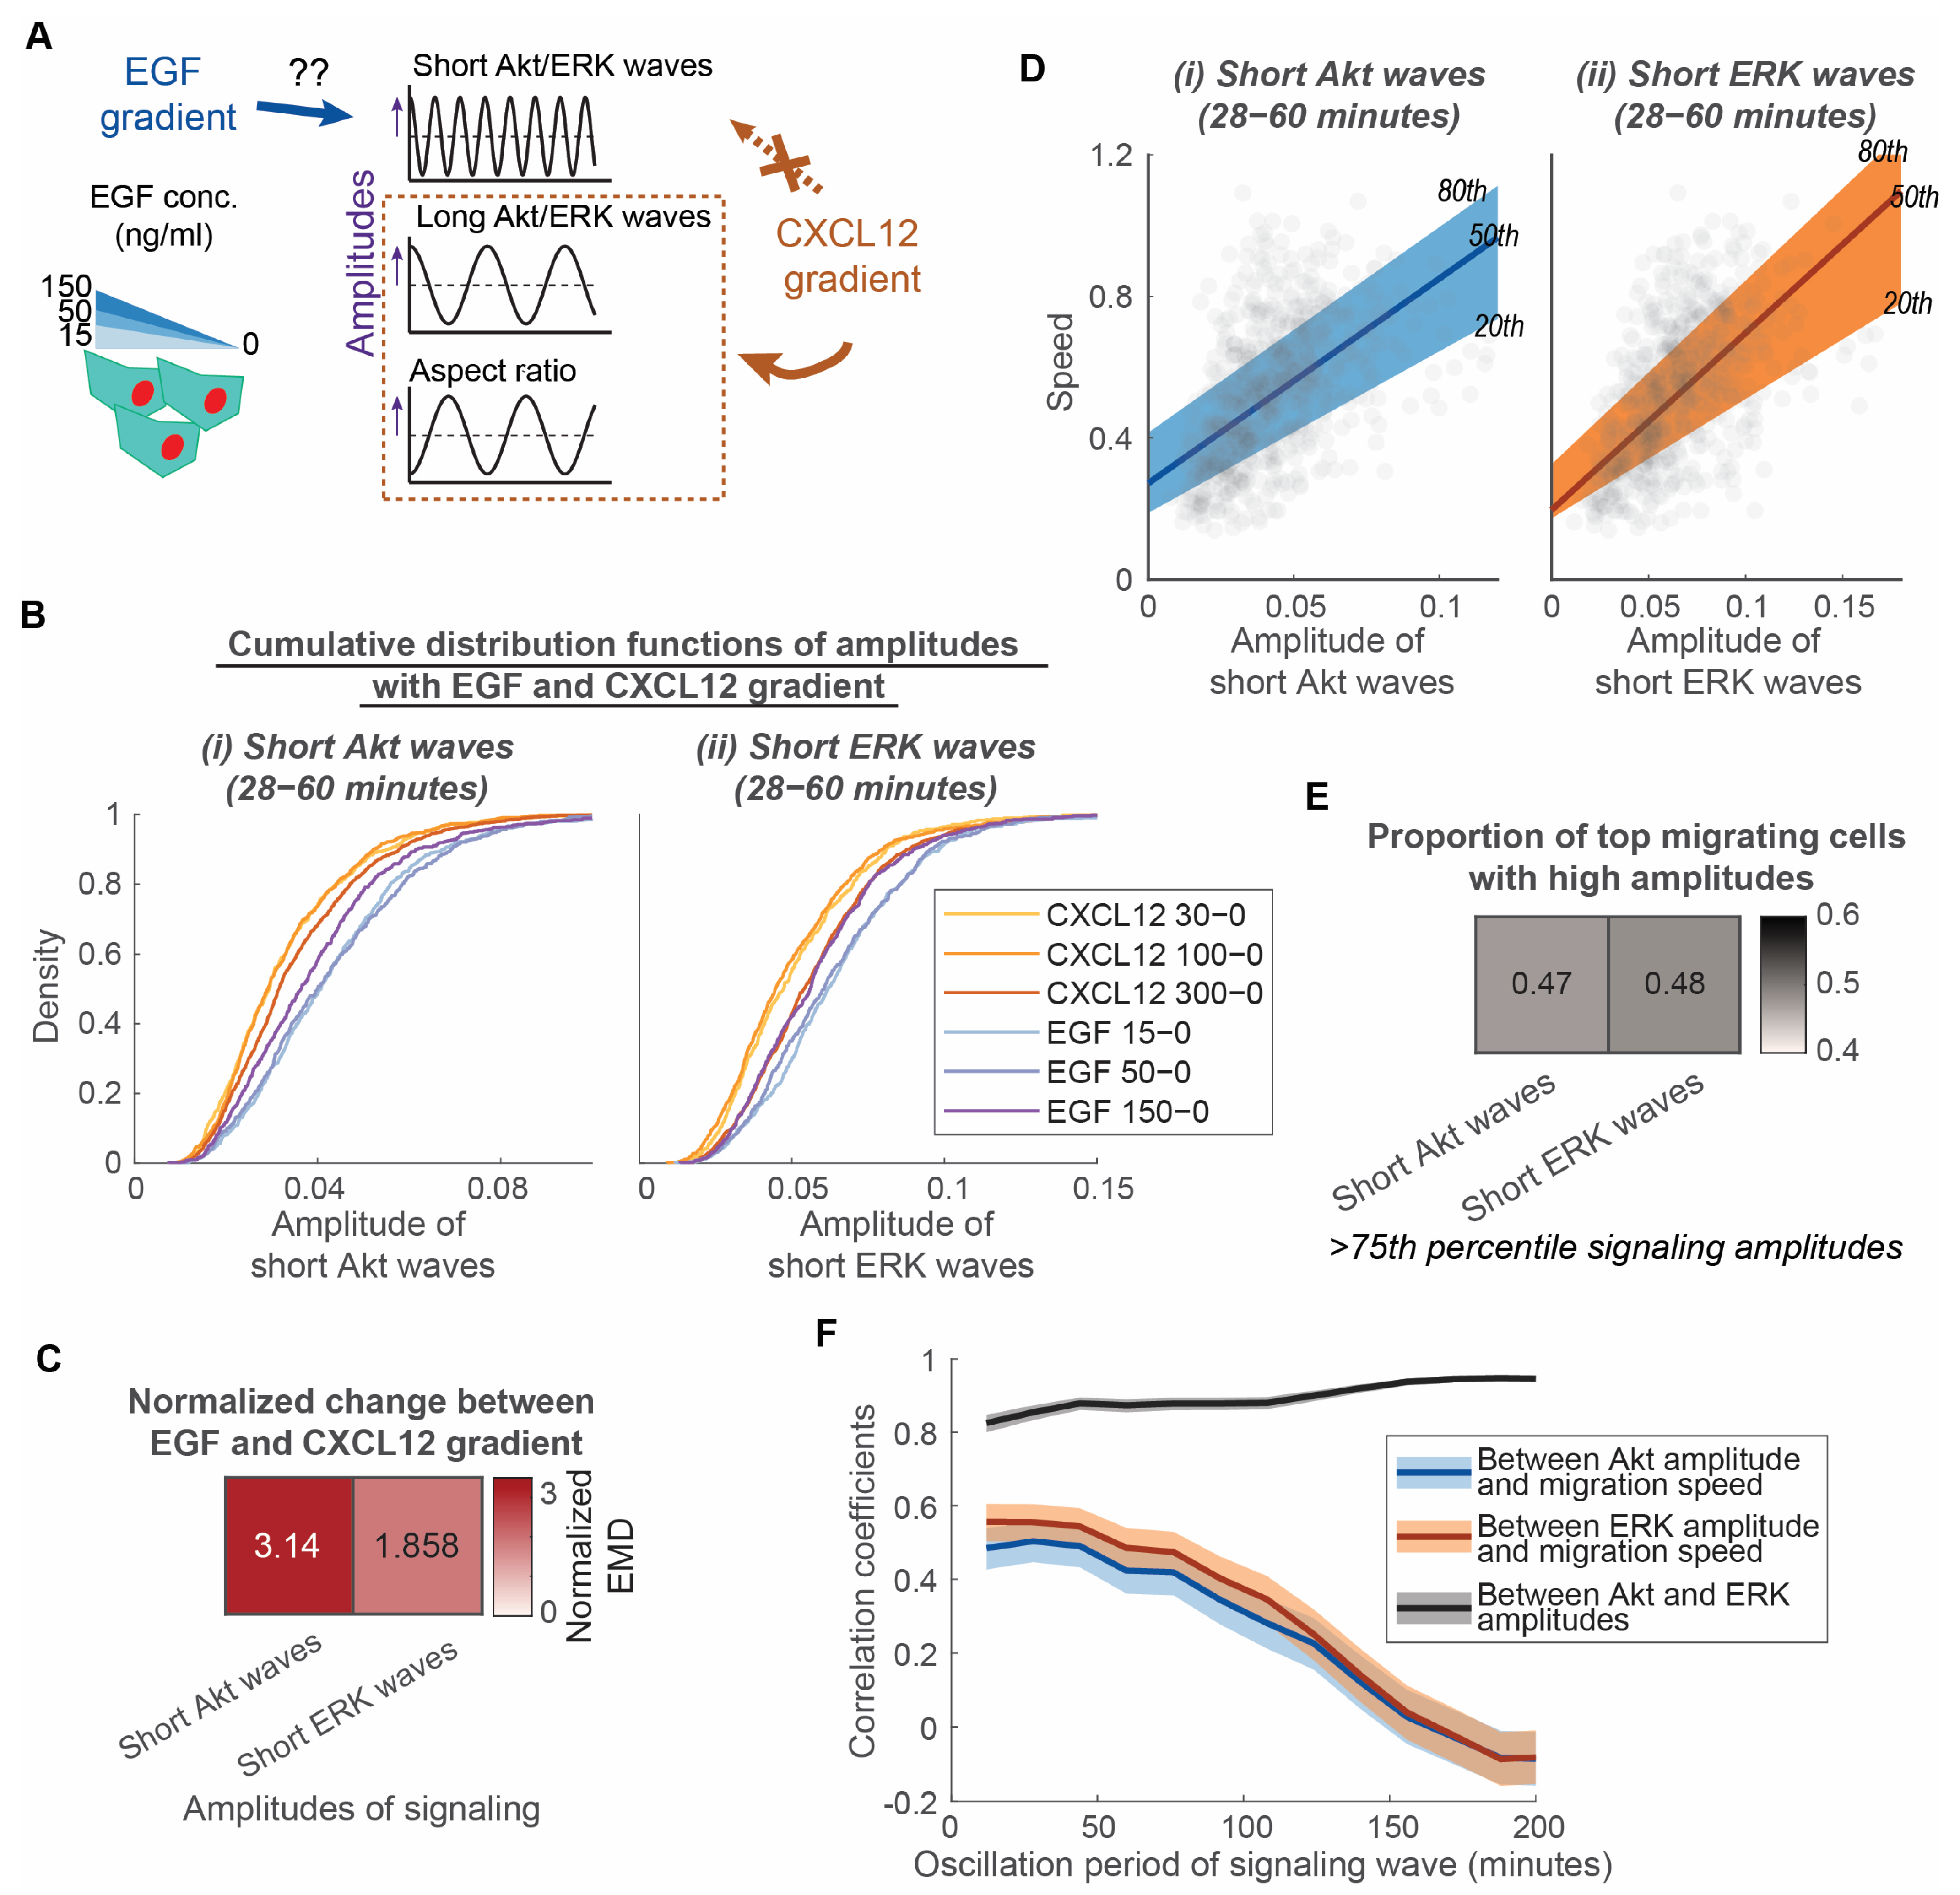
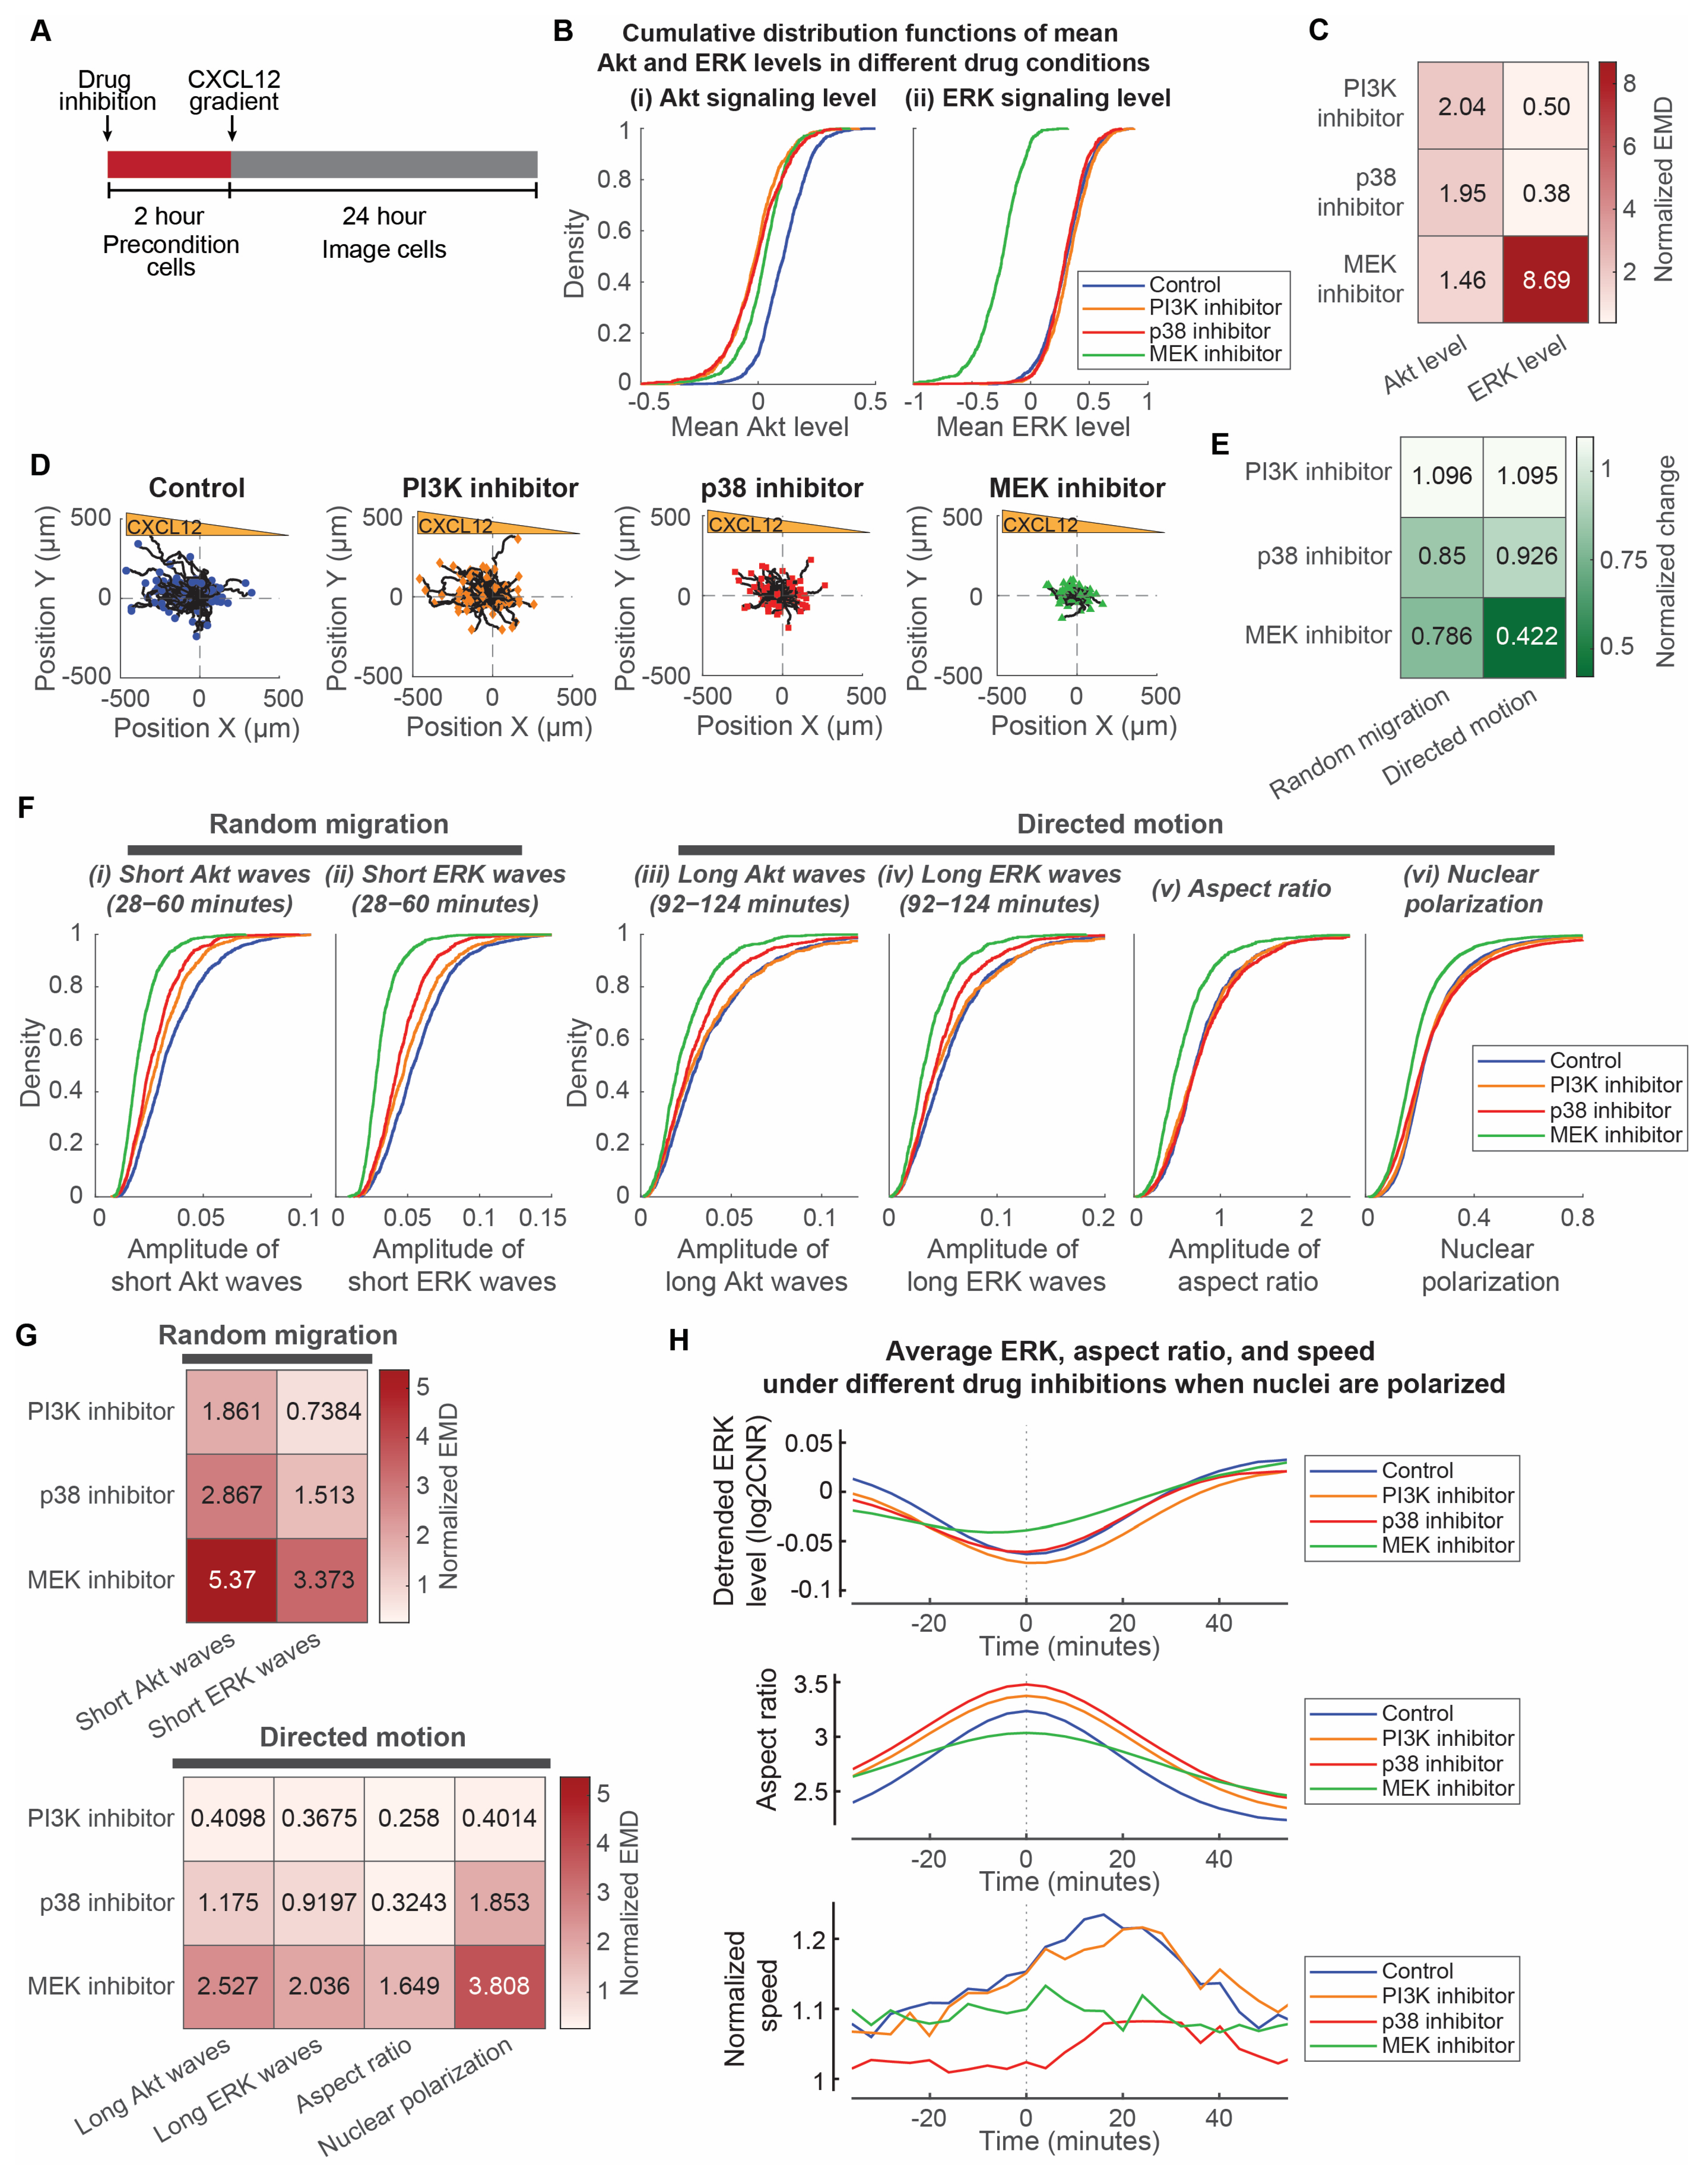
3.2. Long ERK Signaling Waves and Aspect Ratios Regulate Heterogeneity of Directed Motion, While Short ERK Signaling Waves Modulate Heterogeneity of Random Migration in CXCR4-Mediated Chemotaxis
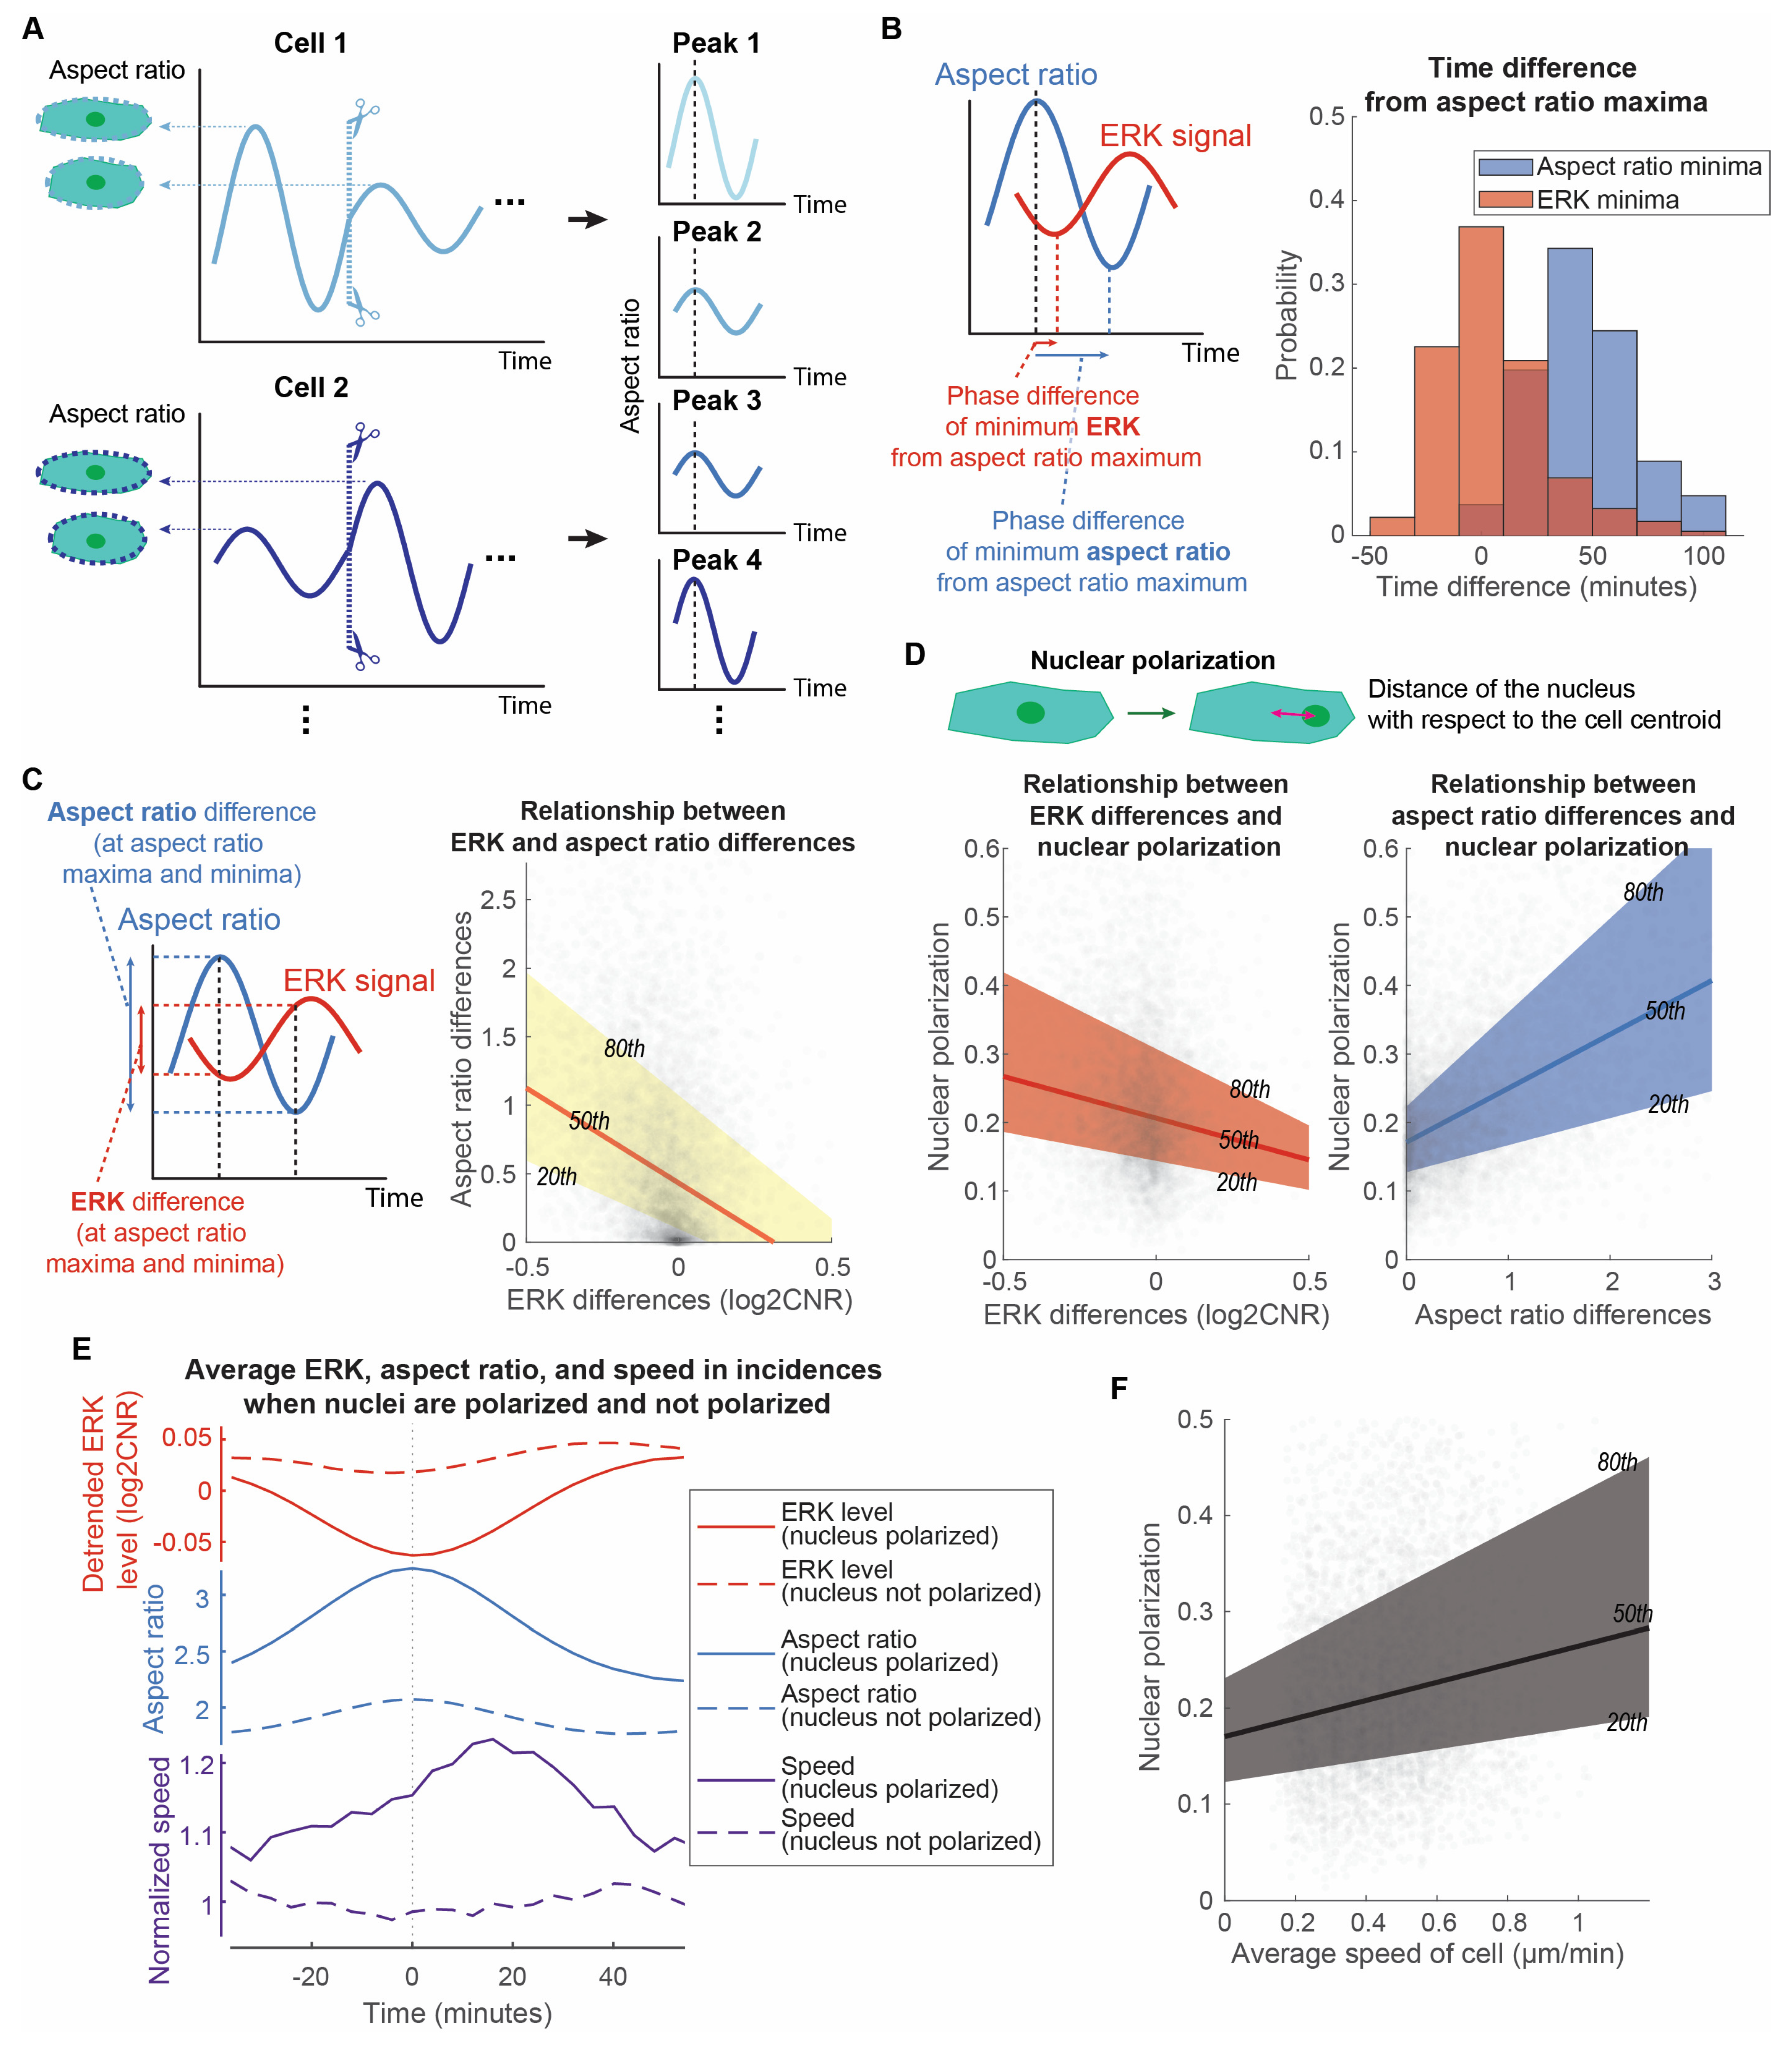
3.3. Cell Directed Motion Relates to the Extent of Long ERK Wave Reduction, Cell Elongation, and Nuclear Polarization
3.4. MEK Regulates Both Random Migration and Bursts of Directed Motion, While p38 Regulates Random Migration
4. Discussion
Supplementary Materials
Author Contributions
Funding
Institutional Review Board Statement
Informed Consent Statement
Data Availability Statement
Acknowledgments
Conflicts of Interest
References
- Müller, A.; Homey, B.; Soto, H.; Ge, N.; Catron, D.; Buchanan, M.E.; McClanahan, T.; Murphy, E.; Yuan, W.; Wagner, S.N.; et al. Involvement of chemokine receptors in breast cancer metastasis. Nature 2001, 410, 50–56. [Google Scholar] [CrossRef]
- Luker, G.D.; Yang, J.; Richmond, A.; Scala, S.; Festuccia, C.; Schottelius, M.; Wester, H.-J.; Zimmermann, J. At the Bench: Pre-clinical evidence for multiple functions of CXCR4 in cancer. J. Leukoc. Biol. 2021, 109, 969–989. [Google Scholar] [CrossRef]
- Sasaki, T.; Hiroki, K.; Yamashita, Y. The Role of Epidermal Growth Factor Receptor in Cancer Metastasis and Microenvironment. BioMed Res. Int. 2013, 2013, 546318. [Google Scholar] [CrossRef] [Green Version]
- Shi, Y.; Riese, D.J.; Shen, J. The Role of the CXCL12/CXCR4/CXCR7 Chemokine Axis in Cancer. Front. Pharmacol. 2020, 11, 574667. [Google Scholar] [CrossRef]
- Lo, H.-W.; Hsu, S.-C.; Hung, M.-C. EGFR signaling pathway in breast cancers: From traditional signal transduction to direct nuclear translocalization. Breast Cancer Res. Tr. 2006, 95, 211–218. [Google Scholar] [CrossRef]
- Seshacharyulu, P.; Ponnusamy, M.P.; Haridas, D.; Jain, M.; Ganti, A.K.; Batra, S.K. Targeting the EGFR signaling pathway in cancer therapy. Expert Opin. Ther. Targets 2012, 16, 15–31. [Google Scholar] [CrossRef] [Green Version]
- Kim, E.; Kim, J.-Y.; Smith, M.A.; Haura, E.B.; Anderson, A.R.A. Cell signaling heterogeneity is modulated by both cell-intrinsic and -extrinsic mechanisms: An integrated approach to understanding targeted therapy. PLoS Biol. 2018, 16, e2002930. [Google Scholar] [CrossRef] [Green Version]
- Cavnar, S.; Ray, P.; Moudgil, P.; Chang, S.; Luker, K.; Linderman, J.; Takayama, S.; Luker, G. Microfluidic source-sink model reveals effects of biophysically distinct CXCL12 isoforms in breast cancer chemotaxis. Integr. Biol. 2014, 6, 564–576. [Google Scholar] [CrossRef] [Green Version]
- Spinosa, P.C.; Humphries, B.A.; Mejia, D.L.; Buschhaus, J.M.; Linderman, J.J.; Luker, G.D.; Luker, K.E. Short-term cellular memory tunes the signaling responses of the chemokine receptor CXCR4. Sci. Signal. 2019, 12, eaaw4204. [Google Scholar] [CrossRef]
- Spinosa, P.C.; Kinnunen, P.C.; Humphries, B.A.; Luker, G.D.; Luker, K.E.; Linderman, J.J. Pre-existing Cell States Control Heterogeneity of Both EGFR and CXCR4 Signaling. Cell. Mol. Bioeng. 2020, 14, 49–64. [Google Scholar] [CrossRef]
- Gabor, A.; Tognetti, M.; Driessen, A.; Tanevski, J.; Guo, B.; Cao, W.; Shen, H.; Yu, T.; Chung, V.; Single Cell Signaling in Breast Cancer DREAM Consortium members; et al. Cell-to-cell and type-to-type heterogeneity of signaling networks: Insights from the crowd. Mol. Syst. Biol. 2021, 17, e10402. [Google Scholar] [CrossRef]
- Norris, D.; Yang, P.; Shin, S.-Y.; Kearney, A.L.; Kim, H.J.; Geddes, T.; Senior, A.M.; Fazakerley, D.J.; Nguyen, L.K.; James, D.E.; et al. Signaling Heterogeneity is Defined by Pathway Architecture and Intercellular Variability in Protein Expression. iScience 2021, 24, 102118. [Google Scholar] [CrossRef]
- Snijder, B.; Pelkmans, L. Origins of regulated cell-to-cell variability. Nat. Rev. Mol. Cell. Bio. 2011, 12, 119–125. [Google Scholar] [CrossRef]
- Yao, J.; Pilko, A.; Wollman, R. Distinct cellular states determine calcium signaling response. Mol. Syst. Biol. 2016, 12, 894. [Google Scholar] [CrossRef]
- Xiong, Y.; Huang, C.-H.; Iglesias, P.A.; Devreotes, P.N. Cells navigate with a local-excitation, global-inhibition-biased excitable network. Proc. Natl. Acad. Sci. USA 2010, 107, 17079–17086. [Google Scholar] [CrossRef] [Green Version]
- Huang, C.-H.; Tang, M.; Shi, C.; Iglesias, P.A.; Devreotes, P.N. An excitable signal integrator couples to an idling cytoskeletal oscillator to drive cell migration. Nat. Cell Biol. 2013, 15, 1307–1316. [Google Scholar] [CrossRef] [Green Version]
- Tang, M.; Wang, M.; Shi, C.; Iglesias, P.A.; Devreotes, P.N.; Huang, C.-H. Evolutionarily conserved coupling of adaptive and excitable networks mediates eukaryotic chemotaxis. Nat. Commun. 2014, 5, 5175. [Google Scholar] [CrossRef] [Green Version]
- Miao, Y.; Bhattacharya, S.; Edwards, M.; Cai, H.; Inoue, T.; Iglesias, P.A.; Devreotes, P.N. Altering the threshold of an excitable signal transduction network changes cell migratory modes. Nat. Cell Biol. 2017, 19, 329–340. [Google Scholar] [CrossRef] [Green Version]
- Yang, J.-M.; Bhattacharya, S.; West-Foyle, H.; Hung, C.-F.; Wu, T.C.; Iglesias, P.A.; Huang, C.-H. Integrating chemical and mechanical signals through dynamic coupling between cellular protrusions and pulsed ERK activation. Nat. Commun. 2018, 9, 4673. [Google Scholar] [CrossRef] [Green Version]
- Zhan, H.; Bhattacharya, S.; Cai, H.; Iglesias, P.A.; Huang, C.-H.; Devreotes, P.N. An Excitable Ras/PI3K/ERK Signaling Network Controls Migration and Oncogenic Transformation in Epithelial Cells. Dev. Cell. 2020, 54, 608–623.e605. [Google Scholar] [CrossRef]
- Aoki, K.; Kondo, Y.; Naoki, H.; Hiratsuka, T.; Itoh, R.E.; Matsuda, M. Propagating Wave of ERK Activation Orients Collective Cell Migration. Dev. Cell 2017, 43, 305–317.e305. [Google Scholar] [CrossRef]
- Hino, N.; Rossetti, L.; Marín-Llauradó, A.; Aoki, K.; Trepat, X.; Matsuda, M.; Hirashima, T. ERK-Mediated Mechanochemical Waves Direct Collective Cell Polarization. Dev. Cell 2020, 53, 646–660.e648. [Google Scholar] [CrossRef]
- Albeck, J.G.; Mills, G.B.; Brugge, J.S. Frequency-Modulated Pulses of ERK Activity Transmit Quantitative Proliferation Signals. Mol. Cell 2013, 49, 249–261. [Google Scholar] [CrossRef] [Green Version]
- Gerosa, L.; Chidley, C.; Fröhlich, F.; Sanchez, G.; Lim, S.K.; Muhlich, J.; Chen, J.-Y.; Vallabhaneni, S.; Baker, G.J.; Schapiro, D.; et al. Receptor-Driven ERK Pulses Reconfigure MAPK Signaling and Enable Persistence of Drug-Adapted BRAF-Mutant Melanoma Cells. Cell Syst. 2020, 11, 478–494.e479. [Google Scholar] [CrossRef]
- Mendoza, M.C.; Er, E.E.; Blenis, J. The Ras-ERK and PI3K-mTOR pathways: Cross-talk and compensation. Trends Biochem. Sci. 2011, 36, 320–328. [Google Scholar] [CrossRef] [Green Version]
- Posada, I.M.D.; Lectez, B.; Siddiqui, F.A.; Oetken-Lindholm, C.; Sharma, M.; Abankwa, D. Opposite feedback from mTORC1 to H-ras and K-ras4B downstream of SREBP1. Sci. Rep. 2017, 7, 8944. [Google Scholar] [CrossRef]
- Karimi Roshan, M.; Soltani, A.; Soleimani, A.; Rezaie Kahkhaie, K.; Afshari, A.R.; Soukhtanloo, M. Role of AKT and mTOR signaling pathways in the induction of epithelial-mesenchymal transition (EMT) process. Biochimie 2019, 165, 229–234. [Google Scholar] [CrossRef]
- Deng, S.; Leong, H.C.; Datta, A.; Gopal, V.; Kumar, A.P.; Yap, C.T. PI3K/AKT Signaling Tips the Balance of Cytoskeletal Forces for Cancer Progression. Cancers 2022, 14, 1652. [Google Scholar] [CrossRef]
- Bugaj, L.J.; Sabnis, A.J.; Mitchell, A.; Garbarino, J.E.; Toettcher, J.E.; Bivona, T.G.; Lim, W.A. Cancer mutations and targeted drugs can disrupt dynamic signal encoding by the Ras-Erk pathway. Science 2018, 361, eaao3048. [Google Scholar] [CrossRef] [Green Version]
- Koenker, R.; Hallock, K.F. Quantile regression. J. Econ. Perspect. 2001, 15, 143–156. [Google Scholar] [CrossRef]
- Orlova, D.Y.; Zimmerman, N.; Meehan, S.; Meehan, C.; Waters, J.; Ghosn, E.E.B.; Filatenkov, A.; Kolyagin, G.A.; Gernez, Y.; Tsuda, S.; et al. Earth Mover’s Distance (EMD): A True Metric for Comparing Biomarker Expression Levels in Cell Populations. PLoS ONE 2016, 11, e0151859. [Google Scholar] [CrossRef] [Green Version]
- Wang, Z.; Huan, X.; Garikipati, K. Variational system identification of the partial differential equations governing the physics of pattern-formation: Inference under varying fidelity and noise. Comput. Methods Appl. Mech. Eng. 2019, 356, 44–74. [Google Scholar] [CrossRef] [Green Version]
- Wang, Z.; Estrada, J.B.; Arruda, E.M.; Garikipati, K. Inference of deformation mechanisms and constitutive response of soft material surrogates of biological tissue by full-field characterization and data-driven variational system identification. J. Mech. Phys. Solids 2021, 153, 104474. [Google Scholar] [CrossRef]
- Wang, Z.; Huan, X.; Garikipati, K. Variational system identification of the partial differential equations governing microstructure evolution in materials: Inference over sparse and spatially unrelated data. Comput. Methods Appl. Mech. Eng. 2021, 377, 113706. [Google Scholar] [CrossRef]
- Shellard, A.; Mayor, R. All Roads Lead to Directional Cell Migration. Trends Cell Biol. 2020, 30, 852–868. [Google Scholar] [CrossRef]
- Soriano, O.; Alcón-Pérez, M.; Vicente-Manzanares, M.; Castellano, E. The Crossroads between RAS and RHO Signaling Pathways in Cellular Transformation, Motility and Contraction. Genes 2021, 12, 819. [Google Scholar] [CrossRef]
- Maninová, M.; Klímová, Z.; Parsons, J.T.; Weber, M.J.; Iwanicki, M.P.; Vomastek, T. The Reorientation of Cell Nucleus Promotes the Establishment of Front–Rear Polarity in Migrating Fibroblasts. J. Mol. Biol. 2013, 425, 2039–2055. [Google Scholar] [CrossRef]
- Zhang, Y.; Wang, X.; Qin, X.; Wang, X.; Liu, F.; White, E.; Zheng, X.F.S. PP2AC Level Determines Differential Programming of p38-TSC-mTOR Signaling and Therapeutic Response to p38-Targeted Therapy in Colorectal Cancer. EBioMedicine 2015, 2, 1944–1956. [Google Scholar] [CrossRef] [Green Version]
- Zuluaga, S.; Álvarez-Barrientos, A.; Gutiérrez-Uzquiza, A.; Benito, M.; Nebreda, A.R.; Porras, A. Negative regulation of Akt activity by p38α MAP kinase in cardiomyocytes involves membrane localization of PP2A through interaction with caveolin-1. Cell. Signal. 2007, 19, 62–74. [Google Scholar] [CrossRef]
- Seimon, T.A.; Wang, Y.; Han, S.; Senokuchi, T.; Schrijvers, D.M.; Kuriakose, G.; Tall, A.R.; Tabas, I.A. Macrophage deficiency of p38α MAPK promotes apoptosis and plaque necrosis in advanced atherosclerotic lesions in mice. J. Clin. Investig. 2009, 119, 886–898. [Google Scholar] [CrossRef] [Green Version]
- Düzgün, Ş.A.; Yerlikaya, A.; Zeren, S.; Bayhan, Z.; Okur, E.; Boyacı, İ. Differential effects of p38 MAP kinase inhibitors SB203580 and SB202190 on growth and migration of human MDA-MB-231 cancer cell line. Cytotechnology 2017, 69, 711–724. [Google Scholar] [CrossRef]
- Fallahi-Sichani, M.; Honarnejad, S.; Heiser, L.M.; Gray, J.W.; Sorger, P.K. Metrics other than potency reveal systematic variation in responses to cancer drugs. Nat. Chem. Biol. 2013, 9, 708–714. [Google Scholar] [CrossRef] [Green Version]
- Yuan, Y.; Wen, W.; Yost, S.E.; Xing, Q.; Yan, J.; Han, E.S.; Mortimer, J.; Yim, J.H. Combination therapy with BYL719 and LEE011 is synergistic and causes a greater suppression of p-S6 in triple negative breast cancer. Sci. Rep. 2019, 9, 7509. [Google Scholar] [CrossRef] [Green Version]
- Shafqat-Abbasi, H.; Kowalewski, J.M.; Kiss, A.; Gong, X.; Hernandez-Varas, P.; Berge, U.; Jafari-Mamaghani, M.; Lock, J.G.; Strömblad, S. An analysis toolbox to explore mesenchymal migration heterogeneity reveals adaptive switching between distinct modes. Elife 2016, 5, e11384. [Google Scholar] [CrossRef]
- Kramer, B.A.; Sarabia del Castillo, J.; Pelkmans, L. Multimodal perception links cellular state to decision-making in single cells. Science 2022, 377, 642–648. [Google Scholar] [CrossRef]
- Wade, J.D.; Lun, X.-K.; Zivanovic, N.; Voit, E.O.; Bodenmiller, B. Mechanistic Model of Signaling Dynamics Across an Epithelial Mesenchymal Transition. Front. Physiol. 2020, 11, 579117. [Google Scholar] [CrossRef]
- Chavez-Abiega, S.; Grönloh, M.L.B.; Gadella, T.W.J., Jr.; Bruggeman, F.J.; Goedhart, J. Single-cell imaging of ERK and Akt activation dynamics and heterogeneity induced by G-protein-coupled receptors. J. Cell Sci. 2022, 135, jcs259685. [Google Scholar] [CrossRef]
- Micali, G.; Aquino, G.; Richards, D.M.; Endres, R.G. Accurate Encoding and Decoding by Single Cells: Amplitude Versus Frequency Modulation. PLoS Comput. Biol. 2015, 11, e1004222. [Google Scholar] [CrossRef] [Green Version]
- Samson, S.C.; Khan, A.M.; Mendoza, M.C. ERK signaling for cell migration and invasion. Front. Mol. Biosci. 2022, 9, 998475. [Google Scholar] [CrossRef]
- Vaidžiulytė, K.; Macé, A.-S.; Battistella, A.; Beng, W.; Schauer, K.; Coppey, M. Persistent cell migration emerges from a coupling between protrusion dynamics and polarized trafficking. Elife 2022, 11, e69229. [Google Scholar] [CrossRef]
- Mendoza, M.C.; Er, E.E.; Zhang, W.; Ballif, B.A.; Elliott, H.L.; Danuser, G.; Blenis, J. ERK-MAPK Drives Lamellipodia Protrusion by Activating the WAVE2 Regulatory Complex. Molecular Cell 2011, 41, 661–671. [Google Scholar] [CrossRef] [Green Version]
- Mendoza, M.C.; Vilela, M.; Juarez, J.E.; Blenis, J.; Danuser, G. ERK reinforces actin polymerization to power persistent edge protrusion during motility. Sci. Signal. 2015, 8, ra47. [Google Scholar] [CrossRef] [Green Version]
- Fincham, V.J.; James, M.; Frame, M.C.; Winder, S.J. Active ERK/MAP kinase is targeted to newly forming cell–matrix adhesions by integrin engagement and v-Src. EMBO J. 2000, 19, 2911–2923. [Google Scholar] [CrossRef] [Green Version]
- Graf, K.; Xi, X.-P.; Yang, D.; Fleck, E.; Hsueh, W.A.; Law, R.E. Mitogen-Activated Protein Kinase Activation Is Involved in Platelet-Derived Growth Factor-Directed Migration by Vascular Smooth Muscle Cells. Hypertension 1997, 29, 334–339. [Google Scholar] [CrossRef] [Green Version]
- Giehl, K.; Skripczynski, B.; Mansard, A.; Menke, A.; Gierschik, P. Growth factor-dependent activation of the Ras-Raf-MEK-MAPK pathway in the human pancreatic carcinoma cell line PANC-1 carrying activated K-ras: Implications for cell proliferation and cell migration. Oncogene 2000, 19, 2930–2942. [Google Scholar] [CrossRef] [Green Version]
- Huang, J.; Manning, B.D. The TSC1–TSC2 complex: A molecular switchboard controlling cell growth. Biochem. J. 2008, 412, 179–190. [Google Scholar] [CrossRef] [Green Version]
- Kinnunen, P.C.; Luker, G.D.; Luker, K.E.; Linderman, J.J. Computational modeling implicates protein scaffolding in p38 regulation of Akt. J. Theor. Biol. 2022, 555, 111294. [Google Scholar] [CrossRef]
- Hamanoue, M.; Morioka, K.; Ohsawa, I.; Ohsawa, K.; Kobayashi, M.; Tsuburaya, K.; Akasaka, Y.; Mikami, T.; Ogata, T.; Takamatsu, K. Cell-permeable p38 MAP kinase promotes migration of adult neural stem/progenitor cells. Sci. Rep. 2016, 6, 24279. [Google Scholar] [CrossRef] [Green Version]
- Guay, J.; Lambert, H.; Gingras-Breton, G.; Lavoie, J.N.; Huot, J.; Landry, J. Regulation of actin filament dynamics by p38 map kinase-mediated phosphorylation of heat shock protein 27. J. Cell Sci. 1997, 110, 357–368. [Google Scholar] [CrossRef]
- Hoffman, L.; Jensen, C.C.; Yoshigi, M.; Beckerle, M. Mechanical signals activate p38 MAPK pathway-dependent reinforcement of actin via mechanosensitive HspB1. Mol. Biol. Cell 2017, 28, 2661–2675. [Google Scholar] [CrossRef]


Disclaimer/Publisher’s Note: The statements, opinions and data contained in all publications are solely those of the individual author(s) and contributor(s) and not of MDPI and/or the editor(s). MDPI and/or the editor(s) disclaim responsibility for any injury to people or property resulting from any ideas, methods, instructions or products referred to in the content. |
© 2023 by the authors. Licensee MDPI, Basel, Switzerland. This article is an open access article distributed under the terms and conditions of the Creative Commons Attribution (CC BY) license (https://creativecommons.org/licenses/by/4.0/).
Share and Cite
Ho, K.K.Y.; Srivastava, S.; Kinnunen, P.C.; Garikipati, K.; Luker, G.D.; Luker, K.E. Oscillatory ERK Signaling and Morphology Determine Heterogeneity of Breast Cancer Cell Chemotaxis via MEK-ERK and p38-MAPK Signaling Pathways. Bioengineering 2023, 10, 269. https://doi.org/10.3390/bioengineering10020269
Ho KKY, Srivastava S, Kinnunen PC, Garikipati K, Luker GD, Luker KE. Oscillatory ERK Signaling and Morphology Determine Heterogeneity of Breast Cancer Cell Chemotaxis via MEK-ERK and p38-MAPK Signaling Pathways. Bioengineering. 2023; 10(2):269. https://doi.org/10.3390/bioengineering10020269
Chicago/Turabian StyleHo, Kenneth K. Y., Siddhartha Srivastava, Patrick C. Kinnunen, Krishna Garikipati, Gary D. Luker, and Kathryn E. Luker. 2023. "Oscillatory ERK Signaling and Morphology Determine Heterogeneity of Breast Cancer Cell Chemotaxis via MEK-ERK and p38-MAPK Signaling Pathways" Bioengineering 10, no. 2: 269. https://doi.org/10.3390/bioengineering10020269