

Immunosensing for Early Detection of Rheumatoid Arthritis Biomarkers: Anti-Cyclic Citrullinated Peptide Antibodies Based on Tilted-Fiber Bragg Grating Biosensor
 , , and
Abstract
:1. Introduction
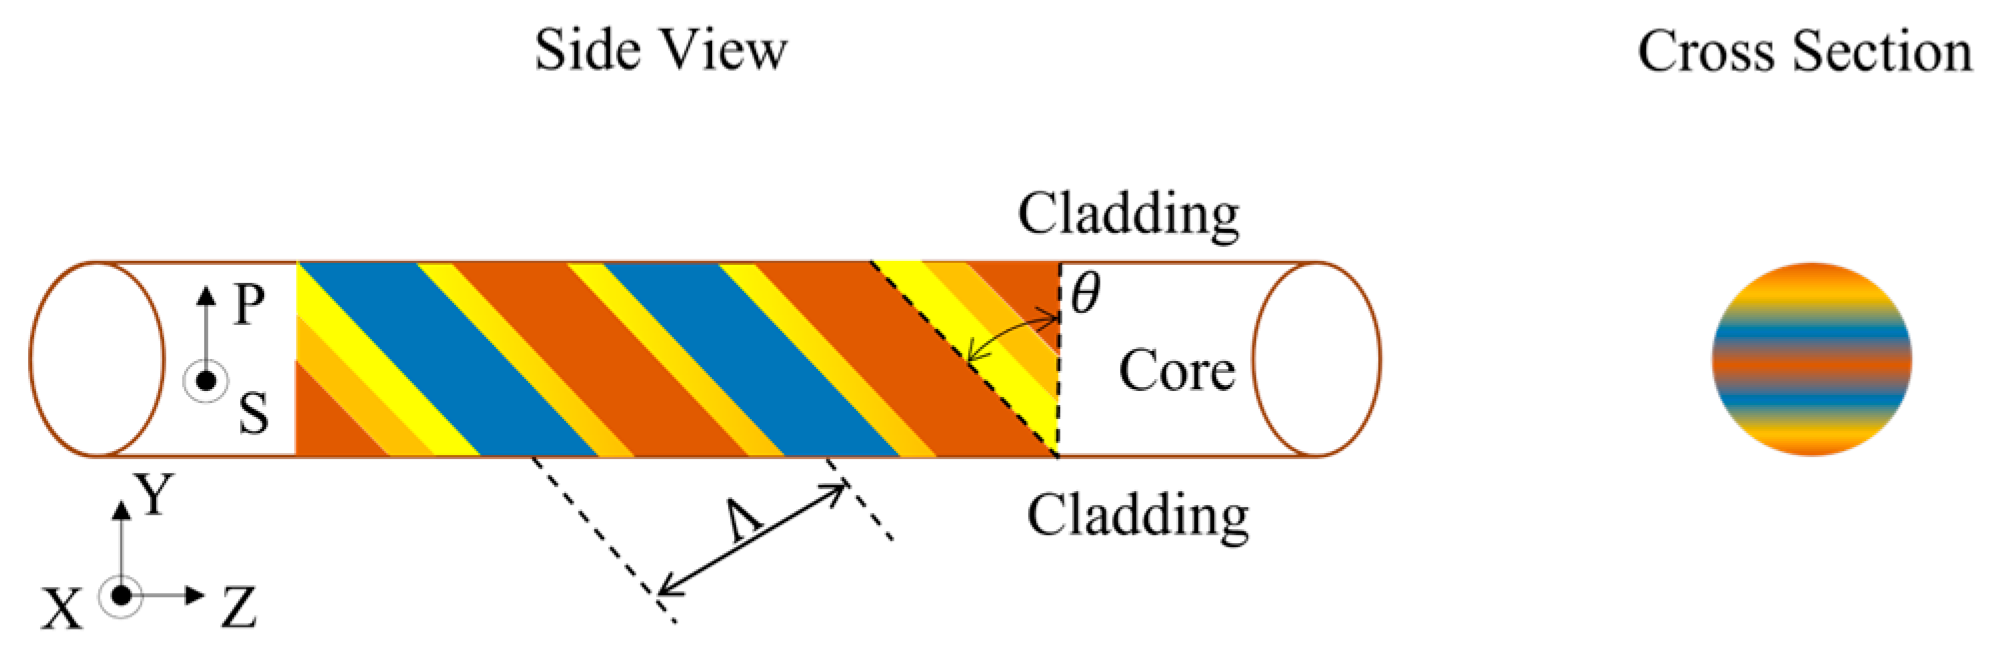
2. Theory
3. Materials and Methods
3.1. Fabrication of TFBG Fiber Sensors
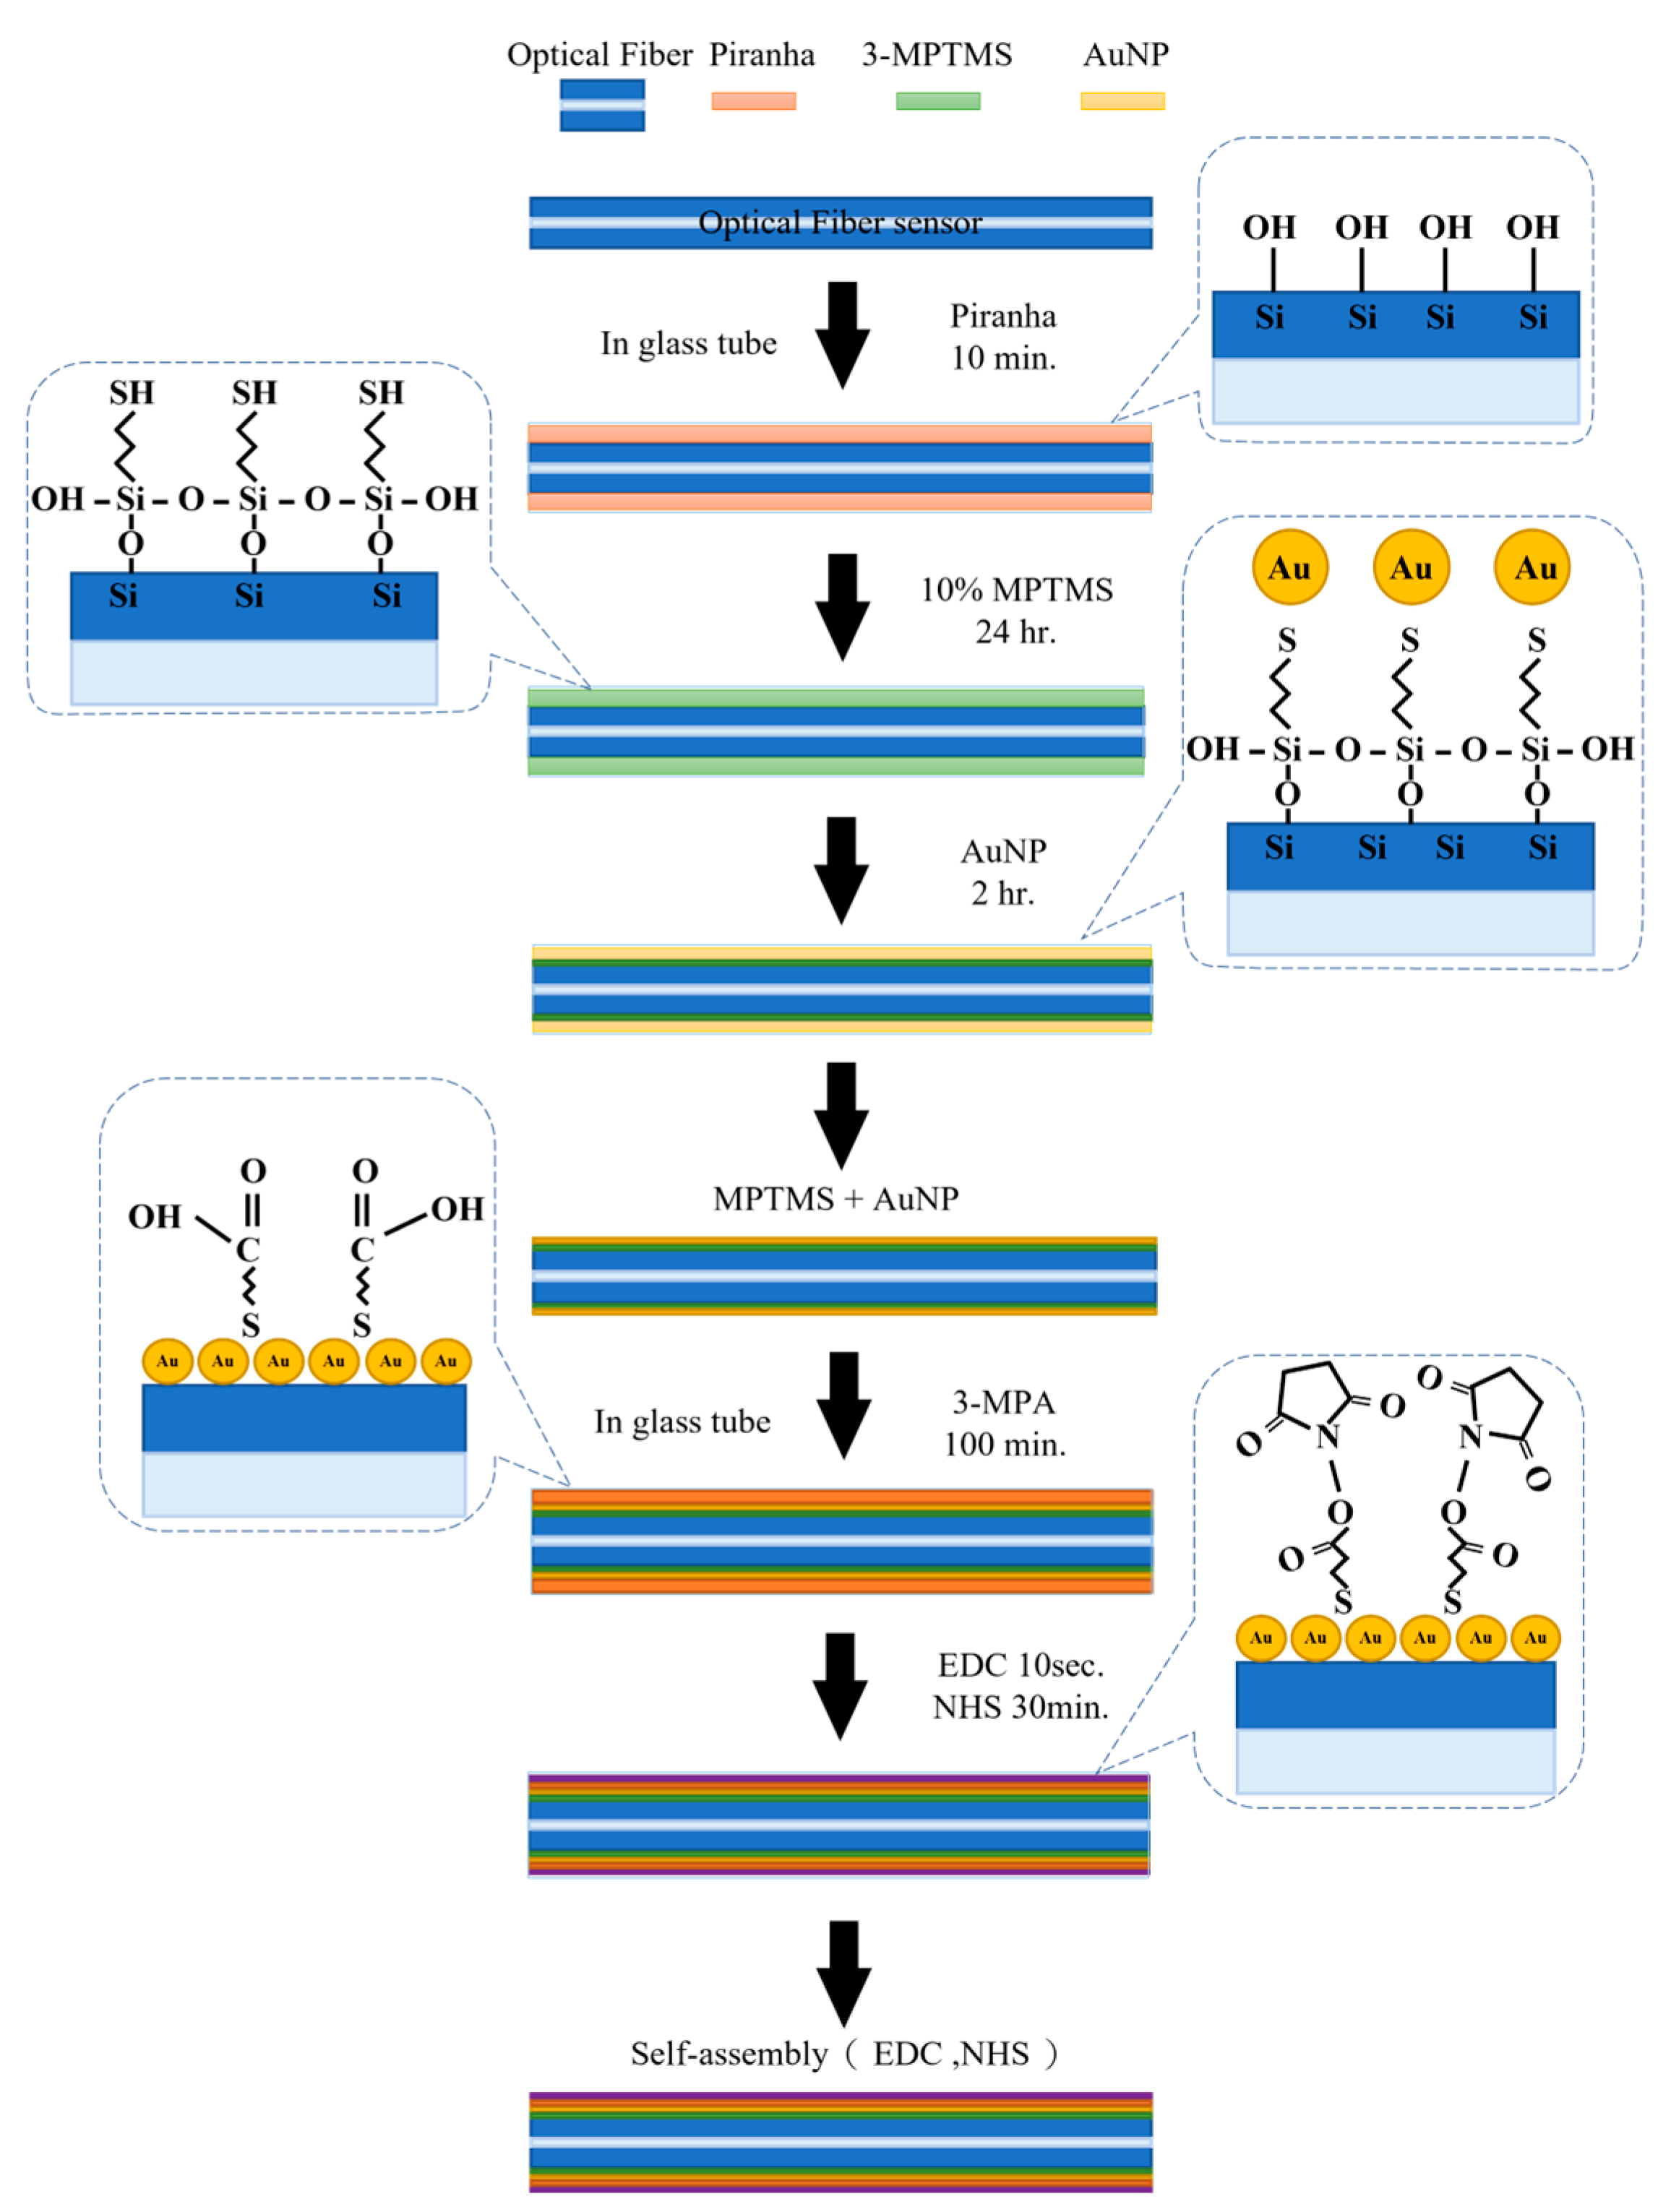
3.2. Self-Assembly of the Nanosensor Layer of TFBGs
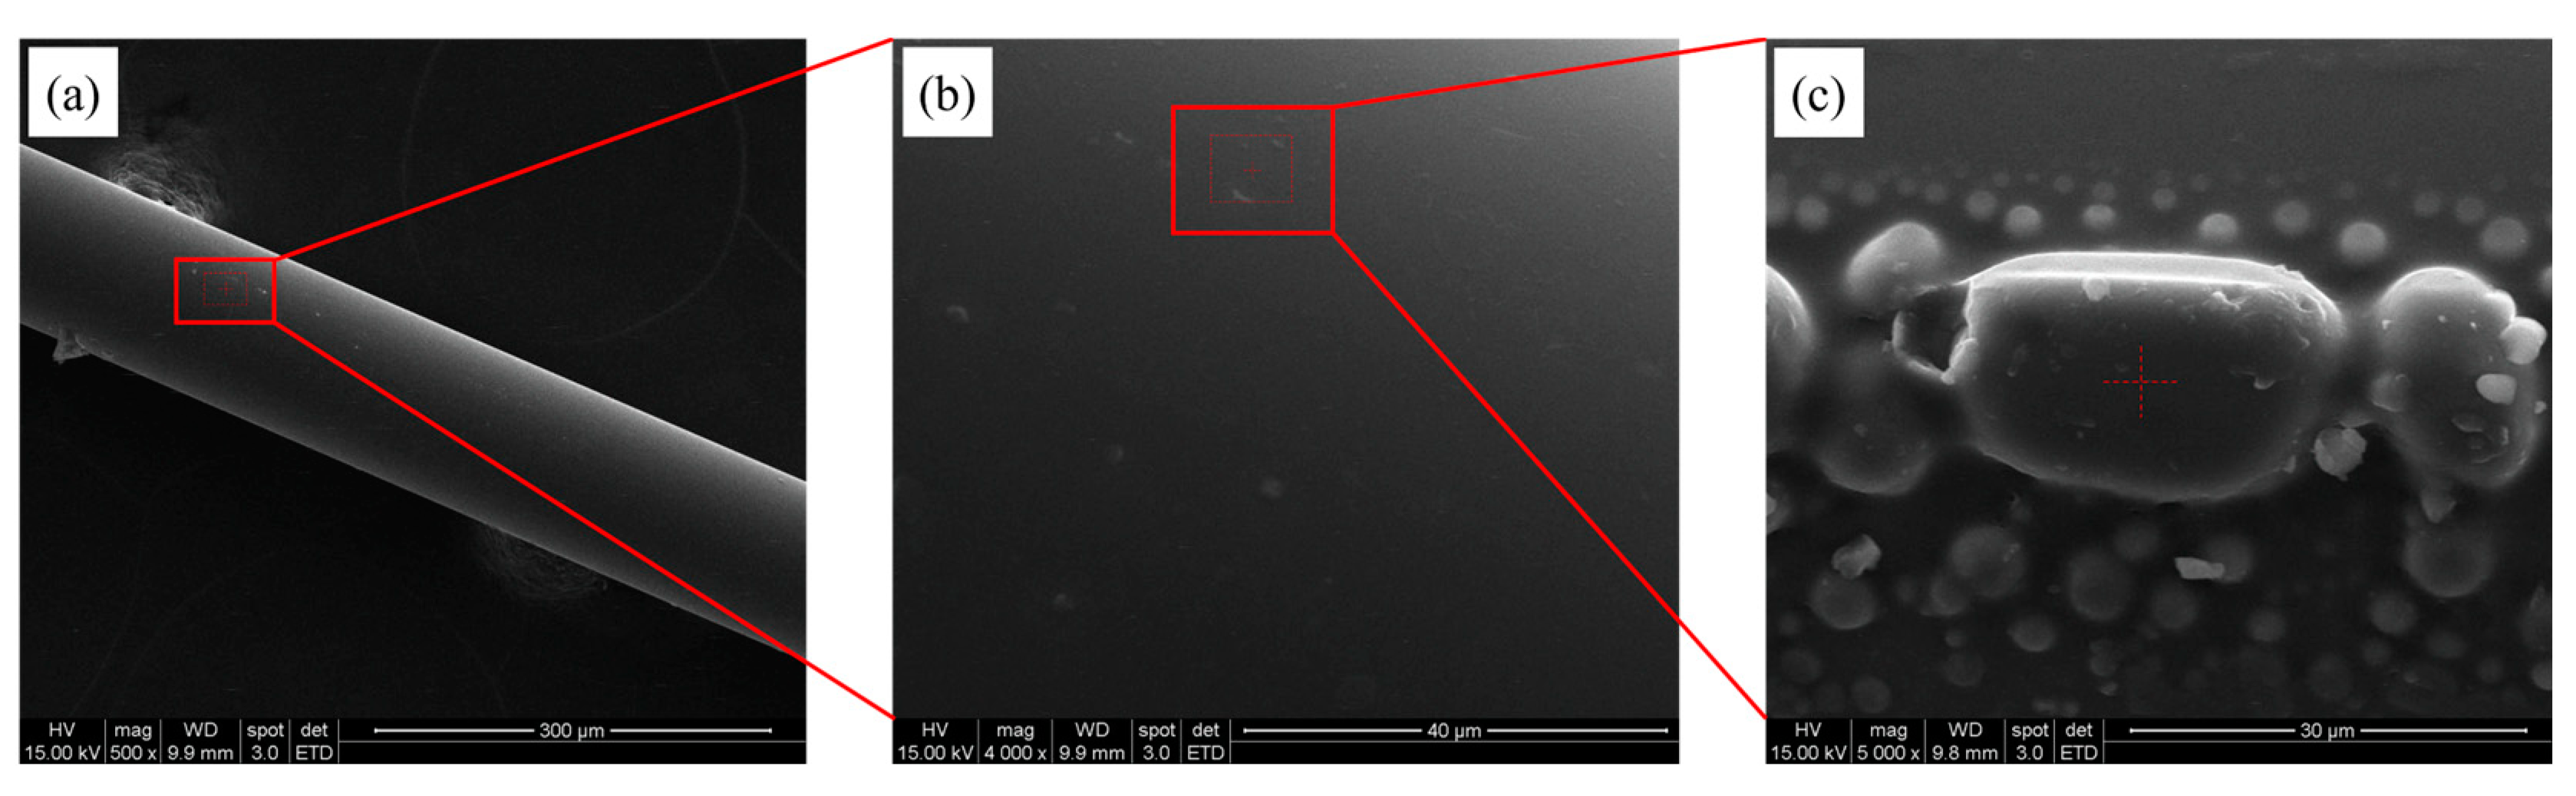
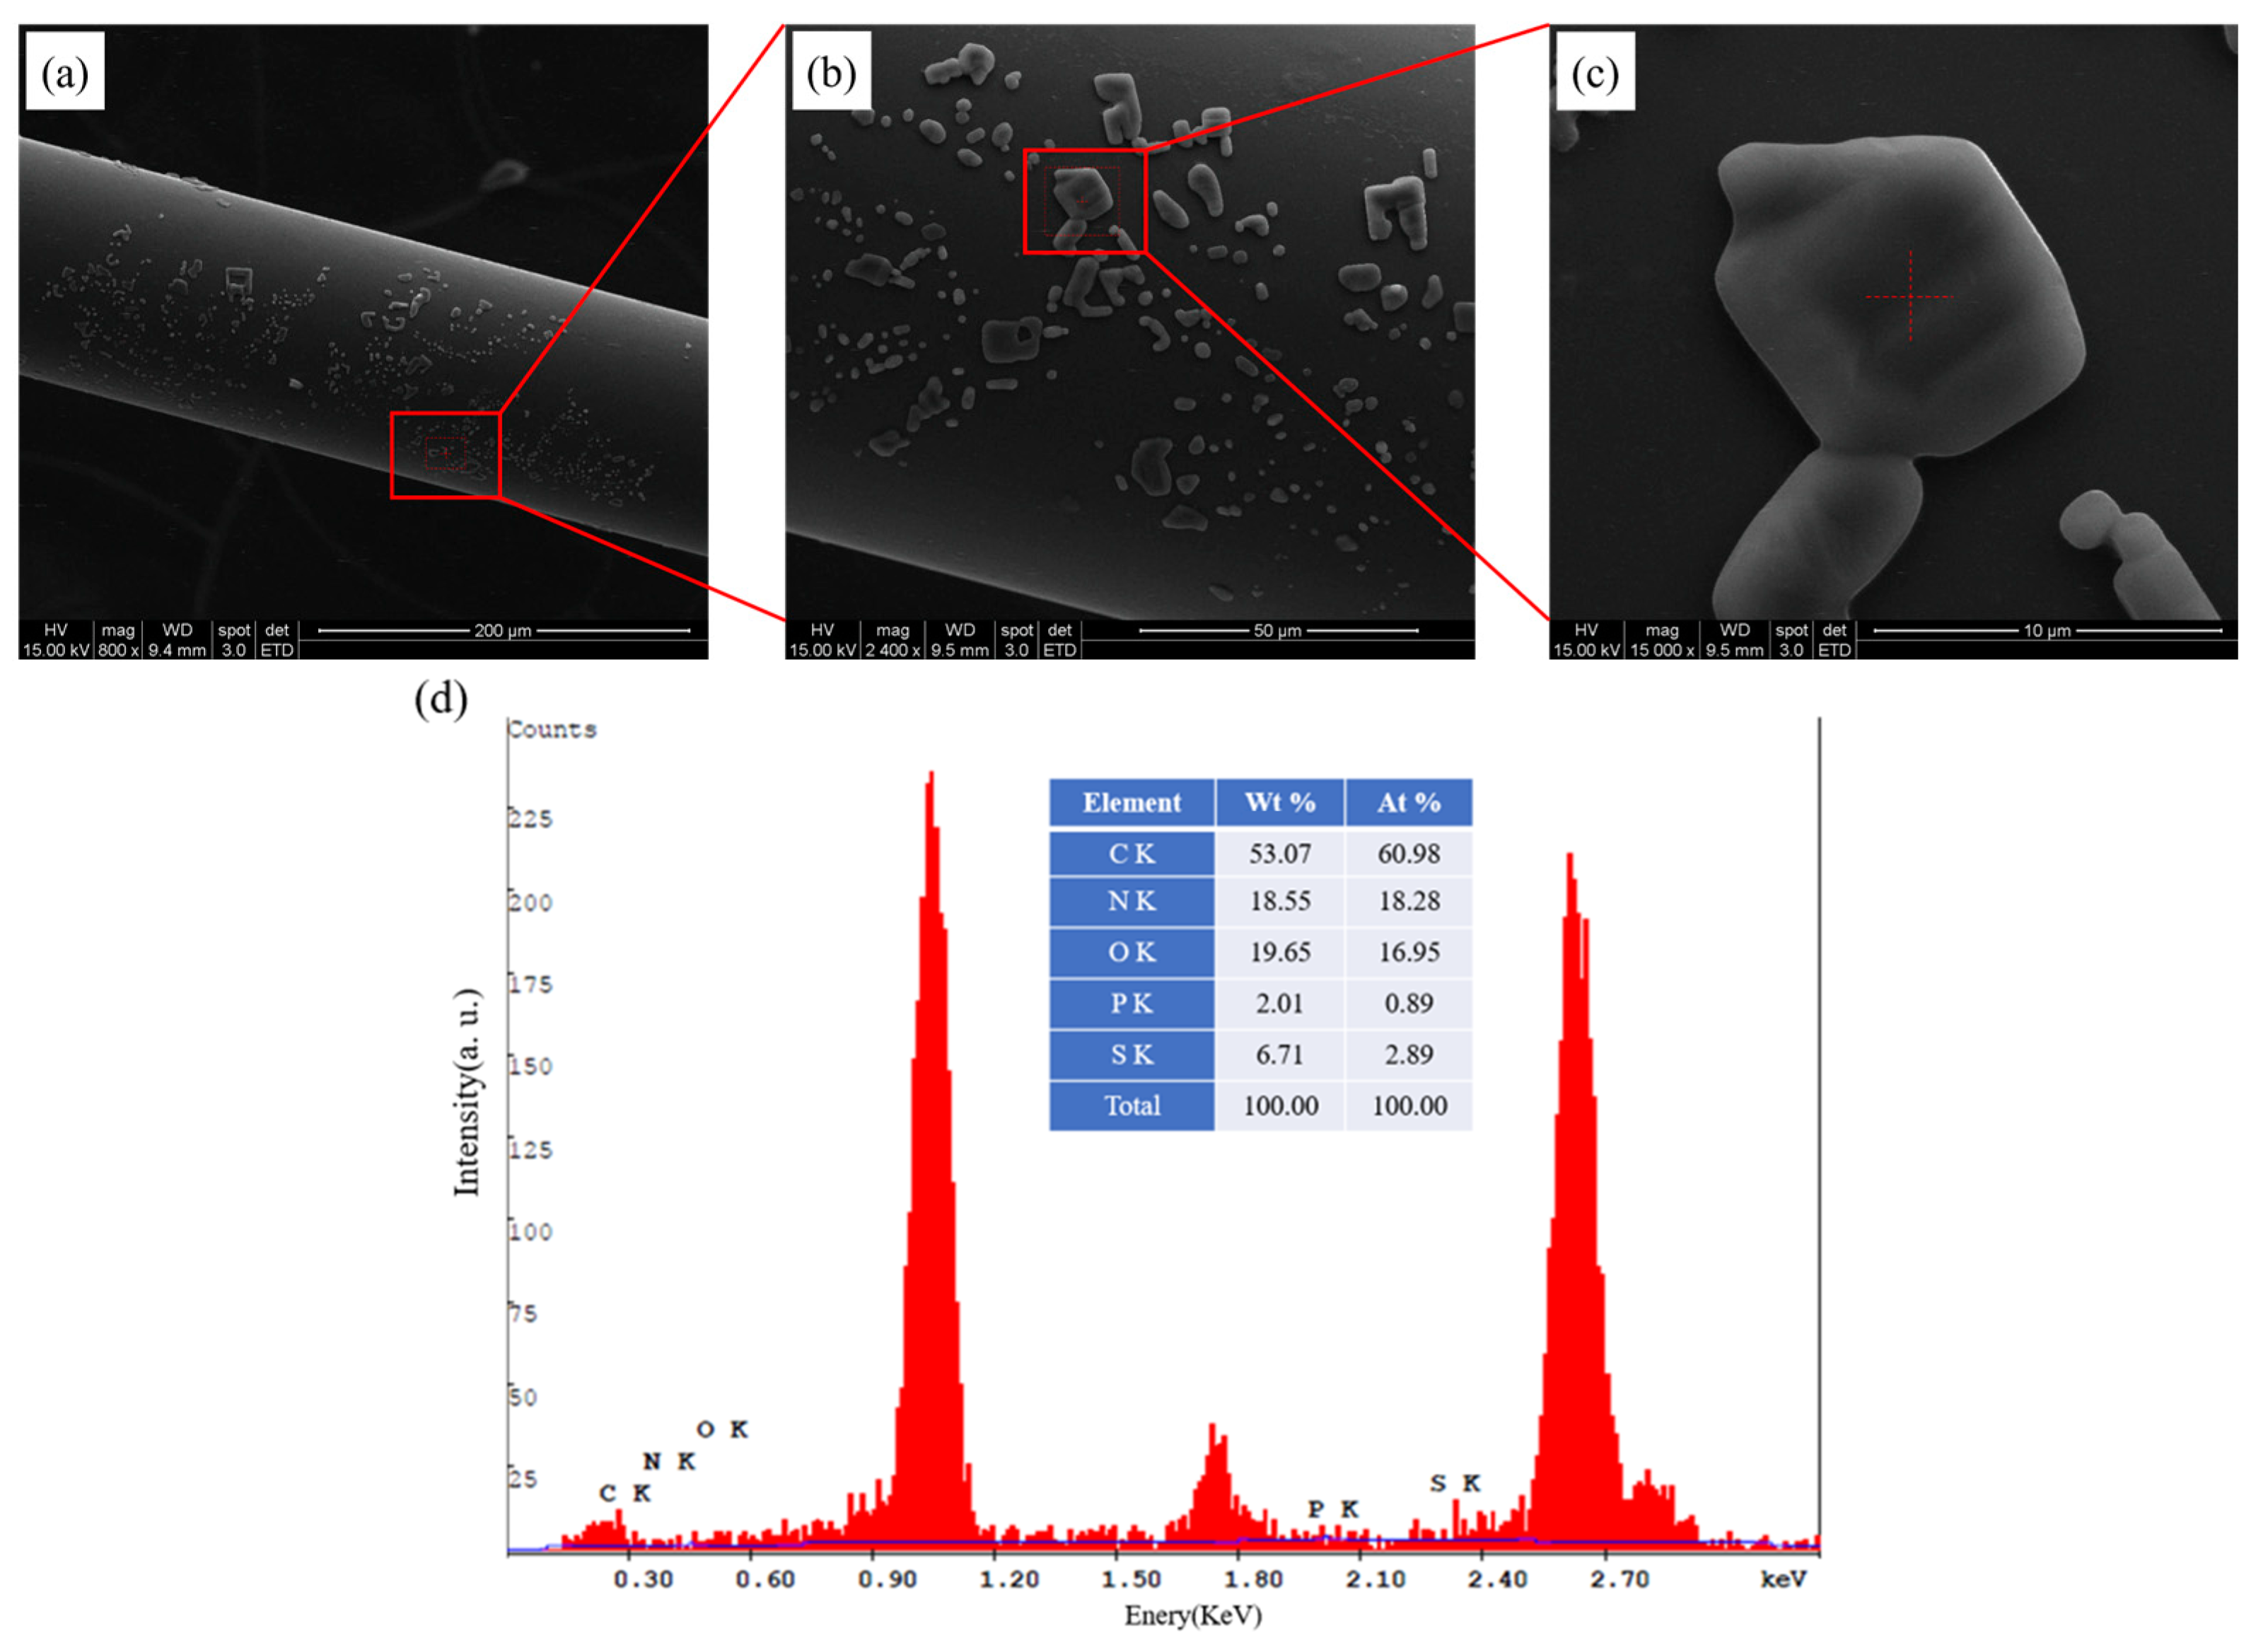
3.3. Analysis of Fiber Surface
3.4. CCP Detection through the TFBG-Based Biosensor
4. Results
5. Conclusions
Author Contributions
Funding
Institutional Review Board Statement
Informed Consent Statement
Data Availability Statement
Acknowledgments
Conflicts of Interest
References
- Shrivastava, A.K.; Pandey, A. Inflammation and rheumatoid arthritis. J. Physiol. Biochem. 2013, 69, 335–347. [Google Scholar] [CrossRef]
- Van Venrooij, W.J.; Van Beers, J.J.; Pruijn, G.J. Anti-CCP Antibody, a Marker for the Early Detection of Rheumatoid Arthritis. Ann. N. Y. Acad. Sci. 2008, 1143, 268–285. [Google Scholar] [CrossRef] [PubMed]
- Boissier, M.-C.; Semerano, L.; Challal, S.; Saidenberg-Kermanac’H, N.; Falgarone, G. Rheumatoid arthritis: From autoimmunity to synovitis and joint destruction. J. Autoimmun. 2012, 39, 222–228. [Google Scholar] [CrossRef] [PubMed]
- Van Venrooij, W.J.; Zendman, A.J.; Pruijn, G.J. Autoantibodies to citrullinated antigens in (early) rheumatoid arthritis. Autoimmun. Rev. 2006, 6, 37–41. [Google Scholar] [CrossRef]
- Weyand, C.M.; Goronzy, J.J. The immunology of rheumatoid arthritis. Nat. Immunol. 2021, 22, 10–18. [Google Scholar] [CrossRef]
- Andreev, D.; Kachler, K.; Schett, G.; Bozec, A. Rheumatoid arthritis and osteoimmunology: The adverse impact of a deregulated immune system on bone metabolism. Bone 2022, 162, 116468. [Google Scholar] [CrossRef] [PubMed]
- Selvam, S.P.; Chinnadayyala, S.R.; Cho, S. Electrochemical nanobiosensor for early detection of rheumatoid arthritis biomarker: Anti-cyclic citrullinated peptide antibodies based on polyaniline (PANI)/MoS2-modified screen-printed electrode with PANI-Au nanomatrix-based signal amplification. Sens. Actuators B Chem. 2021, 333, 129570. [Google Scholar] [CrossRef]
- Alm, L.M.; Fountain, D.L.; Cadwell, K.K.; Madrigal, A.M.; Gallo, G.; Poorafshar, M. The performance of anti-cyclic citrullinated peptide assays in diagnosing rheumatoid arthritis: A systematic review and meta-analysis. Clin. Exp. Rheumatol. 2018, 36, 144–152. [Google Scholar]
- Moutsopoulos, H.M.; Zampeli, E. Medications, therapeutic modalities, and regimens used in the management of rheumatic diseases. In Immunology and Rheumatology in Questions; Springer: Berlin/Heidelberg, Germany, 2021; pp. 205–243. [Google Scholar]
- Muskat, K.K. Modeling the Synovium In Vitro; University of California: San Diego, CA, USA, 2018. [Google Scholar]
- Schellekens, G.A.; Visser, H.; De Jong, B.A.; Van Den Hoogen, F.H.; Hazes, J.M.; Breedveld, F.C.; Van Venrooij, W.J. The diagnostic properties of rheumatoid arthritis antibodies recognizing a cyclic citrullinated peptide. Arthritis Rheum. Off. J. Am. Coll. Rheumatol. 2000, 43, 155–163. [Google Scholar] [CrossRef]
- Klareskog, L.; Amara, K.; Malmström, V. Adaptive immunity in rheumatoid arthritis: Anticitrulline and other antibodies in the pathogenesis of rheumatoid arthritis. Curr. Opin. Rheumatol. 2014, 26, 72–79. [Google Scholar] [CrossRef]
- Batko, B.; Batko, K.; Krzanowski, M.; Żuber, Z. Physician adherence to treat-to-target and practice guidelines in rheumatoid arthritis. J. Clin. Med. 2019, 8, 1416. [Google Scholar] [CrossRef] [Green Version]
- Townsend, A.; Adam, P.; Cox, S.; Li, L. Everyday ethics and help-seeking in early rheumatoid arthritis. Chronic Illn. 2010, 6, 171–182. [Google Scholar] [CrossRef] [Green Version]
- Khatri, S.; Hansen, J.; Pedersen, N.B.; Brandt-Clausen, I.P.; Gram-Nielsen, S.; Mendes, A.C.; Chronakis, I.S.; Keiding, U.B.; Catrina, A.I.; Rethi, B.; et al. Cyclic Citrullinated Peptide Aptamer Treatment Attenuates Collagen-Induced Arthritis. Biomacromolecules 2022, 23, 2126–2137. [Google Scholar] [CrossRef]
- Regueiro, C.; Casares-Marfil, D.; Lundberg, K.; Knevel, R.; Acosta-Herrera, M.; Rodriguez-Rodriguez, L.; Lopez-Mejias, R.; Perez-Pampin, E.; Triguero-Martinez, A.; Nuño, L.; et al. HLA–B* 08 Identified as the Most Prominently Associated Major Histocompatibility Complex Locus for Anti–Carbamylated Protein Antibody–Positive/Anti–Cyclic Citrullinated Peptide–Negative Rheumatoid Arthritis. Arthritis Rheumatol. 2021, 73, 963–969. [Google Scholar] [CrossRef]
- Ramos, K.C.; Macías, M.D.P.C. Microdevice immunoassay with conjugated magnetic nanoparticles for rapid anti-cyclic citrullinated peptide (anti-CCP) detection. Talanta 2020, 224, 121801. [Google Scholar] [CrossRef]
- Ma, J.; Li, D.; Sun, B.; Hou, X.; Zhang-Peng, X.; Li, W.; Zhang, Y.; Hu, F.; Shi, X. Label-free Electrochemical Immunosensor for Sensitive Detection of Rheumatoid Arthritis Biomarker Anti-CCP-ab. Electroanalysis 2022, 34, 761–771. [Google Scholar] [CrossRef]
- Wu, T.-H.; Tsai, Y.-C.; Kuo, F.-C.; Lee, M.S.; Hu, C.-C.; Lee, G.-B. A Microfluidic Platform for Detection and Quantification of Two Biomarkers for Rheumatoid Arthritis. Available online: https://ssrn.com/abstract=4328231 (accessed on 28 January 2023).
- Agrawal, G.P. Nonlinear fiber optics. In Nonlinear Science at the Dawn of the 21st Century; Springer: Berlin/Heidelberg, Germany, 2000; pp. 195–211. [Google Scholar]
- Culshaw, B. Fiber optics in sensing and measurement. IEEE J. Sel. Top. Quantum Electron. 2000, 6, 1014–1021. [Google Scholar] [CrossRef]
- Udd, E. An overview of fiber-optic sensors. Rev. Sci. Instrum. 1995, 66, 4015–4030. [Google Scholar] [CrossRef]
- Culshaw, B.; Kersey, A. Fiber-Optic Sensing: A Historical Perspective. J. Light. Technol. 2008, 26, 1064–1078. [Google Scholar] [CrossRef]
- Mieloszyk, M.; Majewska, K.; Ostachowicz, W. Application of embedded fibre Bragg grating sensors for structural health monitoring of complex composite structures for marine applications. Mar. Struct. 2020, 76, 102903. [Google Scholar] [CrossRef]
- Liu, Z.; Liu, P.; Zhou, C.; Huang, Y.; Zhang, L. Structural Health Monitoring of Underground Structures in Reclamation Area Using Fiber Bragg Grating Sensors. Sensors 2019, 19, 2849. [Google Scholar] [CrossRef] [PubMed] [Green Version]
- Yu, J.; Wu, Z.; Yang, X.; Han, X.; Zhao, M. Tilted Fiber Bragg Grating Sensor Using Chemical Plating of a Palladium Membrane for the Detection of Hydrogen Leakage. Sensors 2018, 18, 4478. [Google Scholar] [CrossRef] [PubMed] [Green Version]
- Tomyshev, K.A.; Tazhetdinova, D.; Manuilovich, E.S.; Butov, O.V. High-resolution fiber optic surface plasmon resonance sensor for biomedical applications. J. Appl. Phys. 2018, 124, 113106. [Google Scholar] [CrossRef]
- Chen, X.; Jiang, J.; Zhang, N.; Lin, W.; Xu, P.; Sun, J. Study on a Plasmonic Tilted Fiber Grating-Based Biosensor for Calmodulin Detection. Biosensors 2021, 11, 195. [Google Scholar] [CrossRef] [PubMed]
- Rajan, G.; Bhowmik, K.; Xi, J.; Peng, G.-D. Etched Polymer Fibre Bragg Gratings and Their Biomedical Sensing Applications. Sensors 2017, 17, 2336. [Google Scholar] [CrossRef] [Green Version]
- Venketeswaran, A.; Lalam, N.; Wuenschell, J.; Ohodnicki, P.R.; Badar, M.; Chen, K.P.; Lu, P.; Duan, Y.; Chorpening, B.; Buric, M. Recent Advances in Machine Learning for Fiber Optic Sensor Applications. Adv. Intell. Syst. 2021, 4, 2100067. [Google Scholar] [CrossRef]
- Sabri, N.; Aljunid, S.; Salim, M.; Fouad, S. Fiber optic sensors: Short review and applications. In Recent Trends in Physics of Material Science and Technology; Springer: Berlin/Heidelberg, Germany, 2015; pp. 299–311. [Google Scholar]
- Yeh, C. Handbook of Fiber Optics: Theory and Applications; Academic Press: Cambridge, MA, USA, 2013. [Google Scholar]
- Personick, S.D. Fiber Optics: Technology and Applications; Springer Science & Business Media: Berlin/Heidelberg, Germany, 2013. [Google Scholar]
- Agrawal, G. Applications of Nonlinear Fiber Optics; Elsevier: Amsterdam, The Netherlands, 2001. [Google Scholar]
- Mohapatra, A.G.; Talukdar, J.; Mishra, T.C.; Anand, S.; Jaiswal, A.; Khanna, A.; Gupta, D. Fiber Bragg grating sensors driven structural health monitoring by using multimedia-enabled iot and big data technology. Multimedia Tools Appl. 2022, 81, 34573–34593. [Google Scholar] [CrossRef]
- Cao, Z.; Zhang, S.; Xia, T.; Liu, Z.; Li, Z. Spectral Demodulation of Fiber Bragg Grating Sensor Based on Deep Convolutional Neural Networks. J. Light. Technol. 2022, 40, 4429–4435. [Google Scholar] [CrossRef]
- Sarabi, M.R.; Jiang, N.; Ozturk, E.; Yetisen, A.K.; Tasoglu, S. Biomedical optical fibers. Lab Chip 2021, 21, 627–640. [Google Scholar] [CrossRef]
- Srivastava, S.K.; Arora, V.; Sapra, S.; Gupta, B.D. Localized Surface Plasmon Resonance-Based Fiber Optic U-Shaped Biosensor for the Detection of Blood Glucose. Plasmonics 2011, 7, 261–268. [Google Scholar] [CrossRef]
- Guo, T.; Liu, F.; Liang, X.; Qiu, X.; Huang, Y.; Xie, C.; Xu, P.; Mao, W.; Guan, B.-O.; Albert, J. Highly sensitive detection of urinary protein variations using tilted fiber grating sensors with plasmonic nanocoatings. Biosens. Bioelectron. 2016, 78, 221–228. [Google Scholar] [CrossRef] [Green Version]
- Najafzadeh, A.; Gunawardena, D.S.; Liu, Z.; Tran, T.; Tam, H.-Y.; Fu, J.; Chen, B.K. Application of Fibre Bragg Grating Sensors in Strain Monitoring and Fracture Recovery of Human Femur Bone. Bioengineering 2020, 7, 98. [Google Scholar] [CrossRef]
- Wen, H.-Y.; Hsu, Y.-C.; Chen, S.-Y.; Chiang, C.-C. The manufacturing process and spectral features of tilted fiber Bragg gratings. Opt. Laser Technol. 2020, 134, 106615. [Google Scholar] [CrossRef]
- Korganbayev, S.; Sypabekova, M.; Amantayeva, A.; González-Vila, Á.; Caucheteur, C.; Saccomandi, P.; Tosi, D. Optimization of Cladding Diameter for Refractive Index Sensing in Tilted Fiber Bragg Gratings. Sensors 2022, 22, 2259. [Google Scholar] [CrossRef]
- Wang, Q.; Du, N.N.; Zhao, W.M.; Wang, L.; Cong, X.W.; Zhu, A.S.; Qiu, F.M.; Zhang, K.K. Highly Sensitive U-Shaped Optical Fiber Refractometer Based on Bi2O2 Se-Assisted Surface Plasmon Resonance. IEEE Trans. Instrum. Meas. 2021, 71, 1–8. [Google Scholar]
- Zhou, B.; Yan, Y.; Xie, J.; Huang, H.; Wang, H.; Gopinath, S.C.; Anbu, P.; He, S.; Zhang, L. Immunosensing the rheumatoid arthritis biomarker through bifunctional aldehyde-amine linkers on an iron oxide nanoparticle seeded voltammetry sensor. Nanomater. Nanotechnol. 2022, 12, 18479804221085103. [Google Scholar] [CrossRef]
- Shevchenko, Y.Y.; Albert, J. Plasmon resonances in gold-coated tilted fiber Bragg gratings. Opt. Lett. 2007, 32, 211–213. [Google Scholar] [CrossRef] [Green Version]
- Albert, J.; Shao, L.-Y.; Caucheteur, C. Tilted fiber Bragg grating sensors. Laser Photon Rev. 2012, 7, 83–108. [Google Scholar] [CrossRef]
- Zhao, C.-L.; Yang, X.; Demokan, M.; Jin, W. Simultaneous temperature and refractive index measurements using a 3/spl deg/ slanted multimode fiber Bragg grating. J. Light. Technol. 2006, 24, 879–883. [Google Scholar] [CrossRef] [Green Version]
- Laffont, G.; Ferdinand, P. Tilted short-period fibre-Bragg-grating-induced coupling to cladding modes for accurate refractometry. Meas. Sci. Technol. 2001, 12, 765–770. [Google Scholar] [CrossRef]
- Chen, C.; Xiong, L.; Jafari, A.; Albert, J. Differential sensitivity characteristics of tilted fiber Bragg grating sensors. In Fiber Optic Sensor Technology and Applications IV; SPIE: Boston, MA, USA, 2005; Volume 6004, pp. 84–93. [Google Scholar]
- Miao, Y.; Liu, B.; Tian, S.; Zhao, Q. Temperature-insensitive refractive index sensor based on tilted fiber Bragg grating. Microw. Opt. Technol. Lett. 2008, 51, 479–483. [Google Scholar] [CrossRef]
- Erdogan, T.; Sipe, J.E. Tilted fiber phase gratings. J. Opt. Soc. Am. A 1996, 13, 296–313. [Google Scholar] [CrossRef]
- Spierings, G.A.C.M. Wet chemical etching of silicate glasses in hydrofluoric acid based solutions. J. Mater. Sci. 1993, 28, 6261–6273. [Google Scholar] [CrossRef]
- Lin, Y.-C.; Tsao, Y.-C.; Tsai, W.-H.; Hung, T.-S.; Chen, K.-S.; Liao, S.-C. The enhancement method of optical fiber biosensor based on surface plasmon resonance with cold plasma modification. Sens. Actuators B Chem. 2008, 133, 370–373. [Google Scholar] [CrossRef]
- Patel, N.; Davies, M.C.; Hartshorne, M.; Heaton, R.J.; Roberts, C.J.; Tendler, S.J.B.; Williams, P.M. Immobilization of Protein Molecules onto Homogeneous and Mixed Carboxylate-Terminated Self-Assembled Monolayers. Langmuir 1997, 13, 6485–6490. [Google Scholar] [CrossRef]
- Elahi, M.F.; Guan, G.; Wang, L.; King, M.W. Influence of Layer-by-Layer Polyelectrolyte Deposition and EDC/NHS Activated Heparin Immobilization onto Silk Fibroin Fabric. Materials 2014, 7, 2956–2977. [Google Scholar] [CrossRef] [Green Version]
- Nguyen, B.T.; Park, M.; Yoo, Y.S.; Kang, M.-J. Capillary electrophoresis-laser-induced fluorescence (CE-LIF)-based immunoassay for quantifying antibodies against cyclic citrullinated peptides. Analyst 2018, 143, 3141–3147. [Google Scholar] [CrossRef]
- Guerrero, S.; Sánchez-Tirado, E.; Martínez-García, G.; González-Cortés, A.; Yáñez-Sedeño, P.; Pingarrón, J.M. Electrochemical biosensor for the simultaneous determination of rheumatoid factor and anti-cyclic citrullinated peptide antibodies in human serum. Analyst 2020, 145, 4680–4687. [Google Scholar] [CrossRef]
- Lin, C.-Y.; Nguyen, U.T.N.; Hsieh, H.-Y.; Tahara, H.; Chang, Y.-S.; Wang, B.-Y.; Gu, B.-C.; Dai, Y.-H.; Wu, C.-C.; Tsai, I.-J.; et al. Peptide-based electrochemical sensor with nanogold enhancement for detecting rheumatoid arthritis. Talanta 2021, 236, 122886. [Google Scholar] [CrossRef]


| Authors | Immunoassay/Sensor | LOD | Linear Range | Year | Ref. |
|---|---|---|---|---|---|
| B.T. Nguyen et al. | CE-LIF | 0.1 μg/mL | N/A | 2018 | [56] |
| S. Guerrero et al. | SPCdEs | 2.5 IU/mL | 10–1000 U/mL | 2020 | [57] |
| C.-Y. Lin et al. | ELISA | 0.16 IU/mL | 0.25–1500 IU/mL | 2022 | [58] |
| B. Zhou et al. | Voltammetry Sensor | 15 pg/mL | 8–250 pg/mL | 2022 | [44] |
Disclaimer/Publisher’s Note: The statements, opinions and data contained in all publications are solely those of the individual author(s) and contributor(s) and not of MDPI and/or the editor(s). MDPI and/or the editor(s) disclaim responsibility for any injury to people or property resulting from any ideas, methods, instructions or products referred to in the content. |
© 2023 by the authors. Licensee MDPI, Basel, Switzerland. This article is an open access article distributed under the terms and conditions of the Creative Commons Attribution (CC BY) license (https://creativecommons.org/licenses/by/4.0/).
Share and Cite
Wen, H.-Y.; Chiang, C.-C.; Chen, R.-Y.; Ni, W.-Z.; Weng, Y.-Q.; Yeh, Y.-T.; Hsu, H.-C. Immunosensing for Early Detection of Rheumatoid Arthritis Biomarkers: Anti-Cyclic Citrullinated Peptide Antibodies Based on Tilted-Fiber Bragg Grating Biosensor. Bioengineering 2023, 10, 261. https://doi.org/10.3390/bioengineering10020261
Wen H-Y, Chiang C-C, Chen R-Y, Ni W-Z, Weng Y-Q, Yeh Y-T, Hsu H-C. Immunosensing for Early Detection of Rheumatoid Arthritis Biomarkers: Anti-Cyclic Citrullinated Peptide Antibodies Based on Tilted-Fiber Bragg Grating Biosensor. Bioengineering. 2023; 10(2):261. https://doi.org/10.3390/bioengineering10020261
Chicago/Turabian StyleWen, Hsin-Yi, Chia-Chin Chiang, Rou-Yu Chen, Wei-Zhi Ni, Yu-Qiao Weng, Yao-Tsung Yeh, and Hsiang-Cheng Hsu. 2023. "Immunosensing for Early Detection of Rheumatoid Arthritis Biomarkers: Anti-Cyclic Citrullinated Peptide Antibodies Based on Tilted-Fiber Bragg Grating Biosensor" Bioengineering 10, no. 2: 261. https://doi.org/10.3390/bioengineering10020261