
Ιnclusion Complexes of Magnesium Phthalocyanine with Cyclodextrins as Potential Photosensitizing Agents
 and
and
Abstract
:1. Introduction
2. Materials and Methods
2.1. Materials
2.2. Preparation of Magnesium Phthalocyanine Inclusion Complexes (ICs) with Various Cyclodextrins
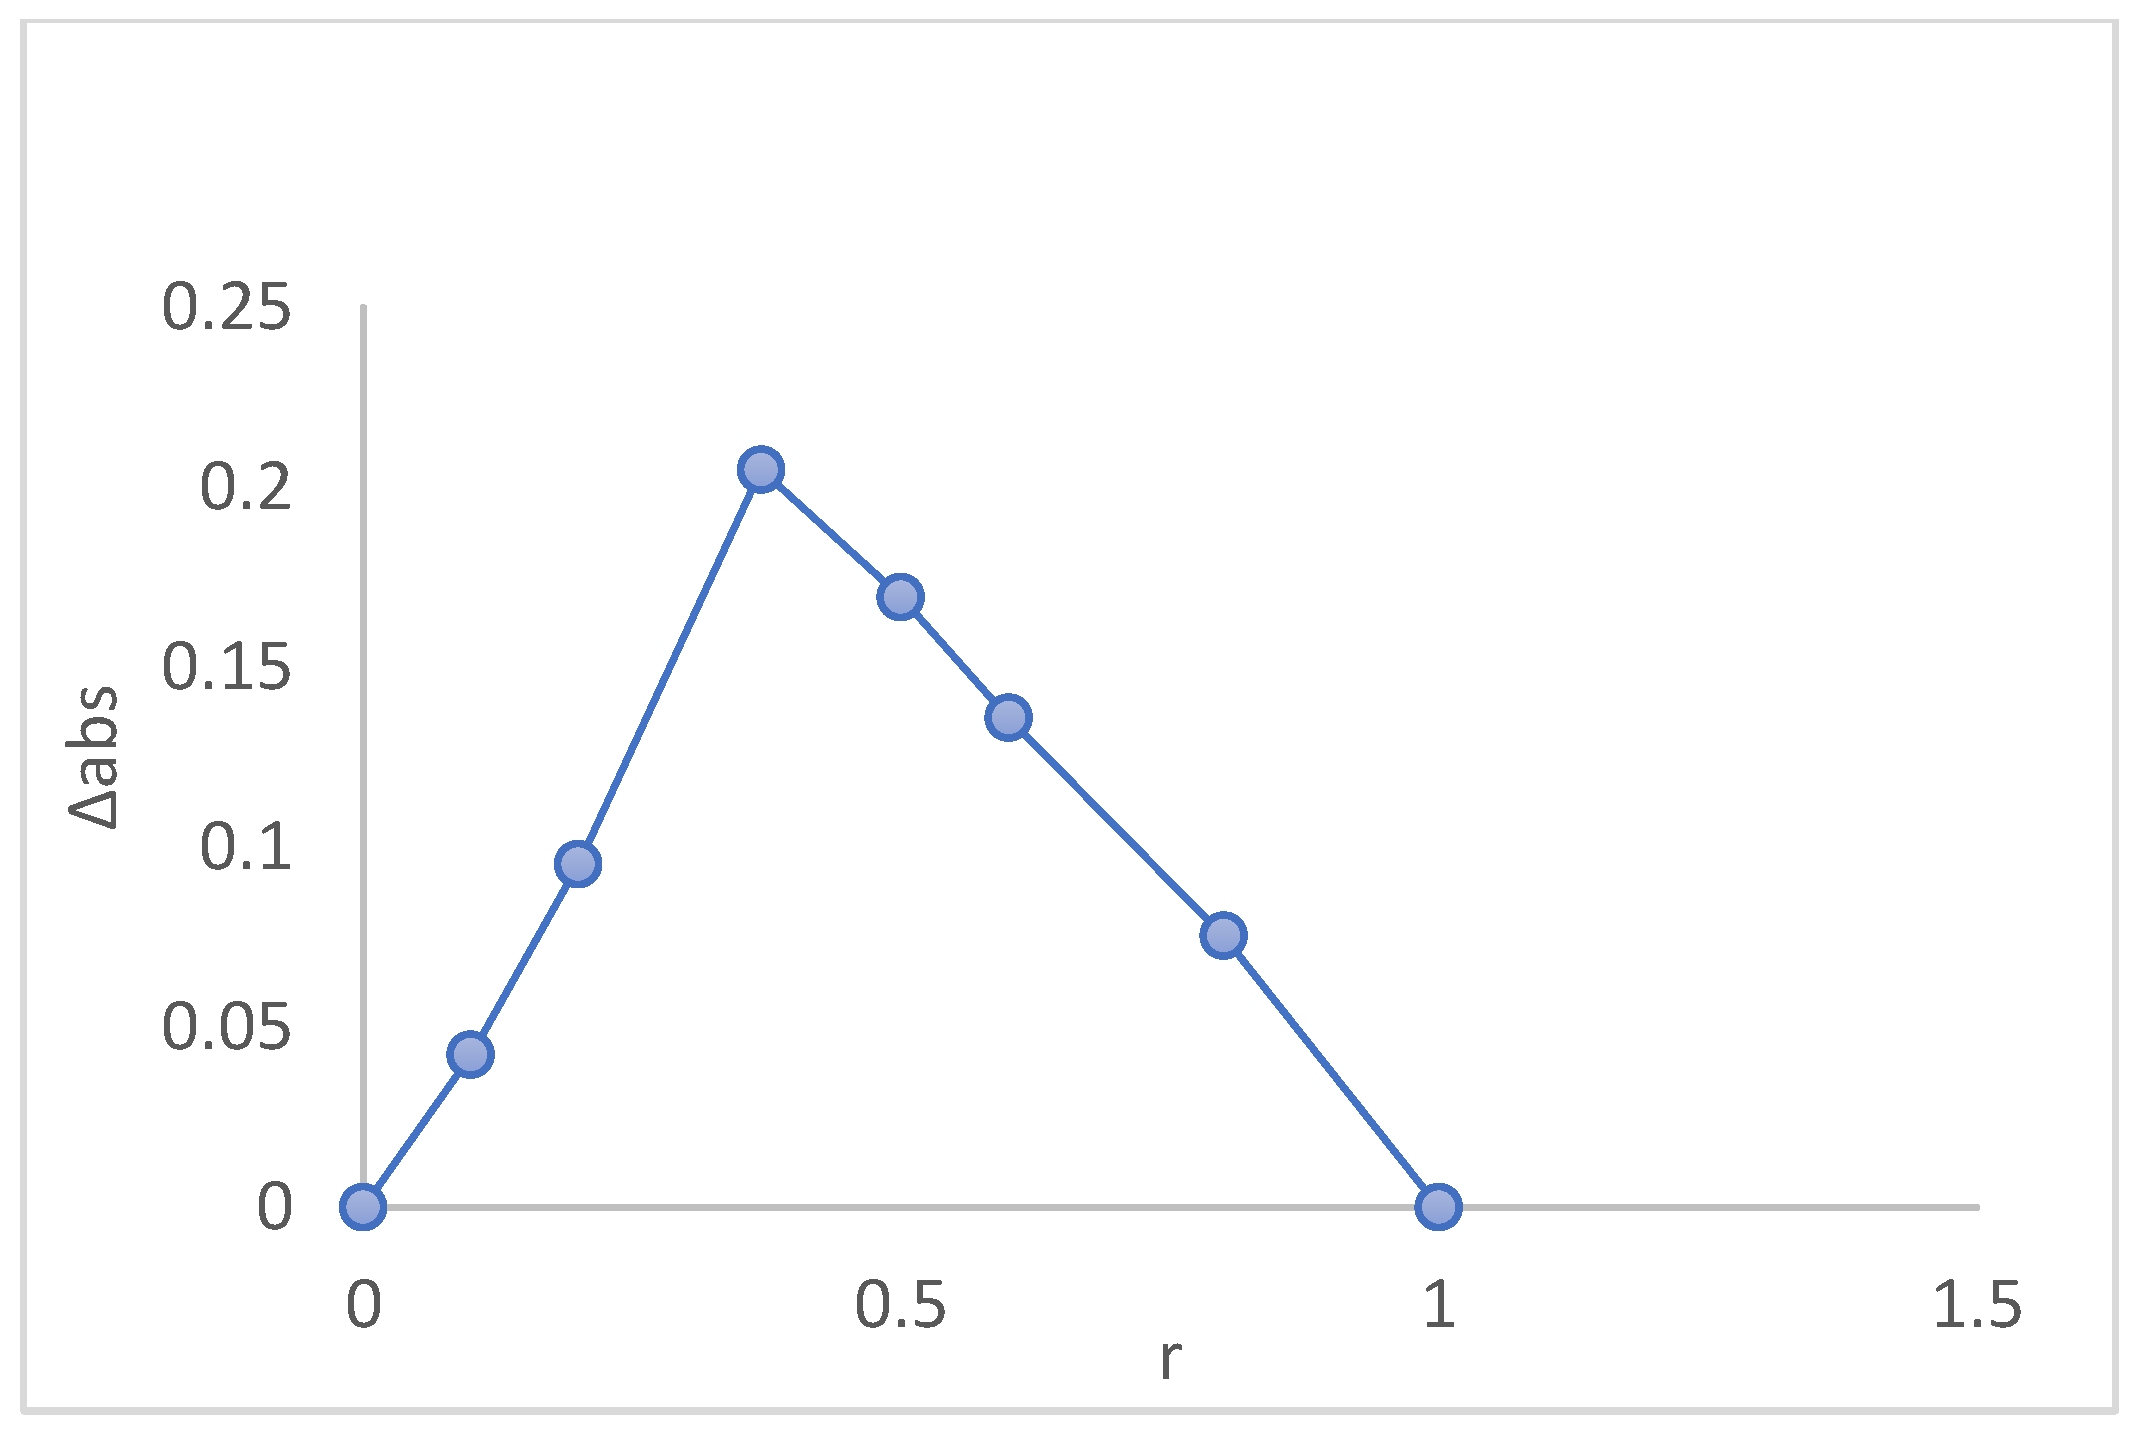
2.3. Evaluation of the Stoichiometry of the ICs Using Job’s Plot
2.4. Characterization of the CD—MgPc ICs
2.4.1. Process Yield
2.4.2. Inclusion Efficiency of the CD-Phthalocyanines ICs
2.4.3. Dynamic Light Scattering (DLS)
2.4.4. Fourier Transform Infrared Spectroscopy (FT-IR Spectroscopy)
2.4.5. Nuclear Magnetic Resonance Spectroscopy (NMR Spectroscopy)
2.5. In Vitro Release Studies of the MgPc from the CD-MgPc ICs
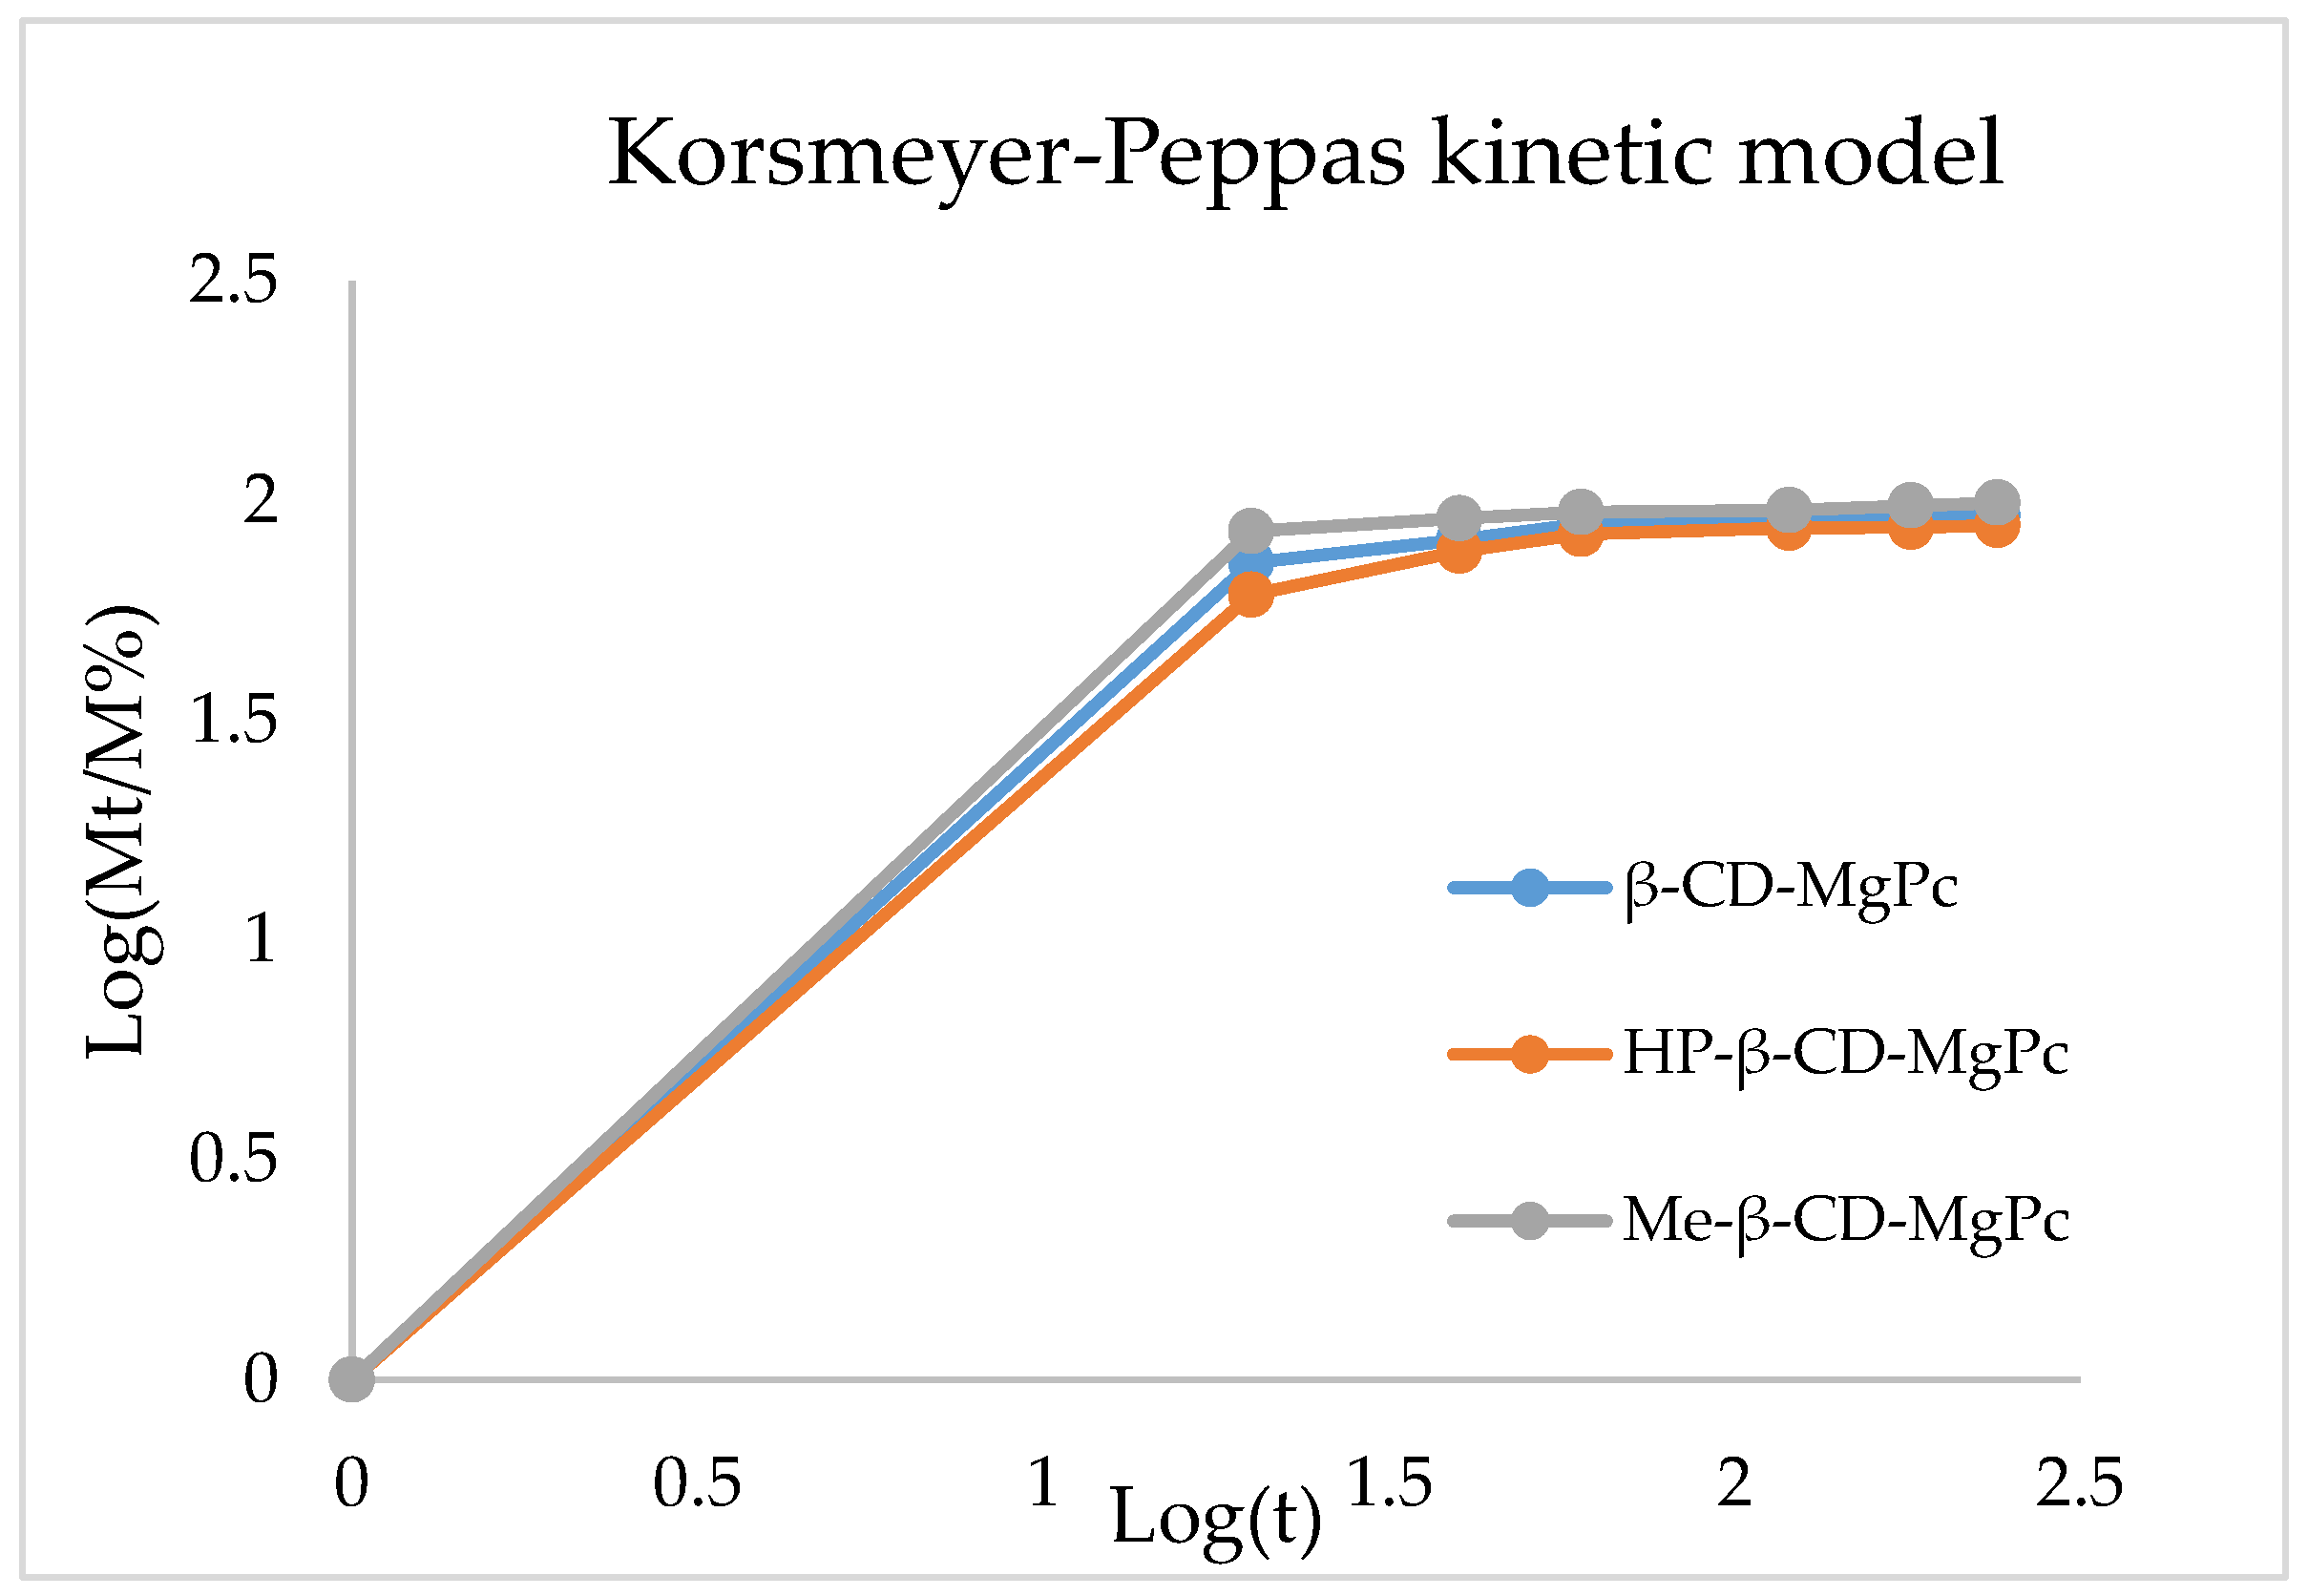
Kinetic Modeling of the MgPc Release from the CD-MgPc ICs
2.6. Optical Properties of Inclusion Complexes of MgPc with Natural and Modified CDs
2.6.1. UV-Vis Absorption
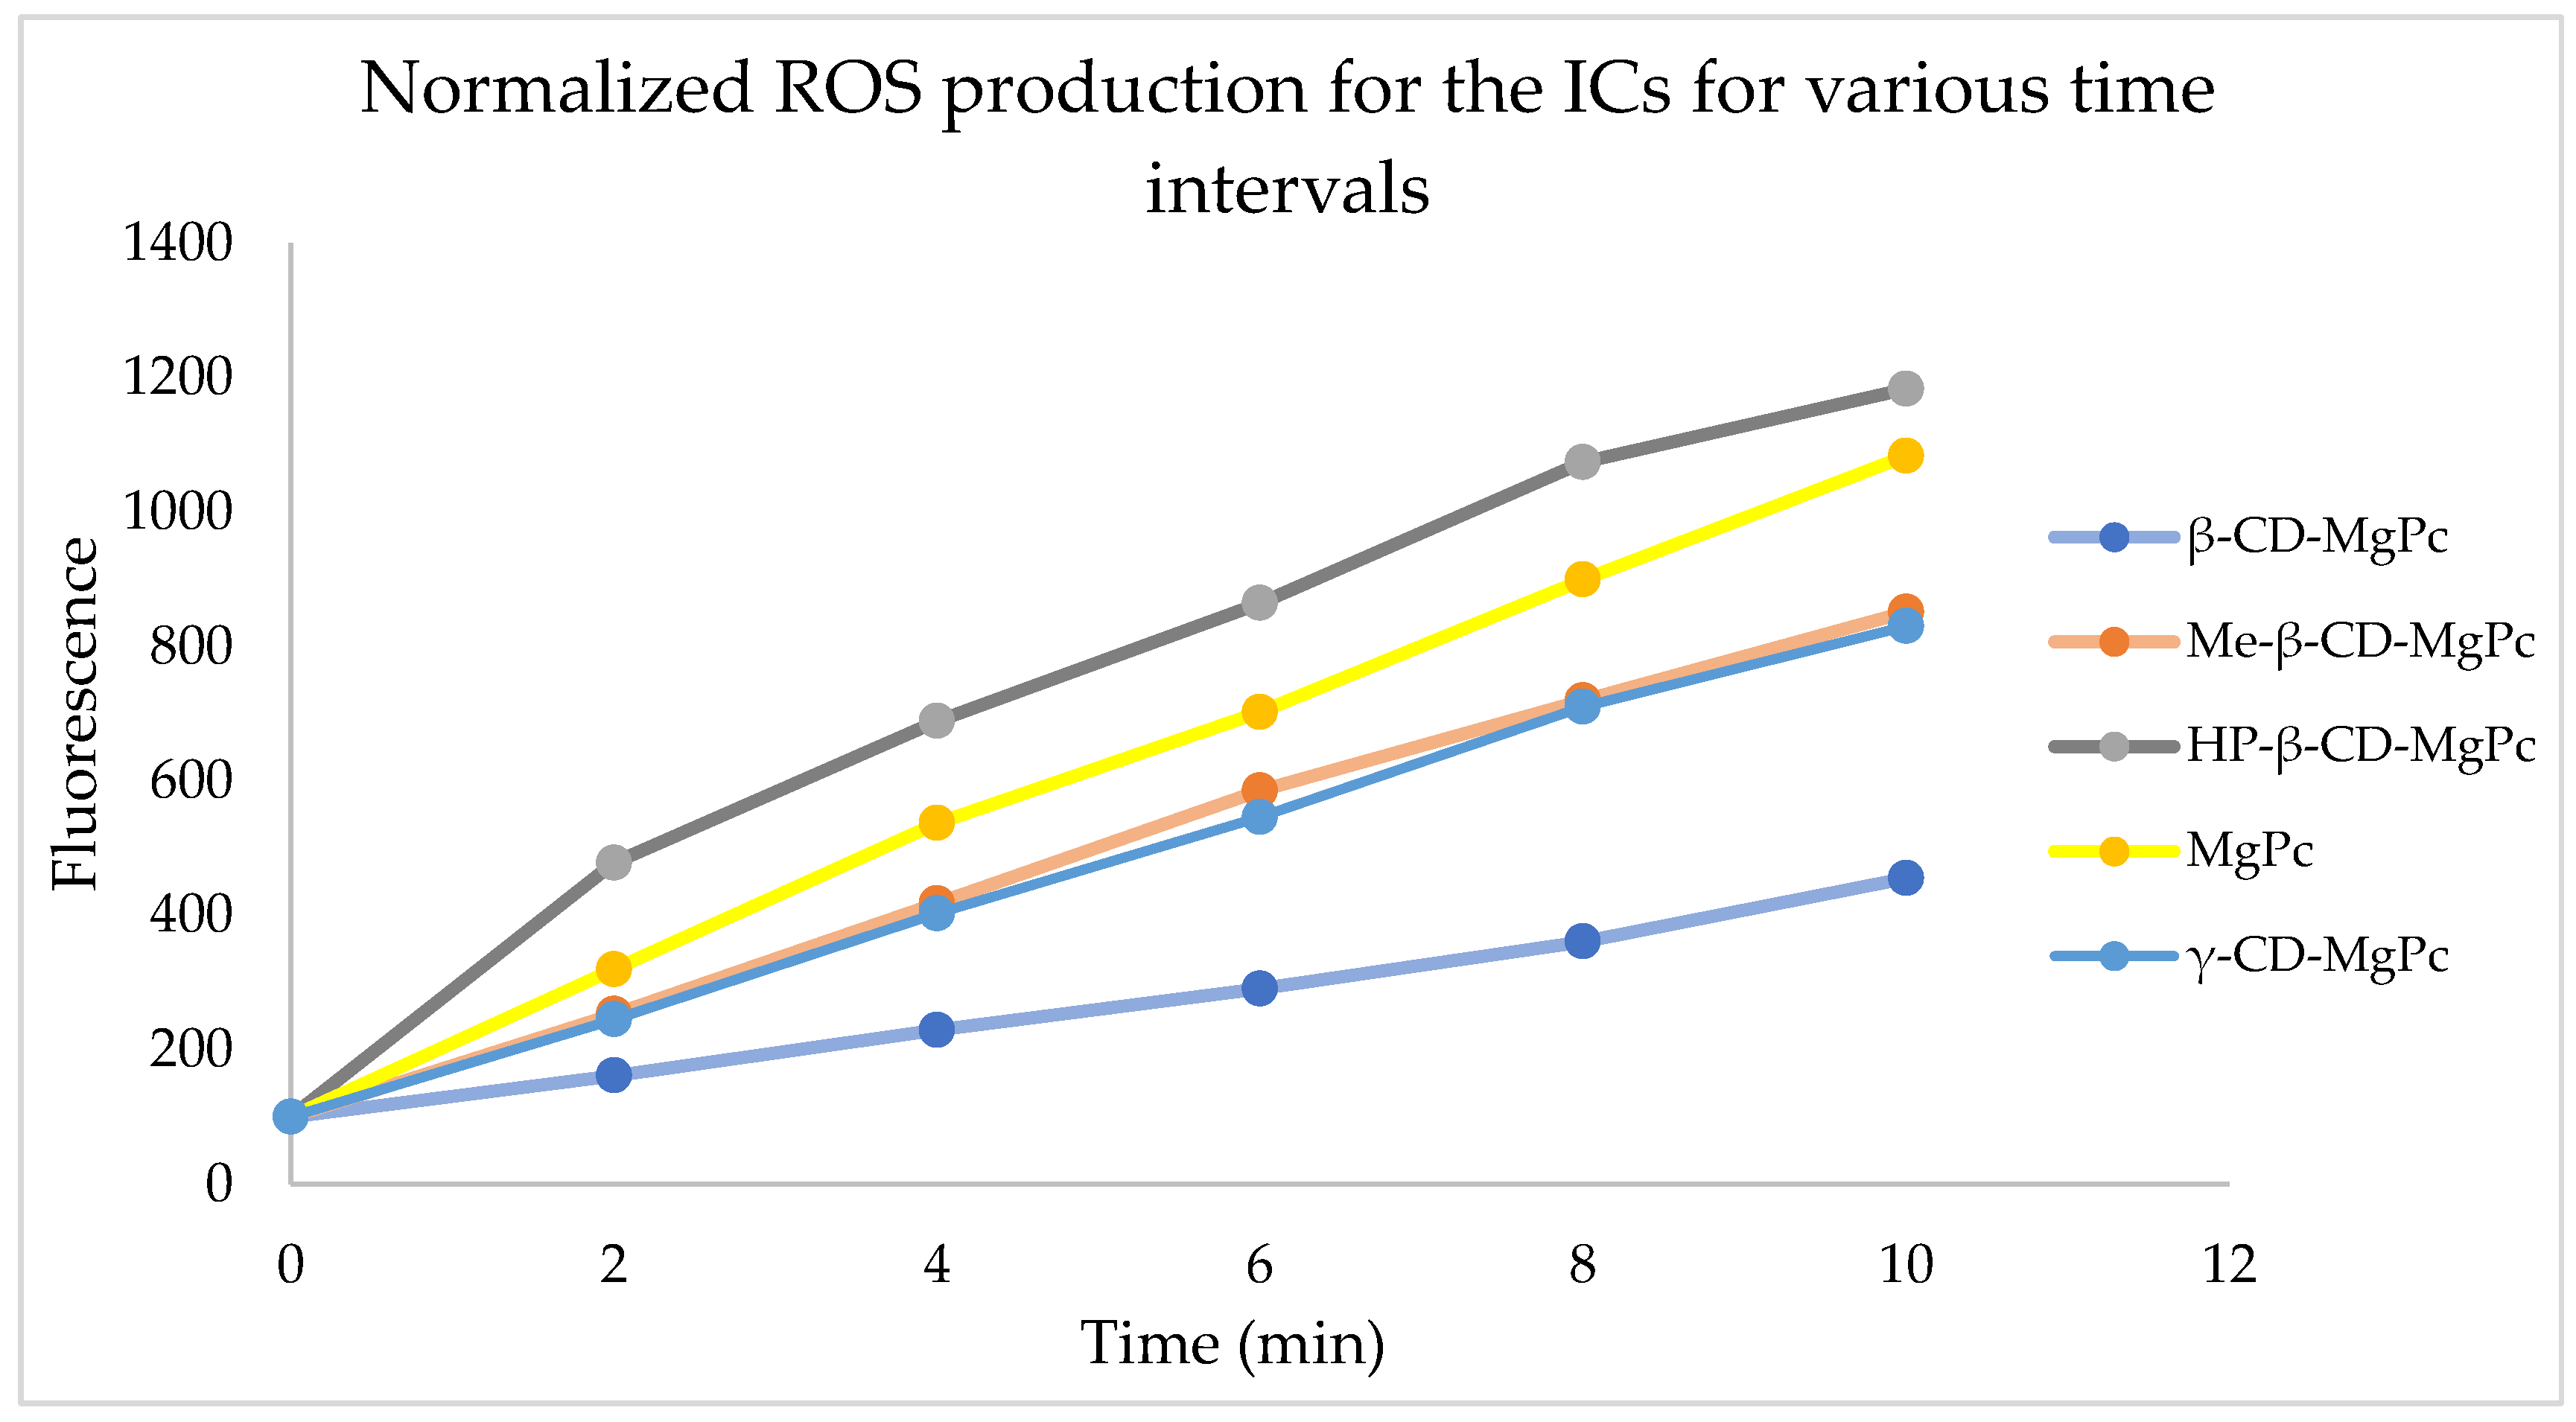
2.6.2. ROS Production
2.7. Cell Culture Conditions
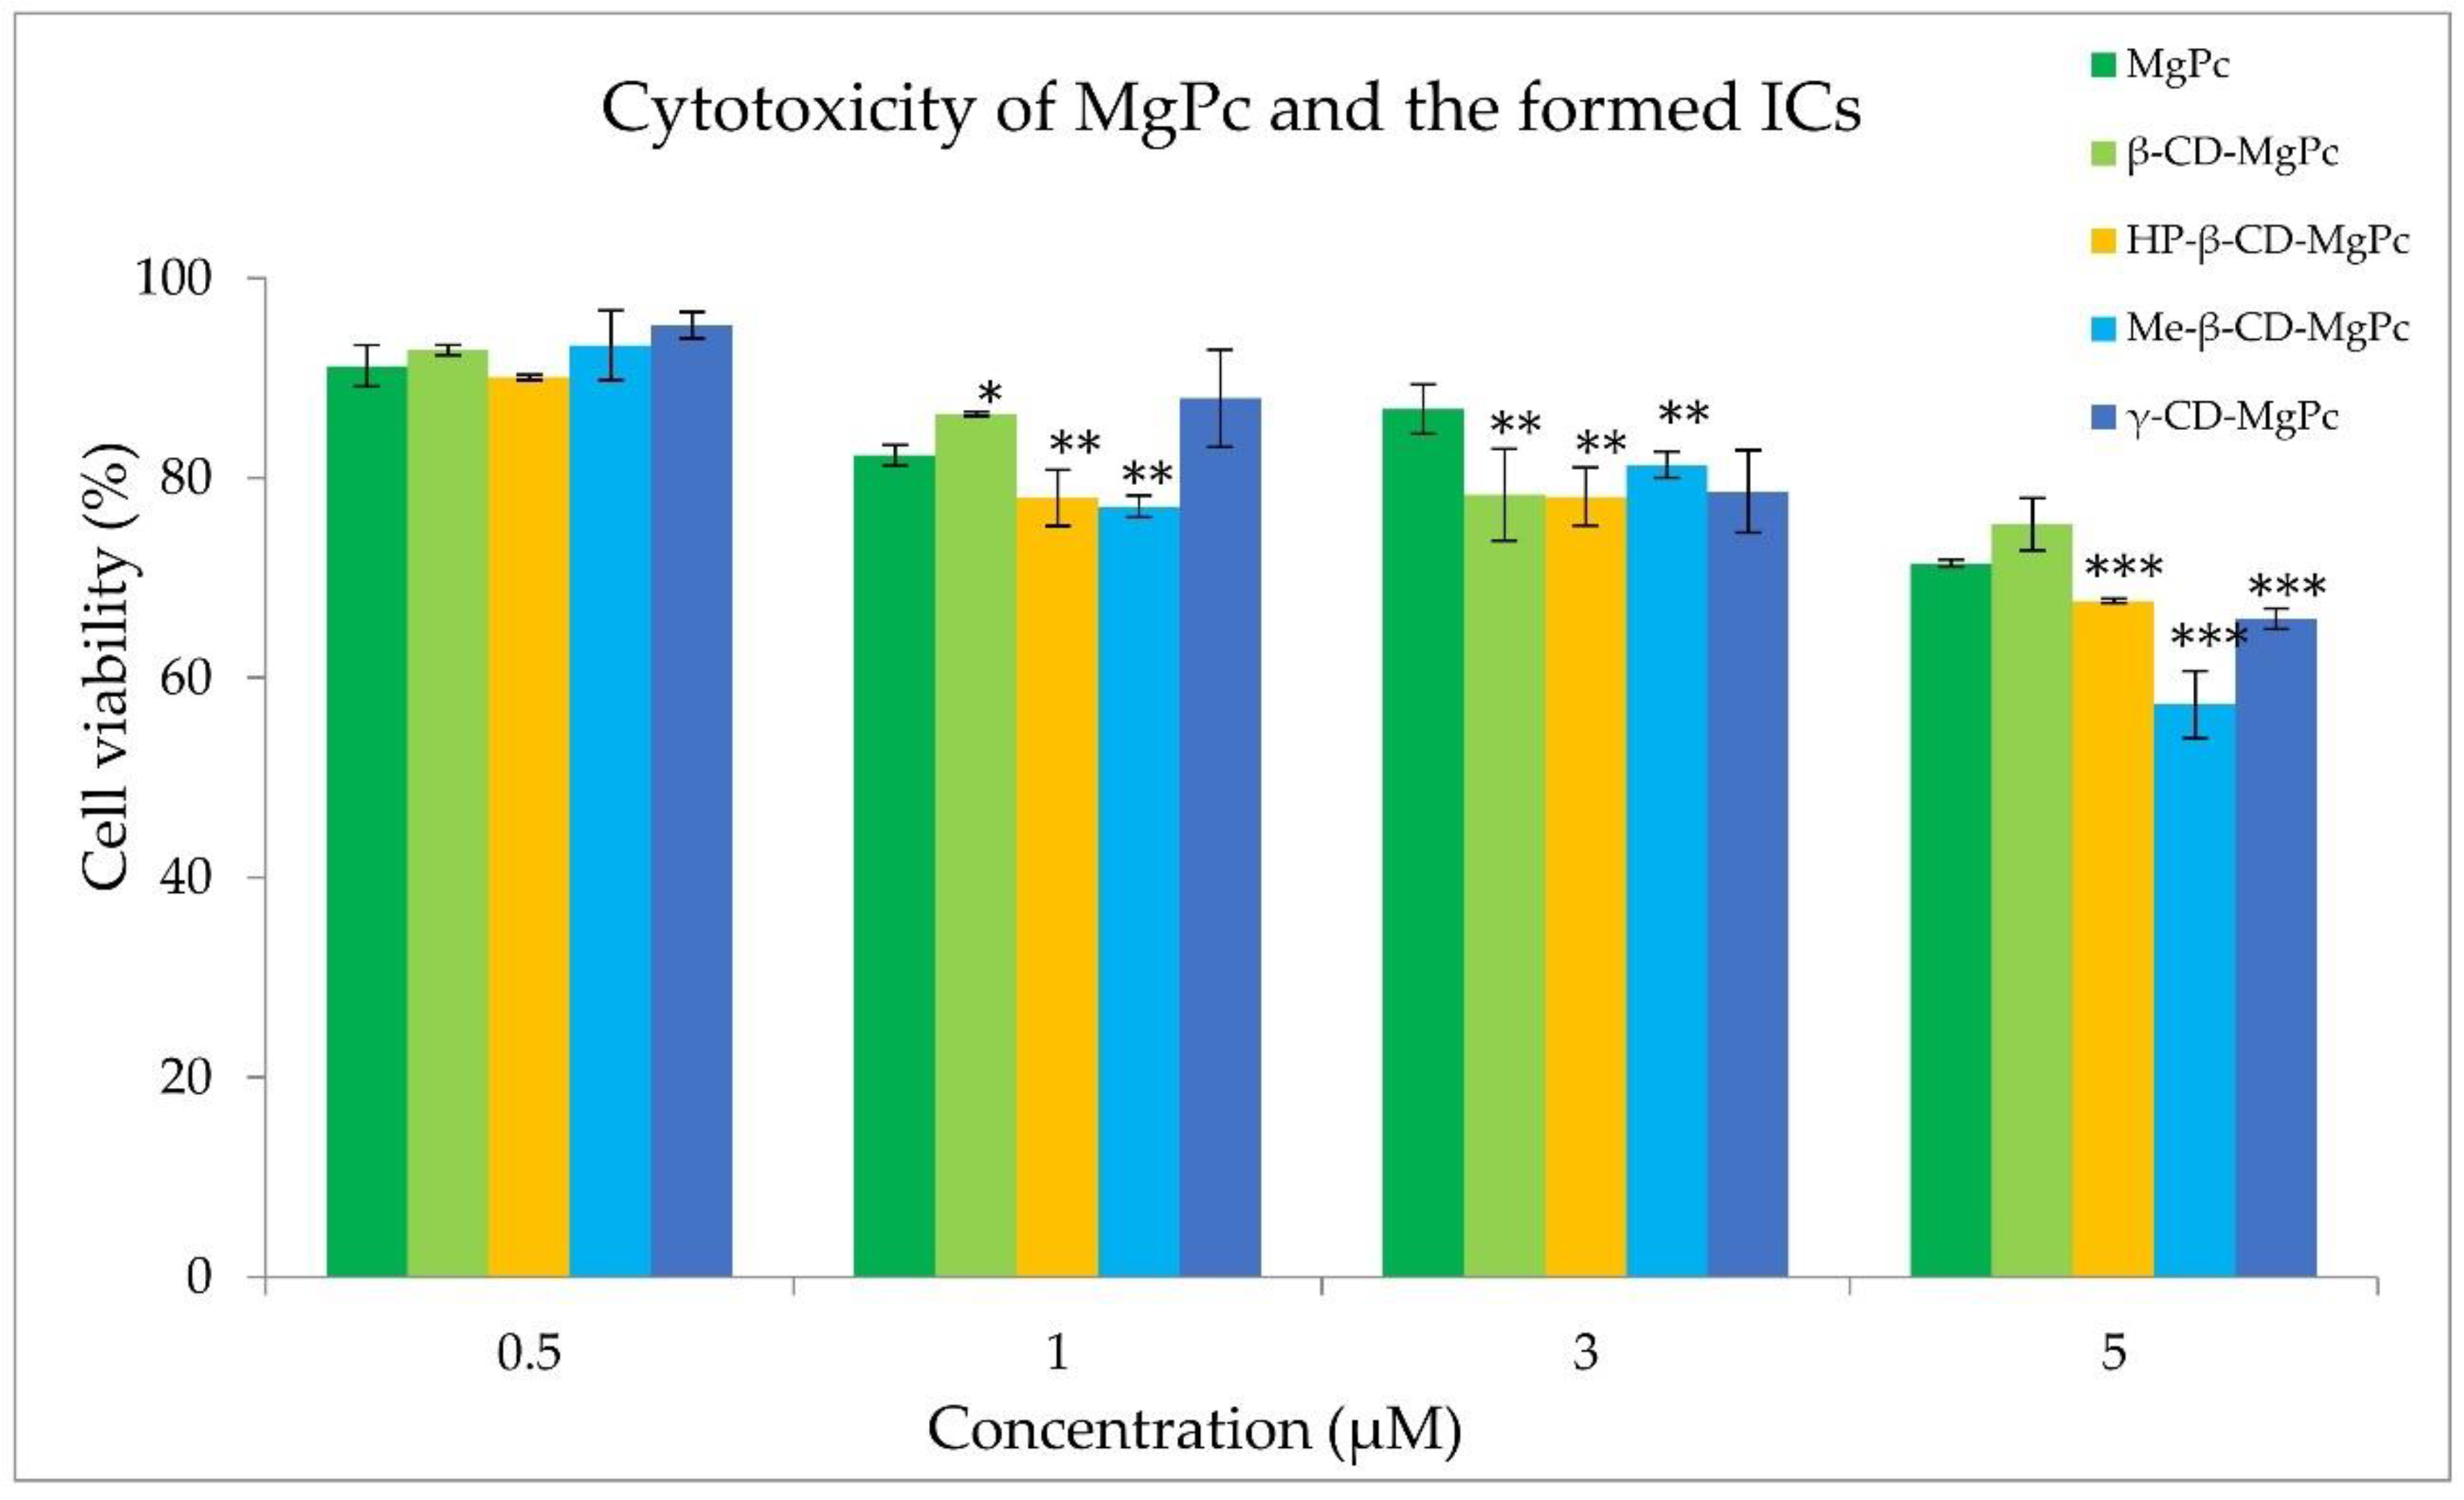
2.8. Cell Viability Assessment, MTT Assay
2.8.1. Dark Toxicity Studies
2.8.2. Light Toxicity Studies
2.9. Photodynamic Treatment
2.10. Irradiation Device
2.11. Intracellular Localization
3. Results
3.1. Evaluation of the Stoichiometry of the ICs Using Job’s Plot
3.2. Characterization of the CD-MgPc ICs
3.2.1. Process Yield and Inclusion Efficiency
3.2.2. Size, Polydispersity Index (PDI), and ζ-Potential
3.2.3. Fourier Transform Infrared Spectroscopy (FT-IR Spectroscopy)
3.2.4. Nuclear Magnetic Resonance Spectroscopy (NMR Spectroscopy)
3.3. In Vitro Release Studies of the MgPc from the CD-MgPc ICs
Kinetic Modeling of the MgPc Release from the CD-MgPc ICs
3.4. Optical Properties of CD-MgPc ICs
3.4.1. Absorption Spectroscopy
3.4.2. ROS Production Evaluation
3.5. Photodynamic Treatment
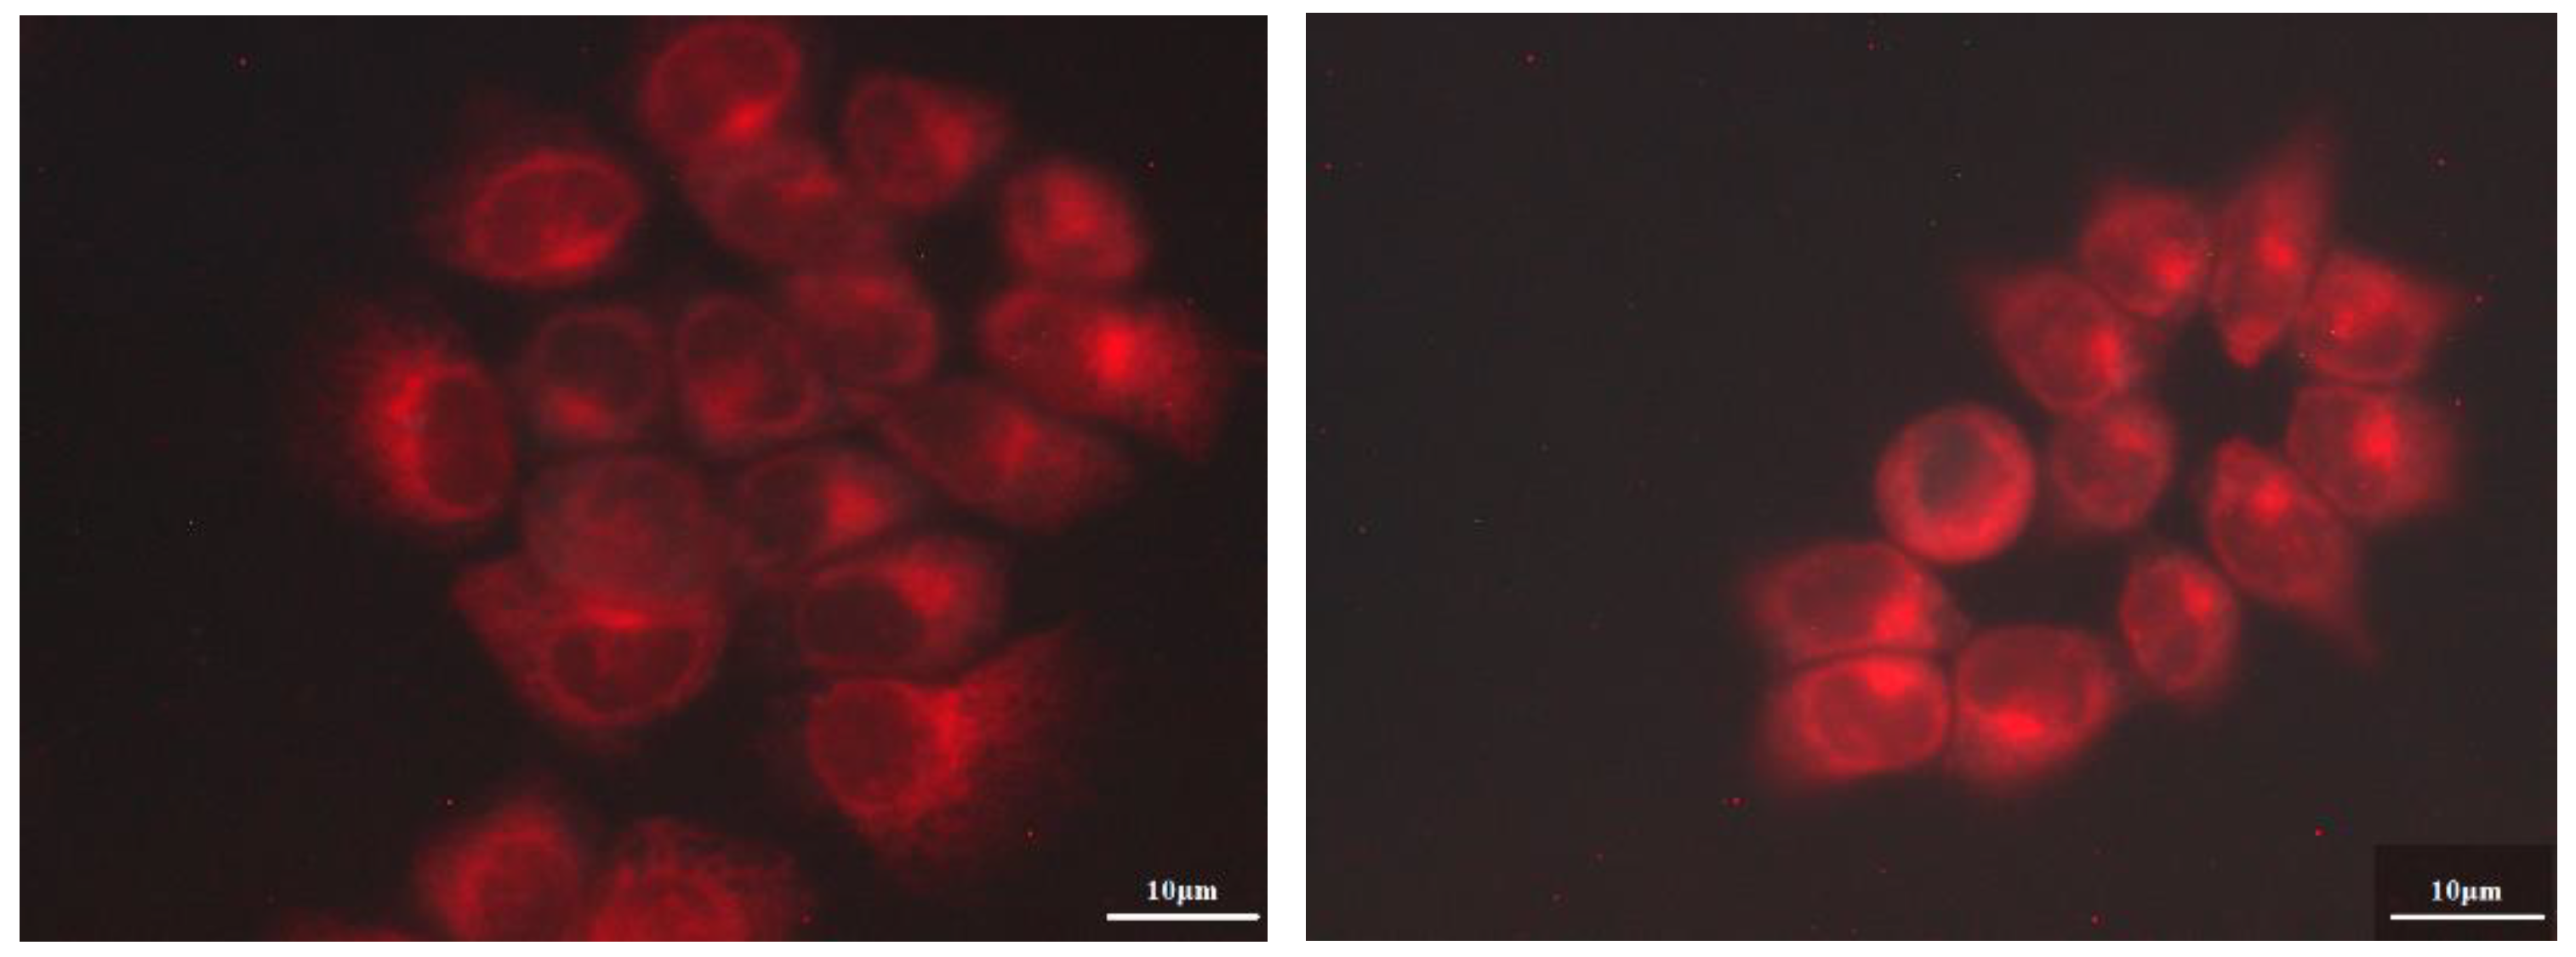
3.6. Intracellular Localization Studies
4. Conclusions
Supplementary Materials
Author Contributions
Funding
Institutional Review Board Statement
Informed Consent Statement
Data Availability Statement
Conflicts of Interest
References
- Kröger, J.; Néel, N.; Berndt, R.; Wang, Y.F.; Gopakumar, T.G. Exploring the Organic–Inorganic Interface With a Scanning Tunneling Microscope. In Reference Module in Chemistry, Molecular Sciences and Chemical Engineering; Elsevier: Amsterdam, The Netherlands, 2017; pp. 81–98. [Google Scholar]
- Claessens, C.G.; Hahn, U.; Torres, T. Phthalocyanines: From outstanding electronic properties to emerging applications. Chem. Rec. 2008, 8, 75–97. [Google Scholar] [CrossRef] [PubMed]
- Allen, C.M.; Sharman, W.M.; Van Lier, J.E. Current status of phthalocyanines in the photodynamic therapy of cancer. J. Porphyr. Phthalocyanines 2001, 5, 161–169. [Google Scholar] [CrossRef]
- Schmidt, J.; Kuzyniak, W.; Berkholz, J.; Steinemann, G.; Ogbodu, R.; Hoffmann, B.; Nouailles, G.; Gürek, A.G.; Nitzsche, B.; Höpfner, M. Novel zinc-and silicon-phthalocyanines as photosensitizers for photodynamic therapy of cholangiocarcinoma. Int. J. Mol. Med. 2018, 42, 534–546. [Google Scholar] [CrossRef] [PubMed]
- Roguin, L.P.; Chiarante, N.; Vior, M.C.; Marino, J. Zinc (II) phthalocyanines as photosensitizers for antitumor photodynamic therapy. Int. J. Biochem. Cell Biol. 2019, 114, 105575. [Google Scholar] [CrossRef] [PubMed]
- Halevas, E.; Arvanitidou, M.; Mavroidi, B.; Hatzidimitriou, A.G.; Politopoulos, K.; Alexandratou, E.; Pelecanou, M.; Sagnou, M. A novel curcumin gallium complex as photosensitizer in photodynamic therapy: Synthesis, structural and physicochemical characterization, photophysical properties and in vitro studies against breast cancer cells. J. Mol. Struct. 2021, 1240, 130485. [Google Scholar] [CrossRef]
- Kazantzis, K.T.; Koutsonikoli, K.; Mavroidi, B.; Zachariadis, M.; Alexiou, P.; Pelecanou, M.; Politopoulos, K.; Alexandratou, E.; Sagnou, M. Curcumin derivatives as photosensitizers in photodynamic therapy: Photophysical properties and in vitro studies with prostate cancer cells. Photochem. Photobiol. Sci. 2020, 19, 193–206. [Google Scholar] [CrossRef] [PubMed]
- Calixto, G.M.; Bernegossi, J.; De Freitas, L.M.; Fontana, C.R.; Chorilli, M. Nanotechnology-based drug delivery systems for photodynamic therapy of cancer: A review. Molecules 2016, 21, 342. [Google Scholar] [CrossRef] [PubMed]
- Lin, X.; Wang, R.; Pan, S.; Yang, H.; Peng, Y. Three components encapsulated nanoparticles: Preparation and photophysical property. Arab. J. Chem. 2021, 14, 103023. [Google Scholar] [CrossRef]
- Gao, D.; Wong, R.C.; Wang, Y.; Guo, X.; Yang, Z.; Lo, P.C. Shifting the absorption to the near-infrared region and inducing a strong photothermal effect by encapsulating zinc (II) phthalocyanine in poly (lactic-co-glycolic acid)-hyaluronic acid nanoparticles. Acta Biomater. 2020, 116, 329–343. [Google Scholar] [CrossRef] [PubMed]
- Nkanga, C.I.; Krause, R.W.M. Encapsulation of isoniazid-conjugated phthalocyanine-in-cyclodextrin-in-Liposomes Using Heating Method. Sci. Rep. 2019, 9, 11485. [Google Scholar] [CrossRef] [PubMed] [Green Version]
- Borlan, R.; Stoia, D.; Gaina, L.; Campu, A.; Marc, G.; Perde-Schrepler, M.; Silion, M.; Maniu, D.; Focsan, M.; Astilean, S. Fluorescent Phthalocyanine-Encapsulated Bovine Serum Albumin Nanoparticles: Their Deployment as Therapeutic Agents in the NIR Region. Molecules 2021, 26, 4679. [Google Scholar] [CrossRef] [PubMed]
- Gidwani, B.; Vyas, A. A comprehensive review on cyclodextrin-based carriers for delivery of chemotherapeutic cytotoxic anticancer drugs. BioMed Res. Int. 2015, 2015, 198268. [Google Scholar] [CrossRef] [PubMed]
- Mihoub, A.B.; Youssef, Z.; Colombeau, L.; Jouan-Hureaux, V.; Arnoux, P.; Frochot, C.; Vanderesse, R.; Acherar, S. Inclusion complex vs. conjugation of hydrophobic photosensitizers with β-cyclodextrin: Improved disaggregation and photodynamic therapy efficacy against glioblastoma cells. Mater. Sci. Eng. C 2020, 109, 110604. [Google Scholar] [CrossRef] [PubMed]
- Sergey, V.K.; Thorsteinn, L. Cyclodextrins. Int. J. Pharm. 2013, 453, 167–180. [Google Scholar]
- Crini, G. A history of cyclodextrins. Chem. Rev. 2014, 114, 10940–10975. [Google Scholar] [CrossRef]
- Jansook, P.; Ogawa, N.; Loftsson, T. Cyclodextrins: Structure, physicochemical properties and pharmaceutical applications. Int. J. Pharm. 2018, 535, 272–284. [Google Scholar] [CrossRef]
- Srivastava, A.; Hunter, J.M. Reversal of neuromuscular block. Br. J. Anaesth. 2009, 103, 115–129. [Google Scholar] [CrossRef]
- Halahlah, A.; Kavetsou, E.; Pitterou, I.; Grigorakis, S.; Loupassaki, S.; Tziveleka, L.A.; Kikionis, S.; Ioannou, E.; Detsi, A. Synthesis and characterization of inclusion complexes of rosemary essential oil with various β-cyclodextrins and evaluation of their antibacterial activity against Staphylococcus aureus. J. Drug Deliv. Sci. Technol. 2021, 65, 102660. [Google Scholar] [CrossRef]
- Adjali, A.; Pontillo, A.R.; Kavetsou, E.; Katopodi, A.; Tzani, A.; Grigorakis, S.; Loupassaki, S.; Detsi, A. Clove Essential Oil–Hydroxypropyl-β-Cyclodextrin Inclusion Complexes: Preparation, Characterization and Incorporation in Biodegradable Chitosan Films. Micro 2022, 2, 212–224. [Google Scholar] [CrossRef]
- Bruschi, M.L. Strategies to Modify the Drug Release from Pharmaceutical Systems; Woodhead Publishing: Cambridge, UK, 2015; pp. 63–86. [Google Scholar]
- Mircioiu, C.; Voicu, V.; Anuta, V.; Tudose, A.; Celia, C.; Paolino, D.; Fresta, M.; Sandulovici, R.; Mircioiu, I. Mathematical Modeling of Release Kinetics from Supramolecular Drug Delivery Systems. Pharmaceutics 2019, 11, 140. [Google Scholar] [CrossRef]
- Giannakopoulos, E.; Katopodi, A.; Rallis, M.; Politopoulos, K.; Alexandratou, E. The effects of low power laser light at 661 nm on wound healing in a scratch assay fibroblast model. Lasers Med. Sci. 2023, 38, 27. [Google Scholar] [CrossRef] [PubMed]
- Leng, X.; Choi, C.F.; Luo, H.B.; Cheng, Y.K.; Ng, D.K. Host-Guest Interactions of 4-Carboxyphenoxy Phthalocyanines and β-Cyclodextrins in Aqueous Media. Org. Lett. 2007, 9, 2497–2500. [Google Scholar] [CrossRef] [PubMed]
- Xu, R. Particle Characterization: Light Scattering Methods; Kluwer Academic Publishers: Dordrecht, The Netherlands, 2001; pp. 289–343. [Google Scholar]
- Kotronia, M.; Kavetsou, E.; Loupassaki, S.; Kikionis, S.; Vouyiouka, S.; Detsi, A. Encapsulation of Oregano (Origanum onites L.) essential oil in β-cyclodextrin (β-CD): Synthesis and characterization of the inclusion complexes. Bioengineering 2017, 4, 74. [Google Scholar] [CrossRef]
- Bratu, I.; Hernanz, A.; Gavira, J.M.; Bora, G.H. FT-IR spectroscopy of inclusion complexes of beta-cyclodextrin with fenbufen and ibuprofen. Rom. J. Phys. 2005, 50, 1063. [Google Scholar]
- Rachmawati, H.; Edityaningrum, C.A.; Mauludin, R. Molecular Inclusion Complex of Curcumin–-Cyclodextrin Nanoparticle to Enhance Curcumin Skin Permeability from Hydrophilic Matrix Gel. AAPS PharmSciTech 2013, 14, 1303–1312. [Google Scholar] [CrossRef]
- Janczak, J.; Idemori, Y.M. Synthesis, crystal structure and charac-terisation of aquamagnesium phthalocyanine—MgPc (H2O). The origin of an in- tense near-IR absorption of magnesium phthalocyanine known as ‘X-phase’. Polyhedron 2003, 22, 1167–1181. [Google Scholar] [CrossRef]
- Ben Mihoub, A.; Larue, L.; Moussaron, A.; Youssef, Z.; Colombeau, L.; Baros, F.; Frochot, C.; Vanderesse, R.; Acherar, S. Use of cyclodextrins in anticancer photodynamic therapy treatment. Molecules 2018, 23, 1936. [Google Scholar] [CrossRef] [PubMed]
- Schneider, H.J.; Hacket, F.; Rudiger, V.; Ikeda, H. NMR studies of cyclodextrins and cyclodextrin complexes. Chem. Rev. 1998, 98, 1755–1785. [Google Scholar] [CrossRef]
- Venuti, V.; Crupi, V.; Fazio, B.; Majolino, D.; Acri, G.; Testagrossa, B.; Stancanelli, R.; De Gaetano, F.; Gagliardi, A.; Paolino, D. Physicochemical Characterization and Antioxidant Activity Evaluation of Idebenone/Hydroxypropyl-β-Cyclodextrin Inclusion Complex. Biomolecules 2019, 9, 531. [Google Scholar] [CrossRef]
- Pessine, F.B.; Calderini, A.; Alexandrino, G.L. Cyclodextrin inclusion complexes probed by NMR techniques. Magn. Reson. Spectrosc. 2012, 3, 264. [Google Scholar]
- Fu, J.; Li, X.Y.; Ng, D.K.; Wu, C. Encapsulation of phthalocyanines in biodegradable poly (sebacic anhydride) nanoparticles. Langmuir 2002, 18, 3843–3847. [Google Scholar] [CrossRef]
- Lourenço, L.M.O.; Pereira, P.M.R.; Maciel, E.; Valega, M.; Domingues, F.M.J.; Domingues, M.R.M.; Neves, M.; Cavaleiro, J.A.S.; Fernandes, R.; Tome, J.P.C. Amphiphilic phthalocyanine-cyclodextrin conjugates for cancer photodynamic therapy. Chem. Commun. 2014, 50, 8363–8366. [Google Scholar] [CrossRef] [PubMed]
- Saokham, P.; Muankaew, C.; Jansook, P.; Loftsson, T. Solubility of cyclodextrins and drug/cyclodextrin complexes. Molecules 2018, 23, 1161. [Google Scholar] [CrossRef] [PubMed] [Green Version]
- Lu, S.; Wang, A.; Ma, Y.J.; Xuan, H.Y.; Zhao, B.; Li, X.D.; Zhou, J.H.; Zhou, L.; Wei, S.H. Cyclodextrin type dependent host-guest interaction mode with phthalocyanine and their influence on photodynamic activity to cancer. Carbohydr. Polym. 2016, 148, 236–242. [Google Scholar] [CrossRef] [PubMed]
- Reisa, T.A.; Jaculia, A.E.; Ramosb, K.L.V.; Souza PE, N.; Veiga-Souzac, F.H.; Joanittid, G.A.; Azevedob, R.B.; Gratieria, T.; Cunha-Filhoa, M.; Gelfusoa, G.M. Combination of cyclodextrin complexation and iontophoresis as a promising strategy for the cutaneous delivery of aluminum-chloride phthalocyanine in photodynamic therapy. Eur. J. Pharm. Sci. 2019, 139, 105056. [Google Scholar] [CrossRef] [PubMed]


| Samples | MgPc:CD Ratio (mol) | %Inclusion Efficiency (%EE) | %Process Yield (%PY) |
|---|---|---|---|
| β-CD | 1:1 | 81 | 82 |
| HP-β-CD | 1:1 | 97 | 76 |
| γ-CD | 1:1 | 67 | 79 |
| Me-β-CD | 1:1 | 59 | 69 |
| Samples | Mean Hydrodynamic Radius (nm) | Polydispersity Index | ζ-Potential (mV) |
|---|---|---|---|
| β-CD-MgPc | 564.5 ± 52.6 | 0.522 ± 0.024 | −29.8 ± 1.2 |
| HP-β-CD-MgPc | 688.4 ± 105.1 | 0.552 ± 0.053 | −17.7 ± 0.5 |
| Me-β-CD-MgPc | 746.1 ± 37.1 | 0.534 ± 0.014 | −23.0 ± 1.6 |
| γ-CD-MgPc | 748.7 ± 52.0 | 0.566 ± 0.043 | −14.9 ± 4.0 |
| Characteristic Absorption Bands (cm−1) | |||||||||||
|---|---|---|---|---|---|---|---|---|---|---|---|
| O-H Stretching | C-H Stretching | C-H Antisymmetric Stretching of CH2 | C=C-C Stretching (Aromatic) | C-C Stretching Vibration (Isoindole) | O-H Bending | C-C Stretching (Pyrrole) | C-N Stretching (Pyrrole) | C-O Stretching (Secondary Alcohols) | Mg-N Stretching Vibration | C-H Out of Plane Deformation | |
| MgPc | - | - | - | 1525 | 1483 | - | 1333 | 1057 | - | 888 | 728 |
| β-CD | 3376 | 2924 | 1643 | - | - | 1414 | - | - | 1028 | - | - |
| β-CD-MgPc | 3411 | 2920 | 1646 | 1521 | 1482 | 1417 | - | - | 1027 | - | 727 |
| HP-β-CD | 3413 | 2926 | 1640 | - | - | 1468 | - | - | 1038 | - | - |
| HP-β-CD-MgPc | 3411 | 2926 | 1646 | 1528 | 1482 | - | - | - | 1030 | - | 727 |
| Me-β-CD | 3419 | 2931 | 1640 | - | - | 1457 | - | - | 1043 | - | - |
| Me-β-CD-MgPc | 3414 | 2926 | 1651 | 1521 | 1482 | - | - | - | 1044 | - | 725 |
| HP-β-CD-MgPc (solvent free kneading) | 3413 | 2925 | 1639 | 1525 | 1481 | 1454 | 1333 | 1057 | 1032 | 889 | 731 |
| HP-β-CD-MgPc (physical mixture) | 3413 | 2927 | 1639 | 1522 | 1481 | 1469 | 1331 | 1057 | 1032 | 889 | 730 |
| Proton | Chemical Shifts (δ1) of β-CD Protons (ppm) | Chemical Shifts (δ2) of β-CD Protons in the β-CD-MgPc ICs (ppm) | ∆δ = δ2 − δ1 (ppm) |
|---|---|---|---|
| H-1 | 4.826 | 4.802 | 0.024 |
| H-2 | 3.3 | 3.276 | 0.024 |
| H-3 | 3.632 | 3.608 | 0.024 |
| H-4 | 3.353 | 3.333 | 0.020 |
| H-5 | 3.559 | 3.534 | 0.025 |
| H-6 | 3.632 | 3.608 | 0.024 |
| Proton | Chemical Shifts (δ1) of Me-β-CD Protons (ppm) | Chemical Shifts (δ2) of Me-β-CD Protons in the Me-β-CD-MgPc ICs (ppm) | ∆δ = δ2 − δ1 (ppm) |
|---|---|---|---|
| H-1 | 5.062 | 5.052 | 0.01 |
| H-2 | 3.23 | 3.221 | 0.009 |
| H-3 | 3.478 | 3.47 | 0.008 |
| H-4 | 3.351 | 3.298 | 0.053 |
| H-5 | 3.478 | 3.47 | 0.008 |
| H-6 | 3.478 | 3.47 | 0.008 |
| Proton | Chemical Shifts (δ1) of HP-β-CD Protons (ppm) | Chemical Shifts (δ2 of HP-β-CD Protons in the HP-β-CD-MgPc ICs (ppm) | ∆δ = δ2 − δ1 (ppm) |
|---|---|---|---|
| H-1 | 4.980 | 5.000 | −0.020 |
| H-2 | 3.353 | 3.297 | −0.056 |
| H-3 | 3.734 | 3.722 | 0.024 |
| H-4 | 3.353 | 3.297 | −0.056 |
| H-5 | 3.597 | 3.589 | 0.008 |
| H-6 | 3.597 | 3.589 | 0.008 |
| H-7 | 3.353 | 3.297 | −0.056 |
| H-8 | 3.734 | 3.722 | 0.024 |
| H-9 | 1.009 | 0.994 | 0.015 |
| Proton | Chemical Shifts (δ1) of HP-β-CD Protons (ppm) | Chemical Shifts (δ2) of HP-β-CD Protons in the HP-β-CD and MgPc Physical Mixture (ppm) | ∆δ = δ2 − δ1 (ppm) |
|---|---|---|---|
| H-1 | 4.980 | 4.992 | −0.012 |
| H-2 | 3.353 | 3.311 | 0.042 |
| H-3 | 3.734 | 3.741 | −0.07 |
| H-4 | 3.353 | 3.311 | 0.042 |
| H-5 | 3.597 | 3.599 | −0.002 |
| H-6 | 3.597 | 3.599 | −0.002 |
| H-7 | 3.353 | 3.311 | 0.042 |
| H-8 | 3.734 | 3.741 | −0.007 |
| H-9 | 1.009 | 1.012 | −0.003 |
| IC | Zero Order | First Order | Higuchi | Korsmeyer-Peppas |
|---|---|---|---|---|
| R2 | R2 | R2 | R2 | |
| Me-β-CD-MgPc | 0.314 | 0.238 | 0.586 | 0.806 |
| β-CD-MgPc | 0.371 | 0.252 | 0.653 | 0.823 |
| HP-β-CD-MgPc | 0.408 | 0.264 | 0.693 | 0.837 |
| IC | Korsmeyer-Peppas | Diffusion Exponent | |
|---|---|---|---|
| R2 | Equation | ||
| Me-β-CD-MgPc | 0.806 | y = 0.825x + 0.345 | 0.825 |
| β-CD-MgPc | 0.823 | y = 0.819x + 0.325 | 0.819 |
| HP-β-CD-MgPc | 0.837 | y = 0.814x + 0.306 | 0.814 |
Disclaimer/Publisher’s Note: The statements, opinions and data contained in all publications are solely those of the individual author(s) and contributor(s) and not of MDPI and/or the editor(s). MDPI and/or the editor(s) disclaim responsibility for any injury to people or property resulting from any ideas, methods, instructions or products referred to in the content. |
© 2023 by the authors. Licensee MDPI, Basel, Switzerland. This article is an open access article distributed under the terms and conditions of the Creative Commons Attribution (CC BY) license (https://creativecommons.org/licenses/by/4.0/).
Share and Cite
Kavetsou, E.; Tsoukalas-Koulas, C.; Katopodi, A.; Kalospyros, A.; Alexandratou, E.; Detsi, A. Ιnclusion Complexes of Magnesium Phthalocyanine with Cyclodextrins as Potential Photosensitizing Agents. Bioengineering 2023, 10, 244. https://doi.org/10.3390/bioengineering10020244
Kavetsou E, Tsoukalas-Koulas C, Katopodi A, Kalospyros A, Alexandratou E, Detsi A. Ιnclusion Complexes of Magnesium Phthalocyanine with Cyclodextrins as Potential Photosensitizing Agents. Bioengineering. 2023; 10(2):244. https://doi.org/10.3390/bioengineering10020244
Chicago/Turabian StyleKavetsou, Eleni, Charalampos Tsoukalas-Koulas, Annita Katopodi, Alexandros Kalospyros, Eleni Alexandratou, and Anastasia Detsi. 2023. "Ιnclusion Complexes of Magnesium Phthalocyanine with Cyclodextrins as Potential Photosensitizing Agents" Bioengineering 10, no. 2: 244. https://doi.org/10.3390/bioengineering10020244