Article

Artificial Vision: The High-Frequency Electrical Stimulation of the Blind Mouse Retina Decay Spike Generation and Electrogenically Clamped Intracellular Ca2+ at Elevated Levels

Neuroretinal Electrophysiology and Imaging, Institute for Ophthalmic Research, Eberhard-Karls-Universität Tübingen, 72076 Tübingen, Germany
*
Author to whom correspondence should be addressed.
Bioengineering 2023, 10(10), 1208; https://doi.org/10.3390/bioengineering10101208
Submission received: 15 August 2023 / Revised: 5 October 2023 / Accepted: 13 October 2023 / Published: 16 October 2023
(This article belongs to the Special Issue Pathophysiology and Translational Research of Retinal Diseases)

Abstract

:
Background: The electrical stimulation (stim) of retinal neurons enables blind patients to experience limited artificial vision. A rapid response outage of the stimulated ganglion cells (GCs) allows for a low visual sensation rate. Hence, to elucidate the underlying mechanism, we investigated different stim parameters and the role of the neuromodulator calcium (Ca2+). Methods: Subretinal stim was applied on retinal explants (blind rd1 mouse) using multielectrode arrays (MEAs) or single metal electrodes, and the GC activity was recorded using Ca2+ imaging or MEA, respectively. Stim parameters, including voltage, phase polarity, and frequency, were investigated using specific blockers. Results: At lower stim frequencies (<5 Hz), GCs responded synaptically according to the stim pulses (stim: biphasic, cathodic-first, −1.6/+1.5 V). In contrast, higher stim frequencies (≥5 Hz) also activated GCs directly and induced a rapid GC spike response outage (<500 ms, MEA recordings), while in Ca2+ imaging at the same frequencies, increased intracellular Ca2+ levels were observed. Conclusions: Our study elucidated the mechanisms involved in stim-dependent GC spike response outage: sustained high-frequency stim-induced spike outage, accompanied by electrogenically clamped intracellular Ca2+ levels at elevated levels. These findings will guide future studies optimizing stim paradigms for electrical implant applications for interfacing neurons.

1. Introduction

Blinding diseases, such as hereditary retinitis pigmentosa, affect millions of people worldwide [1,2,3]. The concept of microchip implants, which excite neurons through stim [4,5], has been successfully evaluated in clinical trials that have partially restored the vision of blind patients (subretinal implants [6,7,8,9], epiretinal implants [10,11], and cortical implants [12,13,14]). In clinical trials, blind patients implanted with these microelectronics accomplished daily life tasks, such as recognizing simple shapes, reading large letters, and combining them into words [9,15,16]. In advanced mobility tests, some patients could track a line on the floor, follow a walking person, identify obstacles, and even evaluate distances in both daylight and nighttime conditions [17,18,19].
Regarding performance, artificial vision technology still faces limitations in terms of spatial and, in particular, temporal resolution. For most patients, the visual sensation rate was limited to 0.3 s at a 3 Hz stim frequency; higher stim frequencies led to vision fading [15,20,21]. This phenomenon was investigated in animal experiments, which showed that the fading of vision experienced by patients originates in the stimulated retina at the cellular level. Thereby, the high-frequency stim of retinal explants leads to an outage of ganglion cell (GC) responses [7,22,23,24,25]. It has been proposed that the desensitization of membrane channels facilitates the response outage in neurons [26,27,28]. However, no conclusive evidence has yet been presented describing the underlying mechanism for retinal GC response outage.
In our previous studies investigating the outer retina of a rd1 mouse model for retinal degeneration [29], we observed that cellular calcium (Ca2+) responses are modulated by the strength of the applied stim. Hence, in the present study, we thoroughly investigated the role of Ca2+ in shaping GC responses. Different stim parameters were investigated, including voltage (0.5–2.5 V), polarity (anodic- or cathodic-first), the distance of the stim electrode to the reference electrode, and frequencies (various frequencies up to 50 Hz for 90 s). We utilized multimodal methods to record GC responses (Ca2+ imaging and multielectrode array (MEA)) and applied specific synaptic and channel blockers to determine the role of Ca2+ in the modulation of GC responses.
The temporal correlation of GC Ca2+ responses and spike trains revealed interesting yet undescribed findings. At high stim frequencies (sustained application), while the GC spike responses were absent, the intracellular Ca2+ levels were remarkably elevated. We concluded that high-frequency stim prevented electrogenically cellular Ca2+ extrusion and thereby clamped intracellular Ca2+ at high levels with probable electrophysiological implications for the further generation of GC spikes during ongoing sustained stim.
These findings are interesting for studies optimizing stim paradigms for artificial vision to counter vision fading and, overall, for electrical implants’ neural interfaces.

2. Materials and Methods

2.1. Animals

This study used a blind rd1 (C3H Pde6brd1/rd1) mouse model (age: 19–39 days; n = 11) for retinal degeneration with primary rod degeneration and secondary cone dystrophy [30]. The animals were housed under standard light conditions, had free access to food and water, and were used irrespective of gender. The animals were anesthetized in a carbon dioxide atmosphere and were immediately sacrificed by cervical dislocation.

2.2. Tissue Preparation and Loading

After enucleating both eyes, the retinas were isolated in artificial cerebrospinal fluid (ACSF) containing (in mM) 125 NaCl, 26 NaHCO3, 2.5 KCl, 2 CaCl2, 1 MgCl2, 1.25 NaH2PO4, and 20 glucose (obtained from Sigma-Aldrich, Darmstadt, Germany). A pH of 7.4 was maintained by perfusing it with carbogen (95% CO2/5% O2). To minimize the number of animals used, the explanted retina was cut in half, and each half was used for recording. For Ca2+ imaging, the GCs were loaded by applying electroporation with fluorescent Ca2+ dye Oregon Green 488 BAPTA-1 (OGB-1, Sigma-Aldrich, Darmstadt, Germany). The electroporation method for bulk loading described by Brigman and Euler [31] was adapted for the stim of rd1 retina. For loading (5 µM, diluted in ACSF), 20 monophasic pulses of 7 V with a pulse duration of 100 ms were applied at 1 Hz (platinum disk electrode on Petri dish, 5 mm Ø, and 1 mm height frame; 4 mm Ø platinum disk electrode on the tip of the stick, Xceltis GmbH, Heidelberg, Germany). After the electroporation process, the retina was incubated in ACSF for 1 h to recover before being transferred to the MEA recording chamber. Prior to recording, the retina rested for an additional 30 min on the MEA electrode field with ACSF perfusion (1 mL/min).

2.3. Electrical Stimulation and Recording

The retina was placed in an MEA system (USB-MEA60-Up-BC-System-E, Multi-Channel Systems (MCS), Reutlingen, Germany) equipped with a 60HexaMEA40/10iR-ITO-pr (MCS, Reutlingen, Germany) consisting of 59 individual electrodes with a diameter of 10 µm in a 40 µm distance and an internal reference electrode. The built-in temperature system of the MEA was set to 32 °C. The mean impedance of the MEA electrodes was 1.0 MΩ (NanoZ v 1.2, MCS, Reutlingen, Germany). Either the subretinal stim was applied with an MEA and the GC activity was recorded via Ca2+ imaging, or the stim was applied using a single metal electrode (platinum/iridium microelectrodes, tip ~3 µm, ~7 kOhms, MicroProbes, Gaithersburg, MD, USA), and the GC activity was recorded with an MEA (cf. Figure 1A,B). The external stim microelectrode was positioned under the microscope (20 X) using a micromanipulator (5171, Eppendorf, Hamburg, Germany). Ca2+ imaging recordings were carried out using an upright fluorescence microscope (BX50WI, Olympus, Germany) equipped with a 20 X water immersion objective (LUMPlan FL, 40X/0.80W, ∞/0, Olympus, Hamburg, Germany), a polychromator (VisiChrome, Visitron Systems, Puchheim, Germany), and a CCD camera (RETIGA-R1, 1360 × 1024 pixels, 16 bit). Image stacks of the OGB-1 fluorescence were acquired at 50 Hz (470 nm excitation; Olympus U-MNU filter set, 20 ms exposure time, 8-pixel binning) using VisiView software (V 3.1, Visitron Systems, Puchheim, Germany). For each experiment, an image of the electrodes (MEA and single microelectrode) and the retina was taken to correlate with the spatial distance of the stimulating electrode and responsive GCs. GC spike activity was recorded via the MEA system at 20 kHz raw data sampling. Ca2+ imaging and MEA recordings were both synchronized with the stim using a trigger, which was controlled by the recording protocol set within the MC_Rack software (v 4.6.2, MCS, Reutlingen, Germany) and the digital input–output box (MCS, Reutlingen, Germany). For each experiment (Ca2+ imaging or MEA), 20 s of control was recorded before stim; then, the application of the stim (+trigger detection) and 20 s of the post-stim period were recorded. When applying stim with an MEA, MEA_select (MCS, Reutlingen, Germany) was used to define the stim and reference electrodes (Figure 1C). The stim protocols were generated with an STG2008 device (MCS, Reutlingen, Germany) using MC Stimulus II software (v 3.4.4, MCS, Reutlingen, Germany). Stim protocols were defined as follows: (a) To find the best-performing stim paradigm, four stim paradigms were designed (cathodicremote, cathodicnear, anodicremote, and anodicnear; cf. Figure 1D,E) by modulating three parameters: (i) the polarity of the biphasic stim pulses (cathodic-first or anodic-first); (ii) the reference electrode configuration, either a single remote reference electrode (using an internal reference electrode of the MEA) or multiple reference electrodes close to the stim electrodes (MEA electrodes used as references) (cf. Figure 1E); and (iii) a voltage ramp grouped in voltage blocks of 0.5, 1.0, 1.5, 2.0, and 2.5 V of biphasic pulses (1 ms/phase). Within each voltage block, only the cathodic phase varied in −0.2 V subvoltage steps, while the anodic phase remained constant. In total, 54 subvoltages (cf. Figure 1D) were applied at 0.05 Hz (20 s interval). Only Ca2+ imaging was applied to record the GC activity for these experiments. (b) To investigate the role of Ca2+ in GC response outage, we applied a sustained 90 s stim at various frequencies (0.5, 1.5, 3, 5, 10, 20, and 50 Hz), using the stim parameters (cathodicnear and −1.6/+1.5 V) established in (a). Here, both Ca2+ imaging and MEA were used to record GC activity.

2.4. Data Analysis

2.4.1. Ca2+ Imaging

Regions of interest were set manually on GCs in the proximity of the stim electrodes, and the corresponding Ca2+ traces were extracted using ImageJ software (version 1.53n, https://imagej.nih.gov/ij/ (accessed on 7 September 2021). The Ca2+ δ-amplitudes were obtained by calculating the difference between the Ca2+ signal baseline (averaged from the pre-stim phase) and the stim-evoked Ca2+ amplitude (identified by the stim trigger mark). The signal decay (τ) was calculated to estimate the refractory time of the GC’s Ca2+ response (66% signal drop in seconds). The Ca2+ data were normalized against the highest occurring Ca2+ value in the respective dataset. Further data analysis and the production of plots were carried out using custom-developed scripts (MATLAB, 2020b, The MathWorks, Natick, MA, USA). For statistical analysis of the drug data, one-way ANOVA followed by Dunnett’s multiple-comparison test was applied, and for the comparison of the frequencies (ctr), the Wilcoxon–Mann–Whitney test was utilized to compare them pairwise with the next higher frequency (MATLAB, The MathWorks, Natick, MA, USA).

2.4.2. MEA Recordings

For spike extraction, a high-pass filter was applied to the raw data (200 Hz, Butterworth 2nd order; MC Rack MCS, Reutlingen, Germany). The filtered files were exported to HDF5 file format with the MC DataManager (v1.14.4.22018, MCS, Reutlingen, Germany) and were read in MATLAB using the McsMatlabDataTools (MCS, Reutlingen, Germany) software bundle. Custom-developed MATLAB scripts were used for further data processing [25]. A static threshold of ±17 µV was set for spike detection, and only bimodal-shaped spikes were selected for the analysis. The stim-evoked spike responses were detected according to the trigger time stamp, and the responses of single cells recorded on each electrode were isolated. The GC spike activity was presented in a histogram (rate: spike count per 50 ms bin). Our study focused on cell-type independent response outage; hence, cell sorting was not used to discriminate between major GC types (ON, OFF, and ON–OFF). The image editing software Inkscape (v1.2.2, www.inkscape.org (accessed on 27 December 2022) was used to compile the presented figures.

2.5. Pharmacology

Pharmaceutical agents were directly injected into the MEA chamber, and the retina was incubated for 30 min before recording. We used (in µM) 100 L-AP4 (mGluR6 agonist; L-2-amino-4-phosphonobutyric acid), 20 CNQX (AMPA/kainite-type GluR antagonist; 6-Cyano-7-nitroquinoxaline-2,3-dione) obtained from TocrisBioScience (Bristol, UK); 100 verapamil (L-type voltage-gated Ca2+ channel (VGCC) blocker) obtained from Sigma-Aldrich (Darmstadt, Germany); and 30 TTX (sodium channel blocker; tetrodotoxin) obtained from Carl Roth (Karlsruhe, Germany).

3. Results

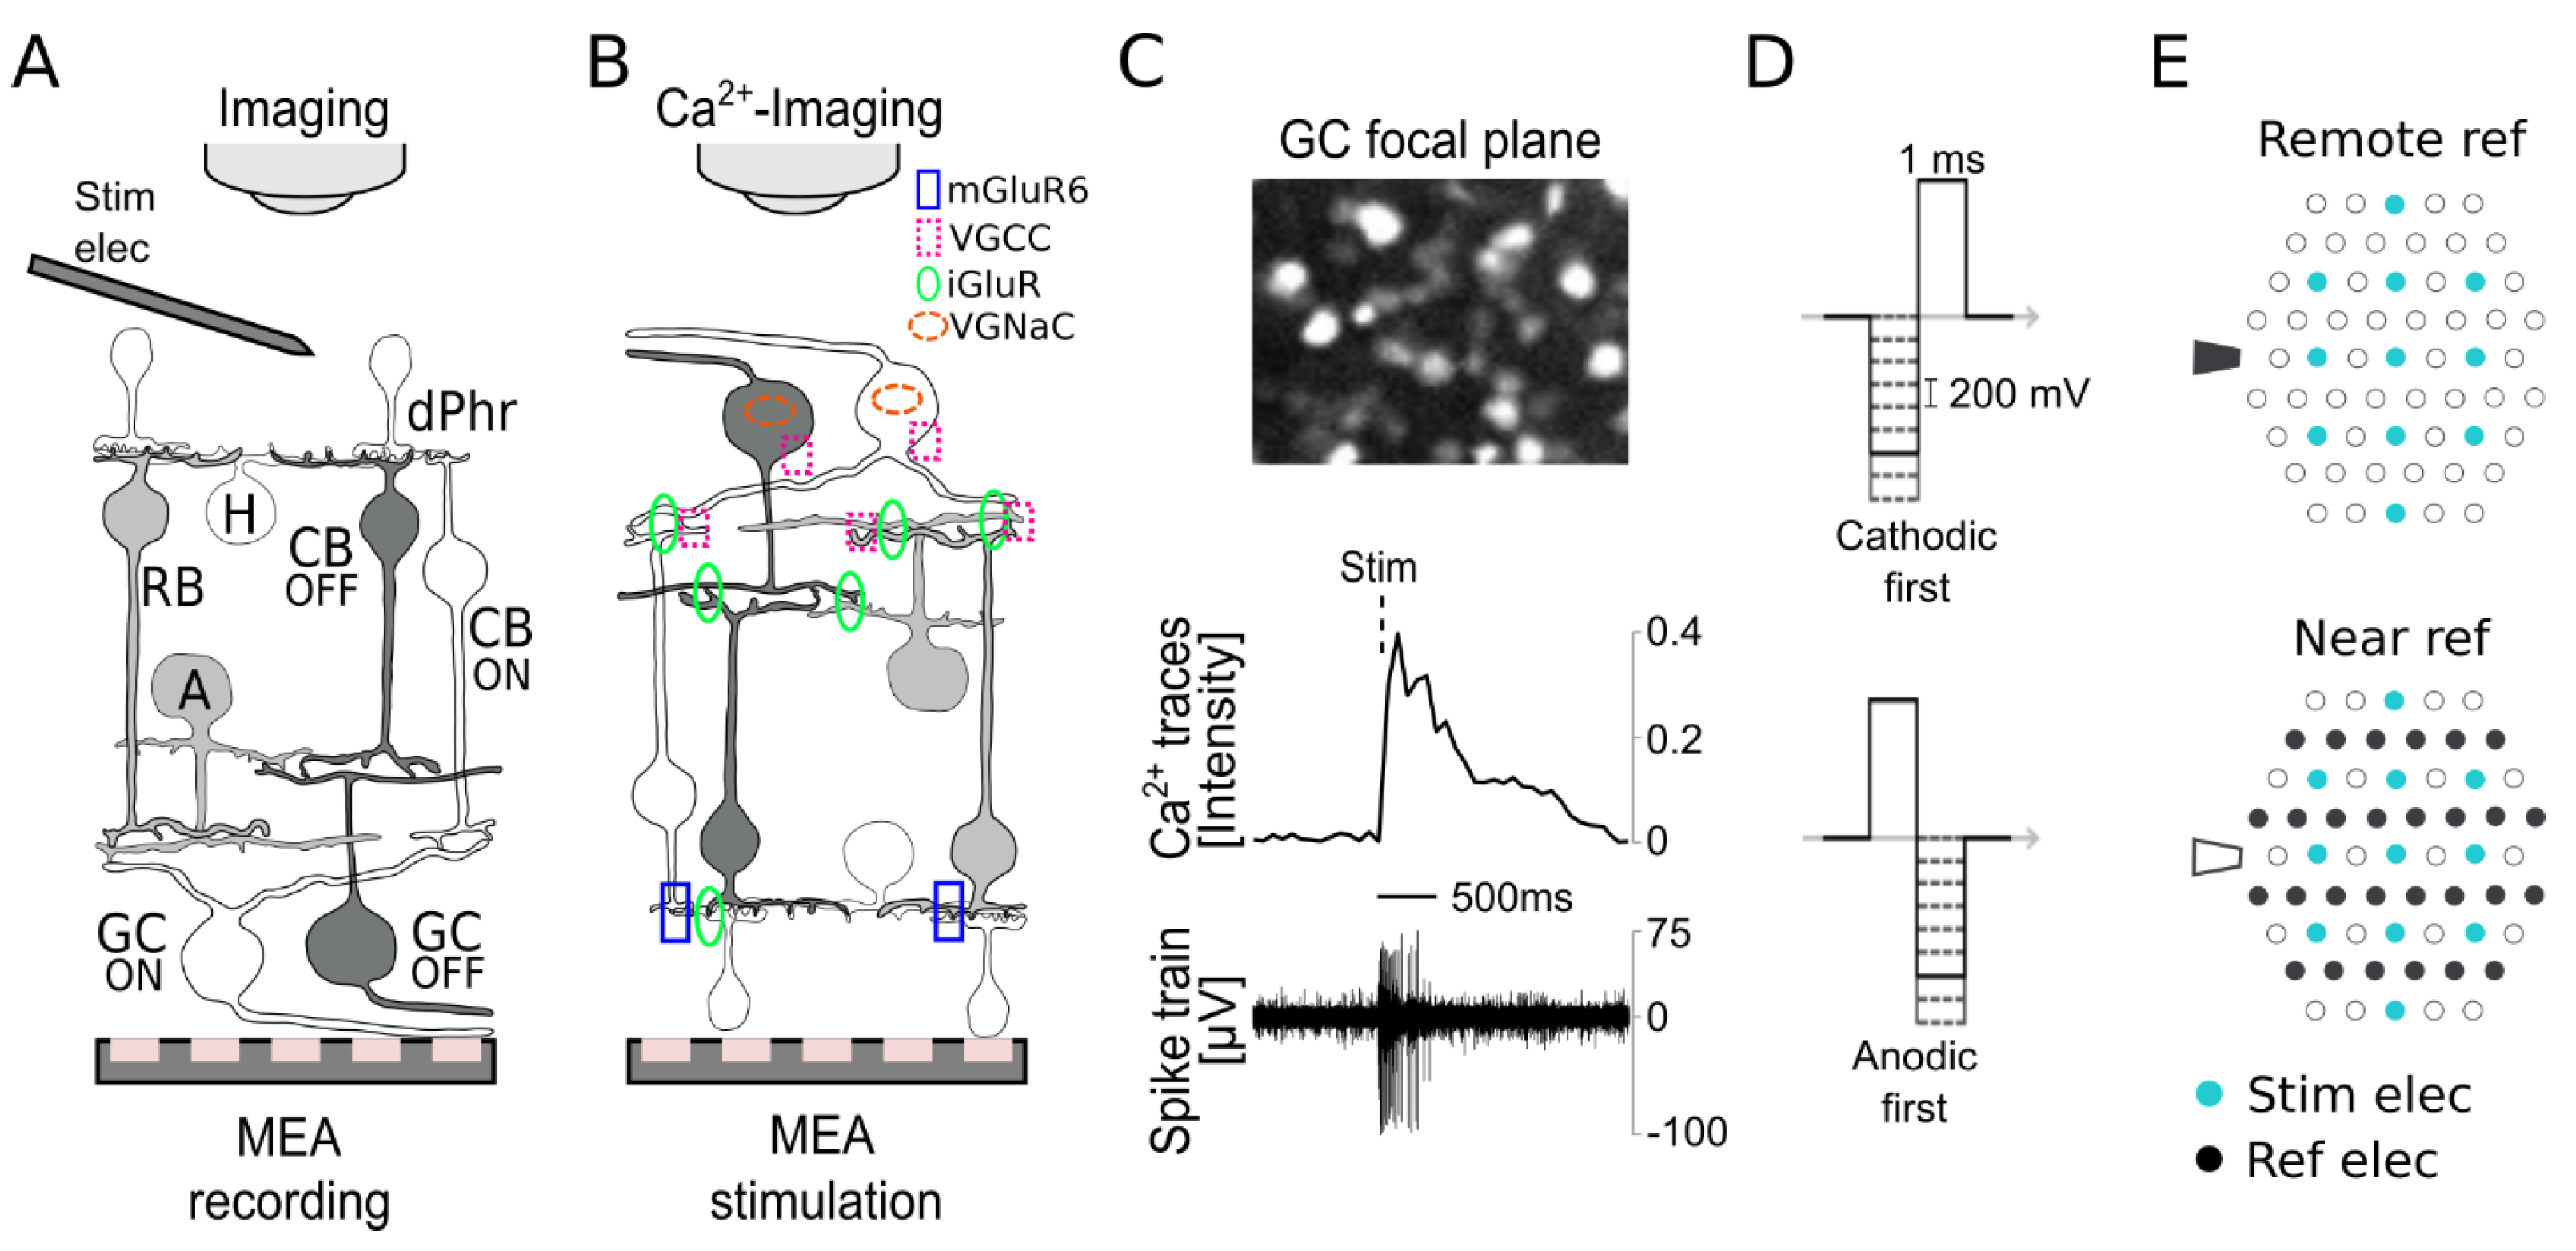
3.1. Subretinal Electrical Stimulation and Ca2+ Imaging of Ganglion Cell Responses

To investigate the role of Ca2+ in the response outage of retinal GCs, we established a novel experimental method combining subretinal stim using MEAs (Figure 1B) with the simultaneous recording of GC activity using Ca2+ imaging. Therefore, we adapted the retinal bulk electroporation of the OGB-1 Ca2+ indicator principally used for two-photon Ca2+ imaging [31,32]. However, in our approach, we electroporated the GCs of the photoreceptor-degenerated retina (rd1 mouse) with OGB-1 and recorded (brightfield confocal imaging) the GC Ca2+ responses elicited by stim. On the one hand, this method allowed us to assess the stim-dependent GC activity with high spatial resolution at the cellular level (Figure 1C); on the other hand, the spatial projection of the stim electrodes (focus through the retina) on the GC focal-plane image enabled us to correlate the stim electrode and the responding cell.
Moreover, the stimulus-dependent correlation of the GC spike recording (elicited with a single metal electrode and MEA recordings, Figure 1A) with Ca2+ signals showed that the spikes occurred during the increase in the Ca2+ transient (Figure 1C) and were absent during the significantly longer signal recovery phase, which is crucial for the generation of subsequent responses. Furthermore, in conjunction with retina-specific pharmaceuticals, the methods complemented each other as a powerful tool for our retinal function investigation (Figure 1B).

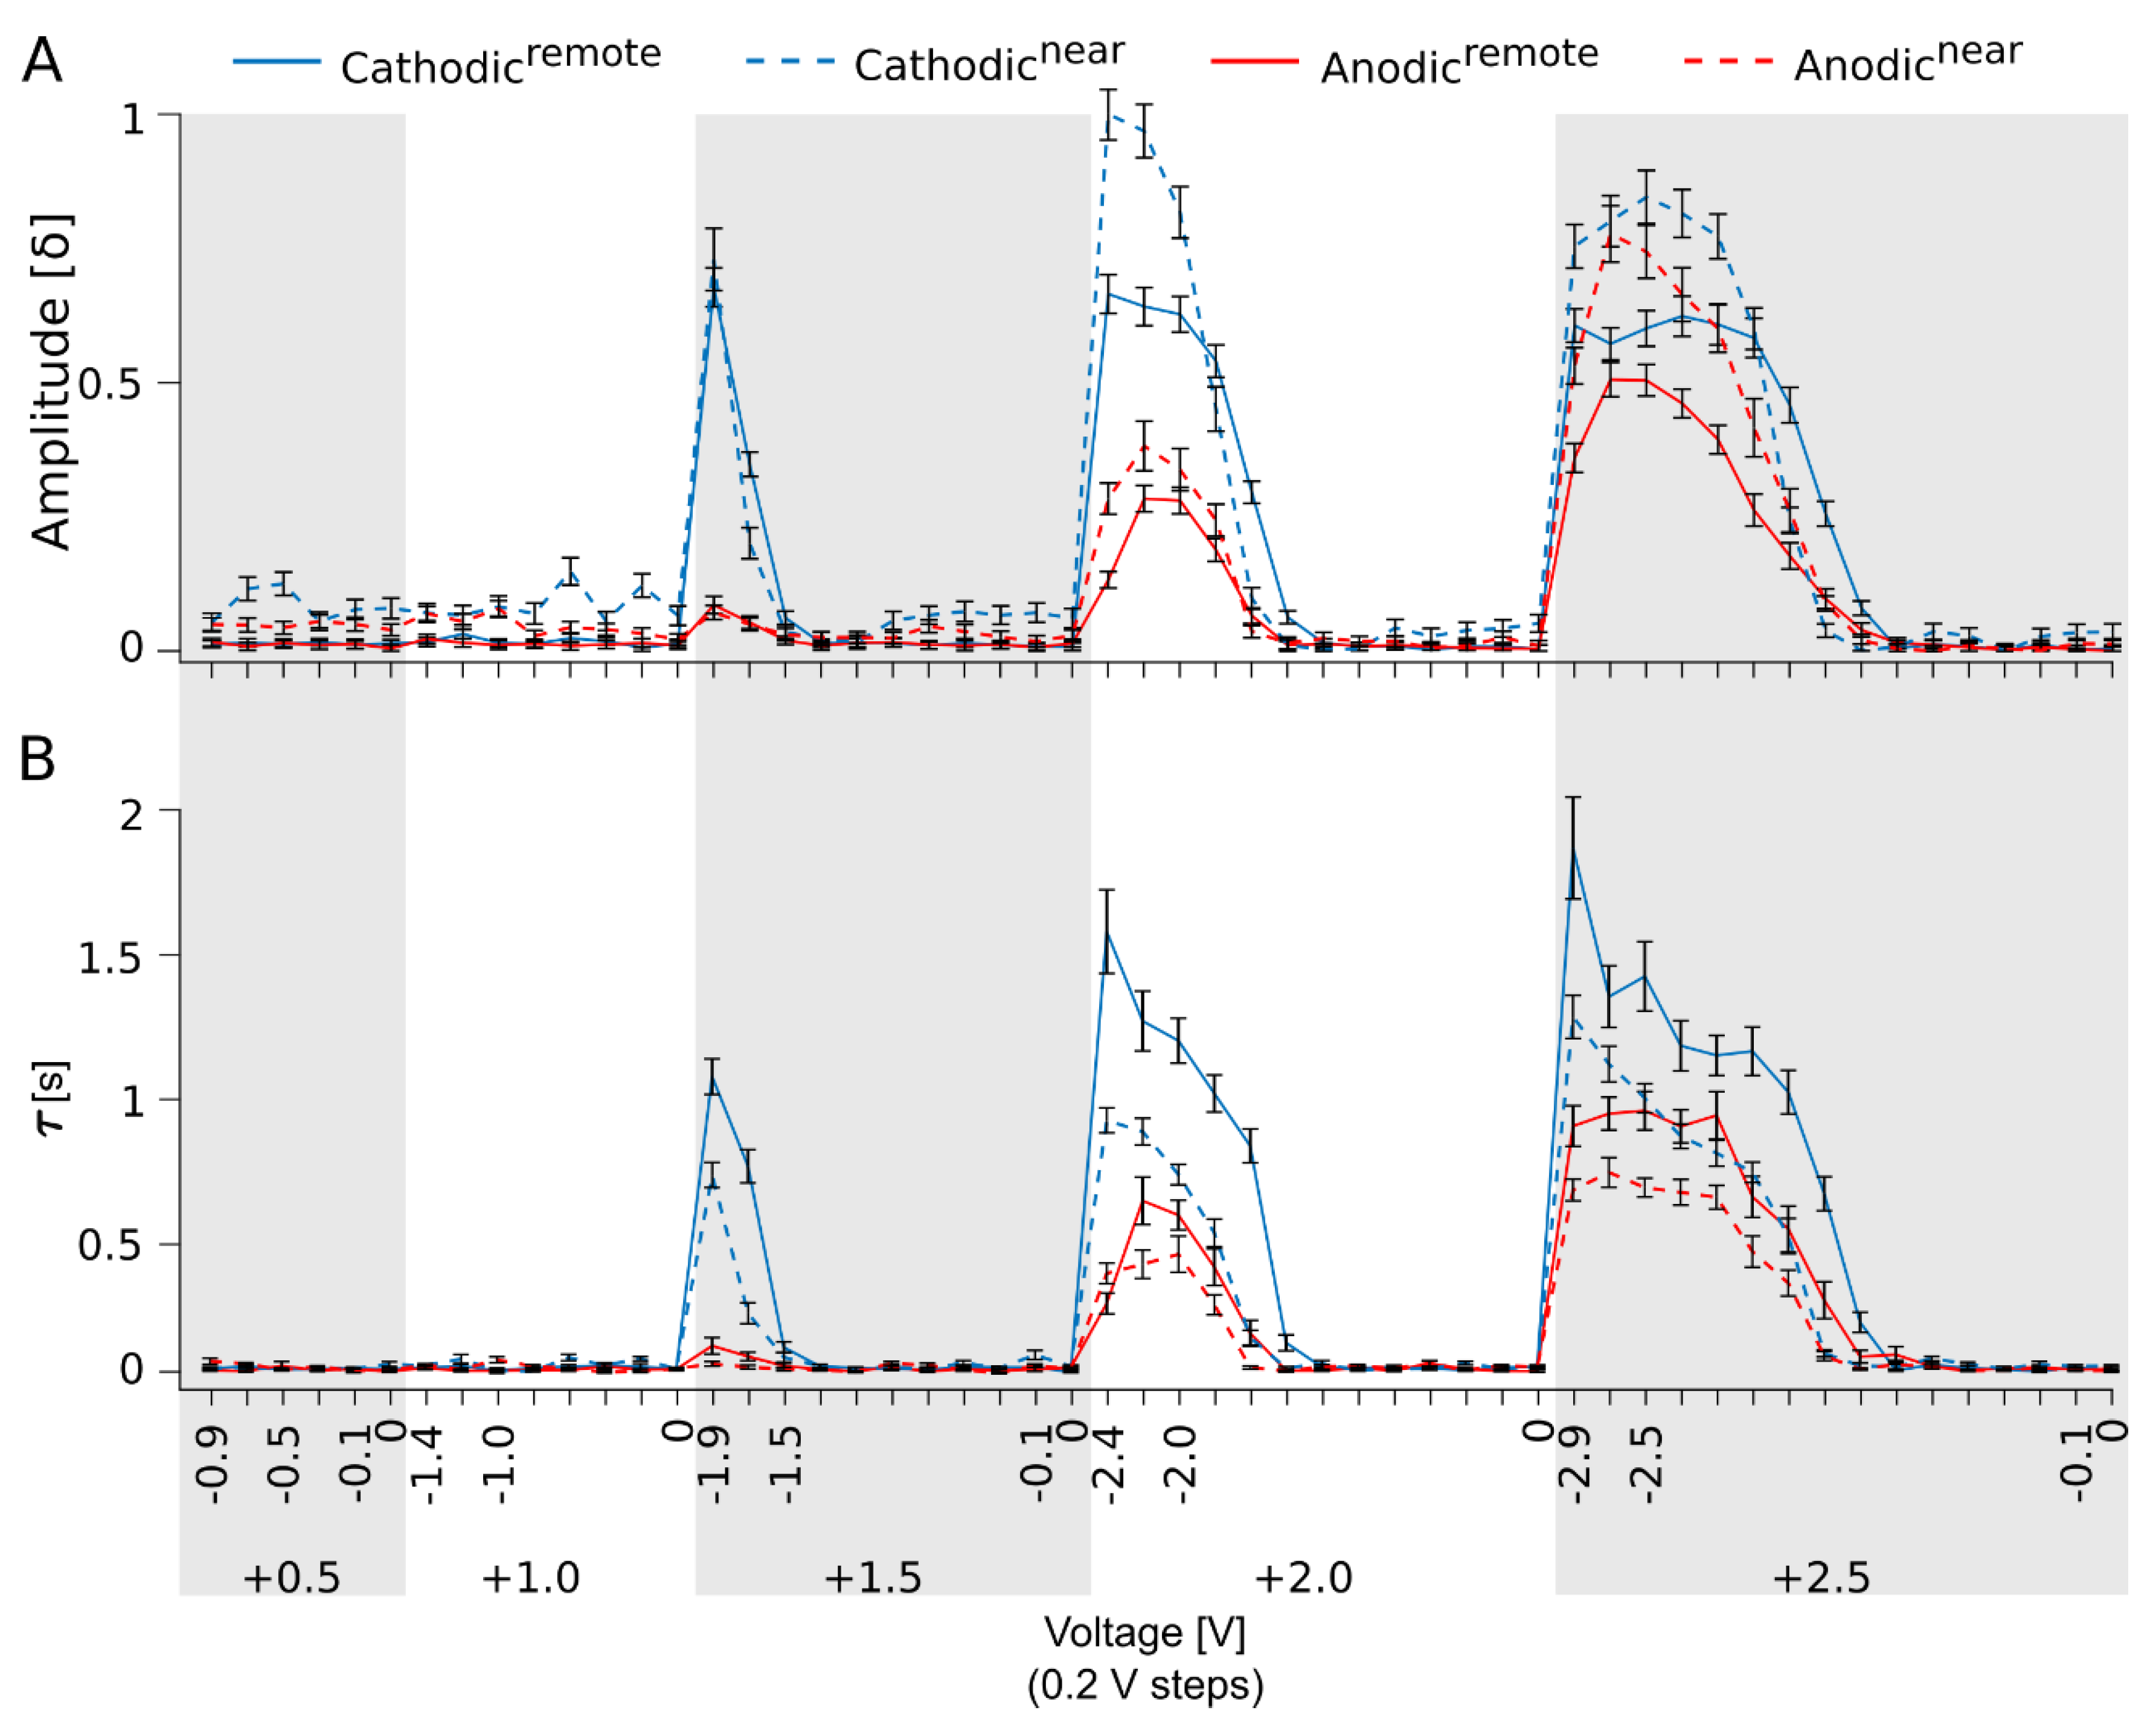
3.2. Variation in the Electrical Stimulation Paradigm Modulates the Strength of the Ganglion Cell Ca2+ Responses

To achieve our primary goal of investigating the dependence of the GC response outage on high-frequency stim, we first systematically evaluated the best-performing stim paradigm for Ca2+ imaging. We designed four different stim paradigms (Figure 2: cathodicremote, cathodicnear, anodicremote, and anodicnear) by modulating three parameters: (i) the phase of the biphasic pulse: cathodic- or anodic-first (see also Figure 1D, 1 ms/phase); (ii) the voltage modulation of the biphasic pulse (see also Figure 1D for pulse profile), through which the anodic (positive) phase was kept static, defining the five voltage blocks (+0.5, +1.0, +1.5, +2.0, and +2.5 V), and only the cathodic (negative) phase was modulated in −0.2 V steps; and (iii) the reference electrode configuration: remote or near (Figure 1E). These experiments were carried out at a low stim frequency (0.05 Hz) to determine the stim-dependent Ca2+ dynamics in the GCs of the blind rd1 mouse.
In total, 54 subvoltage steps were applied. Remarkably, the GC did not respond to each subvoltage step (Figure 2A). To stay in the context of the project’s scope, we evaluate and discuss only the most significant response events relevant to frequency modulation experiments.
The evaluation of GC Ca2+ responses’ δ-amplitude (Figure 2A) determined that, overall, the cathodic-first (voltage polarity: −/+) stim paradigm performed better in subretinal stim than the anodic-first (voltage polarity: +/−) stim category. The first visible responses at lower voltage blocks were induced by cathodic-first stim (δ-amplitude: at −0.5/+0.5 V = 0.13 ± 0.02 and at −0.6/+1.0 V = 0.15 ± 0.03). With an increase in stim strength, larger cathodic-first than anodic-first response amplitudes were observed (−1.9/+1.5 V = 0.73 ± 0.06, 10.43-fold larger than +1.5/−1.9 V, and −2.4/+2.0 V = 1.0 ± 0.05, 3.57-fold larger than +2.0/−2.4 V). At the highest applied voltage, response saturation, rather than an increase in amplitude, was observed. Moreover, a minor difference between anodic-first and cathodic-first stim was found (−2.5/+2.3 V = 0.81 ± 0.04; 1.22-fold larger than +2.3/−2.5 V). The gain in responses to anodic-first stim at these high voltages indicates a direct activation of GCs via voltage-gated channels (VGCs), rather than network-mediated activation (as seen in the previous lower stim). Additionally, the distance of the stim electrode to the reference was relevant; in the context of subclasses, cathodicnear performed overall up to 1.5-fold better than cathodicremote, and anodicnear performed better than anodicremote (1.3-fold).
We extended our investigation to evaluate the Ca2+ signal’s decay time τ (66% signal drop in seconds), which indicates the cell’s recovery time. This parameter is crucial when investigating higher stim frequencies regarding the overlap of following stim responses. The τ value of anodic-first responses was naturally smaller than the cathodic-first because the generated Ca2+ amplitudes were also smaller. However, in the same category of cathodic-first stim, the cathodicnear constellation performed better than cathodicremote (1.46- to 1.85-fold smaller). Overall, cathodic-first, particularly cathodicnear, performed best in subretinal stim compared with others, generating the largest Ca2+ amplitudes with much faster τ.
Based on the given data, as an optimal stim pulse for further investigation of the frequency domain, a cathodic-first pulse (−1.6/+1.5 V, cathodicnear) was selected: optimal amplitude with relatively low decay time (−1.7/+1.5 V: delta peak = 0.26 ± 0.03; τ = 0.26 ± 0.04 s).

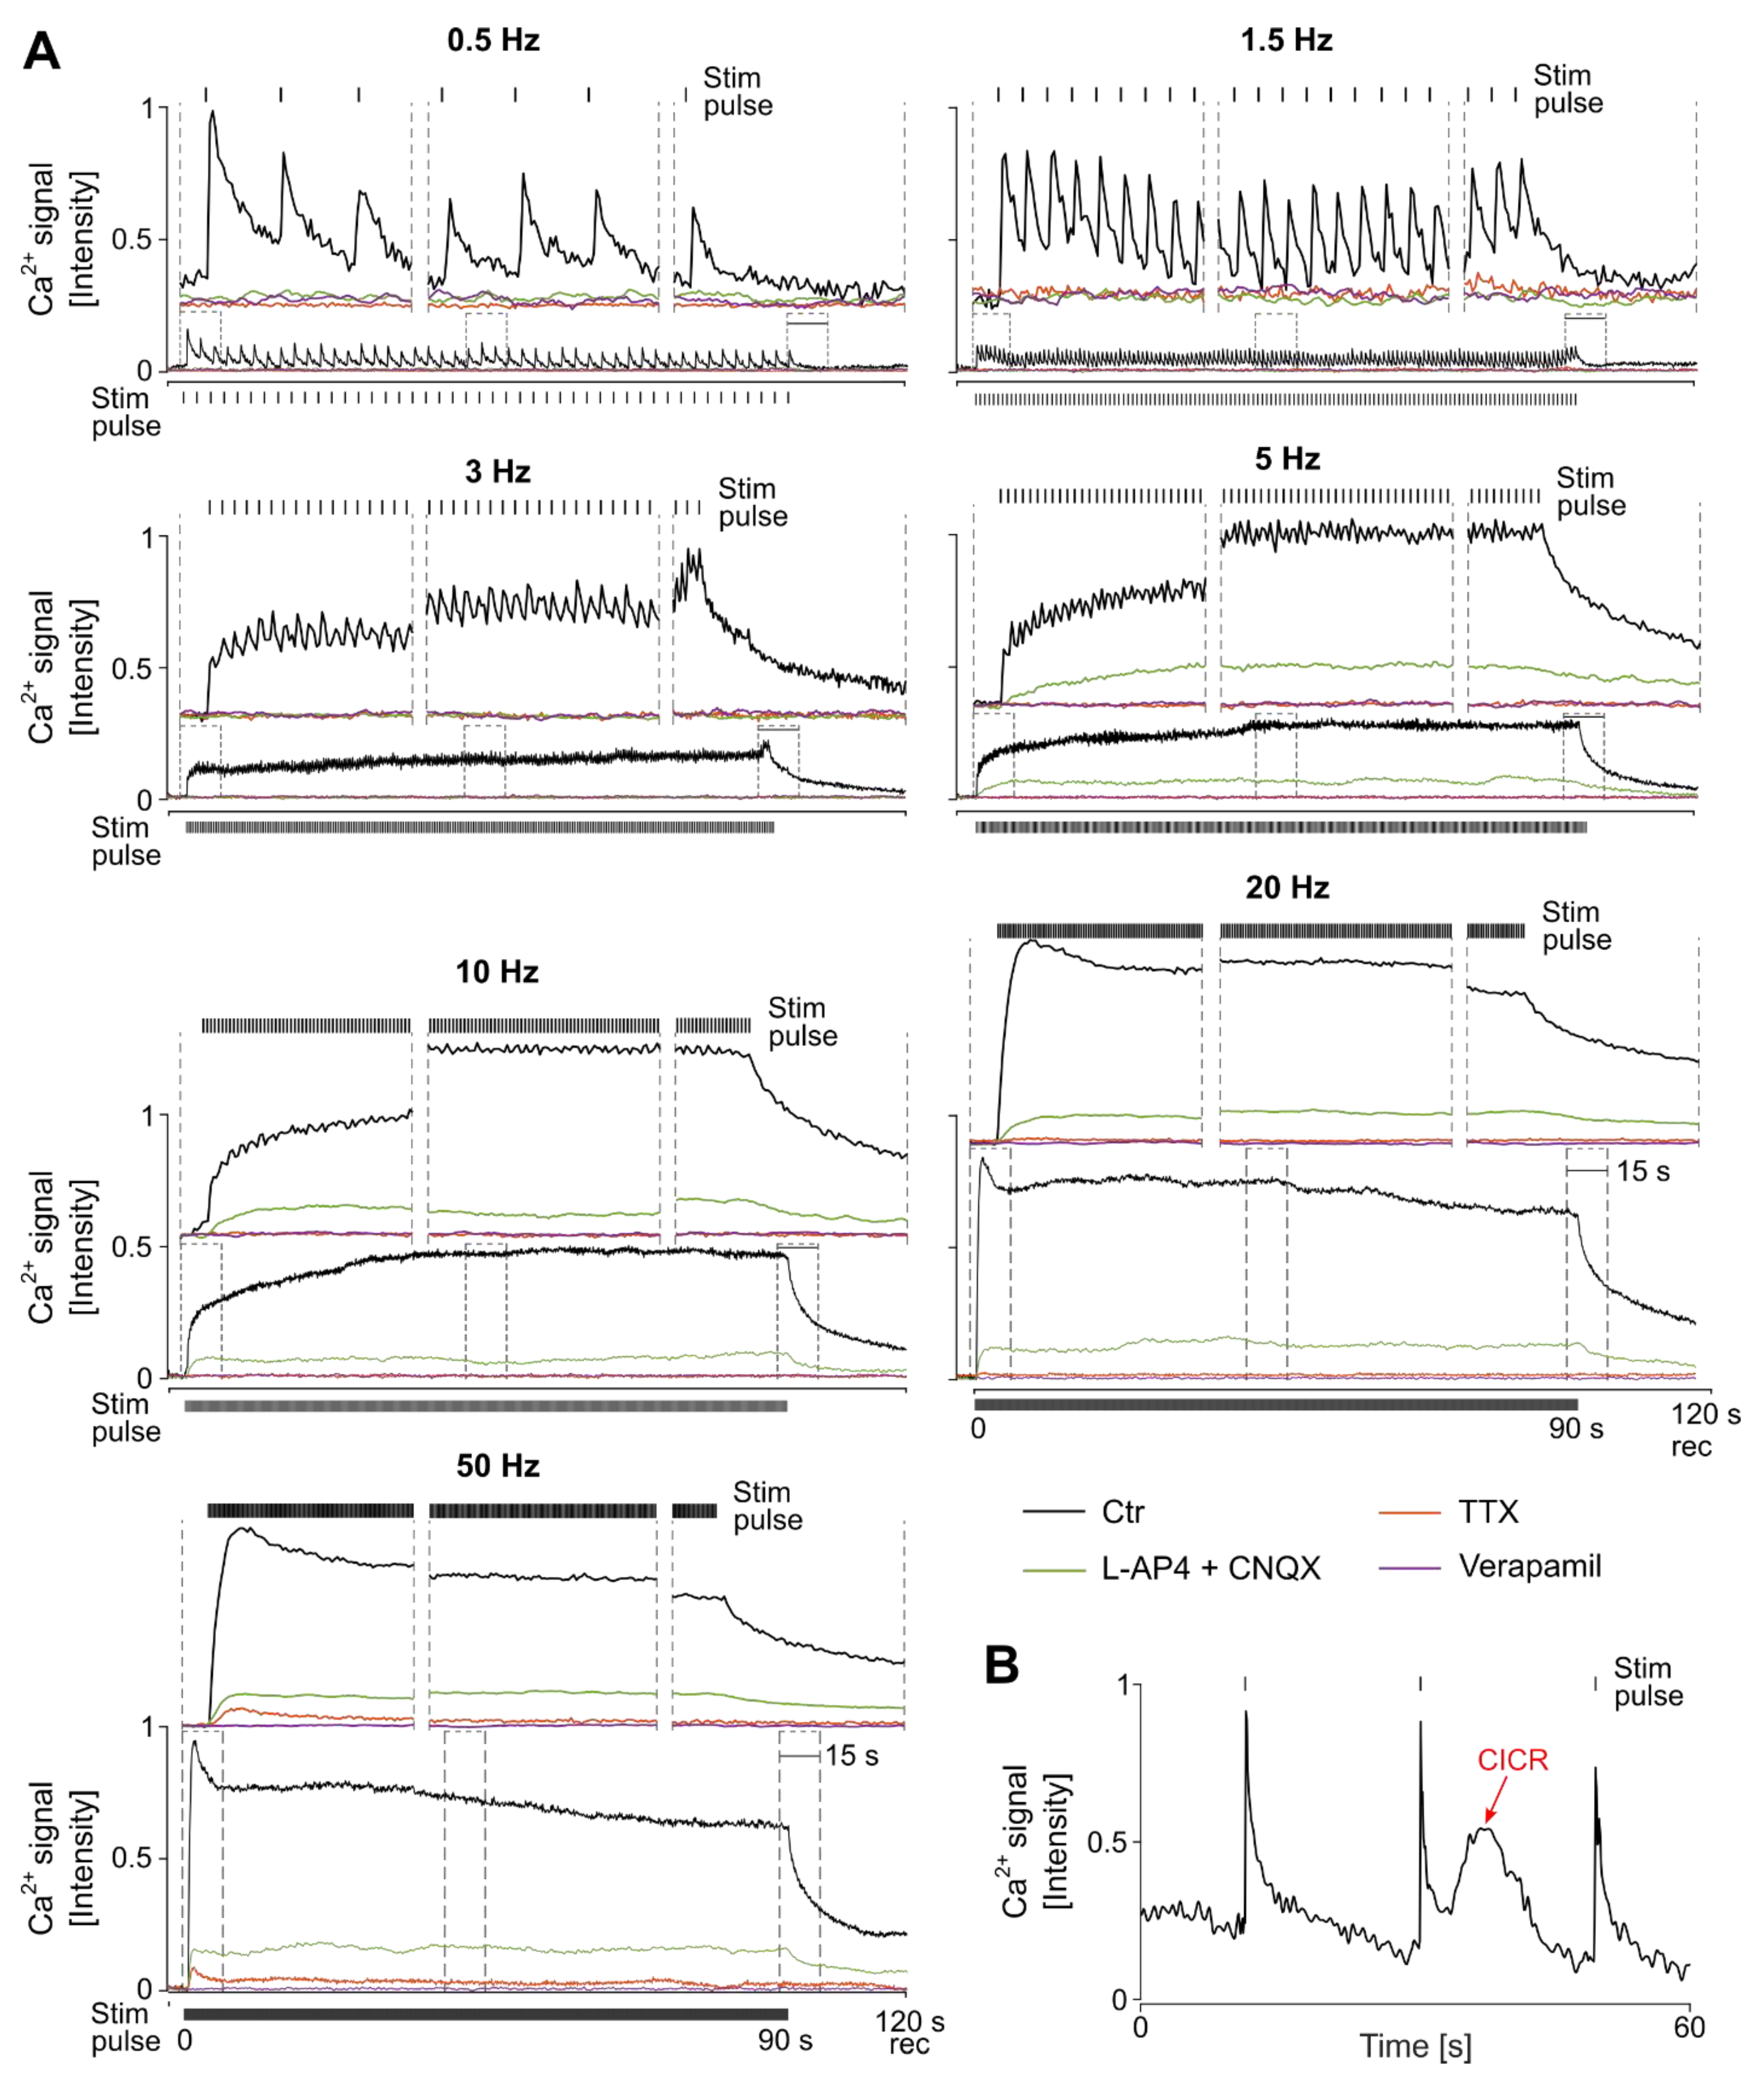
3.3. The Characteristics of Ganglion Cell Ca2+ Responses Are Modulated by Electrical Stimulation Frequencies

Investigating the role of Ca2+ in the dependence of the GC response outage on stim frequency, we subretinally stimulated the retinal tissue for 90 s at various frequencies (0.5, 1.5, 3, 5, 10, 20, and 50 Hz; cathodic-first pulse, −1.6/+1.5 V, cathodicnear).
Lower stim frequencies (0.5 and 1.5 Hz) generated typical Ca2+ signals (Figure 3, ctr recording), with a transient characteristic (Ca2+ influx) correlating temporally with the applied stim pulse and the following recovery (Ca2+ efflux). While at 0.5 Hz, the Ca2+ signals were clearly separated (2 s interval) at 1.5 Hz (0.7 s interval), the following Ca2+ signal continued to the end of the recovery phase of its previous signal.
Upon higher stim frequencies (>1.5 Hz), the Ca2+ response amplitudes became smaller and eventually started to diminish. Hence, for a better evaluation and understanding, we discriminated between the responses’ initial, middle, and recovery phases (Figure 3, inset of 15 s). Within the initial phase at higher frequencies (3, 5, 10, 20, and 50 Hz), the GCs responded to the very first pulses with a transient Ca2+ signal (pulse interval: 333, 200, 100, 50, and 20 ms), and Ca2+ responses increased with the increase in stim frequency (values for first peak to respective frequencies: 0.15 ± 0.03, 0.11 ± 0.02, 0.14 ± 0.01, 0.18 ± 0.01, 0.24 ± 0.02, 0.88 ± 0.13, and 1.0 ± 0.02). With progressing stim, in the middle phase at 3 and 5 Hz stim, the observed Ca2+ transients correlated with the stim pulses, but the amplitudes were significantly smaller and “resided” on elevated intracellular Ca2+ levels. These data indicate that Ca2+ responses did not have enough time to recover; hence, the subsequent responses overlapped with the previous ones. The resulting elevated Ca2+ level of the middle phase was approximately aligned with the response amplitude of the very first pulses within the initial phase (3 Hz = 0.02 units smaller and 5 Hz = 0.06 units smaller). At comparatively higher frequencies (10, 20, and 50 Hz), no Ca2+ peaks were observed to be temporally correlated with applied pulses, but again, the intracellular Ca2+ was elevated. The established Ca2+ plateau was level with the initial response (10 Hz = 0.19, 20 = 0.20, and 50 = 0.35 units smaller) and was maintained during the stim period. At all frequencies, the elevated intracellular Ca2+ level recovered immediately post stimulus.
Additionally, it is worth mentioning that stim-evoked Ca2+-induced Ca2+ release (CICR) events were rarely observed (Figure 3B). CICR events were relatively slow and therefore differed significantly in their characteristics from Ca2+ signals mediated through voltage-gated sodium channels (VGNaCs; spikes, rapid, and transient). Hence, Ca2+ traces exhibiting CICRs were identified easily and not considered for stim/amplitude evaluation.
Overall, the stim frequency shaped the cellular Ca2+ transient (intrusion) and its recovery (extrusion). With the increase in stim frequencies, larger Ca2+ response transients were observed, and the GC Ca2+ responses melted, forming a plateau. The intracellular Ca2+ remained clamped at elevated levels during the stim period and recovered immediately after stim.

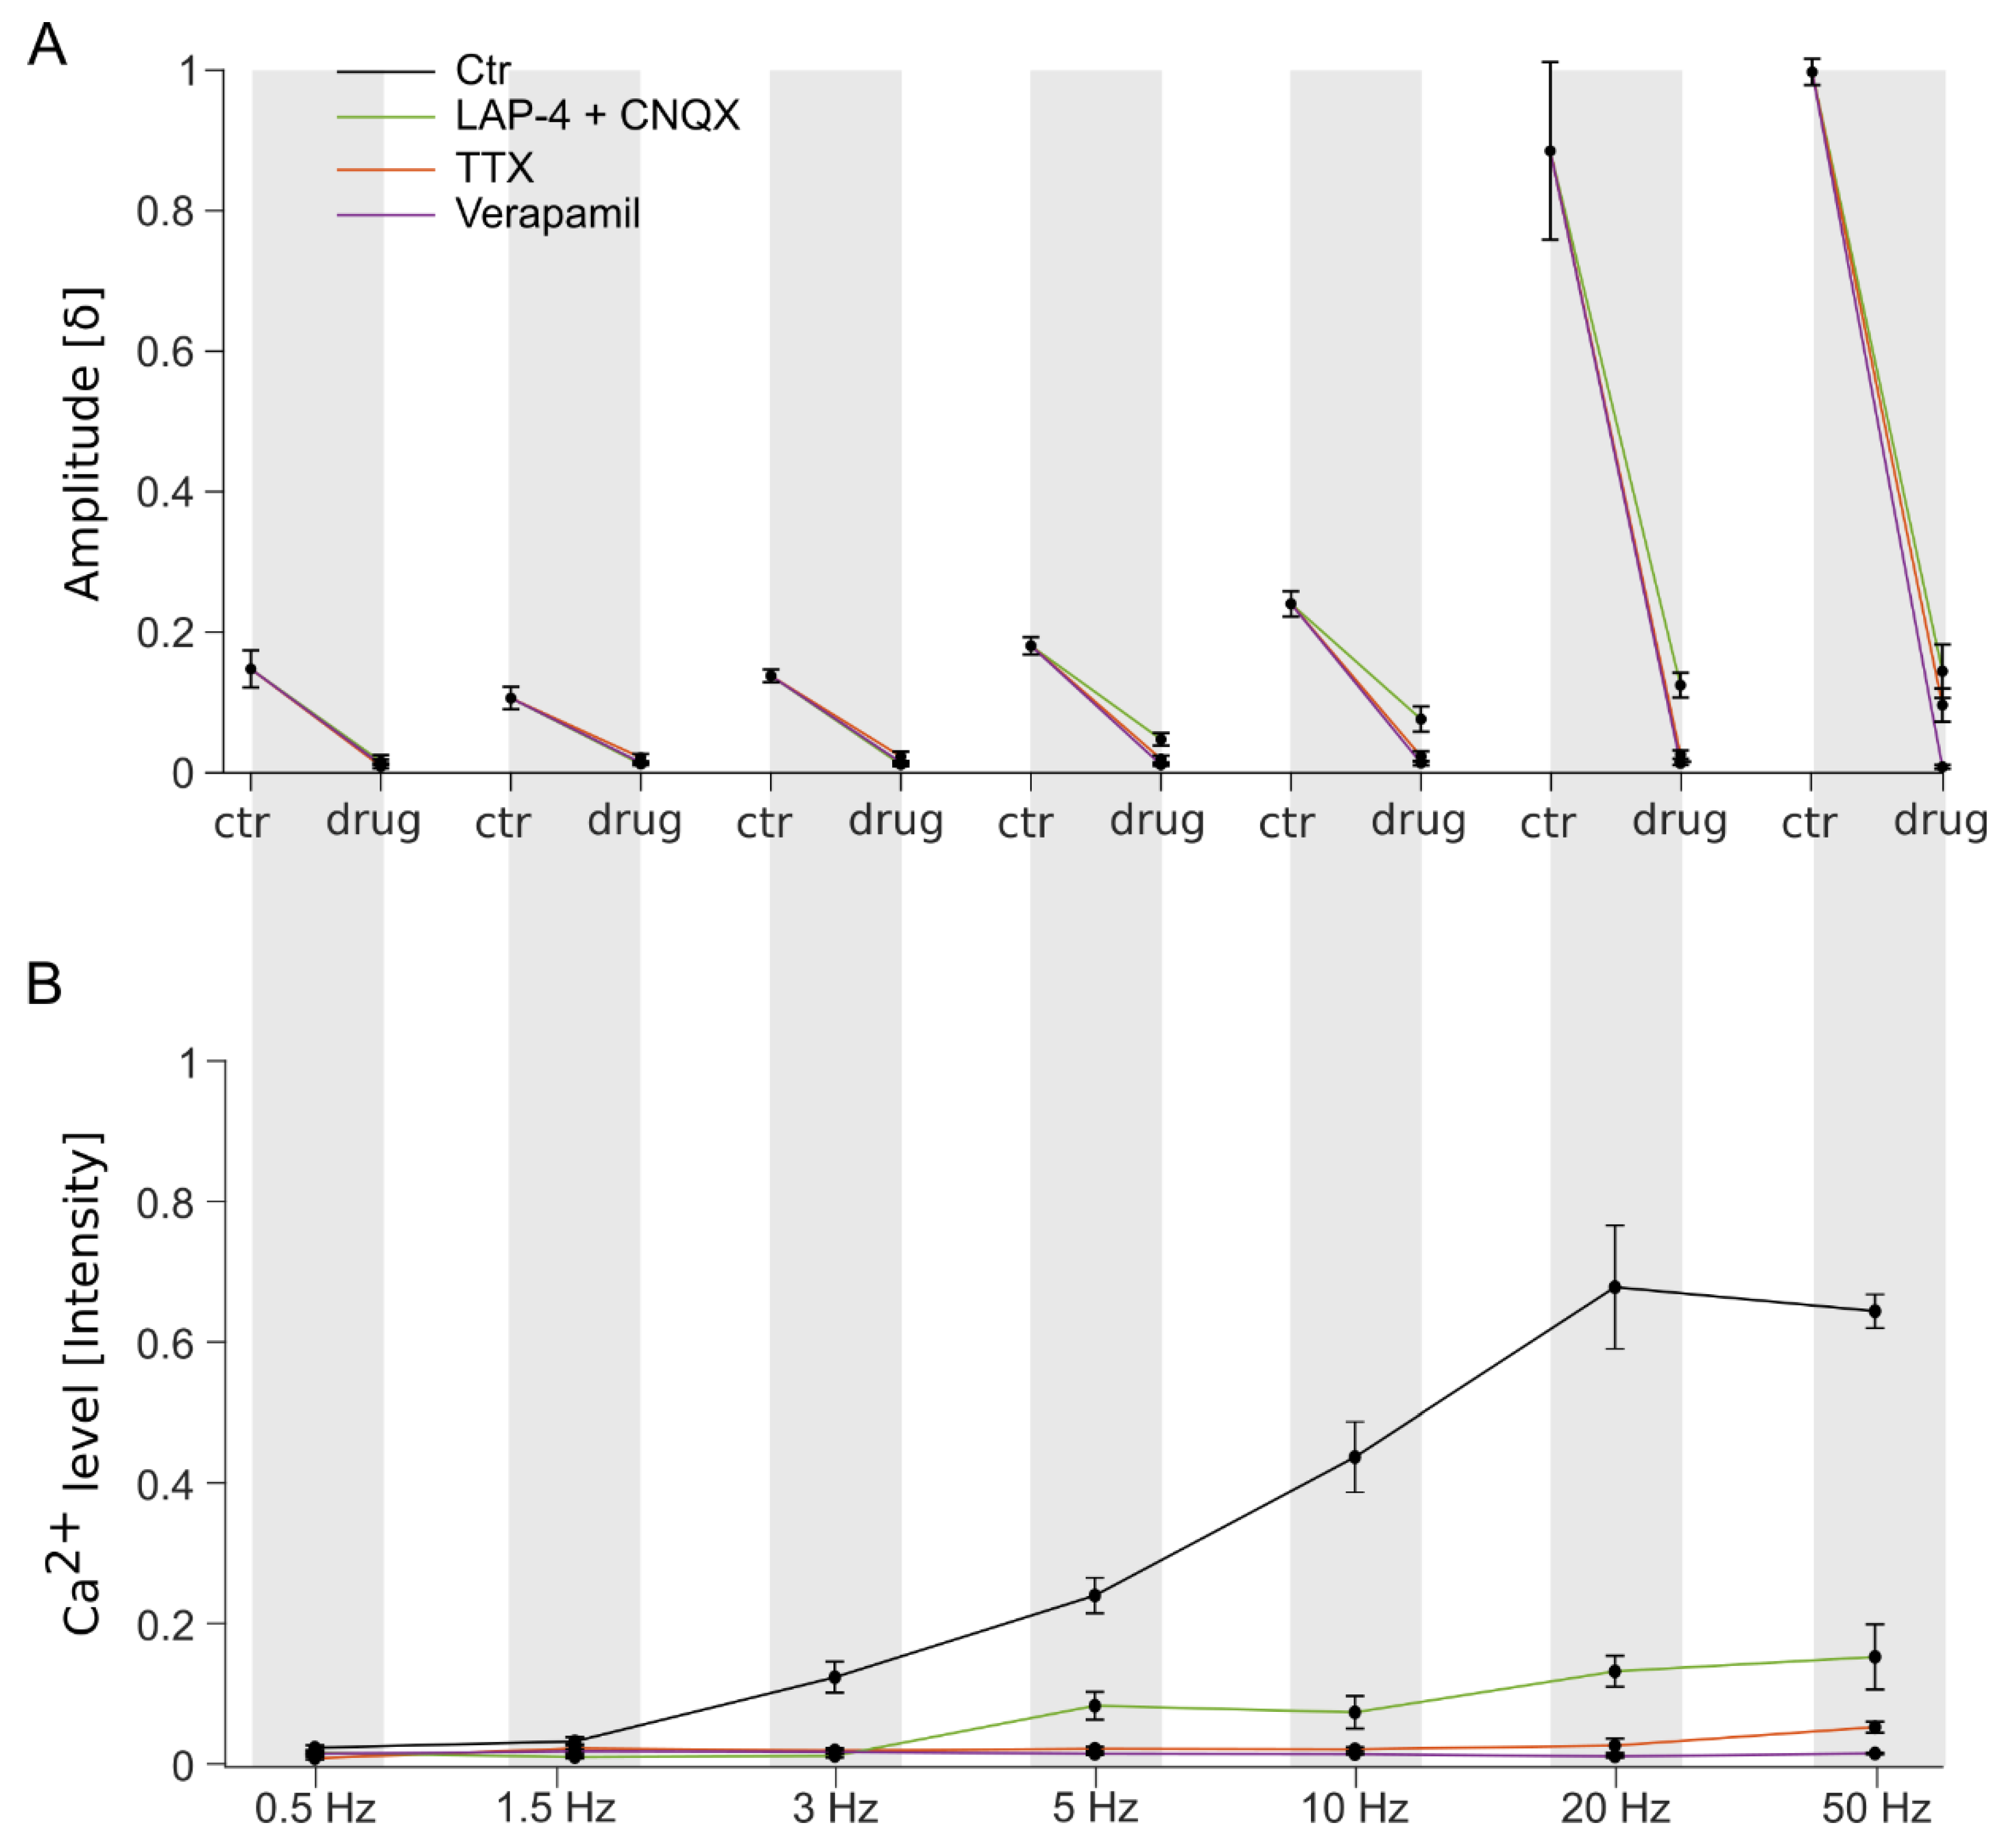
3.4. Stimulation Frequency-Dependent Activation of Ganglion Cells: Network-Mediated or Direct Activation

To assess whether the subretinally applied high stim frequencies (Figure 3) activated the GCs through the retinal network (synaptic) or directly via the GCs’ VGCs, specific pharmaceuticals were utilized (cf. Figure 1B) during Ca2+ imaging recording.
Lower stim frequencies (0.5, 1.5, and 3 Hz) promoted network-mediated responses (dPhr => BC => GC or BC => GC), which were diminished by ~95% in the presence of the glutamate receptor blockers (mGluR6 agonist LAP-4 and iGluR antagonist CNQX; traces shown in Figure 3, quantification shown in Figure 4, and statistics shown in Table S1). Additionally, our assessment was supported by the inhibition of the network’s synaptic transmission (VGCC antagonist verapamil) and the GC responses (VGNaC antagonist TTX), showing no GC activity at all after the respective inhibition (~95% response drop).
GC Ca2+ responses were recorded at higher stim frequencies (5, 10, 20, and 50 Hz) despite the blockage of the glutamatergic synaptic pathway (initial phase: ~ 88% decline; middle phase: ~ 77% decline). In contrast, the antagonization of VGCC and VGNaC silenced the GC responses entirely (average initial and middle phase: 97% decline), suggesting the direct electrical activation of the GCs via VGC.
Overall, higher stim frequencies penetrated the tissue deeper during subretinal stim. Mainly, the GCs were activated synaptically (~88%) and directly (~12%) over the GCs’ VGCCs and VGNaCs.

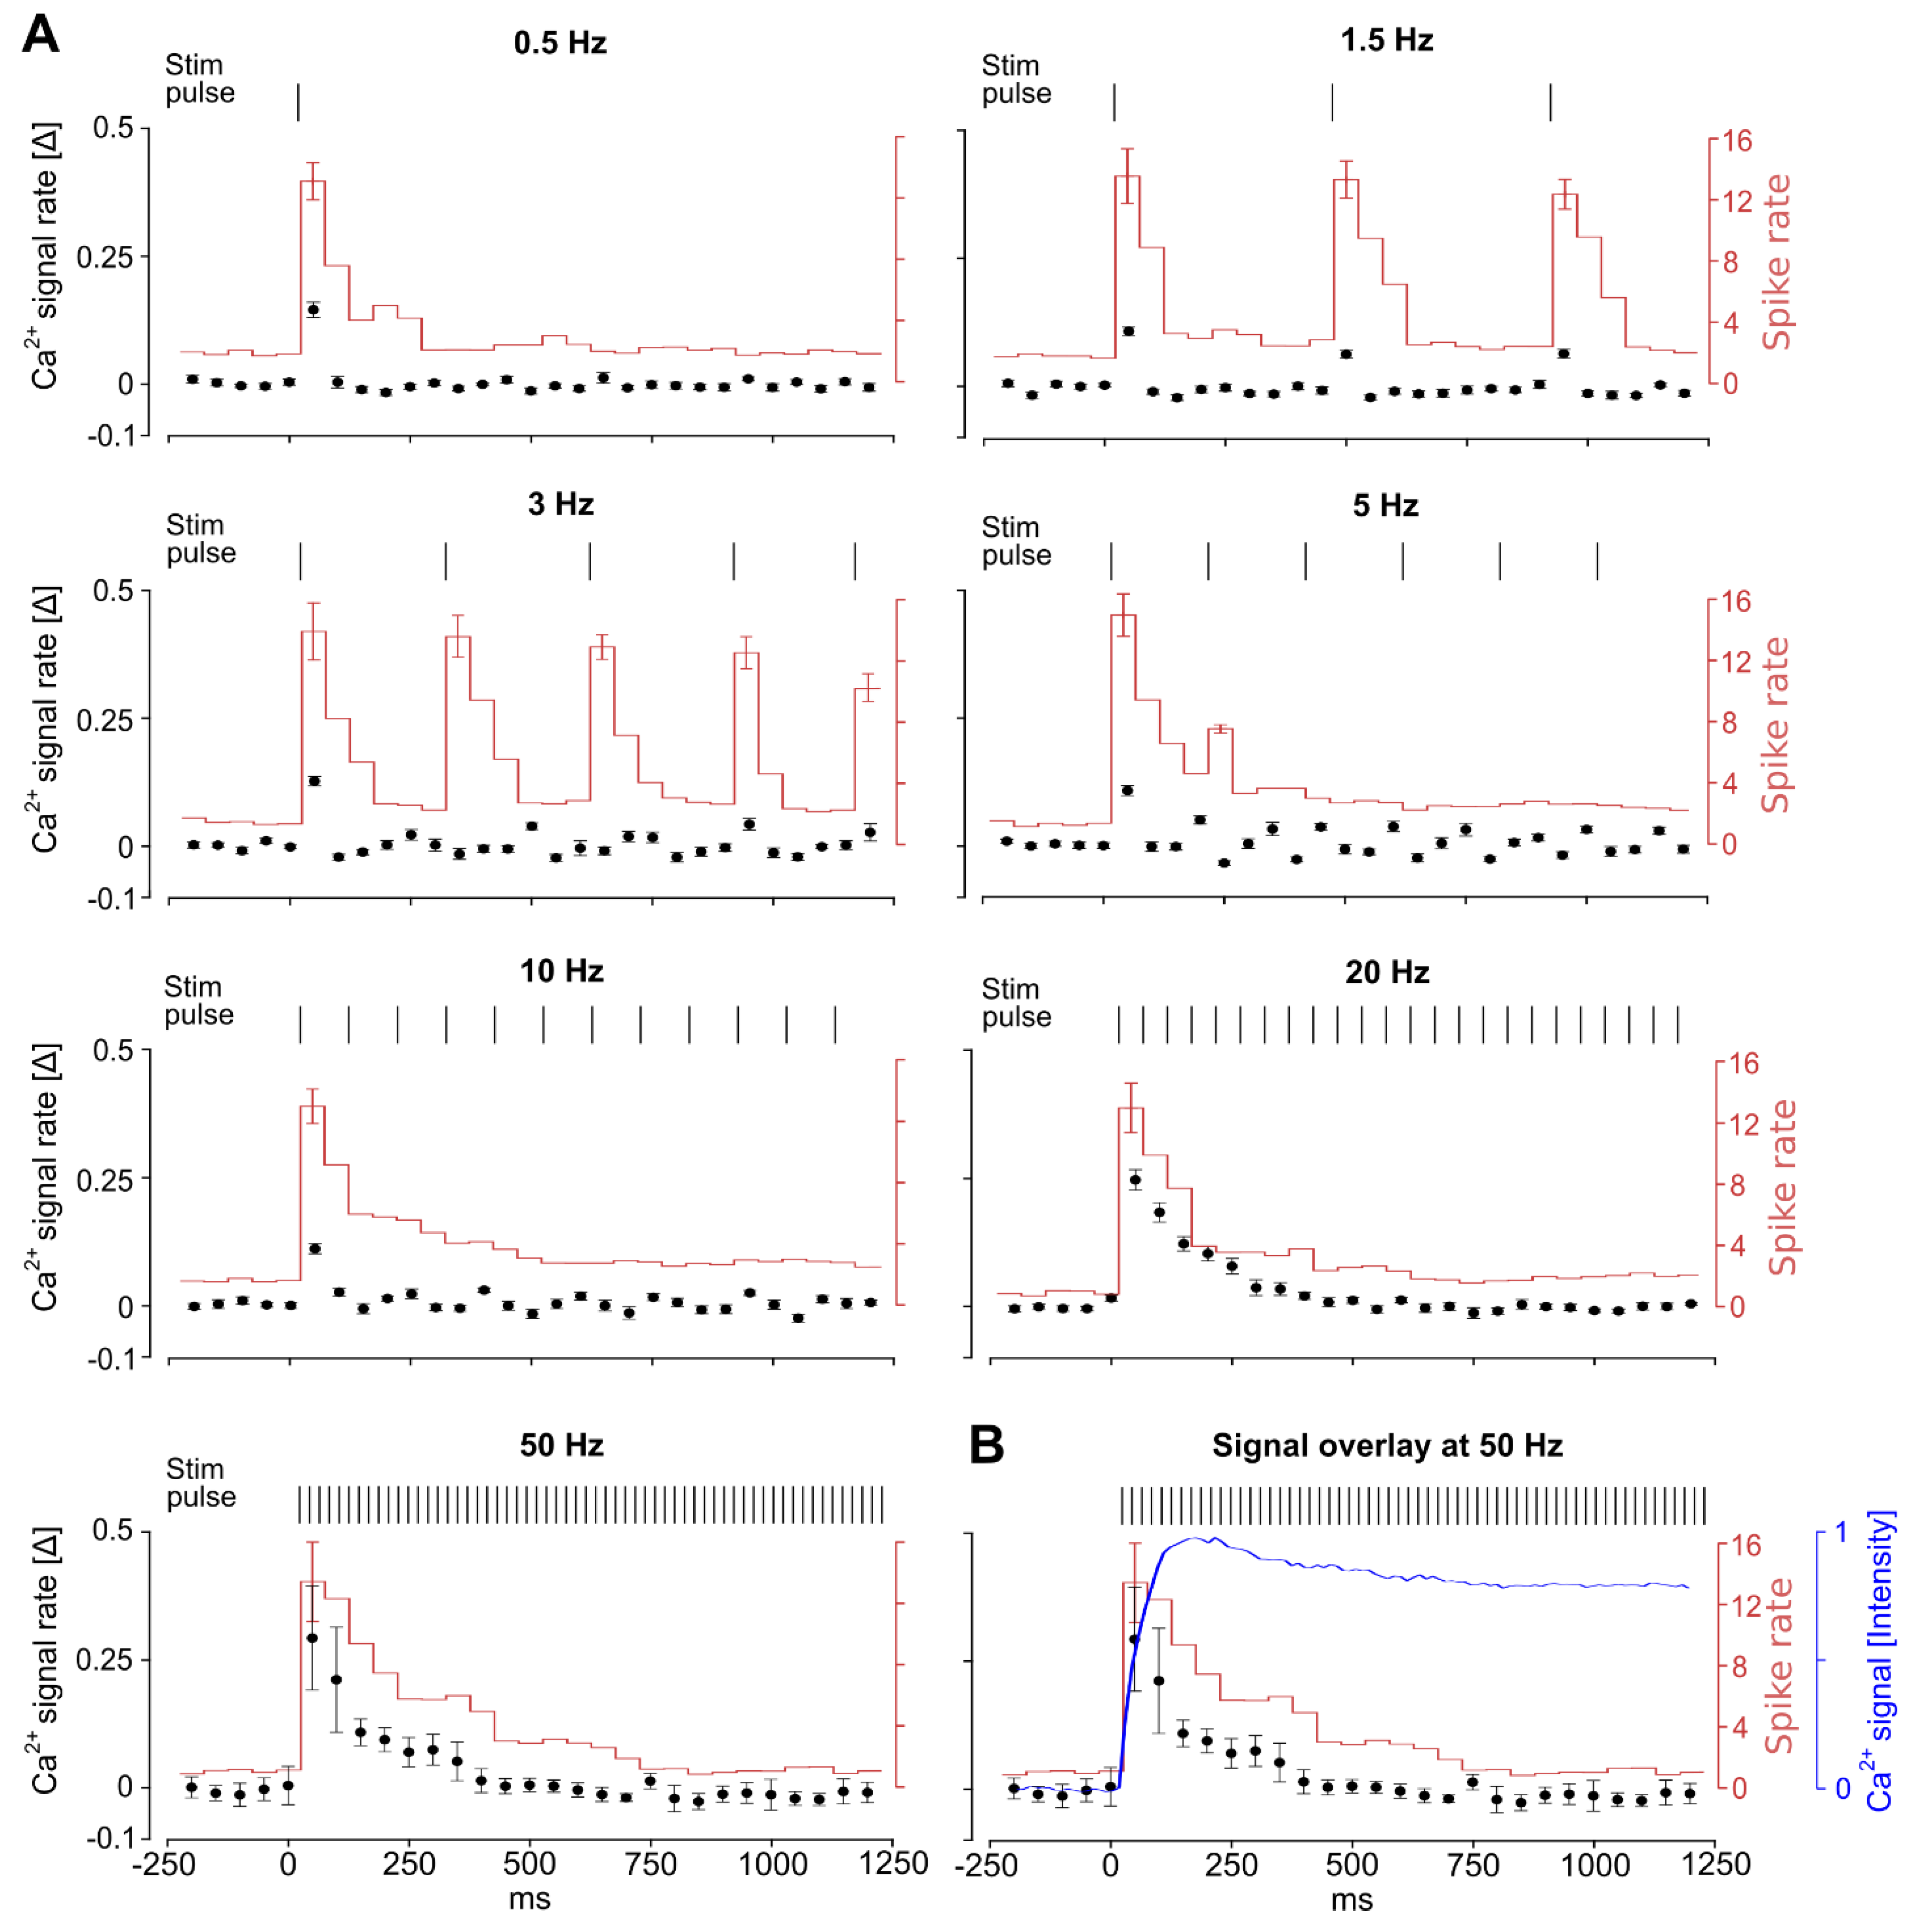
3.5. Continuous High-Frequency Electrical Stimulation Does Not Generate Pulse-Correlated Spikes in Ganglion Cells but Clamps Intracellular Ca2+ at Elevated Levels

To elucidate the full extent of the observed elevated intracellular Ca2+ levels, we correlated GC spike recordings (MEA recordings, Figure 1A) with Ca2+ responses (Ca2+ imaging, Figure 1B) at each respective frequency (Figure 5A). We analyzed the runoff of the GC responses within the initial stim phase (1250 ms), considering the spike rate, which indicates response outage (spike count/50 ms, red line, right axis), and the Ca2+ rate, which indicates stim-induced Ca2+ intrusion (∆-Ca2+/50 ms, with ∆ = [Ca2+]t − [Ca2+]t-1, black dots, left axis). Lower stim frequencies (0.5, 1.5, and 3 Hz) elicited GC spike responses and Ca2+ signals in accordance with the respective stimulus pulse (Ca2+ traces, Figure 3; temporal analysis, Figure 5A). For higher stim frequencies (5, 10, 20, and 50 Hz), it was determined that only stim pulses within the first 50 ms yielded the largest increase in cellular Ca2+ (Ca2+ traces, Figure 3; temporal analysis, Figure 5A: 0.10 ± 0.01, 0.11 ± 0.01, 0.25 ± 0.02, and 0.29 ± 0.10 units), which correlated temporally with the highest observed spike rates (15.14 ± 1.4, 7.71 ± 0.27, 12.78 ± 1.12, 13.34 ± 1.61, and 13.49 ± 2.57). Over the time course, GC spike responses appeared only within the first 500 ms and occasionally (noise level) for the remaining stim period (Figure 5A, on average ~ 3.5 spikes/50 ms), indicating a GC response outage. During the same stim timeline, in Ca2+ recordings, either further cellular Ca2+ influx was detected (Figure 5A; Ca2+ rate lies by ctr values before stim) or extrusion was not noticed, establishing a steady elevated Ca2+ plateau (Figure 5B; overlay of signals).
Taken together, our data suggest that sustained high-frequency stim (1) leads to a rapid GC spike response outage that is accompanied by elevated intercellular Ca2+ levels and (2) does not further promote intracellular Ca2+ intrusion but facilitates the inhibition of the extrusion clamping of intercellular Ca2+ at elevated levels (Figure 5B), and (3) at all applied frequencies post stimulus, the Ca2+ level recovers immediately.

4. Discussion

Electrical stimulation promotes visual sensation in blind patients; however, at high stim frequencies, artificially induced visual sensations fade rapidly [15,20,21,23]. Experiments on animal retinal explants revealed that the observed vision fading does not occur in the cortex but rather is related to the retinal cells interfaced by the microelectronics, specifically GCs. Generally, the observed response outage of GCs and other neuron types is explained by the desensitization of the membrane channels [7,22,23,24,25]. However, as of yet, unequivocal evidence describing the underlying mechanism for retinal response outage has not been presented.
In our previous study, in stim retinal cells [29], we observed an influx of Ca2+ that is dependent on stim pulse strength. Inspired by these findings, we systematically investigated the role of the crucial neuromodulator Ca2+ in the electrophysiological response outage. Therefore, we modulated the voltage responsible for the response strength and frequency, allowing us to study the GC response dynamics. In contrast with studies investigating single-pulse applications [29], we applied sustained stim at different frequencies for 90 s, matching the realistic scenario of continuous vision perception.

4.1. Switch from Network-Mediated to the Direct Stimulation of Ganglion Cells

Subretinal stim propagating through the retinal network of blind mice is of great advantage, as it mediates advanced retinal responses, such as the differential activation of diverse retinal channels, such as the ON, OFF, and ON–OFF GC subtypes [29]. Hence, in the present study, we evaluated the impact of voltage or frequency modulation on network-mediated responses in the presence of synaptic blockers (LAP-4, CNQX, and verapamil) and a VGNaC blocker (TTX). Our data show that, at stim frequencies <5 Hz, GCs were activated only synaptically, while at ≥5 Hz, GCs were also activated directly over the VGC. Overall, for developing a stim paradigm for subretinal applications, it is key to consider that high voltage at low frequencies or low voltage at high frequencies can penetrate the retinal tissue deeper and in addition activate GCs directly.

4.2. High-Frequency Stimulation Electrogenically Modulates the Desensitization of the Ganglion Cells

An unexpected observation was made in Ca2+ imaging recordings: With increasing frequencies, the Ca2+ signals melted to an elevated Ca2+ plateau, while spike responses were absent. These findings correlate with patient reports of experiencing vision fading above 3 Hz stim. Hence, a few questions were raised to assist in understanding the GC response outage dependent on the stim frequency and the role of Ca2+.
(i) What is the correlation between GC spikes and Ca2+ signals in our data? During electrophysiological activity (depolarization), Ca2+ enters GCs via the VGNaC (responsible for spike generation (=action potential)) and the additional source of Ca2+ intrusion to the VGCC [4]. With increasing frequencies, larger Ca2+ amplitudes were measured, indicating the opening of more and more channels facilitating the large Ca2+ intrusions. At a stim frequency of 20 Hz, most channels seemed to be open, achieving a maximum response; however, the 50 Hz stim did not yield a significantly more extensive response. After the stim-induced depolarization, the observed Ca2+ signals required a relatively prolonged recovery period of 300 ms to become responsive again. Eventually, shortening the resting time (pulse interval) by increased frequencies (10 Hz: 100 ms; 20 Hz: 50 ms; 50 Hz: 20 ms) led to plateau-like elevated intracellular Ca2+. In contrast, the refractory period of intrinsically closing VGNaCs roughly lies by half the action potential time (~ 1 ms), in which the balance of ions is maintained, and the neurons become responsive again. To this end, it remains unclear whether the VGNaCs are affected directly or indirectly (e.g., refractory period) by the elevated Ca2+ leading to GC response outage, which leads us to our further questions.
(ii) How is the Ca2+ plateau established? High-frequency stim produced larger Ca2+ transient signals within the first few pulses, leading to a steady plateau. With ongoing stim, if Ca2+ had entered via VGNaC (synaptically or direct activation), spikes should have been generated, but in the MEA recordings, no spikes were observed. Alternatively, if Ca2+ had entered via VGCC, we should have seen Ca2+ transients, but this was not the case. Since the Ca2+ signal did not increase during the ongoing stim, it can be ruled out that additional Ca2+ had entered the cell. It is likely that most of the channels had been opened by the first pulses, establishing the level of the Ca2+ plateau.
(iii) Why is the Ca2+ level not decreasing? Ca2+, intruded by electrophysiological actions into cells (spiking or maintaining resting membrane potential), is regulated by several Ca2+ extrusion mechanisms [33,34]. Hence, hypothetically, it is conceivable that the observed elevated Ca2+ plateau results from an equilibrium of rapid intrusion and extrusion, appearing to be steady. However, we rejected this hypothesis because no spikes (no VGNaC-mediated Ca2+ influx) were observed. A successive Ca2+ influx mediated by VGCC was also excluded according to the null Ca2+ influx rate. Hence, we concluded that the Ca2+ extrusion must have been affected electrogenically by the stim, which clamped the initially intruded Ca2+ in the cell for the remaining stim period. Higher stim frequencies affected the retinal tissue in depth, stimulating GCs directly (verified by synaptic blockers). First, the electric field excited the GCs but then inhibited the extrusion mechanism electrogenically as a side effect.
Potential Ca2+ extrusion candidates that could be electrogenically affected by the electric field [35,36] are charge-dependent mechanisms, such as membrane exchangers (sodium/Ca2+ exchanger (NCX)) or channels (voltage-gated and Ca2+-modulated potassium (K+) channels) [37,38,39]. Otherwise, Ca2+ buffering caused by cytosolic Ca2+-binding protein [40] stores (ER or mitochondrial stores, [41]) or ATP-driven membrane Ca2+ pumps (PMCA, [42]) is unlikely to be affected electrogenically [35,36]. Hence, in our data, the observed initial drop in the Ca2+ transient is probably governed by these electrogenically unaffected Ca2+ removal mechanisms, eventually reaching their maximum uptake capacity. This, in turn, could explain why a further drop in Ca2+ level was not observed. Nevertheless, specific patch clamp recordings could provide further details.
(iv) How does a response outage occur? The aforementioned discussion of the evaluated data established that the elevated Ca2+ is not extruded during continuous ongoing high-frequency stim. The extrusion is obviously extremely slowed down or nearly blocked. Given that high stimulation frequency can lead to greater cell depolarization [43], the up to 6.5-fold increased calcium levels in our data very likely reflect a strong cell depolarization and shift in the membrane potential toward the Ca2+-dominated positive potential. Consequently, it is conceivable that the elevated Ca2+ levels impact the regeneration of the resting membrane potential and thereby the generation of further action potentials, resulting in a response outage (no spikes in MEA recordings). The immediate drop in the Ca2+ levels after stim (at high and low frequencies) allows for the recovery and regeneration of action potentials. Hence, we concluded that high-frequency stim (≥5 Hz) electrogenically prevented cellular Ca2+ extrusion and clamped the intracellular Ca2+ levels at remarkably high levels, with strong electrophysiological implications for the further generation of GC spikes. This electrogenic blockage might also affect dendrites and synapses throughout the retinal neuronal network [37]. A natural GABAergic or glycinergic response inhibition is inconceivable since synaptic inhibition would not lead to elevated Ca2+ levels—the inhibitory pathway is probably equally stim. In addition, Ca2+, Na+, and K+ play a significant role in the maintenance of electrophysiological resting membrane potential [4,44,45]. Their contribution could be investigated using methods of patch clamp recordings to narrow down the contribution of ions, channels, or exchangers.
(v) What is the difference in outcome between high-rate stimulations from our study and those of others? Comparing previous findings, Weiland, Walston, and Humayun (2016) [24] have concluded that high-frequency stimulation leads to substantial GC response decay (>25 Hz) and even response outage (>50 Hz), within the very first 10 stimulation pulses; in our approach, up to 45–4500 pulses were applied using 0.5–50 Hz stimulation during a sustained stimulation period of 90 s. Considering the 16 Hz stimulation conducted by Freeman and Fried (2011) [23], they investigated the responses to 10 sequential stimulation pulses (total stimulation period of 625 ms), which is comparable in our recordings to the “initial phase” stimulation of the total 90 s recording period (Figure 3). Within this short stimulation period, they reported a drop in the GC spike in the first stimulation from ~10 to 0–2 spikes in the tenth stimulation, which is in line with our MEA and Ca2+ data (Figure 5, <500 ms): The strongest Ca2+ transient (intrusion) was observed for the very first stimulation pulses despite the frequency (20 Hz: 10 pulses in 500 ms, and 50 Hz: 25 pulses in 500 ms). Within an earlier study, Sekirnjak et al. (2006) [46] reported robust GC responses to 100 and even 300 Hz stimulation. Thereby, they applied paired pulses with a pause interval of 500 ms. It is worth noting that, in their work, the notation high-frequency refers to the time interval of the paired pulses and not to the pause interval. Considering the pause interval of 500 ms, which is most crucial (the intervals of the two stimulation pulses were only 10 and 3 ms), these data correspond to our lower stimulation frequencies (~0.5 Hz) and are in line with our outcome, confirming that a ~ 300 ms interval is required for Ca2+ recovery and the regeneration of spike activity.
Overall, previous findings do not contradict our findings; however, our approach goes beyond the scope of previous investigations in terms of stimulation duration (90 s), stimulation frequency, sustained application, and the discrimination of different stimulation phases (initial, middle, and recovery). The use of Ca2+ imaging recordings led us to the most interesting observation: as long as the Ca2+ levels were elevated within the GCs, no further Ca2+ transients were observed in Ca2+ data, and a GC spike response outage was observed in MEA data.

4.3. Implications of Electrical-Stimulation-Mediated Modulation of Cellular Ca2+ Dynamics for the Development of Strategies for Electrical Implants

The presented Ca2+ imaging recordings of GCs in conjunction with different pharmaceuticals unequivocally revealed that the applied stim (voltage and frequency) did not electroporate the retinal cells; the GC activity was based on neurotransmitter transmission or voltage-sensitive channels.
The cellular recording resolution of Ca2+ imaging allowed us to conclude that not all GCs responded to the same stim and not all applied voltages produced GC responses. These findings might guide efforts investigating the differential activation of GCs, for example, as established by Baden et al. (2016) [32] for light stim. Furthermore, future studies considering mathematical or computational models inferring spike responses from Ca2+ imaging [47,48,49] for the development of stim paradigms [27,50,51,52], shall not only consider the primary excitatory effect of electrical stimulation on neurons, but also with care the secondary effects like response outage and ion extrusion as described in the presented study.
Seeking stimulation paradigms to drive the different retinal channels independently is the ultimate goal of artificial vision research. Therefore, different parameters are applied in variations to obtain new insights. In schemes of subretinal stimulations (outer retina), Jensen and Rizzo (2009) [53] suggested that a biphasic anodic-first stimulation might be a better choice than monophasic cathodic and monophasic anodic stimulation. In contrast, cathodic-first biphasic stimulation was used successfully in subretinal retinal implants [9] promoting visual sensations in blind patients. Thereby, the voltage of both phases was equal, thus achieving a balanced charge. Later, Haq et al. (2018) [29] successfully demonstrated the network-mediated activation of different GC types using monophasic anodic stimulation in subretinal configuration, interfacing the residual light-insensitive degenerated photoreceptors. Yet, complementing and extending the range of research in this field, we tested for the first time biphasic cathodic-first stimulation in a subretinal configuration in addition to biphasic anodic-first stimulation, both in an unbalanced manner (keeping the anodic phase static and modulating only cathodic phase). In addition, the distance of the reference electrode was considered (nearby and far). Our data showed that a biphasic cathodic-first stimulation was most effective in activating the GCs via the retinal network (with a nearby reference electrode) and that not all voltage combinations activated the cells with the same strength. Our findings might seemingly conflict with other findings (different response strengths), but most of the studies were performed using electrical MEA recordings; in contrast, our work was performed using Ca2+ imaging. Thus, our study enriches research in this field by highlighting the role of ions, particularly Ca2+, in shaping physiological responses.
Different strategies have been suggested for overcoming the phenomenon of stim-induced vision fading by avoiding cell desensitization. Sekhar et al. (2016) [54], Li et al. (2022) [55], and Chenais et al. (2021) [56] modulated the applied voltage randomly and activated the electrodes line-wise or randomly. In principle, these findings indirectly support our results. It appears that the randomly applied low voltages allowed intracellular Ca2+ to recover (comparable to our data, not all subvoltages excite cells; Figure 2), and the subsequent high-voltage stim clamped cellular Ca2+ again (comparable to high-frequency stim in our data; Figure 3). However, the random stim application [54,56] would not translate the light intensity perceived by implants’ photodiodes into an intensity–stimulus relation, for example, considering contrast and day/night light settings. In contrast, within an applicable solution for retinal implants, enhanced high temporal and spatial resolution responses have been achieved recently [25]. Thereby, six contiguously arranged electrodes (hexagons) were activated alternatingly, resembling biomimetically saccadic eye movements. The predictive “jump” of the activated electrode gave cells in contact with inactive electrodes enough time to recover from the previous stim (estimated recovery time ~ 300 ms). Our data indicate that the sequential electrode jumps [25] facilitated the required recovery time for cells to extrude Ca2+ to a level that allowed for the regeneration of spikes.
In addition to the electrophysiological impact, the response outage and sustained elevated Ca2+ baseline due to successive high-frequency stim could also cause secondary neuronal damage by activating Ca2+-triggered cell degenerative pathways [57].

5. Conclusions

Our study highlights the paramount role of the neuromodulator Ca2+ in GC response outages that are dependent on stim frequency. The newly established protocol, stimulating blind mouse retinas in a subretinal configuration and recording GC responses via Ca2+ imaging and MEA, allowed us to elucidate the Ca2+ dynamics and determine the underlying mechanism.
The combination of stim parameters (biphasic pulse, cathodic-first stimulation with a near reference, and stim frequency) influenced the response strength and stim depth, thereby regulating cellular Ca2+ intrusion. On the other end, the disruption of Ca2+ extrusion was found to be responsible for the GC response outage.
The temporal correlation of GC Ca2+ responses and spike trains revealed that, at high-frequency stim (>3 Hz sustained application), a GC spike response outage occurred, while at the same time, the intracellular Ca2+ level was remarkably elevated. We concluded that high-frequency stim prevented electrogenically cellular Ca2+ extrusion and thereby clamped the intracellular Ca2+ at high levels, in turn contributing to the electrophysiological GC spike outage for the remaining duration of the sustained stim.
These findings are of profound interest for studies optimizing electrical stimulation paradigms for artificial vision to prevent vision fading and, overall, for applications of electrical neural interfacing.

Supplementary Materials

The following supporting information can be downloaded at: https://www.mdpi.com/article/10.3390/bioengineering10101208/s1, Table S1: Statistical analysis of Figure 4.

Author Contributions

Conceptualization, W.H.; methodology, W.H.; software, W.H.; validation, W.H.; formal analysis, W.H.; investigation, W.H. and L.P.; data curation, L.P. and W.H.; writing—original draft preparation, W.H.; writing—review and editing, W.H., L.P. and E.Z.; visualization, W.H. and L.P.; supervision, W.H.; funding acquisition and project administration, W.H. and E.Z. All authors have read and agreed to the published version of the manuscript.

Funding

This research was supported by a Hector Fellow Academy grant (HFA-2020) and a Tistou and Charlotte Kerstan Foundation (RI-2020) grant to Wadood Haq, as well as grants from the Tistou and Charlotte Kerstan Foundation to Lucia Peiroten. We acknowledge support from Deutsche Forschungsgemeinschaft and the Open Access Publishing Fund of the University of Tübingen.

Institutional Review Board Statement

The study was performed in accordance with the ARVO statement for the use of animals in ophthalmic and visual research and approved by the Tübingen University Committee on Animal Welfare (Einrichtung für Tierschutz, Tierärztlichen Dienst und Labortierkunde). All procedures were in compliance with §4 of the German law on animal welfare (permission for experiments on retinal tissue after scarification; protocol code: Mitteilung nach § 4 Abs. 3 TierSchG and date of approval: 10.05.2017 and AK 06-22 M).

Informed Consent Statement

Not applicable.

Data Availability Statement

The data presented in this study are available in the article.

Conflicts of Interest

The authors declare no conflict of interest.

Abbreviations

The following abbreviations are used in this manuscript:
ACSFArtificial cerebrospinal fluid
BCBipolar cells
Ca2+Calcium
CB OFFOFF-type cone bipolar cell
CB ONON-type cone bipolar cell
CICRCalcium-induced calcium release
CNQX6-Cyano-7-nitroquinoxaline-2,3-dione
ctrControl
elecElectrode
EREndoplasmic reticulum
GCGanglion cell
HzHertz
iGluRIonotropic glutamate receptors
K+Potassium
kHzKilo hertz
L-AP4L-2-amino-4-phosphonobutyric acid
MEAMultielectrode array
mGluR6Metabotropic glutamate receptor 6
mMMilli molar
Na+Sodium
NCXSodium/calcium exchanger
OGB-1Oregon Green 488 BAPTA-1
PMCAPlasma membrane calcium ATP-pump
rd1C3H/rd1 (C3H Pde6brd1/rd1)
refReference
SEMStandard error mean
stimElectrical stimulation
TTXTetrodotoxin
VVolt
VGCVoltage-gated channels
VGCCVoltage-gated calcium channels
VGNaCVoltage-gated sodium channels
δDelta (difference)
τTau
µVMicrovolt
Rate (change over time)

References

  1. Tsang, S.H.; Sharma, T. Retinitis Pigmentosa (Non-syndromic). Adv. Exp. Med. Biol. 2018, 1085, 125–130. [Google Scholar] [CrossRef] [PubMed]
  2. Meng, D.; Ragi, S.D.; Tsang, S.H. Therapy in Rhodopsin-Mediated Autosomal Dominant Retinitis Pigmentosa. Mol. Ther. 2020, 28, 2139–2149. [Google Scholar] [CrossRef] [PubMed]
  3. O’Neal, T.B.; Luther, E.E. Retinitis Pigmentosa; StatPearls: Treasure Island, FL, USA, 2022. [Google Scholar]
  4. Van Hook, M.J.; Nawy, S.; Thoreson, W.B. Voltage- and calcium-gated ion channels of neurons in the vertebrate retina. Prog. Retin. Eye Res. 2019, 72, 100760. [Google Scholar] [CrossRef] [PubMed]
  5. Farnum, A.; Pelled, G. New Vision for Visual Prostheses. Front. Neurosci. 2020, 14, 36. [Google Scholar] [CrossRef] [PubMed]
  6. Mathieson, K.; Loudin, J.; Goetz, G.; Huie, P.; Wang, L.; Kamins, T.I.; Galambos, L.; Smith, R.; Harris, J.S.; Sher, A.; et al. Photovoltaic Retinal Prosthesis with High Pixel Density. Nat. Photonics 2012, 6, 391–397. [Google Scholar] [CrossRef] [PubMed]
  7. Lorach, H.; Goetz, G.; Smith, R.; Lei, X.; Mandel, Y.; Kamins, T.; Mathieson, K.; Huie, P.; Harris, J.; Sher, A.; et al. Photovoltaic restoration of sight with high visual acuity. Nat. Med. 2015, 21, 476–482. [Google Scholar] [CrossRef] [PubMed]
  8. Yue, L.; Weiland, J.D.; Roska, B.; Humayun, M.S. Retinal stimulation strategies to restore vision: Fundamentals and systems. Prog. Retin. Eye Res. 2016, 53, 21–47. [Google Scholar] [CrossRef]
  9. Stingl, K.; Schippert, R.; Bartz-Schmidt, K.U.; Besch, D.; Cottriall, C.L.; Edwards, T.L.; Gekeler, F.; Greppmaier, U.; Kiel, K.; Koitschev, A.; et al. Interim Results of a Multicenter Trial with the New Electronic Subretinal Implant Alpha AMS in 15 Patients Blind from Inherited Retinal Degenerations. Front. Neurosci. 2017, 11, 445. [Google Scholar] [CrossRef]
  10. Humayun, M.S.; Dorn, J.D.; da Cruz, L.; Dagnelie, G.; Sahel, J.A.; Stanga, P.E.; Cideciyan, A.V.; Duncan, J.L.; Eliott, D.; Filley, E.; et al. Interim results from the international trial of Second Sight’s visual prosthesis. Ophthalmology 2012, 119, 779–788. [Google Scholar] [CrossRef]
  11. da Cruz, L.; Coley, B.F.; Dorn, J.; Merlini, F.; Filley, E.; Christopher, P.; Chen, F.K.; Wuyyuru, V.; Sahel, J.; Stanga, P.; et al. The Argus II epiretinal prosthesis system allows letter and word reading and long-term function in patients with profound vision loss. Br. J. Ophthalmol. 2013, 97, 632–636. [Google Scholar] [CrossRef]
  12. Lowery, A.J.; Rosenfeld, J.V.; Lewis, P.M.; Browne, D.; Mohan, A.; Brunton, E.; Yan, E.; Maller, J.; Mann, C.; Rajan, R.; et al. Restoration of vision using wireless cortical implants: The Monash Vision Group project. In Proceedings of the 2015 37th Annual International Conference of the IEEE Engineering in Medicine and Biology Society (EMBC), Milan, Italy, 25–29 August 2015; Volume 2015, pp. 1041–1044. [Google Scholar] [CrossRef]
  13. Pouratian, N.; Yoshor, D.; Niketeghad, S.; Dornm, J.; Greenberg, R. Early Feasibility Study of a Neurostimulator to Create Artificial Vision. Neurosurgery 2019, 66, 310-146. [Google Scholar] [CrossRef]
  14. Fernandez, E.; Alfaro, A.; Soto-Sanchez, C.; Gonzalez-Lopez, P.; Lozano, A.M.; Pena, S.; Grima, M.D.; Rodil, A.; Gomez, B.; Chen, X.; et al. Visual percepts evoked with an intracortical 96-channel microelectrode array inserted in human occipital cortex. J. Clin. Investig. 2021, 131, e151331. [Google Scholar] [CrossRef] [PubMed]
  15. Stingl, K.; Bartz-Schmidt, K.U.; Besch, D.; Chee, C.K.; Cottriall, C.L.; Gekeler, F.; Groppe, M.; Jackson, T.L.; MacLaren, R.E.; Koitschev, A.; et al. Subretinal Visual Implant Alpha IMS—Clinical trial interim report. Vis. Res. 2015, 111, 149–160. [Google Scholar] [CrossRef] [PubMed]
  16. Dagnelie, G.; Christopher, P.; Arditi, A.; da Cruz, L.; Duncan, J.L.; Ho, A.C.; Olmos de Koo, L.C.; Sahel, J.A.; Stanga, P.E.; Thumann, G.; et al. Performance of real-world functional vision tasks by blind subjects improves after implantation with the Argus(R) II retinal prosthesis system. Clin. Exp. Ophthalmol. 2017, 45, 152–159. [Google Scholar] [CrossRef] [PubMed]
  17. Chaumette, C. New rehabilitation strategies for patients with Argus II retinal implants. Investig. Ophthalmol. Vis. Sci. 2018, 59, 4573. [Google Scholar]
  18. Farvardin, M.; Afarid, M.; Attarzadeh, A.; Johari, M.K.; Mehryar, M.; Nowroozzadeh, M.H.; Rahat, F.; Peyvandi, H.; Farvardin, R.; Nami, M. The Argus-II Retinal Prosthesis Implantation; From the Global to Local Successful Experience. Front. Neurosci. 2018, 12, 584. [Google Scholar] [CrossRef] [PubMed]
  19. Cehajic Kapetanovic, J.; Troelenberg, N.; Edwards, T.L.; Xue, K.; Ramsden, J.D.; Stett, A.; Zrenner, E.; MacLaren, R.E. Highest reported visual acuity after electronic retinal implantation. Acta Ophthalmol. 2020, 98, 736–740. [Google Scholar] [CrossRef] [PubMed]
  20. Wilke, R.G.H.; Moghadam, G.K.; Lovell, N.H.; Suaning, G.J.; Dokos, S. Electric crosstalk impairs spatial resolution of multi-electrode arrays in retinal implants. J. Neural Eng. 2011, 8, 046016. [Google Scholar] [CrossRef]
  21. Fornos, A.P.; Sommerhalder, J.; da Cruz, L.; Sahel, J.A.; Mohand-Said, S.; Hafezi, F.; Pelizzone, M. Temporal Properties of Visual Perception on Electrical Stimulation of the Retina. Investig. Ophthalmol. Vis. Sci. 2012, 53, 2720–2731. [Google Scholar] [CrossRef]
  22. Jensen, R.J.; Rizzo, J.F., III. Responses of ganglion cells to repetitive electrical stimulation of the retina. J. Neural Eng. 2007, 4, S1. [Google Scholar] [CrossRef]
  23. Freeman, D.K.; Fried, S.I. Multiple Components of Ganglion Cell Desensitization in Response to Prosthetic Stimulation. J. Neural Eng. 2011, 8, 016008. [Google Scholar] [CrossRef]
  24. Weiland, J.D.; Walston, S.T.; Humayun, M.S. Electrical Stimulation of the Retina to Produce Artificial Vision. Annu. Rev. Vis. Sci. 2016, 2, 273–294. [Google Scholar] [CrossRef] [PubMed]
  25. Haq, W.; Basavaraju, S.; Speck, A.; Zrenner, E. Nature-inspired saccadic-like electrical stimulation paradigm promotes sustained retinal ganglion cell responses by spatiotemporally alternating activation of contiguous multi-electrode patterns. J. Neural Eng. 2022, 19, 055001. [Google Scholar] [CrossRef] [PubMed]
  26. Bhadra, N.; Kilgore, K.L. Direct current electrical conduction block of peripheral nerve. IEEE Trans. Neural Syst. Rehabil. Eng. 2004, 12, 313–324. [Google Scholar] [CrossRef] [PubMed]
  27. Freeman, D.K.; Jeng, J.S.; Kelly, S.K.; Hartveit, E.; Fried, S.I. Calcium channel dynamics limit synaptic release in response to prosthetic stimulation with sinusoidal waveforms. J. Neural Eng. 2011, 8, 046005. [Google Scholar] [CrossRef] [PubMed]
  28. Kameneva, T.; Maturana, M.I.; Hadjinicolaou, A.E.; Cloherty, S.L.; Ibbotson, M.R.; Grayden, D.B.; Burkitt, A.N.; Meffin, H. Retinal ganglion cells: Mechanisms underlying depolarization block and differential responses to high frequency electrical stimulation of ON and OFF cells. J. Neural Eng. 2016, 13, 016017. [Google Scholar] [CrossRef] [PubMed]
  29. Haq, W.; Dietter, J.; Zrenner, E. Electrical activation of degenerated photoreceptors in blind mouse retina elicited network-mediated responses in different types of ganglion cells. Sci. Rep. 2018, 8, 16998. [Google Scholar] [CrossRef] [PubMed]
  30. Keeler, C.E. The Inheritance of a Retinal Abnormality in White Mice. Proc. Natl. Acad. Sci. USA 1924, 10, 329–333. [Google Scholar] [CrossRef]
  31. Briggman, K.L.; Euler, T. Bulk electroporation and population calcium imaging in the adult mammalian retina. J. Neurophysiol. 2011, 105, 2601–2609. [Google Scholar] [CrossRef]
  32. Baden, T.; Berens, P.; Franke, K.; Roman Roson, M.; Bethge, M.; Euler, T. The functional diversity of retinal ganglion cells in the mouse. Nature 2016, 529, 345–350. [Google Scholar] [CrossRef]
  33. Gleichmann, M.; Mattson, M.P. Neuronal calcium homeostasis and dysregulation. Antioxid. Redox Signal. 2011, 14, 1261–1273. [Google Scholar] [CrossRef] [PubMed]
  34. Brini, M.; Cali, T.; Ottolini, D.; Carafoli, E. Neuronal calcium signaling: Function and dysfunction. Cell Mol. Life Sci. 2014, 71, 2787–2814. [Google Scholar] [CrossRef] [PubMed]
  35. Miller, W.M.; Miller, M.W.; Brayman, A.A.; Carstensen, E.L. Electric field-induced inhibition of electrogenic pumping in Nitella: Analysis for transmembrane potential hypo- and hyperpolarization effects. Environ. Exp. Bot. 1993, 33, 209–223. [Google Scholar] [CrossRef]
  36. Beurrier, C.; Bioulac, B.; Audin, J.; Hammond, C. High-frequency stimulation produces a transient blockade of voltage-gated currents in subthalamic neurons. J. Neurophysiol. 2001, 85, 1351–1356. [Google Scholar] [CrossRef] [PubMed]
  37. von Gersdorff, H.; Matthews, G. Calcium-dependent inactivation of calcium current in synaptic terminals of retinal bipolar neurons. J. Neurosci. 1996, 16, 115–122. [Google Scholar] [CrossRef] [PubMed]
  38. Borde, M.; Bonansco, C.; Fernandez de Sevilla, D.; Le Ray, D.; Buno, W. Voltage-clamp analysis of the potentiation of the slow Ca2+-activated K+ current in hippocampal pyramidal neurons. Hippocampus 2000, 10, 198–206. [Google Scholar] [CrossRef]
  39. Sah, P.; Davies, P. Calcium-activated potassium currents in mammalian neurons. Clin. Exp. Pharmacol. Physiol. 2000, 27, 657–663. [Google Scholar] [CrossRef]
  40. Kovacs-Oller, T.; Szarka, G.; Ganczer, A.; Tengolics, A.; Balogh, B.; Volgyi, B. Expression of Ca2+-Binding Buffer Proteins in the Human and Mouse Retinal Neurons. Int. J. Mol. Sci. 2019, 20, 2229. [Google Scholar] [CrossRef]
  41. Mattson, M.P.; LaFerla, F.M.; Chan, S.L.; Leissring, M.A.; Shepel, P.N.; Geiger, J.D. Calcium signaling in the ER: Its role in neuronal plasticity and neurodegenerative disorders. Trends Neurosci. 2000, 23, 222–229. [Google Scholar] [CrossRef]
  42. Hajieva, P.; Baeken, M.W.; Moosmann, B. The role of Plasma Membrane Calcium ATPases (PMCAs) in neurodegenerative disorders. Neurosci. Lett. 2018, 663, 29–38. [Google Scholar] [CrossRef]
  43. Lee, J.I.; Werginz, P.; Fried, S.I. Variability in Depolarization Sensitivity Underlies Differential Responses to High-frequency Stimulation of ON and OFF RGCs. In Proceedings of the 2023 11th International IEEE/EMBS Conference on Neural Engineering (NER), Baltimore, MD, USA, 24–27 April 2023; pp. 1–4. [Google Scholar]
  44. Borde, M.; Cazalets, J.R.; Buno, W. Activity-dependent response depression in rat hippocampal CA1 pyramidal neurons in vitro. J. Neurophysiol. 1995, 74, 1714–1729. [Google Scholar] [CrossRef] [PubMed]
  45. Borde, M.; Bonansco, C.; Buno, W. The activity-dependent potentiation of the slow Ca2+-activated K+ current regulates synaptic efficacy in rat CA1 pyramidal neurons. Pflugers Arch. 1999, 437, 261–266. [Google Scholar] [CrossRef] [PubMed]
  46. Sekirnjak, C.; Hottowy, P.; Sher, A.; Dabrowski, W.; Litke, A.M.; Chichilnisky, E.J. Electrical stimulation of mammalian retinal ganglion cells with multielectrode arrays. J. Neurophysiol. 2006, 95, 3311–3327. [Google Scholar] [CrossRef] [PubMed]
  47. Theis, L.; Berens, P.; Froudarakis, E.; Reimer, J.; Rosón, M.R.; Baden, T.; Euler, T.; Tolias, A.S.; Bethge, M. Supervised learning sets benchmark for robust spike rate inference from calcium imaging signals. bioRxiv 2015, arXiv:1503.00135. [Google Scholar]
  48. Pachitariu, M.; Stringer, C.; Harris, K.D. Robustness of Spike Deconvolution for Neuronal Calcium Imaging. J. Neurosci. 2018, 38, 7976–7985. [Google Scholar] [CrossRef] [PubMed]
  49. Fleming, W.; Jewell, S.; Engelhard, B.; Witten, D.M.; Witten, I.B. Inferring spikes from calcium imaging in dopamine neurons. PLoS ONE 2021, 16, e0252345. [Google Scholar] [CrossRef] [PubMed]
  50. Werginz, P.; Benav, H.; Zrenner, E.; Rattay, F. Modeling the response of ON and OFF retinal bipolar cells during electric stimulation. Vision Res. 2015, 111, 170–181. [Google Scholar] [CrossRef]
  51. Rattay, F.; Bassereh, H.; Stiennon, I. Compartment models for the electrical stimulation of retinal bipolar cells. PLoS ONE 2018, 13, e0209123. [Google Scholar] [CrossRef]
  52. Werginz, P.; Rattay, F. The impact of calcium current reversal on neurotransmitter release in the electrically stimulated retina. J. Neural Eng. 2016, 13, 046013. [Google Scholar] [CrossRef]
  53. Jensen, R.J.; Rizzo, J.F., 3rd. Activation of ganglion cells in wild-type and rd1 mouse retinas with monophasic and biphasic current pulses. J. Neural Eng. 2009, 6, 035004. [Google Scholar] [CrossRef]
  54. Sekhar, S.; Jalligampala, A.; Zrenner, E.; Rathbun, D.L. Tickling the retina: Integration of subthreshold electrical pulses can activate retinal neurons. J. Neural Eng. 2016, 13, 046004. [Google Scholar] [CrossRef] [PubMed]
  55. Li, W.; Haji Ghaffari, D.; Misra, R.; Weiland, J.D. Retinal ganglion cell desensitization is mitigated by varying parameter constant excitation pulse trains. Front. Cell. Neurosci. 2022, 16, 897146. [Google Scholar] [CrossRef] [PubMed]
  56. Chenais, N.A.L.; Airaghi Leccardi, M.J.I.; Ghezzi, D. Naturalistic spatiotemporal modulation of epiretinal stimulation increases the response persistence of retinal ganglion cell. J. Neural Eng. 2021, 18, 016016. [Google Scholar] [CrossRef] [PubMed]
  57. Power, M.; Das, S.; Schutze, K.; Marigo, V.; Ekstrom, P.; Paquet-Durand, F. Cellular mechanisms of hereditary photoreceptor degeneration—Focus on cGMP. Prog. Retin. Eye Res. 2020, 74, 100772. [Google Scholar] [CrossRef]
Figure 1. Subretinal electrical stimulation and ganglion cell recordings. Electrical stimulation (stim) of the blind mouse (rd1) retina in two different subretinal configurations: (A) Stim via a single microelectrode and recordings of retinal ganglion cell (GC) spikes using a multielectrode array (MEA). The stim electrode (elec) was brought into contact with the outer retina under microscopic control. (B) MEA stim of the outer retina and recording of GC activity via calcium imaging (Ca2+ imaging). The symbols indicate the glutamate receptors (metabotropic glutamate receptor 6 (mGluR6) and ionic glutamate receptor (iGluR)) and the voltage-gated channels (voltage-gated Ca2+ channels (VGCCs) and voltage-gated sodium channels (VGNaCs)). (C) Ca2+ imaging of GCs loaded with the fluorescent Ca2+ indicator OGB-1 (upper panel). Temporal correlation of a representative GC Ca2+ trace (Ca2+ imaging) and spike train (MEA recording) to the subretinal biphasic cathodic-first stim pulse (−1.6/+1.5 V). (D) Pulse profile diagram of the applied biphasic stim in cathodic-first (upper panel) or anodic-first (lower panel) modes. The positive phase was kept static at a certain voltage (solid line), while the negative phase was modulated (dashed line) in 200 mV subvoltage steps. (E) MEA layout of the spatial configuration of the stim and the reference (ref) elec (MEA dimensions: diameter 10 µm and spacing 40 µm; remote ref (upper panel) and near ref (lower panel). Abbreviations of the retinal cells: dPhr: degenerated light-insensitive photoreceptors, H: horizontal cell, RB: rod bipolar cell, CB OFF: OFF-type cone bipolar cell, CB ON: ON-type bipolar cell, GC ON: ON-type GC, and GC OFF: OFF-type GC.
Bioengineering 10 01208 g001
Figure 2. Evaluation of ganglion cell Ca2+ responses elicited through the modulation of stimulation paradigms. Presentation of ganglion cell (GC) Ca2+ responses: (A) Amplitude (δ; indicating Ca2+ intrusion) and (B) decay time (τ, estimating Ca2+ extrusion at 66% in seconds) evoked under four different stim paradigms by modulation of three parameters: (1) biphasic pulse: cathodic-first (blue line) or anodic-first (red line) (cf. Figure 1D, each phase of 1 ms duration); (2) modulation of the biphasic pulse (cf. Figure 1D), with the anodic phase kept static to define the five voltage blocks (+0.5, +1.0, +1.5, +2.0, and +2.5 V) and only the cathodic phase modulated in −0.2 V subvoltage steps (in case of odd voltage blocks additionally a stim at −0.1 V was carried out); and (3) reference electrode configuration: remote (solid line) or near (dashed line) (cf. Figure 1E). N = 5 retina, m = 6 cells, stim pulse interval 20 s, and 5 repetitions of each pulse. Error bars indicate ± SEM.
Bioengineering 10 01208 g002
Figure 3. Stimulation frequency-dependent modulation of retinal ganglion cell responses: (A) Ca2+ imaging recordings of ganglion cells (GCs, mean of n = 6 retinas, m = 6 cells) elicited via sustained electrical stimulation (stim; 90 s) at various frequencies (0.5, 1.5, 3, 5, 10, 20, and 50 Hz; biphasic stimulus: −1.6/+1.5 V). Temporal magnification of the response’s initial, middle, and recovery phases is indicated in the inset boxes (15 s resolution). Experimental recording conditions: control (ctr) and in the presence of pharmaceuticals (cf. Figure 1 for site of action): mGluR6 agonist L-AP4, iGluR antagonist CNQX, VGNaC antagonist TTX, and VGCC blocker verapamil. (B) Representative Ca2+-induced Ca2+-release (CICR) events (black) were rarely recorded in a GC during subretinal stim.
Bioengineering 10 01208 g003
Figure 4. Quantification of the ganglion cell Ca2+ responses modulated by various frequencies and pharmaceuticals. Stimulation (stim) frequency (x-axis: 0.5, 1.5, 3, 5, 10, 20, and 50 Hz; biphasic stimulus: −1.6/+1.5 V)-dependent modulation of ganglion cell (GC responses under control (ctr, black) and in the presence of pharmaceuticals (colored) (cf. Figure 1 for site of action): mGluR6 agonist L-AP4, iGluR antagonist CNQX, VGNaC antagonist TTX, and VGCC blocker verapamil. Quantification of (A) δ-amplitude (y-axis normalized, first response peak within early response phase; see Figure 3), and (B) estimation of elevated Ca2+ levels (y-axis normalized, average Ca2+ level of middle recording phase; see Figure 3). For each condition, n = 6 retina, m = 6 cells. Error bars indicate ± SEM. Statistical analysis is provided in Table S1.
Bioengineering 10 01208 g004
Figure 5. Temporal course of ganglion cell responses in dependency of stimulation frequency. (A) Correlation of ganglion cell (GC) responses to electrical stimulation (stim) pulses at various stim frequencies (0.5, 1.5, 3, 5, 10, 20, and 50 Hz; biphasic cathodic-first stimulus: −1.6/+1.5 V) within the early response phase (1250 ms, cf. Figure 3). Ca2+ imaging (left y-axis, black dots): rate (∆) Ca2+ signal (rate of signal change/50 ms bin); MEA recording (right y-axis, red solid line): spike rate (spike count/50 ms bin). (B) Representative overlay of data at 50 Hz stim: Ca2+ trace (blue, intensity, cf. Figure 3), spike rate, and Ca2+ signal rate. Ca2+ data: n = 6 retina, m = 6 cells, and MEA data: n = 5 retina. Error bars indicate ± SEM (only for the largest most significant data points in MEA recordings).
Bioengineering 10 01208 g005
Disclaimer/Publisher’s Note: The statements, opinions and data contained in all publications are solely those of the individual author(s) and contributor(s) and not of MDPI and/or the editor(s). MDPI and/or the editor(s) disclaim responsibility for any injury to people or property resulting from any ideas, methods, instructions or products referred to in the content.

