
Comparative Water Qualities and Blending in the Ogallala and Dockum Aquifers in Texas


College of Engineering, West Texas A&M University, Canyon, TX 79015, USA
Hydrology 2021, 8(4), 166; https://doi.org/10.3390/hydrology8040166
Submission received: 9 September 2021
/
Revised: 16 October 2021
/
Accepted: 22 October 2021
/
Published: 4 November 2021
(This article belongs to the Special Issue Groundwater Management)
Abstract
:Within the US Southern High Plains, it is known that the Ogallala Aquifer (OA) has been over pumped since large-scale agriculture began making use of the water in the 1950s. One option to address the decline is to find new water sources. The last 10–15 years have seen an increase in drilling large capacity, deeper wells in the co-located Dockum Aquifer in the Texas Panhandle. This lower aquifer is separated from the OA by low hydraulic conductivity sediment and is thus generally considered independent from the OA. We examined the suitability of the Dockum to supplement OA water by comparing recent water chemistries where the aquifers coexist. We also examined historical information on well yield, well development, and water quality. We found that water quality is equivalent to the Ogallala in some places but in others it is saltier, softer, and more sodic. Use of PCA and hydrochemical facies revealed that even in this small area Dockum water quality is highly variable. We used USGS-PHREEQC to model water blending at ratios of 0–>100% Ogallala. We show that there is irrigation water quality risk no matter the blend, that risks differ according to location, and that the most frequent risks are salinity, sodicity, and nitrate. We conclude that growers can manage these risks if they use blending to choose the risks they feel most apt to mitigate.
1. Introduction
1.1. Role of Water Scarcity and Declining Quality in the Ogallala Region
The Ogallala Aquifer is one of the largest and most developed groundwater regions in the world. The advent of advanced drilling technologies took hold strongly in this aquifer region beginning in the 1950s as agricultural producers looked for a way to increase crop yields and profitability given the uncertainty of a semi-arid climate.
In recent decades, researchers have realized the unsustainable use of the Ogallala that these practices have enabled. Observed annual groundwater level has declined well beyond natural recharge. These declines have been particularly alarming in the southern portion of the aquifer region in Western Kansas, the Texas Panhandle, and the greater Llano Estacado. In these areas, the level of recharge is low relative to extracted groundwater [1,2,3,4]. Moreover, the groundwater quality in the southern portion of the aquifer while generally good has also seen noticeable decline, which appears to be linked to the declines in the quantity of water in the aquifer [5,6].
Much of the Southern Ogallala region has developed economically in large part because of the existence of the aquifer. The length of the growing season, the quality of the soils, the presence of the aquifer, and some supplemental rainfall enables a large crop-based economic sector to exist. In the Southern High Plains (within which the focus of this study, the Texas Panhandle, resides), it is projected that land use transitions to dryland crops and pasture will reduce irrigated acreage by 54% in the year 2100 with 80% of these losses occurring by 2060 [7]. One means to preserve rural livelihoods in this region and ease this transition is to conserve the Ogallala aquifer by using lower some brackish aquifer units. The clearest choice in this area is to examine the use of the Dockum aquifer, an aquifer which is frequently collocated with the Ogallala but has more variability in its water quality. The current study seeks to compare water qualities between the Ogallala and Dockum aquifers in order examine the suitability for combined use of the two in cases where they exist together.
1.2. Instances Involving Groundwater Quality Suitability or Blending
Instances where mixing, replacing, or altering the use of existing water supplies according to an understanding of differences in groundwater quality are important to provide context and meaning to the comparative water quality examination in this paper.
For applications of blending of various kinds, we did not find many studies which specifically examined simple blending of two groundwater sources. More often examinations concerned blending of brackish groundwater with a fresher source or some other brackish source water such as wastewater effluent or irrigation drainage water. The Middle East and most specifically Israel already employ desalination technologies to make up much of their water supply. Avni et al. [8] concerned themselves with the possibility of blending brackish groundwater with existing desalinization water to save on water treatment costs and also because Mg is frequently excluded from treated water to a degree that is problematic for human health or irrigated crops. By examining blending quantities of local brackish groundwater with desalinized treated water in an economic framework, they determined that blending in groundwater is viable for agricultural users but not for municipal water users. Cohen et al. [9] picked up on a similar problem with an overabundant reduction in beneficial bivalent cations and sulfate (SO4). They examined the use of a Selective Electrodialysis (SED) technique which specifically excludes monovalent ions while preserving multivalent ions in a source groundwater. Using this scheme, they were able to determine that, while brackish groundwater in raw form could be mixed with RO to reach its desired quality for irrigation, it would frequently be less expensive to use the upgraded groundwater (SED treated) in the blend.
Others looked more directly at particular crops and their water quality needs when considering mixed water types. In general, a solution to the salinity challenge with irrigation water is either to alter the environment (water–soil) to fit the crop or alter the crop to fit the environment [10]. Studies described here take former approach. Ben-Gal et al. [11] blended desalination and brackish groundwater to a 70/30 ratio so as to avoid the need for additional fertilizer on greenhouse peppers. Costs decreased in some respects because less desalination water was used, and no additional fertilizer had to be purchased. At the same time, they found that the water savings of the more pristine water were not as large as had been hoped for due to the need to maintain leaching requirements in order to obtain a reasonable pepper yield. Kaner et al. [12] performed combined crop yield-economic analysis to look at several crops that might blend desalination water with brackish groundwater directly. The results frequently demonstrated that it was economically favorable to do so. The viability of such a scheme is highly dependent on local water price, the salinity-based reduction in crop yields due to water–crop–soil interactions, and a crop price which, while frequently modeled as static, will fluctuate. Another take on this idea came from southern California [13] where authors examined blending wastewater of different treatment levels and via different treatment technologies according to cropswhich are likely to be close to centralized wastewater treatment (turfgrass and citrus in this case). By blending the local water user’s quality need with the treatment levels available, it was possible to reduce the cost of reusing wastewater for irrigation compared to using a single level of treatment even with different sized treatment facilities. Finally, concerning the possibility of using multiple water sources, there is the potential to cycle-apply water of different qualities versus blending water types and then applying. The work of Sharma and Minhas [10] provides many examples of where cycle-apply schemes seem to be better for crop yields, but at least one study [14] found that blend application was preferable for both crop and soil. The difference in these findings may be due to instances where crops are more salt-sensitive at their most initial stages of growth. In those cases, early phase application with the fresher water could be preferred.
Though there are few studies outside of the Ogallala region [15,16] where groundwater blending of multiple groundwater sources are considered, many studies have examined groundwater quality using many approaches to gain greater general understanding and evaluate suitability. Examples include the use of geochemical data with GIS and spatial analysis [17,18,19,20,21], water quality indices and use thresholds [19,22,23,24,25,26,27,28], classical hydrochemistry visualization and interpretation [23,25,26,27,29,30,31,32], multivariate techniques [19,23,25,27,33], geochemical modeling [18,33], and integration of decision-support systems (DSS) [20,21]. The choice of what techniques to use would depend on the exact nature of the groundwater suitability exam and the availability of data. Areas which are newly explored required more monitoring and evaluation of results over time while areas that have larger historical datasets may be able to pool data into a large geospatial data framework or reduce the number of fundamental dimensions using multivariate techniques. Studies concerned with explaining trends and processes would benefit more from geochemical and transport modeling while those wanting actionable decision-making as a result could use strict water quality criteria that allow immediate water classification.
1.3. Purpose of This Study
Researchers in this study sought to examine water quality in the overlapping Dockum and Ogallala aquifers in the Texas Panhandle region. The immediate aim is to compare the water qualities between these aquifers directly at similar locations and times on the land surface with a view towards conjunctive use and water quality blending potential. As this is an agricultural area, the most immediate suitability concern for the water is for irrigation needs that might allow for the conservation of Ogallala groundwater. Using a variety of water quality examination methods and suitability criteria, better decisions about the best of use of Dockum and Ogallala water cooperatively can be made. In addition to the specific context of the Ogallala region, the findings in this study may guide others who are considering comparative water qualities involving brackish-to-saline groundwater.
2. Materials and Methods
2.1. Study Location in West Texas
Figure 1 shows the groundwater sampling locations that we chose for the study. There are 25 locations (14 Dockum, 11 Ogallala). We could not choose any well that we wished from historical records because access to wells required securing approval to go onto private lands or to be accompanied by water utility staff at the different cities that assisted us. We strove to design well sampling to be in aquifer pairs. As often as possible, we selected a Dockum and Ogallala well according to their relative proximity to each other on the land surface. We wanted to be able to compare water quality between the aquifers in such a way as to approximate the situation where a landowner could choose how to use each aquifer’s water within the bounds of their property. In many cases, the wells to which we had access were within visual site of one another. Figure 1 illustrates this in that many times diamond (Dockum) and circle (Ogallala) wells nearly overlap at this scale. In addition to well pairing, it was helpful for the sake of analysis to group sampled wells according to regions within the study area. The study area is in general in the central counties of north Dockum. The spatial group designations refer to subdivisions within that central region.
2.2. Historical Data Sources and Conditioning
We downloaded the Texas Water Development Board’s Texas Groundwater Database (GWDB) version current as of Friday, 2 July 2021. All historical water use, drilling information, level, and quality data are taken from that source. Authors of the GWDB estimate that <10% of all existing wells across the State of Texas are registered within the database. Even though the database has a relatively low coverage of all existing wells, we assume that it gives a reasonable sampling of groundwater wells in the Ogallala + Dockum region and use it to represent historical trends on that basis.
In order to perform historical analysis, we selected counties which overlay the northern section of the Dockum Aquifer which coincides generally with the study area. These counties are Dallam, Hartley, Oldham, Deaf Smith, Potter, Randall, Swisher, Floyd, and Crosby counties. These counties cover 40% of the Dockum Aquifer <5000 mg/L footprint of Texas and most of the north section. Exact wells used for water level trends and their distribution across study northern Dockum counties are shown in Figure 2 (n = 21 wells). For water quality historical analysis, we selected all wells which had aggregated water quality parameters which were sampled in 1990 and later in these counties. The resultant record had 14,352 wells and 1503 wells in the Ogallala and Dockum aquifers, respectively.
2.3. Groundwater Sample Collection
We collected samples quarterly for a period of a little over a year (2014–2015). All locations were sampled each quarter so that each location had a representative sample result according to time within the year. Sampling over a year allowed for any variation in weather, inter-annual water quality trends, and nearby well pumping to provide an observable effect in the samples. The wells themselves were a mixture of private wells, municipal water supply wells, and wells on the public Bureau of Land Management (BLM) Crossbar Ranch. Nearly all wells had an existing withdrawal pump and thus were screened and developed. There were three wells (on BLM land) which did not have an existing pump. In those wells, a disposable bailer was used to collect groundwater.
The collection of the groundwater itself proceeded according to the need to obtain water which was recently in the aquifer and not simply resting in the well casing. For each well, we estimated the volume of water in the well to determine the casing water volume. We then used the well flow rate to determine the approximate time necessary to purge three complete well volumes. In addition to this, we also monitored the outflow from a well in a YSI Exo 1 water quality sonde flow through cell. We were able to watch the specific conductivity (SPC, μS/cm)) and temperature (T, °C). We recorded readings at 3–5-min intervals until successive intervals produced minimal change in SPC and T. When sufficient time (well purging) and stable water quality conditions (SPC, T) were both achieved, we considered the well outflow to then be representative of aquifer water quality conditions.
Once water was flowing from the well (or taken from a bailer), we passed the water through a 0.45 μm membrane inline filter. We used the YSI Exo 1 to obtain field water quality parameters (T, SPC, pH, DO, ORP, turbidity), and then bottled the remainder of the water in a clean polyethylene screw cap bottle to take to an external laboratory. Early testing of filtered samples showed very little organic carbon (OC), and so we did not analyze for OC in any samples. In addition to samples, we collected trip blanks, equipment rinse blanks, and field duplicates at a rate of 10% or higher. All blanks used reverse osmosis water generated in our laboratory. Constituents in water samples were determined by a commercial laboratory using EPA methods 300.0 (anions) 200.7 (metals and trace elements). Carbonate and bicarbonate species were also determined using acid titration by a commercial lab.
3. Results
3.1. Previous Studies Involving the Dockum Aquifer
Before examining the comparison, historical and contemporary, between the Dockum and Ogallala aquifers, it is worth summarizing some of the relevant literature on Dockum aquifer studies in recent decades. This information, summarized in Table 1, provides insight into why researchers have been investigating this sometimes fresh, sometimes brackish aquifer and what they have found that will inform the results of the current work. We selected these studies of out of about 20 over the last 30 years.
3.1.1. General Dockum Groundwater Behavior
The Dockum Aquifer is comprised of several regions within the larger Triassic Dockum Group sediments. It is situated beneath large portions of the Ogallala aquifer in west Texas and east New Mexico with the Texas portion of the aquifer shown in Figure 3. The aquifer is mostly confined except in outcrop regions located in the central east and in north where the aquifer is divided by the Canadian River (contains some of the area in this study). Figure 3b illustrates the relationship between the Dockum group sediments generally and the water-bearing sub-group labeled as “Best Sandstone” by Bradley and Kalaswad [34]. The dark region above the Best Sandstone is considered to be fine-grained impermeable aquitard. The Dockum is confined in areas such as that shown in the cross-section, and this includes most of the region in this study, except where samples were taken near the Canadian River in the north. This is not the case in the far south where it is overlain by Pecos Valley and Edwards-Trinity aquifers (not shown). Instances where either Dockum, Ogallala, or both waters could be used in an application would thus only exist in the confined sections of the Dockum as was chosen in this study. Outcrop areas outside of these co-located areas only have access to Dockum water. The Dockum boundary shown indicates Dockum water at <5000 mg/L TDS. Other areas of the Dockum with higher TDS do underlie the Ogallala aquifer but not in the areas of this study.
Bradley and Kalaswad [34] performed an extensive review of all data on the Dockum which were available at that time. They found the aquifer to be variable in many respects with some important aquifer property range values which are necessary to understand for resource development. The well yields of the Dockum range from 1.9 to 9500 L/min with transmissivities of 5.2 × 10⁻⁵–4.9 × 10⁻³ m2/s. They judge regionally that the aquifer yields are generally low with some maxima that might encourage development. In addition, these authors estimate the annual recharge as 38 × 106 m3 occurring from rainfall in outcrop regions. With a total estimated aquifer volume of 288 × 109 m3, the amount of rainfall-based recharged relative to the total volume is <0.02%. At this rate of recharge, it would take 7600 years to change over the entire Dockum aquifer water volume. The fact that the regions farther from the outcrop areas likely do not see much of this recharge (source) along with the low percentage recharge indicates that much of the Dockum water is fairly old and is likely to remain so.
3.1.2. Water Quality Investigations in the Dockum
Concerning water quality specifically, it is generally known that the Dockum varies greatly in TDS with known water volume estimates corresponding to particular ranges of freshness. A frequently used boundary for the Dockum is the <5000 mg/L TDS line which encompasses 59% of the aquifer’s volume followed by 5000–10,000 mg/L TDS water (15%) and some water which is >10,000 mg/L (26%) [34]. Langman and Ellis [38], looking at a particular area of the aquifer in east New Mexico, reported specific conductivity values ranging from 1680 to 18,700 µS/cm (1100–12,200 mg/L TDS equivalent) at wells only within 2–3 miles of each other. Their study was on the aquifer fringe, and yet TDS varying more than 500 mg/L over short distances were not unheard of. Karim et al. [16] interpolated many water quality parameters over all of the Dockum in Texas and found an estimate of TDS by aerial coverage of 12.5% for TDS > 10,000 mg/L. Differences between their TDS water fractions and those of Bradley and Kalaswad can likely be explained by one estimate based on aerial coverage and the other based on total water volume.
A look into more detailed water quality constituents finds that the hydrochemistry is generally classified as mixed cation-HCO3 in the north, NaK-ClSO4 in the central region, and CaMg-mixed in the southern region [34]. The study area in this paper is considered to be north Dockum with the most southern parts of the study in the central Dockum. In eastern New Mexico [38], the dominant water type at the aquifer fringe was found to be Na-Cl, which could be expected to be different from Bradley and Kalaswad’s assessment as they focused predominately on Texas. Scanlon et al. [41] characterized the hydrochemical transition in Dockum water as low TDS Ca-HCO3 in the north with TDS increasing as one moves southward to Na-Cl in the south.
Some studies looked specifically at radiation for concerns of human health or mining. The potential for mining for uranium (U) or vanadium (V) in the Ogallala in particular is linked to the Dockum because it is thought that the southern Ogallala contains more mineable constitutes due to upflow from the Dockum in that area [35]. General levels of alpha () and beta () radiation in the Ogallala agree with this assessment, as there is higher alpha activity in the south. Hudak [36] suggests that the effects of pumping in the lower third of Ogallala (overlying southern half of the Dockum) have contributed greater Dockum upflow than in the north. The general reported alpha and beta activity directly in Dockum water ranges from < 2 to 500 pCi/L and = 0.86–183 pCi/L [34]. The highest values provided were in Deaf Smith County, a county used for several samples in the current study.
The evidence for cross-formational flow between the Dockum and Ogallala is also an active area of research interest. There is more discussion generally about Dockum flow upward into the Ogallala than the reverse. The trend may not be area-wide but rather an indication of studies being most interested in how Dockum water affects Ogallala water quality than the interplay between the two. Hudak [36] considers that the general trend in the aquifers is for upward flow to occur in the lower third of the Ogallala within Texas due to reduced hydraulic head from pumping in that region. The trend they observe agrees with the assessment of Hall et al. [35] which explains the presence of more U and V in the southern Texas Ogallala. They conclude that upward flow from the Dockum in the south transports U and V into the Ogallala in that region and that this is not happening substantially in the north. Rather, in the north, the cross-formational flow of the Dockum is downward into the Permian sequence. The assessment of Langman and Ellis goes as far as to say that much of the difference in water quality in the Ogallala across the Texas–New Mexico region is due to cross-formational flows. Many of these flows affecting Ogallala Aquifer water quality would be to or from the Dockum. Lastly, Scanlon et al. [41] looked carefully at some Dockum–Ogallala connections to explain arsenic (As) concentrations found in the Ogallala. They observe that a 500 mg/L TDS line exists between northern and southern Ogallala regions. They contend that higher TDS water from the Dockum does flow upward in the south, and that this does not seem to be the case in the north. As well, the pre-developed saturated thickness in the Ogallala in the south is not as great as in the north, and this allows for less dissolved salt dilution in the south versus north. Upflow of Dockum water is also given as a reason for increased As at some southern Ogallala locations due a counterion effect whereby Ca2+ is switched with Na+ leading to increased dissolved phase mobilization of As.
Put together, the evidence suggests that in the southern Ogallala, there is upflow of Dockum water into the Ogallala while in the northern Dockum water generally flows to deeper strata or simply remains confined on both top and bottom. There is no particular investigation or evidence yet given of the Ogallala flowing downward into the Dockum and thereby altering Dockum water quality, but that does not mean that it is not occurring in some places.
3.1.3. Usefulness and Development of Dockum Groundwater
A few studies specifically concerning the usefulness of Dockum groundwater have looked at its use for hydraulic fracturing, irrigation, and municipal drinking water supply. A study on the western side of the aquifer [37] looked at water quality potential for desalination as the Dockum in New Mexico was one of three more promising brackish aquifers there. Researchers examined the scale-forming factor (SFF) according to differences in water quality seen in New Mexico using the USGS PHREEQC model. Out of three aquifers, the Dockum had the largest variation in SFF which the authors attributed to higher compositional variation generally and perhaps an absence of strong water–rock interactions. A related study in Gaines County, TX [39] considered the energy requirement for a small community to develop Dockum groundwater for municipal use via RO treatment. That study showed how a smaller town might combine funding to afford the treatment and invest in a 50 kW wind turbine to help offset increased energy needs.
The study of Karim et al. [16] examined the recent water quality history of the entire Dockum region within Texas, both inside and outside of the 5000 mg/L downdip region [34,42] using a Fit-For Purpose (FFP) framework. They interpolated all known water quality data onto a spatial grid over the Texas lateral extent of the Dockum. They then examined water quality parameters according to criteria for municipal, hydraulic fracturing, and irrigation according to crop type. They determined that it was frequently viable for hydraulic fracturing and that much of the aquifer in areas away from urban centers were close to being fit for municipal use. The most frequent problematic water quality criteria for municipal use were TDS, hardness, radionuclides and Langelier Saturation Index (LSI). For agriculture, they found that sodium adsorption ratio (SAR) and general salinity made its direct water use unlikely in many cases though in the northern part of the aquifer, near the area of this current study, Dockum water could be favorable for cotton production. That area of the Panhandle is not a traditional cotton growing region but production has increased in that direction [43] for reasons unrelated to presence of the Dockum.
3.2. Historical Trends in Well Drilling and Use
Out of the total number of public well records, 66% (Ogallala) and 62% (Dockum) provided a drilling date. A small set of well records are for multiple aquifer unit wells, and these were excluded. The trends in well drilling according to annual well drilling rates are shown in Figure 4. Only wells which had a drilling date and were in single units are incorporated. Due to a lack of drilling dates in the records, about a third of all wells for each aquifer had to be excluded. Trends shown in Figure 4 certainly could be different if all wells were able to be incorporated, but the historical record in the GWDB does not provide a means to ascertain these dates. Thus, including the undated wells would require speculation and subjectivity which might create more problems in the analysis than simply excluding the undated records. The periods of highest drilling rates are indicated in each time trend.
The earliest wells were in the 1910s (Ogallala) and 1920s (Dockum) with 2% or less of the total recorded wells installed before 1930. The majority of Dockum wells were drilled beginning in the 1960s with drilling continuing at a relatively high rate for the size of the aquifer (7.9 well/yr 1950–1980 representing 63% of all Dockum wells). After 1980, the rate of well drilling decreased dramatically at rates of 1–2 well/yr 1980–2010. There was, however, one year (2008) where an unusual nine (9) wells were drilled. The Ogallala experienced a similar rise in the number of wells drilled, but that rise began a decade earlier in 1950. For the period 1950–1975, the mean well production rate was 108 well/yr, and during that period 80% of all wells on record were drilled. In more recent decades (1980–present) the new well drill rate has been fairly steady at an average of 5.3 well/yr. Both aquifers experienced a rapid increase in well drilling beginning in 1950, and both still see at least some continued drilling. However, the Ogallala is the only aquifer of the two to continue to see high numbers of wells drilled, and it still has not seen a complete leveling off even to the present day.
The reason that the wells were drilled in each aquifer is important because the use of the water is related to the perceived water quality of each aquifer, the expected yield, and the cost of drilling and well development. The historical drilling record shows a significant decline in the rate of new well drilling right around 1975–1980. Thus, we analyzed the use category of a well before and after 1980 as indicated in Figure 5. The GWDB provides a “WellUse” field which we presume to be the primary reason that the well was drilled.
The top well use categories before 1980 for Ogallala wells are irrigation (77%), unused (11%), and public supply (5%). After 1980, the reason for well drilling was given as irrigation and public supply (both 27%) following by unused (25%) and domestic (14%). For the Dockum aquifer, a smaller record is available because there are simply fewer Dockum wells drilled. In the Dockum before 1980, the main uses for newly drilled wells were irrigation (29%), livestock (23%), and unused (20%). After 1980, the reasons for drilling new Dockum wells were irrigation or domestic (26–28%) followed by public supply (18%). In the Ogallala, there was such an interest in irrigation wells before 1980 that wells were drilled almost exclusively for that reason. New well drilling has slowed since that boom period, and now wells are drilled for a mixture of reasons. Drilling for irrigation still occurred in recent decades, but it was just one of many reasons given for well development. In the Dockum, only a maximum of a third of new wells over the entire time period were for irrigation. The aquifer has been consistently used for domestic supply and public supply. Both of these categories increased post–1980. As a number of the wells we used in this study were from public supply, this trend towards more use of Dockum for drinking water supply post–1980 agrees with general observations in this region.
3.3. Historical Data Groundwater Comparisons
3.3.1. Water Levels
We summarize the water level trends in wells which had sufficient record to span the 51-year period 1970–2021 in Figure 6. The wells are organized according to aquifer and spatial region where spatial regions are defined by county boundaries as previously shown (Figure 2). All water levels were adjusted by subtracting the mean water level relative to the land surface in order to organize them using a similar scale. In addition to the data plotted, we also performed a linear regression analysis of water level change versus sample year to verify the presence and strength of the trend (Table 2).
Visually, the Ogallala wells across all three spatial groups are decreasing in nearly every well that we examined in the historical record. Not all wells are decreasing equally either within a spatial group or between spatial groups as would be expected due to differences in aquifer transmissivity and local pumping rates. For the time period, generally the Ogallala draws down most in the north region and least in the south with the central region in between. The north region frequently exceeds annualized drawdowns of . In the last decade (2010–2019), drawdown in the north seem to have accelerated, and to a lesser degree in the central groups. This is in contrast to the south where water levels have become relatively stable or decreased at a much smaller rate of 1–2 cm/yr.
Dockum well records in the historical data are not as extensive, but some trends can still be found. Spatially the largest water level changes are in the southern spatial group, the smallest in the central group, and those of the northern group are difficult to determine due to a paucity of data. The one well which had enough records to examine showed an average decline of −3.3 cm/yr. This northern region is above the Canadian River and close to Dockum outcrops. It is possible that water use in this area, if it is increasing, is replenished through the nearby outcrop. In the central group, the water levels hold steady, and yet this area has seen some of the most extensive well development in recent decades. The growth in Dockum water use in this region is one of the reasons why the central group coincides with the field study area. The gray line for well 1125502 is seemingly more erratic than the rest in the south group. A detailed look at this well shows regular increases of 10–20 cm/yr 1980–2010 with an unusually large drawdown in 2015–2016 of −98 cm/yr.
Comparing the water level trends of one aquifer to the other, generally the Ogallala aquifer is consistently being drawn down over the last 50 years. In the south and central part of the region, the drawdown has diminished or ceased while in the north (north of Canadian River), the drawdown has accelerated. Over the same period, the Dockum has seen some decline or has remained stable on its water levels. It could be supposed that as Dockum wells are used more Ogallala wells might be used less. In areas where Ogallala water level drawdown is decelerating or stable, it is not clear that the Dockum is being used more to compensate. If the Dockum use in these regions is being increased as is commonly supposed, the water levels for the last two decades do not indicate that it is being mined in an unsustainable fashion. The fact that both Dockum and Ogallala water levels in the north region are being drawn down appreciably suggest that, in this region, perhaps the use of both aquifers is increasing.
3.3.2. Water Quality
We examined aggregate water quality parameters for 1990–2021 for the study region of the northern Dockum with summary results in Table 3 and Figure 7.
Looking within each aquifer, the north group stands out from the other two in some important respects. The north group Dockum is characterized by lower temperature, lower SPC, the highest hardness, and lowest SAR. Many of these conditions are more favorable for blending in irrigation, especially the SAR < 1. The main difference in the central and south groups is the increasing SAR in these regions with very high SAR and SPC in the central region. One reason why the SAR may be so variable in the central region is that it contains the outcrop in the vicinity of the Canadian River.
The Ogallala is much less variable in general compared to the Dockum. The distribution of all parameters is much narrower in each spatial group in the Ogallala with the exception of pH. There is a general trend of increasing salinity in the Ogallala north to south, as has been observed by others [41], which follows a similar trend to hardness. One spatial group in the Ogallala that stands out is the central group which mean SAR of 7.36 (meq/L)0.5. As the highest Dockum spatial group is also central, the SAR values may indicate more sharing of Na+ water here compared to other locations.
3.3.3. Summary of Historical Aquifer Data
The Ogallala and Dockum aquifers in the northern Dockum region have similarities in well development. They both experienced a period of high well development in the time period 1950–1980 which coincided with the expansion of irrigated agriculture in the Ogallala region. The number of wells was far greater in the Ogallala. Possible reasons for this include more knowledge and greater interest in the Ogallala aquifer for many water users [44], less certainty of finding water sufficient quality and well yield in the Dockum [45,46], and the additional cost associated with drilling a deeper well. The timing of the increase in the Dockum, shifted 5–10 years later, may be for similar reasons. During the time of high drilling nearly all wells in the Ogallala record were drilled for the express purpose of irrigation while there was a mixture of water use types in the record for the Dockum. Less information on the Dockum and its general variability in both yield and water quality [47] may have encouraged more experimentation with what the water could be used for.
The use of the Dockum and Ogallala aquifers as determined by well level records shows a characteristic decline in Ogallala water over the entire north Dockum region as water extraction exceeded recharge. Dockum water during the same period did not draw down as much or at all during the same period. Dockum wells were in place during that time and as indicated by well development records, and so they could have been drawn down greatly as well. It may be that the fact that the water uses were different and more varied in Dockum wells (as evidenced by Figure 5) made it such that water was not used as rapidly as might be the case if irrigation was the primary use.
Looking at water quality, generally Dockum water is less favorable in addition to being deeper and thus more expensive for well development and on-going extraction. Dockum water is either a saltier freshwater (500–1000 mg/L TDS) or certifiably brackish (>1000 mg/L TDS) throughout this area, has higher pH, is more resistant to pH change (higher alkalinity), and has higher SAR than Ogallala water located in a similar place. Dockum water does have the advantage in each area of a much greater reduction in hardness compared to the Ogallala though it is still considered generally “hard” by most standards (>120 mg/L CaCO3) [48]. We did not examine water quality trends in time though others have shown that the Ogallala has become saltier as it depletes [6]. It may be that the Dockum has maintained its quality in this collocated area as the Ogallala water quality has diminished. Even though Ogallala water quality has declined, in most cases, it is still preferable to the Dockum for many uses. The record shows that the Dockum could become more valuable and viable for blending as the Ogallala is more difficult and costly to extract with diminishing quality compared to a Dockum aquifer which does not seem to have diminished greatly in hydraulic head.
3.4. Recent Groundwater Monitoring Data
3.4.1. Aggregate Water Quality
We examined aggregate water quality parameters between Ogallala and Dockum groundwater wells from recent quarterly sampling in 2014–2015. First, we examined the differences in water quality at a higher level using general statistics for all wells in the study area as provided in Table 4. Second, we looked at the differences in the aquifers for similar locations through a series of plots in Figure 8, meaning those wells that are close enough in proximity that many land owners could consider using either water source individually or blend the two according to their needs in total water flow or water quality.
Considering the entire group of samples, the SPC is higher on average in the Dockum Aquifer by a factor of two and range of values is also much higher (500 mg/L range in Ogallala compared to 1600 mg/L range in Dockum). In total alkalinity (TA), the mean between the aquifers is not terribly different, but the range again is much greater in Dockum groundwater. Alkalinity is higher when the total amount of carbonate species is higher, and the presence of more carbonate species generally increases pH. At the same time, the presence of more TA indicates that buffering capacity is higher. Increased buffering and increased pH often seem to be the case in Dockum waters as compared to Ogallala. The upper range of pH is higher in Dockum water (9.4 vs. 8.4) and the mean pH is also higher in Dockum samples. Concerning variability of total alkalinity, Dockum waters certainly have some instances of very high alkalinity (>300 mg/L as CaCO3, 56% of samples) and thus high buffering. At the same time, a smaller fraction of Dockum samples (6%) have total alkalinity fairly low (<125 mg/L as CaCO3). For these low alkalinity samples, their buffering capacity is even lower than the lowest values for Ogallala groundwater (minimum 156 mg/L as CaCO3).
The SAR and the total hardness (TH) in these samples are related according to their definitions. SAR is a ratio between multivalent cations of Mg2+ and Ca2+ relative to monovalent Na+. Total hardness is primarily a measure of the charge equivalent concentration of Mg2+ and Ca2+. Dockum water is more variable in TH with a mean value that is half of Ogallala groundwater. At the same time, the mean SAR for Dockum groundwater is very high at a value of 19 while Ogallala water has a mean value almost 20 times less (1.3). In general, sodicity effects must be managed at value of SAR > 9. All of the Ogallala groundwater we sampled was <9 SAR. The range and the overall values for Dockum groundwater were much higher with 65% of Dockum samples at SAR > 9. The trends of lower total hardness in the Dockum combined with higher SAR are related. The relative and the total amount of Na+ increases in many Dockum samples while at the same time Mg2+ and Ca2+ decrease. Thus, the Dockum has softer water compared to the Ogallala, but this coincides with a general increase in sodicity hazard.
We next chose to examine spatial differences in Ogallala and Dockum waters using spatial groupings as provided in Figure 1. Each spatial grouping has at least one well sampling location that is a Dockum well and one that is Ogallala. (Note these groupings are different from the historical analysis groupings which covered a much larger area.) All groupings have at least two wells for each aquifer in the group except for the west group, which only has one well for each aquifer. These groups are used for Dockum and Ogallala box plot comparisons on different aggregate water quality parameters as given in Figure 8. The logic behind the comparison is that a single property owner might have access to both aquifer waters. They would want to know salient differences in their two water resources.
Examining each water quality parameter in turn, we find differences between Ogallala and Dockum waters within the same group, differences in the same aquifer but in different spatial groups, and spatial trends in the way in which common location Ogallala and Dockum waters differ from each other. For SPC overall values, the trend is that SPC is higher in Dockum waters as compared to Ogallala waters within each spatial group. The higher TDS is in agreement with the overall trend in higher salinity for Dockum waters. However, the degree of the difference is certainly different. The ratio of mean values of Dockum TDS to Ogallala TDS within the same spatial group ranges from 1.3 to 3.4 with the highest value being in the north and the lowest in the west. The north, while it has the highest SPC multiple relative to Ogallala water, it is not the highest absolute difference. The greatest absolute increase in SPC is in the southwest region, where SPC is on average 1150 μS/cm (750 mg/L TDS equivalent) higher in Dockum groundwater as compared to Ogallala.
Considering SPC variability, the plots show distinctly that there is much more variability in Dockum waters over Ogallala waters within each spatial group as well. This is certainly true in the north, central east, and central west groups where interquartile ranges (IQRs) in Dockum are 540–750 μS/cm SPC compared with IQRs of 38–200 μS/cm SPC in Ogallala waters.
SPC variability for Dockum water arises because of both differences in time at the same well location and differences between locations in the same aquifer. Table 5 presents standard deviations in differing Dockum spatial groups when time is held as constant, when location is held as constant, and when both are allowed to vary for SPC (μS/cm). The central east group, which has a high amount of Dockum samples (n = 14), has the same location, a temporal standard deviation of 160 μS/cm (four sampling events) with the same season, across a location standard deviation of 450 μS/cm. Within this spatial group then, the high IQR for SPC is due in a larger measure to variation in location rather than variation within the year. The same greater interspatial variation is seen in the central west and the study area as a whole. Contrasted with this is north group where temporal standard deviation is 390 μS/cm and spatial standard deviation is 380 μS/cm. For north and southwest groups, variation is relatively even in both space and time. Thus, the source of large salinity variation as measured by SPC in Dockum groundwater is sometimes due in greater measure to spatial variation over temporal variation, and in other instances there is an equal contribution of variation from both changes in time and changes in space. The inter-annual variation in water quality at a single Dockum location could make blending applications and other suitability evaluations more difficult because that variation could alter the values under which the water is intended to be used.
Looking at aquifer differences in TA, the north through central west groups show little difference between Ogallala and Dockum aquifers. Mean Dockum to Ogallala ratios (TADock/TAOgalla) range from 0.9 to 1.3 while they are 1.4–1.7 in the southwest and west. All locations are well buffered in general at total alkalinity >200 mg/L as CaCO3. Looking at all of the samples seasonally over the one-year time frame, pH changes are in most cases only ±0.2 pH units for most events with just a few changing as much as 0.5. In instances where there are larger TA differences, Dockum waters are higher. These Dockum samples also have higher pH from higher total carbonates compared to same location Ogallala waters.
Figure 8 reveals that total hardness is one of the biggest areas of difference in the two aquifers within each spatial group. With the exception of the north spatial group, the hardness seems much lower in the Dockum compared to Ogallala water with Dockum-to-Ogallala ratios of 0.04–0.30 (Ogallala 3–25× harder than Dockum). Contrastingly, in the north group, the ratio is 1.72 (Dockum water harder than Ogallala). Looking at the absolute level of hardness, in general many Dockum waters are relatively soft, having total hardness < 90 mg/L as CaCO3 (31/50 = 62%). For the southern Great Plains region, 90 mg/L as CaCO3 is relatively soft. Compared to Ogallala waters in the same areas, TH > 200 mg/L CaCO3 in 87% of all samples. In the four softer water regions (central east–west), Dockum waters have a cationic composition that is low in multivalent Ca2+ and Mg2+ while at the same time having higher overall TDS. The additional cations corresponding to high SPC come from higher quantities of K+ and Na+.
As mentioned, the north group is very different comparative hardness between Ogallala and Dockum waters. This entire area shows that the locations that are called Dockum are in a region where the distinction between Dockum and Ogallala units is less easy to discern. Indeed, in places where there truly is a Dockum outcrop, there is really only one water-bearing unit at all. The well depths in the north are also much shallower than other Dockum locations we sampled, and the locations are very close to the Canadian river. Northern differences from other Dockum locations and higher variability are likely a result of closer surface hydrologic interactions.
Generally, SAR is higher in all of the spatial groups for Dockum waters over Ogallala with the increase ranging from 10 to 24× higher in the Dockum. The large increase might not be as much of an issue if there were not so many SAR values > 9. However, out of all Dockum samples 66% were at SAR 9 or greater. A few samples in the central east were lower than this, and all of the north group samples had SAR < 9. For Ogallala samples, 89% had SAR < 2, and the maximum value was only 5.1. The southwest group stands out as having very high SAR at 56 ± 7.1 (mean ± 95% conf). There is no possibility of this water being safely used for any type of irrigation without substantial treatment or modification. The risk to soil structure and soil health is too great.
3.4.2. Detailed Hydrochemistry
We now examine Dockum and Ogallala waters at the more detailed level—the results of individual water constituents. We first used Piper diagrams to classify aquifer waters in hydrochemical facies (Figure 9, Table 6). We then employed principal component analysis (PCA) to examine common constituent groups which vary together to better discern how and why water quality is changing in space, time, and between aquifers (Figure 10, Figure 11 and Figure 12).
Concerning alkali type (classes 1 or 2), Dockum samples were nearly all alkaline-dominated (76%, class 1 in Piper diagram) by an average Na+K total cation fraction of 77 ± 25% (mean ± sd) while Ogallala waters were predominantly majority alkaline earth (91%, class 2 in Piper) at a Mg2++Ca2+ cation fraction of 73 ± 11%. There were more exceptions to the overall trend in the Dockum samples compared to Ogallala. In the north area, Dockum wells (four of them, tan filled diamonds) exhibited a mixture of trends. Two locations were consistently alkaline predominant (61–90% Na+K). One location was always right around 50% of each cation type. Another location was consistently alkaline earth dominant (21–23% Na+K). There was also one Dockum location that was evenly balanced between alkaline and alkaline earths in the central east group.
Looking at cations more specifically, the reason that Ogallala samples are more often majority alkaline earth over alkaline is that the cationic description for nearly all samples is either >50% Mg2+ or mixed cation (classes 6 and 9 in Figure 9). In Dockum samples most of the waters (76%) are solidly in cation class 7 (Na+K > 50% of cations) with remainder in mixed class 9. In general, the further south and west in the study area that one moves, the higher the fraction of cations which are Na+ for Dockum. The southwest region had the highest concentrations of dissolved Na+ at 420–520 mg/L.
In acid types (strong class 3 or weak class 4), all Ogallala samples were weak acid-dominant while Dockum samples were more evenly split between strong and weak acid (39%:61% strong-to-weak). Spatially, Dockum water samples were almost entirely weak acid-dominant in southwest and west groups (91% for both together) while the other three spatial groups were more evenly mixed (51% weak acid). Specifically, the north group was more strong acid (67% of samples) while central west was split exactly evenly, and central east was more weak acid (75% of samples). Combining these trends with aggregate parameters, the southwest and west groups (weak acid predominant) were also both low in total hardness for all samples (<45 mg/L as CaCO3 TH) and generally had high SAR and total alkalinity as well. These three characteristics are not entirely unique to only west and southwest groups (central west was also high in SAR and low in Total Hardness). It is fair to say that the data do show that the proportion of weak acids over strong does increase moving from east to west and north to south in the Dockum aquifer within the study area. The north group does not always follow that trend because water quality there is so variable generally (in the outcrop), but the spatial trend does lean as described.
A more detailed look into anionic composition for the waters shows that, as expected, Ogallala water is dominated by HCO3- (weak acid). In the Dockum, the largest anion class is like the Ogallala, class 6 HCO3-, but a sizeable amount is still in classes 9–11 as mixed anion, Cl-, and SO42- dominant. The Dockum water table samples (filled in tan diamonds in Figure 9) have the most variation of out of all samples and have individual sample results which are in all four anion classes (6–9).
The facies mapping in the central diamond shows nearly all Ogallala samples decidedly in class 13 Mg-HCO3 with a smaller proportion of samples in the central mixed region (17) due to elevated quantities of alkali cations. In the Dockum aquifer, it is seen that the unconfined outcrop region samples (all in the north) vary between mixed classes (17–18), one sample which is Mg-HCO3 like Ogallala waters, and a few samples which are class 15 Na-Cl. Nearly all of the confined Dockum samples are either Na-Cl or Na-HCO3 type. To the degree that the unconfined Dockum region represents recharge generally, it makes sense that these samples are more varied in water quality (due to seasonality, rainfall, and potential exchange with the nearby Canadian River) and that they are more dominant in alkali earth divalent cations, likely derived from surface dolomitic minerals. When Dockum waters have descended beyond the recharge zone and into the confining unique, they have experienced a marked increase in Na+, having lost nearly all of their alkali earths, presumably through ion exchange in soils. Any SO4 and Cl ions, though they may not have been reduced in absolute terms, have been dwarfed in relative terms by HCO3- arising from mineral dissolution.
Figure 10 shows in two panels how the constituents in the PCA work together to reduce the overall number of dimensions from eight to three by visualizing the constituent loadings per factor. Factor 1 (F1) has high positive loadings from , , and and moderate negative loadings from and . Factor 2 (F2) has high positive loadings from , , and and a moderate positive loading from . Factor 3 (F3) has high positive loading from fluoride and a moderate positive loading from . It also has a slight negative loading from . A general interpretation of these factors, by their constituents is as follows. F1 represents the influence of multivalent cations and nitrate, while at the same time deemphasizing sodium and boron. F2 represents the collective influence of sulfate, sodium, boron, and to a lesser degree bicarbonate. Additionally, F3 is strongly indicative of fluoride’s influence with some co-influence of bicarbonate.
Looking at the two figure panels, it is also possible to see how the constituents cluster together generally. Boron and sodium are highly correlated with each other in all three factors and in the dataset generally (Pearson R = 0.85, p < 0.01). Bicarbonate is closely connected to their cluster with the important distinction that moderate loading on F3 while B-Na do not. Sulfate is also closely correlated to B-Na with the difference in it being that it loads much more strongly on F2, and it has no negative loading on F1. Additionally, highly clustered is magnesium, calcium and nitrate. Magnesium and calcium are more closely correlated to each other than to nitrate. Fluoride is the most different from all of the other variables. It loads weakly on every factor except for F3 where it correlates some with bicarbonate.
PCA score plots with box plot distributions by factors are presented in Figure 11. The use of the score plots (a, b) gives some insight into aquifer types and clustering that occurs from unsupervised PCA. Ogallala wells cluster in the center of the three-factor space. Most of their variability is captured in F1 indicating that their water quality variation exists primarily in , , and . The Ogallala cluster exhibits only minor variation in F2 and slightly more variation in F3. Thus, the quantities of, , , and do not vary greatly amongst all of the Ogallala wells. This is seen more clearly in Figure 11d,e where the interquartile range for each of these five constituents in the Ogallala wells is fairly small. For example, in panel (d) it can be seen that the IQR for and varies much less compared to both Dockum water types. The order of magnitude in these IQR is 0.16 and 0.30, respectively, compared with values of 0.35–0.52 and 0.61–0.85, respectively, in Dockum waters.
The Dockum confined wells cluster strongly due to strong invariance in F1, the factor for multivalent cations and nitrate. Looking at Figure 11c, the overall concentration of these and ions is generally lower with values mostly at or below 10 mg/L. Their variation, however, is still substantial with an IQR of 0.51 and 0.75 log units, respectively. is lower in this class of water compared to the other two, but its IQR is also high on the scale at 1.00 log units. is the highest in Dockum confined waters, and, because sodium is negatively loaded onto F1, this also contributes to these waters bearing consistently negative scores.
What differentiates samples in the Dockum confined waters is F3 scoring and F2 to a lesser extent. Though F2 explains more of the overall variation in the dataset (30% compared to 20% in F3), F3 elucidates more differences in Dockum confined waters.
Figure 12 illustrates the differentiation in both Dockum confined and water table groundwater. In the figure, we have divided the space of fluoride and bicarbonate results into four quadrants with thresholds of above or below 2 mg/L F- and 300 mg/L HCO3-.
For the confined Dockum groundwater, 71% of all of the samples are above both thresholds which would yield a high F3 score as can be seen in Figure 11b where a sizeable majority of confined Dockum samples are positively scored on F3. Additionally, what can be seen in Figure 12 is that, even though most of the confined Dockum groundwater results are in the upper right quadrant, there is a wide spread of concentration values for both fluoride and bicarbonate, which corresponds to high variation in F3.
To summarize the PCA, variation in Ogallala groundwater quality in this region is determined in large part by what might be conceived of as a common hydrogeochemical source or process which is highly correlated to Ca, Mg, and NO3. Despite all of the water quality constituents, these three analytes differentiate Ogallala water quality profiles more than any other. Since NO3 is sourced from infiltrated source water, it is logical to suppose that the significance of this common factor is that it indicates the strength of the connection to surface infiltration. For the Dockum, the unconfined water quality is differentiated mostly by the same ions as the Ogallala with the addition of and . Between confined and unconfined Dockum sections, the differentiation comes from and . Fluoride in particular is known to be high in the Ogallala and is supposed to be sourced from volcanic ashes mixed in with Ogallala sediment [49,50]. It does not to appear to be known if would be found in native Dockum sediment, and thus it seems possible that higher in the confined Dockum sediment indicates cross-flow between the Ogallala and Dockum and that something about the presence of is connected to a correlation with .
3.5. Potential Aquifer Blending Scenarios
It is not difficult to determine the amount of Ogallala water that might be conserved through blending in Dockum groundwater. As long as the amount of water needed for irrigation and well yields are known, an optimum can be found between the cost of pumping deep versus shallow water and the amount of fresher Ogallala water that one would want to conserve. However, not all blend rates of Ogallala and Dockum groundwater at a particular location are recommended. If blending produces water which lowers crop yields too much due to salt, harms soils from sodicity, or introduces too many toxics, then that blending should not be undertaken. Therefore, we looked at the blending of these co-located groundwater sources to see which blends are recommended from the perspective of water quality.
To do this, we used the USGS PHREEQC model to perform a blend analysis on Dockum and Ogallala groundwater from samples collected during the 2014–2015 study period. We picked a pair of Ogallala and Dockum sample results collected from the same period of time. For each sample, we put in 15 individual groundwater constituents, sampling pH, and temperature. We then used the MIX subroutine in PHREEQC to mix the field sample result at ratios of 0%, 10%, 20%, …, 100% Ogallala groundwater, the balance being the Dockum sample at the same location (eleven (11) total blends with two of them being the pure groundwater). We took the resultant simulated groundwater concentrations and compared them according to several parameters which are relevant to irrigation in some way. Those comparison parameters are saturation indices (SI), total dissolved solids (TDS mg/L), sodicity (SAR (mM)1/2), boron (B mg/L), and nitrate (NO3 mg/L). For salinity of the final blend, we used the Marion–Babock equation (shown in Equation (1)) to relate the predicted ionic strength to the SPC (μS/cm).
In the equation I is ionic strength in mole/L and κ is electrical conductivity in unit of mS/cm. The equation is valid up to ionic strengths of 0.2 M [51]. This criterion was satisfied for all blends used. Furthermore, we took the individual predicted ion concentrations to determine TDS (mg/L) by adding up the mass concentrations of all species (Equation (2)) and practical SARp (mM)1/2 from its standard formulation (Equation (3)) [51].
Total dissolved solids (TDS) are determined as the sum of all quantified individual species (ci) in units of mg/L from species I = 1 to the total number of quantified species in the PHREEQC simulated blend (n). For SARp, the concentration of sodium, calcium, and magnesiusm must be in mM in order for SARp to become the standard value commonly used in irrigation water and soil assessments.
3.5.1. Examination of Saturation Indices in Blending
We examined the saturation indices of the resulting groundwater blends from PHREEQC for the primary purpose of understanding corrosion or scale on irrigation systems. Any system with flowing water and increased mineral saturation can deposit scale given enough time and with increasing temperature [52,53,54]. The definition of the Saturation Index (SI) for a particular solid phase product that could deposit from solution is provided in Equation (6). It is related to the ion activity product (IAP) and equilibrium constant (K) defined in Equations (4) and (5).
For any gas or mineral product that could come out of the solution, there is a unique SI. The SI is based on the predicted activity product of all dissolve species (ai) divided by the activity of the solid (asolid) which is taken to be unity since the solid phase of the mineral is its reference state [55]. We took it that SI > 0.20 was a supersaturated (likely to precipitate) condition, SI < −0.20 was an undersaturated (likely to dissolve) condition, and SI = −0.20–0.20 was an equilibrium condition.
Table 7 shows a summary of the results for supersaturated minerals of calcium, CO2, and iron. As these elements are common scaling species in water systems, and they were frequently present in the groundwater we sampled, looked at the saturation state of just ten species. Nine were solid minerals, and one was gas (CO2).
As indicated in the table, out of the ten examined species, there were just five that were predicted in PHREEQC to be supersaturated and thus likely to precipitate. They were the Ca species (aragonite CaCO3, dolomite CaMg(CO3)2) followed by iron(III) species (ferric hydroxide Fe(OH)3, goethite FeO(OH), hematite Fe2O3).
The table presents the trends in a north to southwest spatial trend. In the north, all of the five commonly supersaturated species were supersaturated at nearly all blends. The iron species in the north had the greatest SIs (>7 in all blends) with smaller SIs for calcium species. For the iron species, all blends, even 100% Ogallala water had a high likelihood of iron mineral precipitation. In this region, in the area of the Dockum outcrop, Fe concentration was not particularly constant or greater than in other areas. The details of the redox chemistry here are simply favorable for these iron species. The central west region was also supersaturated for iron precipitates (SI > 7 for 0–90% Ogallala) but only when some blend of Dockum water was included. The other regions all had a likelihood of calcium precipitate species forming but generally when the fraction of Ogallala water was lower (40% or less). The SIs in all of these other regions were much lower (SI < 1.1 in all cases), and so the precipitation potential is not as high as in the central west and worth.
There are two major trends from the research into SIs. One is that generally the inclusion of more Dockum water in a blend increases the SI for Ca and Fe species. Thus, the more Dockum water used, the more likely it is that scale in water distribution systems will form. A second is that the likelihood of Fe mineral scale is higher, and this type of scale is greatest in the north and central west of the study area. In these areas in particular, blending the waters at virtually any blend level without considering water conditioning that lowers scale potential seems likely to cause problems of buildup over time.
3.5.2. Blending Results Relevant to Plants and Soils
The use of SIs is related to risks to water distribution and irrigation equipment. The other parameters which we used relate more directly to crop growth, soil health, and groundwater preservation. Figure 13 shows an example of the typical pattern seen in the modeled blending scenarios. The figure shows that the relationship between most parameters is a proportional mixing between the pure Dockum sample (0% fraction of Ogallala) and the pure Ogallala sample (100% fraction of Ogallala). Even though the blends are very close to a strict volume weighted average, we did not obtain the data shown here from a volume weighting technique. The blends shown are a result of geochemical modeling in PHREEQC. There were slight deviations from volume-weighted averaging due to speciation changes. For example, Ca2+ put in as free ions in model inputs will distribute to any of eight (8) other polyatomic calcium-containing ions. The more complex relationship in the blending scenario is the upper right plot of SAR vs. SPC in Figure 13. In this plot, the pure Ogallala water has low SAR and SPC (0.600 (mM)1/2, 0.751 mS/cm) while the pure Dockum water has high SAR and SPC (53.3 (mM)1/2, 1.49 mS/cm). The two parameters do not vary linearly with blend ratio or with each other due to SPC being based on ionic strength and SAR being a non-linear combination of three cationic species (Na+, Ca2+, Mg2+).
Table 8 provides a summary of the 0→100% Ogallala blending fractions according to study area spatial groups. In the table, the first number shown is the even 50/50 blend while the parentheses indicate the range of values seen. The greater the range of values, the greater the difference between the pure Ogallala (100% Ogallala) and the pure Dockum (0% Ogallala) blend. There is more opportunity to optimize water quality when the source waters are more different from each other, but there is also more potential for the final blended water quality to be unfavorable for water distribution, crop, soil, or groundwater receiving irrigation leachate.
The north area has the greatest variation in pH (two units pH) and the highest achievable pH. Even at the 50/50 blend, it is still a moderately high pH of 8.5. At the same time, the hardness is kept the lowest as well as the SPC regardless of the blend ratio in the north. The saltiest locations when blending are the central west and southwest areas which have SPCs of 1.10–1.12 dS/m at the 50/50 blend and both max out at 1.4–1.5 dS/m. The highest SAR is the southwest which has a moderately high 50/50 value of 8.0 mM1/2. All of these areas, if they are tilted towards blending in more Dockum groundwater, have SAR in excess of 10 mM1/2.
Using the general values provide in Ayers and Wescott [56], we constructed ranges of combined SAR and SPC to evaluate sodicity reduced soil infiltration risk according to categories of low risk, slight to moderate risk, and high risk (Figure 14). A higher SAR (increased Na relative to bivalent cations) can be mitigated by increasing ionic strength (higher salinity). There is a critical flocculation concentration (cfc) of electrolytes such that if the soil solution maintains electrolytes above that value, there will be sufficient electrolytes to keep the soil flocculated. In this way, increasing salinity in the soil solution can offset the deflocculating effects of Na+ if is maintained above a critical value [51]. This process is the basis for the rising lines separating the three risk regions in Figure 14.
Looking now at the figure, each region in the study area shows a line which indicates the blend ratio. The pure Ogallala water (0% Ogallala) is at the lower left in each case while pure Dockum (100% Ogallala) is the upper right terminus of the line. Blending in more Dockum water increased SPC because, at every location where Dockum and Ogallala well are collocated, the Dockum water was saltier. As well, Dockum water was extremely high in Na+ generally at most locations and deficient in bivalent cations as shown previously in the Piper plot (Figure 9). Even when the concentrations of Na+ and Mg2+-Ca2+ are similar (mixed type cation), the SAR will still be poor (too high) because it is not the sum of bivalent cations that balance Na+ but the square root of that sum.
Nearly every region in the study area spans all three soil deflocculation risk categories with a few exceptions. The north region is always in slight or high risk because its salinity (SPC) is too low to enter the no risk region. However, its SAR is low enough that it will only become a high risk for infiltration if a very high Dockum water fraction is used in the blend. The central west region has the highest salinity overall (furthest to the right), and it is this fact combined with SAR which never exceeds 14 mM1/2 that make it such that no blend of water in that location will ever move into the high-risk category. The central east and southwest regions have the greatest variation in infiltration risk and can generate water which has very high deflocculation risk when the Ogallala fraction is <30% in both regions. In this particular region and looking at sodicity risk only, care must be taken to keep the Ogallala blend amount sufficiently high (50% or higher to be conservative).
Finally, we combined the risk from five different water quality constituents (salinity, sodicity, boron, chloride, and nitrate) using established criteria for three risk classes [56] to look at two issues of blending—the amount of blend fractions which would be problematic and what particular water quality threshold is exceeded, causing irrigation water quality problems. A summary of the hazard type and fraction of blends in different categories (again spanning 0→100% Ogallala blend) is provided in Figure 15 with specific hazard level ranges in Table 9.
The issue with increased salinity generally is lower crop yield and the need to use more water for increasing leaching fraction [56]. In this hazard class, all study area regions had at least a slight hazard from salinity for nearly all blends. The major exception on this point was the north group which had no salinity issues for any blend. Sodicity, as discussed previously in Figure 14, is also a frequent problem causing the most instances of severe hazard classes. Boron and chloride make some blend ratios go from no hazard to slight hazard, but these two parameters are the least problematic. The presence of nitrate creates slight to severe hazards in over half of the blends in all areas except for the central east. In summary, nitrate, sodicity, and salinity are the largest problems for suitability of blends for irrigation.
Looking at the various water quality parameters that move irrigation blends into slight or severe hazard classes, we examined how many blends of water in each region had no problems from any hazard type. Surprisingly, there was not a single instance where a blend had no hazards. Even the more pristine Ogallala waters in pure form (no blend) have at least two hazard classes in the slight range in every spatial group. It is therefore advisable for a grower to manage irrigation water quality risk by determining which hazard classes they are more comfortable allowing and choosing Dockum–Ogallala blends which keep hazard classes furthest from the severe thresholds.
4. Discussion
The general history of development and use of these two aquifers does not determine their water qualities, but it does help explain how they have been viewed for the last 70 years, the period that corresponds the greatest use or irrigation in the Southern Ogallala region in Texas. The Ogallala has far more wells generally than the Dockum because it is shallower, has a larger lateral footprint, costs less to develop, historically has had favorable well yields, and has less water quality variation. These factors have made it so that the surge in well development in the Ogallala happened earlier in time with the bulk of Ogallala wells being drilled for irrigation. The Dockum on the other hand, being deeper and with greater variation in water quality, likely always required more study and a greater deficit in water demand minus supply in order to develop the resource. The greater expense of drilling and the increased operational cost of lifting water higher made it frequently less attractive. Furthermore, when it became clear that the Dockum had zones of better and worse salinity, there was the possibility that increased pumping of a high yield, good quality well could result in mixing saltier water with fresher water. Put together, this historical and practical information likely still plays a role in whether an industry, city, rancher, farmer, or even homeowner decides to drill a Dockum well for useable water. Even when a landowner has the necessary wells, the determination of blending Ogallala and Dockum water, potentially from 3+ nearby wells is a separate assessment entirely. In the Southern High Plains, the current Texas State Water Plan for Regions A and O have both taken on some of these assessments (more for water quantity than quality) to understand how future water demand can be made secure with the Dockum as one of several water resources [57,58].
There are important differences in Dockum and Ogallala groundwater qualities. These qualities vary spatially, and they seem to vary more in the Dockum aquifer. One complication in understanding the water quality of the Dockum relative to the Ogallala is that it has regions that are seen as more suitable for use generally (<5000 mg/L TDS) and regions that are truly saline (>5000 mg/L TDS) which require expensive water treatment to use. The situation is further complicated by the clear division of the aquifer between outcrop and subcrop and between a separated region north of the Canadian river which has less historical information on its water quality from the region south of the Canadian river. The Dockum being a confined aquifer in most places makes the use of water levels as an indicator of remaining volume less simple than the Ogallala. Looking more specifically at important water quality parameters, the Dockum is softer than the Ogallala in the areas where it is drilled for direct use without treatment. This is generally a good point for its use, but the lower water hardness ties in directly to the sodicity problems from higher sodium adsorption ratio. The total alkalinity is sometimes lower than the Ogallala as well, which means that uses of the water which require a stable pH may not be a viable opportunity for the Dockum.
The uses of the Dockum which drove this study more than any other are irrigation and ranching. Since irrigation uses much more water than ranching, it is the possibility of blending Dockum water with Ogallala water or using Dockum water instead of Ogallala which is enticing. Should blending or replacement be done well, conservation of the Ogallala, which is an important resource management issue for this region, might be achieved. Using water quality blending modeling and subsequent interpretation, we can say that blending these two aquifer waters is a possibility from the perspective of resultant water quality as long as the hazards of blending are sufficiently understood. There are four primary potential hazards that are most common in blending these two aquifers, at least based on the area over which this study was conducted—scaling in piping systems, salinity leading to lower crop yields, sodicity to damage soil structure and health, and nitrate in excess of what sensitive crops can withstand. Not all of these hazards happen at once. Increased use of Dockum in a blend increases salinity and sodicity. Increased use of Ogallala in a blend increases nitrate presumably due to the proximity of the Ogallala to surface irrigation and some surface recharge which sources nitrate. Scaling is more complex in that the potential scale minerals are different according to local water chemistry, and the scale potential for scale according to saturation index does not follow a strict trend with blending fraction.
A grower could choose an optimum blend to their liking in terms of well yield and for economic reasons and prepare to deal with whatever hazard might result from their choice. If salinity is the hazard, increasing the applied water and thus the leaching fraction could help avoid reduced yields, or the grower could select salt tolerant crops. If sodicity is the hazard, then planning to remediate or amend soils with gypsum or other high calcium compounds could make the blend application more sustainable. If nitrate is the hazard, then choosing crops that will utilize the excess nitrate efficiently might be prudent. There is also the possibility of grower altering the blend ratio during the season according to a crop’s response to certain blend or according to intra-season soil testing. A farmer who has multiple wells of different qualities could optimize a blend according to time, year, irrigation method, or irrigation schedule. As long as they understand the economic and environmental consequences of water blends with inherent hazards, they should be able to make the tradeoffs in irrigation blend, rate, and cropping system that will benefit both their livelihood and natural resources. The greater challenge may be to choose to not use a blend of brackish and fresh groundwater if the use hazard is high even when economics or diminishing well yields seem to demand it.
5. Conclusions
In this study, we explored the differences in water quality between two co-located aquifers in the Texas Southern High Plains, the overlying water table Ogallala aquifer and the mostly confined sometimes brackish Dockum aquifer. We examined the differences with a view towards understanding spatial differences in water chemistry that could help evaluate their suitability in blending scenarios, most particular for irrigation of crops. Historical analysis of well development records and water quality showed that there are far more wells in the counties where the Ogallala and Dockum overlap and that more of the Ogallala wells were developed specifically for irrigation while Dockum wells were for a variety of uses. Water quality data indicate that the Dockum is softer but frequently saltier than the Ogallala. Sometimes the water is truly brackish (>1000 mg/L TDS), but frequently it just has higher TDS than the Ogallala.
The comparison of water quality in a small study area generally agreed with the historical water quality analysis. While the general area-wide trend is for the Ogallala to trend towards saltier water north to south, this was not the case with the Dockum where there was not a strict geographic trend in salinity or SAR with direction. The differences in water quality for the Dockum had to be determined by local sampling. The use of hydrochemical facies and PCA agreed with the general variability of Dockum water quality. To illustrate the point, there are six hydrochemical facies, and five of them had at least 10% recent Dockum samples.
A look into water blending scenarios showed that the blends created different water quality hazards for irrigation depending on location. No location was free of hazards even when using pure Ogallala or Dockum water. We thus conclude that growers must choose the water quality hazard that they want to spend the most time mitigating. We further note that the level of detail in this study is not something that could be expected from a typical rancher, farmer, or even industrial water user. We do, however, think that what we present here illustrates water quality monitoring and modeling of results for those interested in blending. Use of techniques and interpretations similar to ours should allow a water user to effectively optimize the cost of extraction, meeting water demand, conserving water supply in a local aquifer, and stewarding soil and water resources in a way that avoids environmental degradation.
Supplementary Materials
The following are available online at https://www.mdpi.com/article/10.3390/hydrology8040166/s1. All original data from groundwater monitoring in the study region 2014–15. The format is a single Excel file with multiple workbook pages. They can be combined into a relational database if needed.
Funding
This research was funded by the United States Department of Agriculture Ogallala Aquifer Program (USDA-OAP).
Data Availability Statement
All data used in this study were either public and found at the Texas Water Development Board’s Groundwater Database (GWDB) or were collected as part of the study itself. Data collected for the purposes of the study are included in the Supplementary Materials.
Acknowledgments
We thank the following undergraduate engineering West Texas A&M University students. All of these students tested equipment, collected field data directly, organized data, and performed laboratory analyses. They are Dustin Livingston, Lance White, and Ashim Pant. We also thank Servitech Laboratories in Amarillo, TX for generous discounts on water quality analyses and complementary sample containers to support regional water research. We thank the following landowners for providing free and consistent access to wells for sampling—City of Amarillo, City of Canyon, City of Hereford, Bureau of Land Management at Crossbar Ranch, Chaparral Hills Baptist Church, Chris Grotegut, Roger Brorman. We acknowledge the training and guidance for groundwater sampling for the field staff of the High Plains Water District (HPWD), most specifically Ray Eads. Lastly, we thank two anonymous reviewers who helped us to provide a clearer and more focused manuscript.
Conflicts of Interest
The authors declare no conflict of interest.
References
- Neto, R.T.D.; Santos, C.A.G.; Mulligan, K.; Barbato, L. Spatial and temporal water-level variations in the Texas portion of the Ogallala Aquifer. Nat. Hazards 2016, 80, 351–365. [Google Scholar] [CrossRef]
- Steward, D.R.; Allen, A.J. Peak groundwater depletion in the High Plains Aquifer, projections from 1930 to 2110. Agric. Water Manag. 2016, 170, 36–48. [Google Scholar] [CrossRef] [Green Version]
- Steward, D.R.; Bruss, P.J.; Yang, X.Y.; Staggenborg, S.A.; Welch, S.M.; Apley, M.D. Tapping unsustainable groundwater stores for agricultural production in the High Plains Aquifer of Kansas, projections to 2110. Proc. Natl. Acad. Sci. USA 2013, 110, E3477–E3486. [Google Scholar] [CrossRef] [PubMed] [Green Version]
- Whittemore, D.O.; Butler, J.J.; Wilson, B.B. Assessing the major drivers of water-level declines: New insights into the future of heavily stressed aquifers. Hydrol. Sci. J.-J. Des. Sci. Hydrol. 2016, 61, 134–145. [Google Scholar] [CrossRef]
- Chaudhuri, S.; Ale, S. Temporal evolution of depth-stratified groundwater salinity in municipal wells in the major aquifers in Texas, USA. Sci. Total Environ. 2014, 472, 370–380. [Google Scholar] [CrossRef] [PubMed]
- Chaudhuri, S.; Ale, S. Long term (1960–2010) trends in groundwater contamination and salinization in the Ogallala aquifer in Texas. J. Hydrol. 2014, 513, 376–390. [Google Scholar] [CrossRef]
- Deines, J.M.; Schipanski, M.E.; Golden, B.; Zipper, S.C.; Nozari, S.; Rottler, C.; Guerrero, B.; Sharda, V. Transitions from irrigated to dryland agriculture in the Ogallala Aquifer: Land use suitability and regional economic impacts. Agric. Water Manag. 2020, 233, 106061. [Google Scholar] [CrossRef]
- Avni, N.; Eben-Chaime, M.; Oron, G. Optimizing desalinated sea water blending with other sources to meet magnesium requirements for potable and irrigation waters. Water Res. 2013, 47, 2164–2176. [Google Scholar] [CrossRef] [PubMed]
- Cohen, B.; Lazarovitch, N.; Gilron, J. Upgrading groundwater for irrigation using monovalent selective electrodialysis. Desalination 2018, 431, 126–139. [Google Scholar] [CrossRef]
- Sharma, B.R.; Minhas, P.S. Strategies for managing saline/alkali waters for sustainable agricultural production in South Asia. Agric. Water Manag. 2005, 78, 136–151. [Google Scholar] [CrossRef]
- Ben-Gal, A.; Yermiyahu, U.; Cohen, S. Fertilization and Blending Alternatives for Irrigation with Desalinated Water. J. Environ. Qual. 2009, 38, 529–536. [Google Scholar] [CrossRef] [PubMed]
- Kaner, A.; Tripler, E.; Hadas, E.; Ben-Gal, A. Feasibility of desalination as an alternative to irrigation with water high in salts. Desalination 2017, 416, 122–128. [Google Scholar] [CrossRef]
- Tran, Q.K.; Schwabe, K.A.; Jassby, D. Wastewater Reuse for Agriculture: Development of a Regional Water Reuse Decision-Support Model (RWRM) for Cost-Effective Irrigation Sources. Environ. Sci. Technol. 2016, 50, 9390–9399. [Google Scholar] [CrossRef] [PubMed]
- Malash, N.M.; Flowers, T.J.; Ragab, R. Effect of irrigation methods, management and salinity of irrigation water on tomato yield, soil moisture and salinity distribution. Irrig. Sci. 2008, 26, 313–323. [Google Scholar] [CrossRef]
- Uddameri, V.; Reible, D. Food-Energy-Water Nexus to Mitigate Sustainability Challenges in a Groundwater Reliant Agriculturally Dominant Environment (GRADE). Environ. Prog. Sustain. Energy 2018, 37, 21–36. [Google Scholar] [CrossRef]
- Karim, A.; Cruz, M.G.; Hernandez, E.A.; Uddameri, V. A GIS-Based Fit for the Purpose Assessment of Brackish Groundwater Formations as an Alternative to Freshwater Aquifers. Water 2020, 12, 2299. [Google Scholar] [CrossRef]
- Srinivas, Y.; Oliver, D.H.; Raj, A.S.; Chandrasekar, N. Evaluation of groundwater quality in and around Nagercoil town, Tamilnadu, India: An integrated geochemical and GIS approach. Appl. Water Sci. 2013, 3, 631–651. [Google Scholar] [CrossRef] [Green Version]
- Nagarajan, R.; Rajmohan, N.; Mahendran, U.; Senthamilkumar, S. Evaluation of groundwater quality and its suitability for drinking and agricultural use in Thanjavur city, Tamil Nadu, India. Environ. Monit. Assess. 2010, 171, 289–308. [Google Scholar] [CrossRef] [Green Version]
- Islam, M.A.; Rahman, M.M.; Bodrud-Doza, M.; Muhib, M.I.; Shammi, M.; Zahid, A.; Akter, Y.; Kurasaki, M. A study of groundwater irrigation water quality in south-central Bangladesh: A geo-statistical model approach using GIS and multivariate statistics. Acta Geochim. 2018, 37, 193–214. [Google Scholar] [CrossRef]
- Ghayoumian, J.; Ghermezcheshme, B.; Feiznia, S.; Noroozi, A. Integrating GIS and DSS for identification of suitable areas for artificial recharge, case study Meimeh Basin, Isfahan, Iran. Environ. Geol. 2005, 47, 493–500. [Google Scholar] [CrossRef]
- Bozdag, A. Combining AHP with GIS for assessment of irrigation water quality in Cumra irrigation district (Konya), Central Anatolia, Turkey. Environ. Earth Sci. 2015, 73, 8217–8236. [Google Scholar] [CrossRef]
- Tlili-Zrelli, B.; Gueddari, M.; Bouhlila, R. Spatial and Temporal Variations of Water Quality of Mateur Aquifer (Northeastern Tunisia): Suitability for Irrigation and Drinking Purposes. J. Chem. 2018, 2018, 2408632. [Google Scholar] [CrossRef]
- Ghouili, N.; Hamzaoui-Azaza, F.; Zammouri, M.; Zaghrarni, M.F.; Horriche, F.J.; Condesso de Melo, M.T. Groundwater quality assessment of the Takelsa phreatic aquifer (Northeastern Tunisia) using geochemical and statistical methods: Implications for aquifer management and end-users. Environ. Sci. Pollut. Res. 2018, 25, 36306–36327. [Google Scholar] [CrossRef] [PubMed]
- Fitzgerald, D.; Chanasyk, D.S.; Neilson, R.D.; Kiely, D.; Audette, R. Farm well water quality in Alberta. Water Qual. Res. J. Can. 2001, 36, 565–588. [Google Scholar] [CrossRef] [Green Version]
- Esmaeili-Vardanjani, M.; Rasa, I.; Amiri, V.; Yazdi, M.; Pazand, K. Evaluation of groundwater quality and assessment of scaling potential and corrosiveness of water samples in Kadkan aquifer, Khorasan-e-Razavi Province, Iran. Environ. Monit. Assess. 2015, 187, 53. [Google Scholar] [CrossRef] [PubMed]
- Ben Alaya, M.; Saidi, S.; Zemni, T.; Zargouni, F. Suitability assessment of deep groundwater for drinking and irrigation use in the Djeffara aquifers (Northern Gabes, south-eastern Tunisia). Environ. Earth Sci. 2014, 71, 3387–3421. [Google Scholar] [CrossRef] [Green Version]
- Banoeng-Yakubo, B.; Yidana, S.M.; Emmanuel, N.; Akabzaa, T.; Asiedu, D. Analysis of groundwater quality using water quality index and conventional graphical methods: The Volta region, Ghana. Environ. Earth Sci. 2009, 59, 867–879. [Google Scholar] [CrossRef]
- Amiri, V.; Rezaei, M.; Sohrabi, N. Groundwater quality assessment using entropy weighted water quality index (EWQI) in Lenjanat, Iran. Environ. Earth Sci. 2014, 72, 3479–3490. [Google Scholar] [CrossRef]
- Pandian, R.R.; Sashikkumar, M.; Selvam, S. Appraisal of irrigation water quality study in coastal aquifers of Tuticorin city, Tamilnadu, India. Indian J. Geo-Mar. Sci. 2016, 45, 1522–1530. [Google Scholar]
- Sappa, G.; Ergul, S.; Ferranti, F. Water quality assessment of carbonate aquifers in southern Latium region, Central Italy: A case study for irrigation and drinking purposes. Appl. Water Sci. 2014, 4, 115–128. [Google Scholar] [CrossRef] [Green Version]
- Nazzal, Y.; Ahmed, I.; Al-Arifi, N.S.N.; Ghrefat, H.; Zaidi, F.K.; El-Waheidi, M.M.; Batayneh, A.; Zumlot, T. A pragmatic approach to study the groundwater quality suitability for domestic and agricultural usage, Saq aquifer, northwest of Saudi Arabia. Environ. Monit. Assess. 2014, 186, 4655–4667. [Google Scholar] [CrossRef] [PubMed]
- Jalali, M. Salinization of groundwater in arid and semi-arid zones: An example from Tajarak, western Iran. Environ. Geol. 2007, 52, 1133–1149. [Google Scholar] [CrossRef]
- Guler, C.; Thyne, G.D. Hydrologic and geologic factors controlling surface and groundwater chemistry in Indian Wells-Owens Valley area, southeastern California, USA. J. Hydrol. 2004, 285, 177–198. [Google Scholar] [CrossRef]
- Bradley, R.; Kalaswad, S. The Groundwater Resources of the Dockum Aquifer in Texas; Report 359; Texas Water Development Board (TWDB): Austin, TX, USA, 2003.
- Hall, S.M.; Van Gosen, B.S.; Paces, J.B.; Zielinski, R.A.; Breit, G.N. Calcrete uranium deposits in the Southern High Plains, USA. Ore Geol. Rev. 2019, 109, 50–78. [Google Scholar] [CrossRef]
- Hudak, P.F. Radioactivity in the Ogallala and Dockum Aquifers, northwest Texas, USA. Environ. Geol. 2005, 47, 283–289. [Google Scholar] [CrossRef]
- Huff, G.F. Aquifer composition and the tendency toward scale-deposit formation during reverse osmosis desalination—Examples from saline ground water in New Mexico, USA. Desalination 2006, 190, 235–242. [Google Scholar] [CrossRef]
- Langman, J.B.; Ellis, A.S. A multi-isotope (δD, δ18O, 87Sr/86Sr, and δ11B) approach for identifying saltwater intrusion and resolving groundwater evolution along the Western Caprock Escarpment of the Southern High Plains, New Mexico. Appl. Geochem. 2010, 25, 159–174. [Google Scholar] [CrossRef]
- Rainwater, K.; Nash, P.; Song, L.; Schroeder, J. The Seminole Project: Renewable Energy for Municipal Water Desalination. J. Contemp. Water Res. Educ. 2013, 151, 50–60. [Google Scholar] [CrossRef] [Green Version]
- Nativ, R. Recharge into southern high-plains aquifer–possible mechanisms, unresolved questions. Environ. Geol. Water Sci. 1992, 19, 21–32. [Google Scholar] [CrossRef] [Green Version]
- Scanlon, B.R.; Nicot, J.P.; Reedy, R.C.; Kurtzman, D.; Mukherjee, A.; Nordstrom, D.K. Elevated naturally occurring arsenic in a semiarid oxidizing system, Southern High Plains aquifer, Texas, USA. Appl. Geochem. 2009, 24, 2061–2071. [Google Scholar] [CrossRef]
- Ashworth, J.B.; Hopkins, J. Report 345: Aquifers of Texas; Texas Water Development Board: Austin, TX, USA, 1995.
- Ledbetter, K. Cotton acreage continues climb in northern Texas Panhandle. Agrilife Today 14 March 2019. Available online: https://agrilifetoday.tamu.edu/2019/03/14/cotton-acreage-continues-climb-in-northern-texas-panhandle/ (accessed on 8 September 2021).
- Alexander, W.H. Geology and Ground-Water Resources of the Northern High Plains of Texas, Progress Report No. 1; USGS: Washington, DC, USA, 1961.
- Cronin, J.G.; Wells, L.C. Geology and Ground-Water Resources of Hale County Texas; USGS: Washington, DC, USA, 1963; p. 1539-U.
- Cronin, J.G. A Summary of the Occurrence and Development of Ground Water in the Southern High Plains of Texas; USGS: Washington, DC, USA, 1964.
- Ewing, J.E.; Jones, T.L.; Yan, T.; Vreugdenhil, A.M.; Fryar, D.G.; Pickens, J.F.; Gordon, K.; Nicot, J.P.; Scanlon, B.R.; Ashworth, J.B.; et al. Final Report Groundwater Availability Model for the Dockum Aquifer; TWDB: Austin, TX, USA, 2008.
- Davis, M.L.; Cornwell, D.A. Introduction to Environmental Engineering; McGraw-Hill: New York, NY, USA, 2013. [Google Scholar]
- Hudak, P.F. Solute distribution in the Ogallala Aquifer, Texas: Lithium, fluoride, nitrate, chloride and bromide. Carbonates Evaporites 2016, 31, 437–448. [Google Scholar] [CrossRef]
- Reedy, R.C.; Scanlon, B.R.; Walden, S.; Strassberg, G. Naturally Occurring Groundwater Contamination in Texas; Texas Bureau fo Economic Geology: Austin, TX, USA, 2011. [Google Scholar]
- Sposito, G. The Chemistry of Soils; Oxford University Press: New York, NY, USA, 2016. [Google Scholar]
- Zhang, P.; Liu, Y.; Zhang, N.; Ip, W.F.; Kan, A.T.; Tomson, M.B. A novel attach-and-release mineral scale control strategy: Laboratory investigation of retention and release of scale inhibitor on pipe surface. J. Ind. Eng. Chem. 2019, 70, 462–471. [Google Scholar] [CrossRef]
- Xiao, Y.; Liu, Y.Z.; Ma, C.J.; Muhammad, T.; Zhou, B.; Zhou, Y.P.; Song, P.; Li, Y.K. Using electromagnetic fields to inhibit biofouling and scaling in biogas slurry drip irrigation emitters. J. Hazard. Mater. 2021, 401, 123265. [Google Scholar] [CrossRef] [PubMed]
- McCool, B.C.; Rahardianto, A.; Faria, J.; Kovac, K.; Lara, D.; Cohen, Y. Feasibility of reverse osmosis desalination of brackish agricultural drainage water in the San Joaquin Valley. Desalination 2010, 261, 240–250. [Google Scholar] [CrossRef]
- Sawyer, C.; McCarty, P.; Parkin, G. Chemistry for Environmental Engineering and Science, 5th ed.; McGraw Hill: New York, NY, USA, 2003. [Google Scholar]
- Ayers, R.; Westcot, D. Water Quality for Agriculture; Food and Agriculture Orgnaization of the United Nations (FAO): Rome, Italy, 1985. [Google Scholar]
- Kiel, S.; Beach, J.; Amosson, S. 2021 Panhandle Water Plan; Panhandle Water Planning Gruop: Amarillo, TX, USA, 2021. [Google Scholar]
- Lemonds, P.J.; Reed, G.; Stein, Z.; Rao, J.; Deeds, N. 2021 Llano Estado Regional Water Plan; Llano Estacado (Region O) Water Planning Group: Lubbock, TX, USA, 2020. [Google Scholar]
Figure 1.
Study location with sampling sites in the Texas Panhandle. Colors indicate well analysis groups (West—pink, Central West—blue, Southwest—green, Central East—purple, North—tan/orange), locations which are geographically clustered. Shapes indicate the aquifer from which wells pull water either Dockum (diamonds) or Ogallala (circles).

Figure 2.
Counties in north Dockum region used for historical drilling, level, and water quality analysis. Red points indicate selected water level sampling locations. There are least five water level watch locations per spatial group.
Figure 2.
Counties in north Dockum region used for historical drilling, level, and water quality analysis. Red points indicate selected water level sampling locations. There are least five water level watch locations per spatial group.

Figure 3.
Dockum aquifer in context with the Ogallala aquifer within the state of Texas and with county boundaries indicated. (a) The focus region for the current study shown in the red bounded rectangle. Aquifer boundary shown is the downdip section which has TDS <5000 mg/L as determined by Ashworth and Hopkins [42]. (b) Representative geologic cross-section for Ogallala and Dockum group sediments in four counties (NE to SW: Oldham, Death Smith, Randall, Swisher) which cover a large section of the study area as indicated in the county inset map. Geologic cross-section taken from Bradley and Kalaswad [34].

Figure 4.
Historical annual well drilling rates for the Dockum and Ogallala Aquifers. Well records without the drilling date have been excluded. Thus, excluded were 129 wells for Dockum (34% of all single aquifer unit wells) and 2054 wells for Ogallala (38% of all single aquifer unit wells).
Figure 4.
Historical annual well drilling rates for the Dockum and Ogallala Aquifers. Well records without the drilling date have been excluded. Thus, excluded were 129 wells for Dockum (34% of all single aquifer unit wells) and 2054 wells for Ogallala (38% of all single aquifer unit wells).

Figure 5.
Reported well primary uses for Ogallala and Dockum Aquifers before and after 1980. Wells before 1980 go back to the earliest dates in the record (1900) and wells after 1980 go to the latest record date (2018). All wells which had no definite drilling dates were excluded.
Figure 5.
Reported well primary uses for Ogallala and Dockum Aquifers before and after 1980. Wells before 1980 go back to the earliest dates in the record (1900) and wells after 1980 go to the latest record date (2018). All wells which had no definite drilling dates were excluded.

Figure 6.
Selected water level trends from 1970 to 2020 in the Dockum and Ogallala Aquifers in the study area. Wells from each spatial group were selected according to the longest continuous measurement record. All well IDs are Texas Water Development Board IDs used in the GWDB.
Figure 6.
Selected water level trends from 1970 to 2020 in the Dockum and Ogallala Aquifers in the study area. Wells from each spatial group were selected according to the longest continuous measurement record. All well IDs are Texas Water Development Board IDs used in the GWDB.

Figure 7.
Water quality indicator distributional comparison between Ogallala and Dockum aquifers from 1990 to 2021. County-based spatial groupings indicated by color where blue, green, and purple indicate north→central→south spatial trends within northern Dockum Aquifer.
Figure 7.
Water quality indicator distributional comparison between Ogallala and Dockum aquifers from 1990 to 2021. County-based spatial groupings indicated by color where blue, green, and purple indicate north→central→south spatial trends within northern Dockum Aquifer.

Figure 8.
Spatial group comparison divided by aquifer within each group. Box plots indicate all of the samples collected over the entire sampling period for all wells within the aquifer-group class. The number of samples per plot ranges from 3 to 12 for 81 samples in total.
Figure 8.
Spatial group comparison divided by aquifer within each group. Box plots indicate all of the samples collected over the entire sampling period for all wells within the aquifer-group class. The number of samples per plot ranges from 3 to 12 for 81 samples in total.

Figure 9.
Piper trilinear diagram presenting hydrochemical facies for all recently collected (2014–15) groundwater samples, organized according to aquifer unit.
Figure 9.
Piper trilinear diagram presenting hydrochemical facies for all recently collected (2014–15) groundwater samples, organized according to aquifer unit.

Figure 10.
Water quality consistent loadings on factors 1, 2, and 3. Extraction by principal component anlaysis and Varimax rotation. Total variance explained is 84.9% and all consituent communalities are 0.800 or better except for nitrate which has a communality of 0.587.
Figure 10.
Water quality consistent loadings on factors 1, 2, and 3. Extraction by principal component anlaysis and Varimax rotation. Total variance explained is 84.9% and all consituent communalities are 0.800 or better except for nitrate which has a communality of 0.587.

Figure 11.
Individual groundwater sample PCA scores by three factors which cover 84.9% of the variation in eight constituents as (a) F2 vs. F1 and (b) F3 vs. F1. Box plot concentration comparisons between aquifer types according to constituents which are strongly positive in each factor for (c) Factor 1 with , , , (d) Factor 2 with , , , and (e) Factor 3 with and .

Figure 12.
Breakdown of two major contributors to F3 illustrating how levels of fluoride and bicarbonate relatively contribute to differentiation between the groundwater types.
Figure 12.
Breakdown of two major contributors to F3 illustrating how levels of fluoride and bicarbonate relatively contribute to differentiation between the groundwater types.

Figure 13.
Summary PHREEQC blending results for spring 2015 water samples from the southwest study region.
Figure 13.
Summary PHREEQC blending results for spring 2015 water samples from the southwest study region.

Figure 14.
Sodicity risk examination across all regions in the study area. The southwest region line continues up to a maximum SAR of 53.3 mM1/2. The figure truncated in the vertical for ease of viewing.
Figure 14.
Sodicity risk examination across all regions in the study area. The southwest region line continues up to a maximum SAR of 53.3 mM1/2. The figure truncated in the vertical for ease of viewing.

Figure 15.
Blend hazard classes according to spatial group. Fractions indicate an estimate of the amount of blending possibility between 0% and 100% Dockum water and the level of the associated hazard.
Figure 15.
Blend hazard classes according to spatial group. Fractions indicate an estimate of the amount of blending possibility between 0% and 100% Dockum water and the level of the associated hazard.


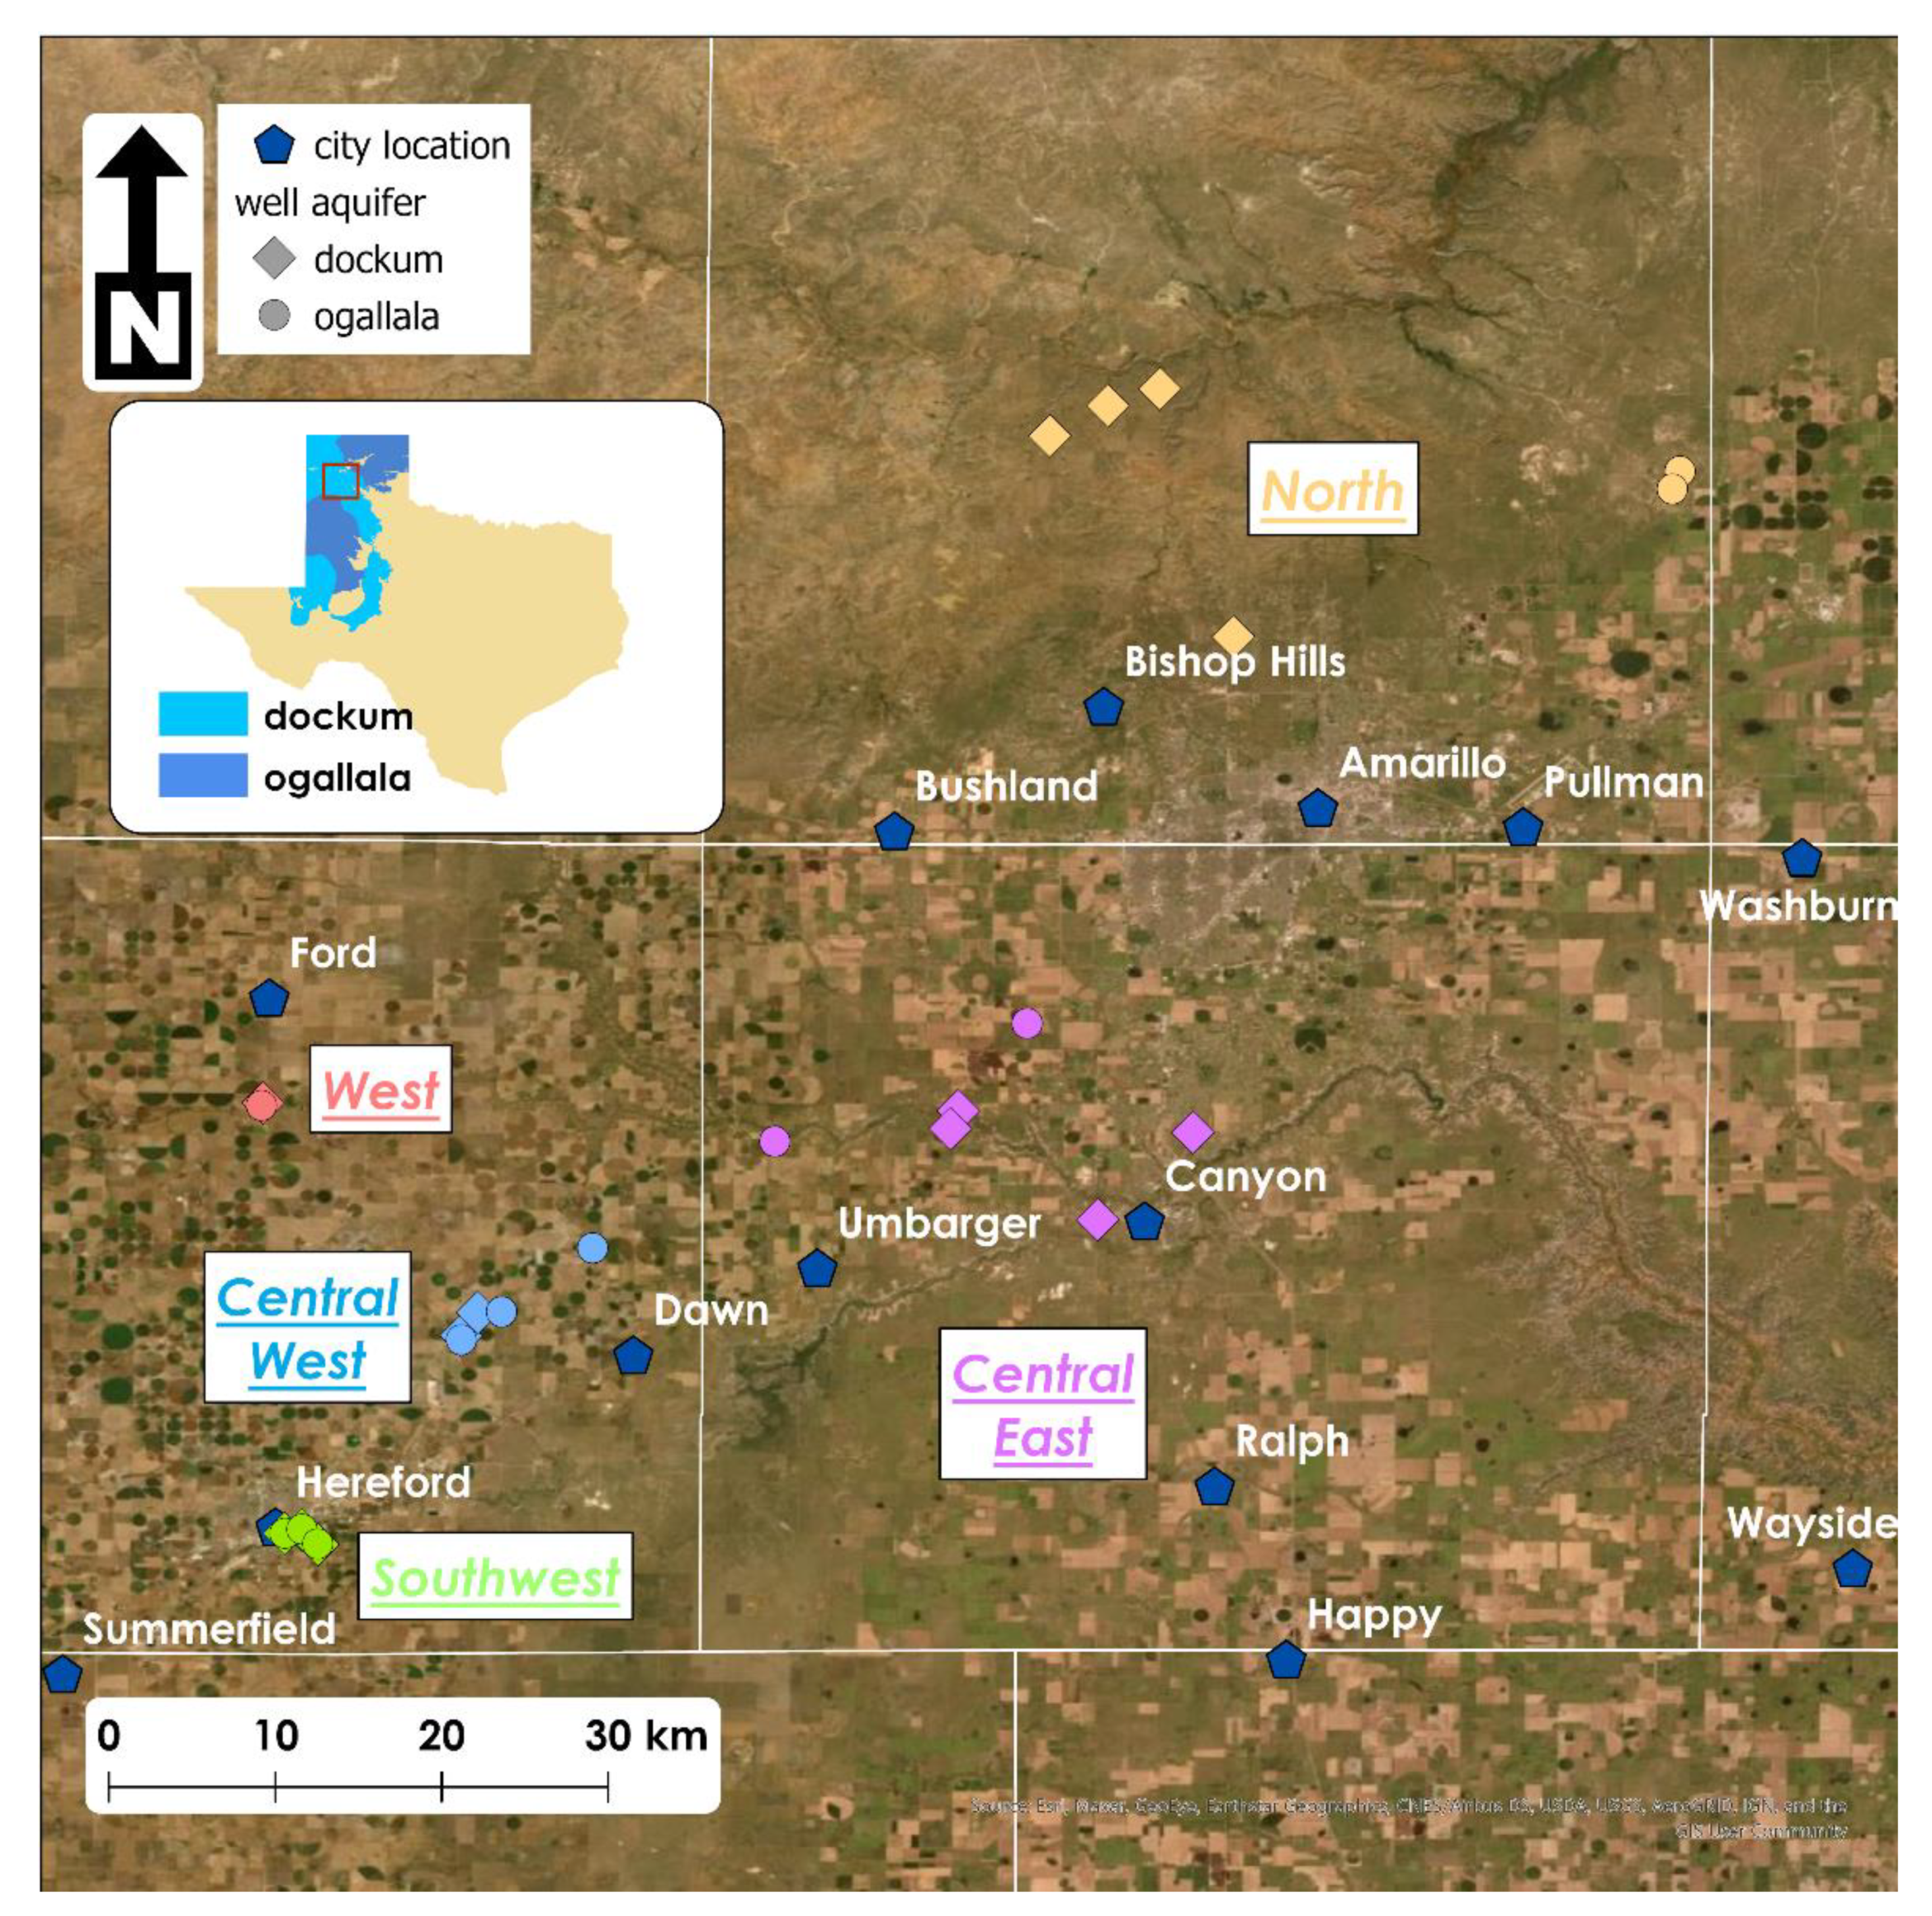
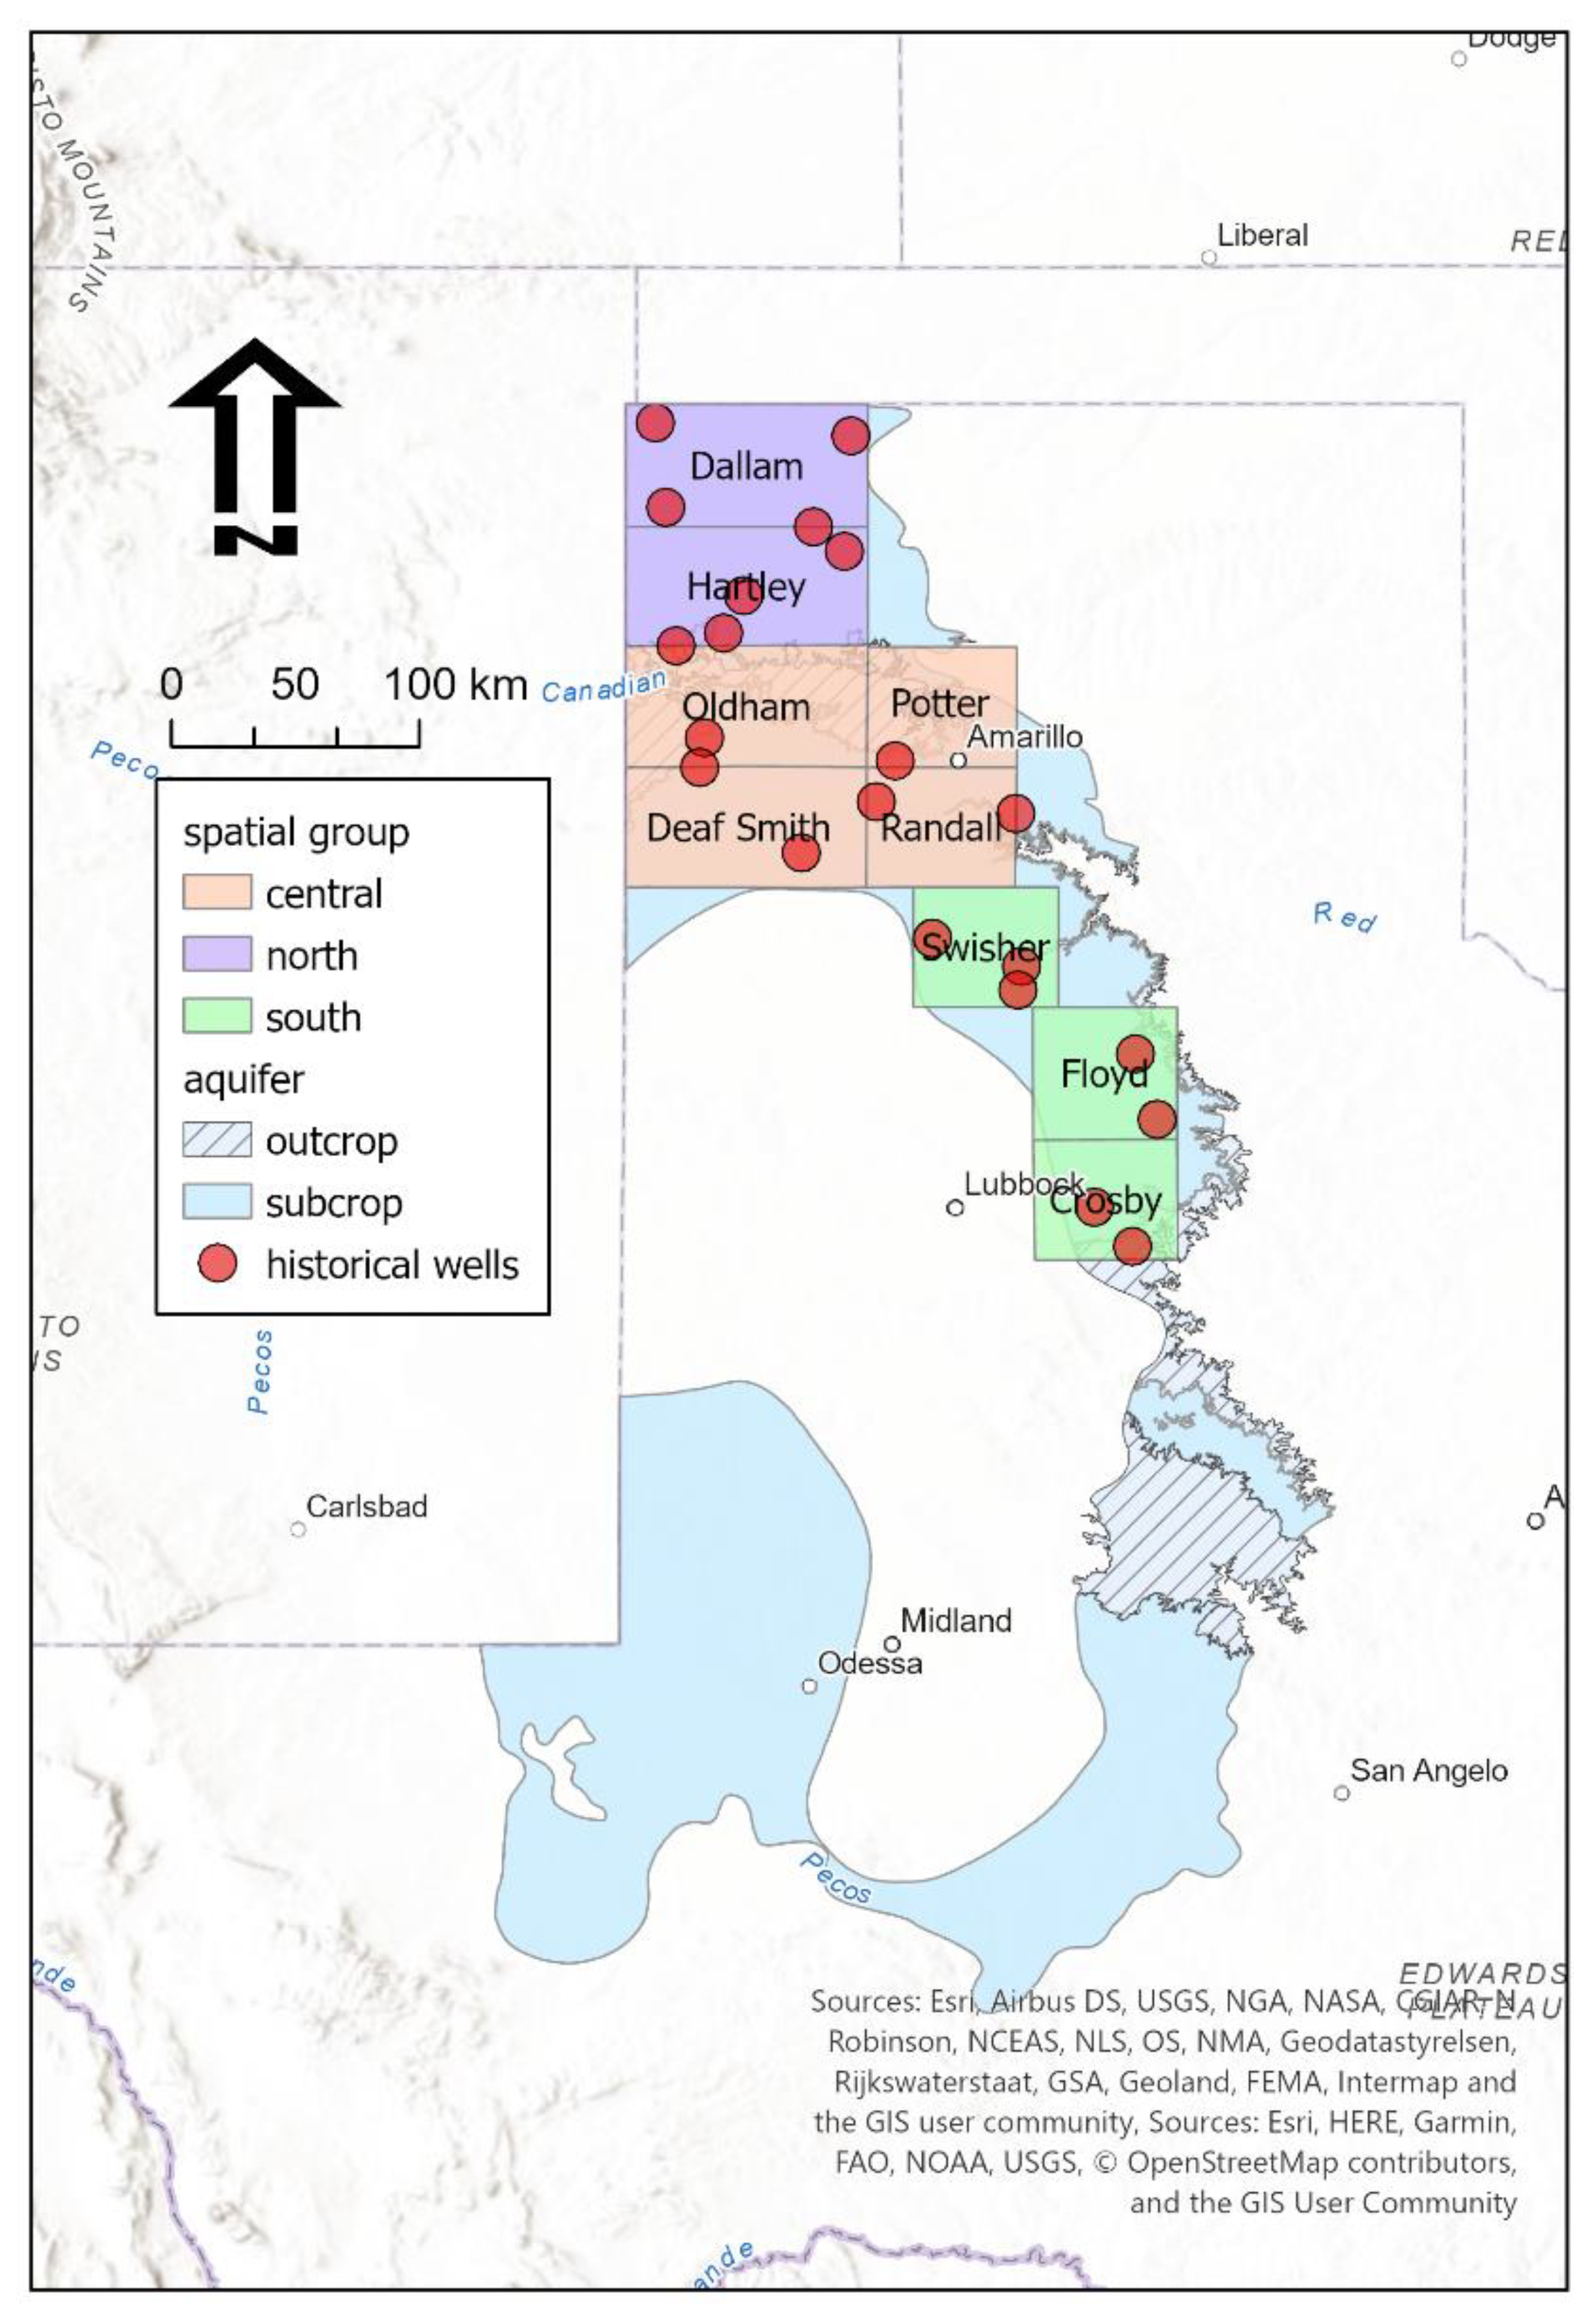
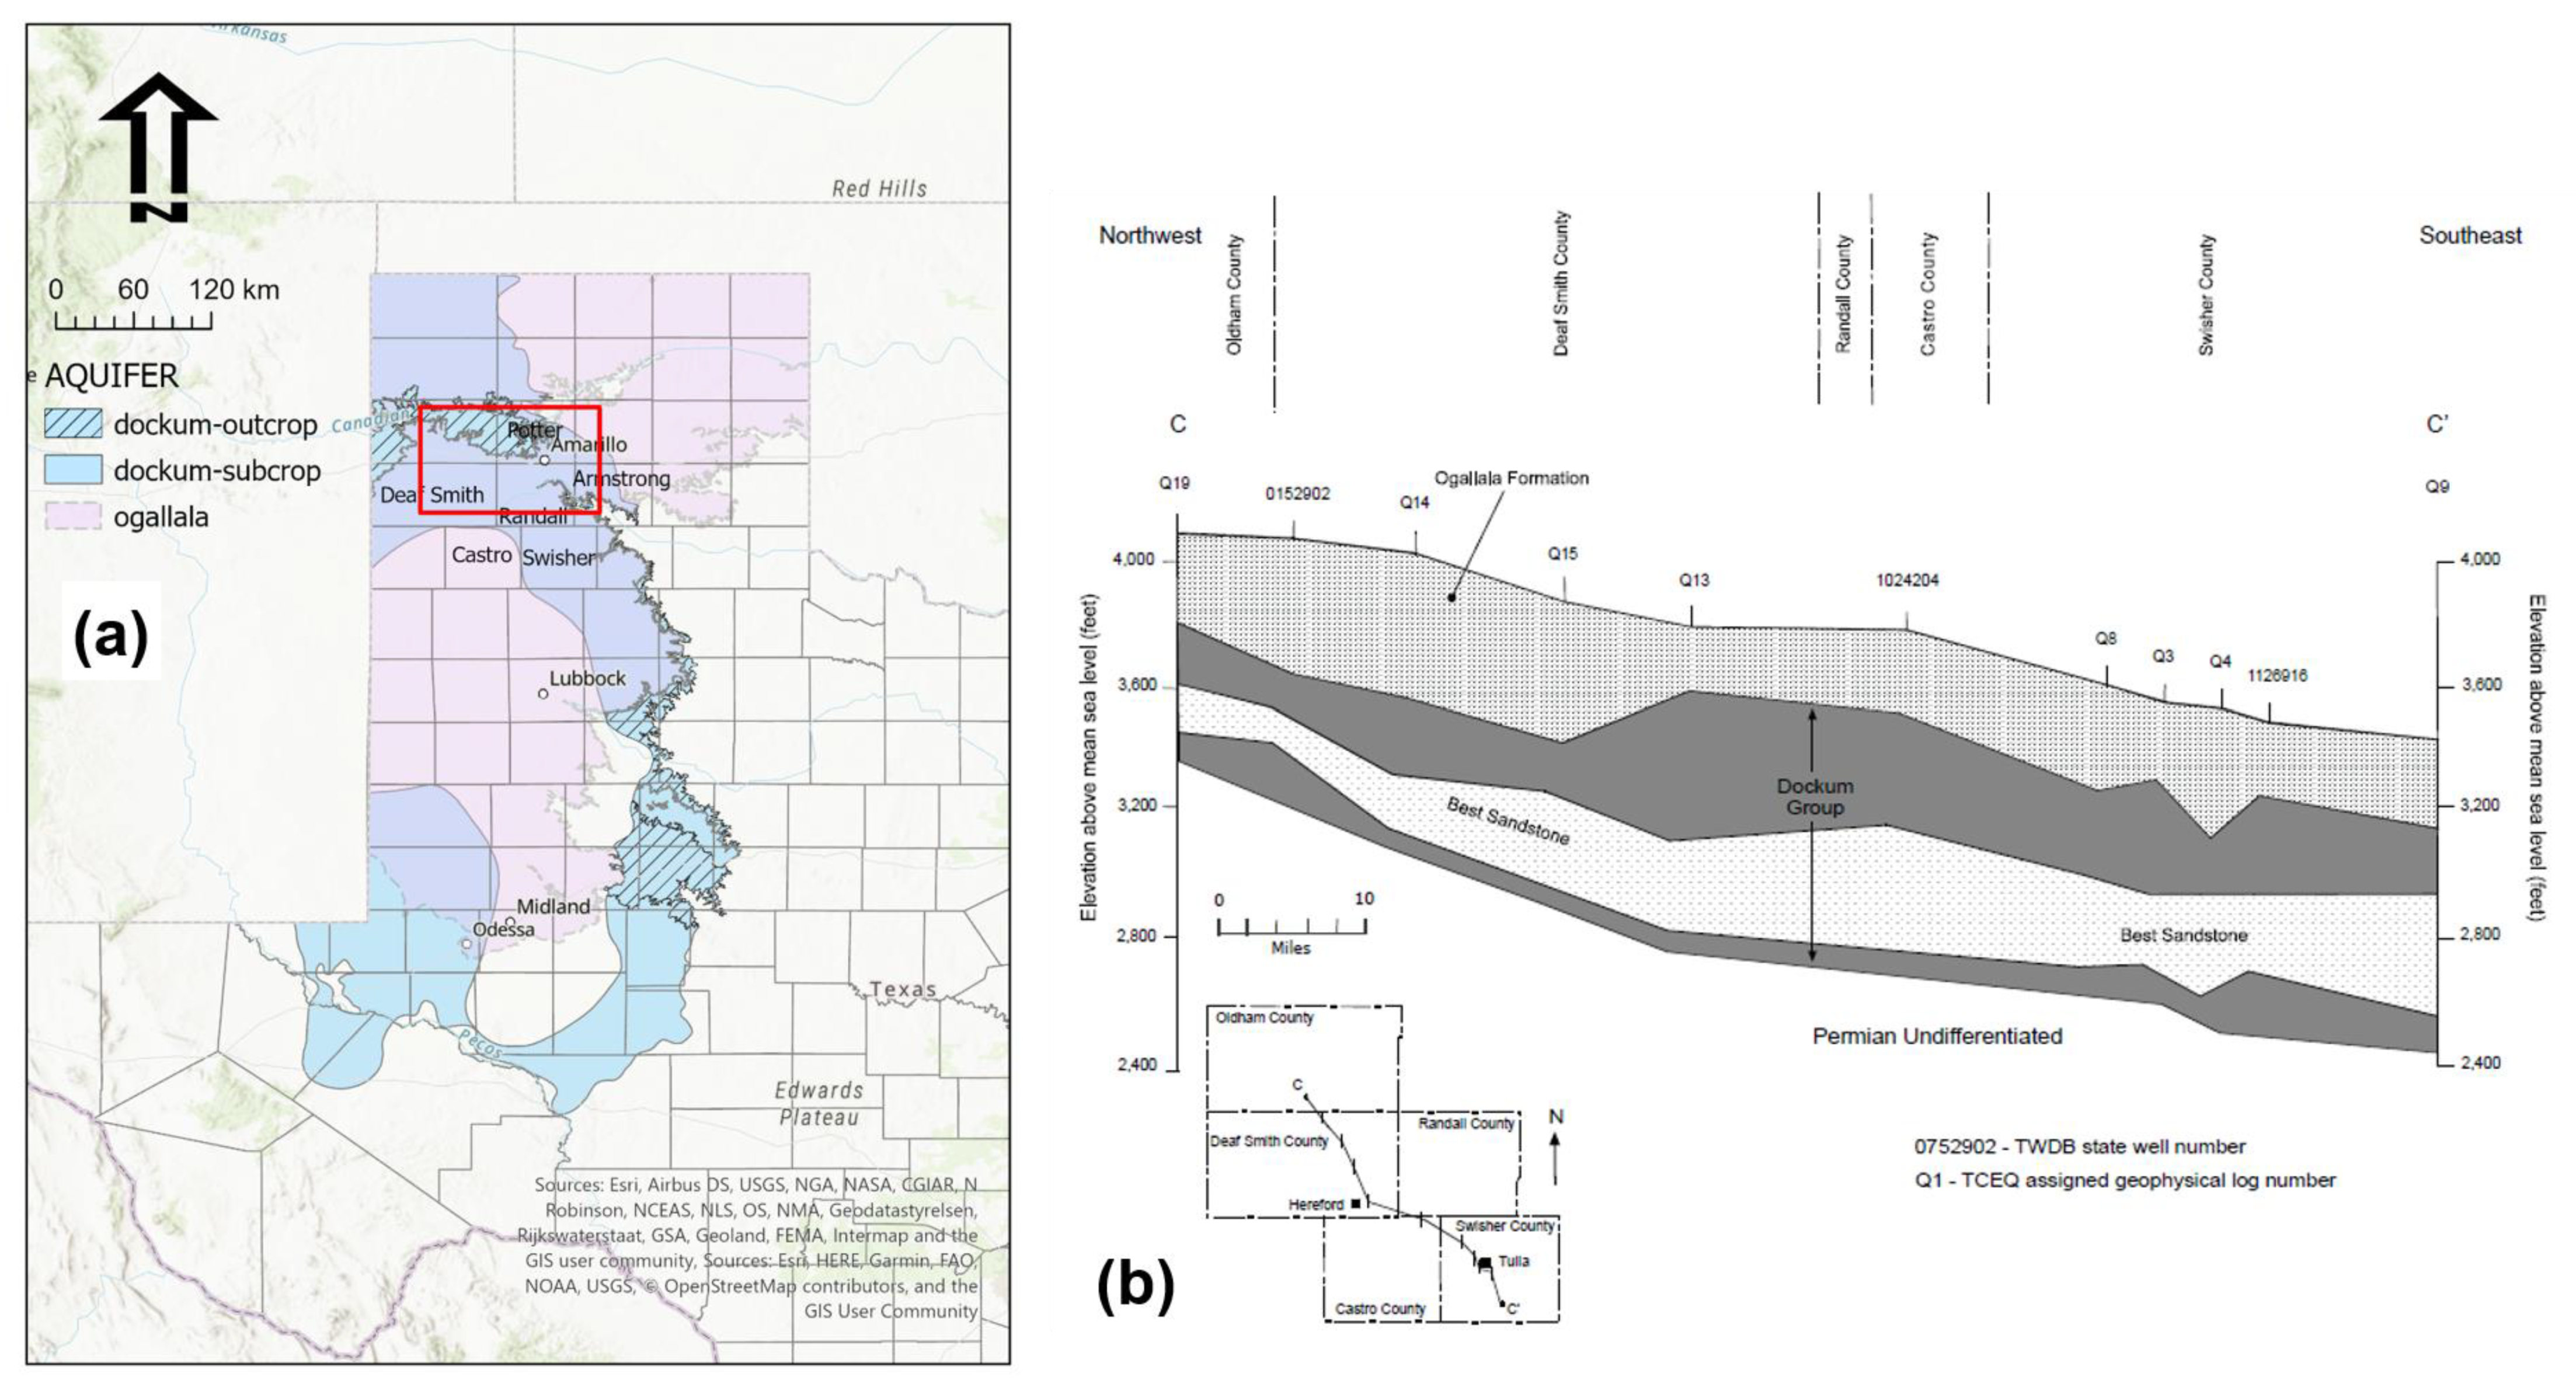
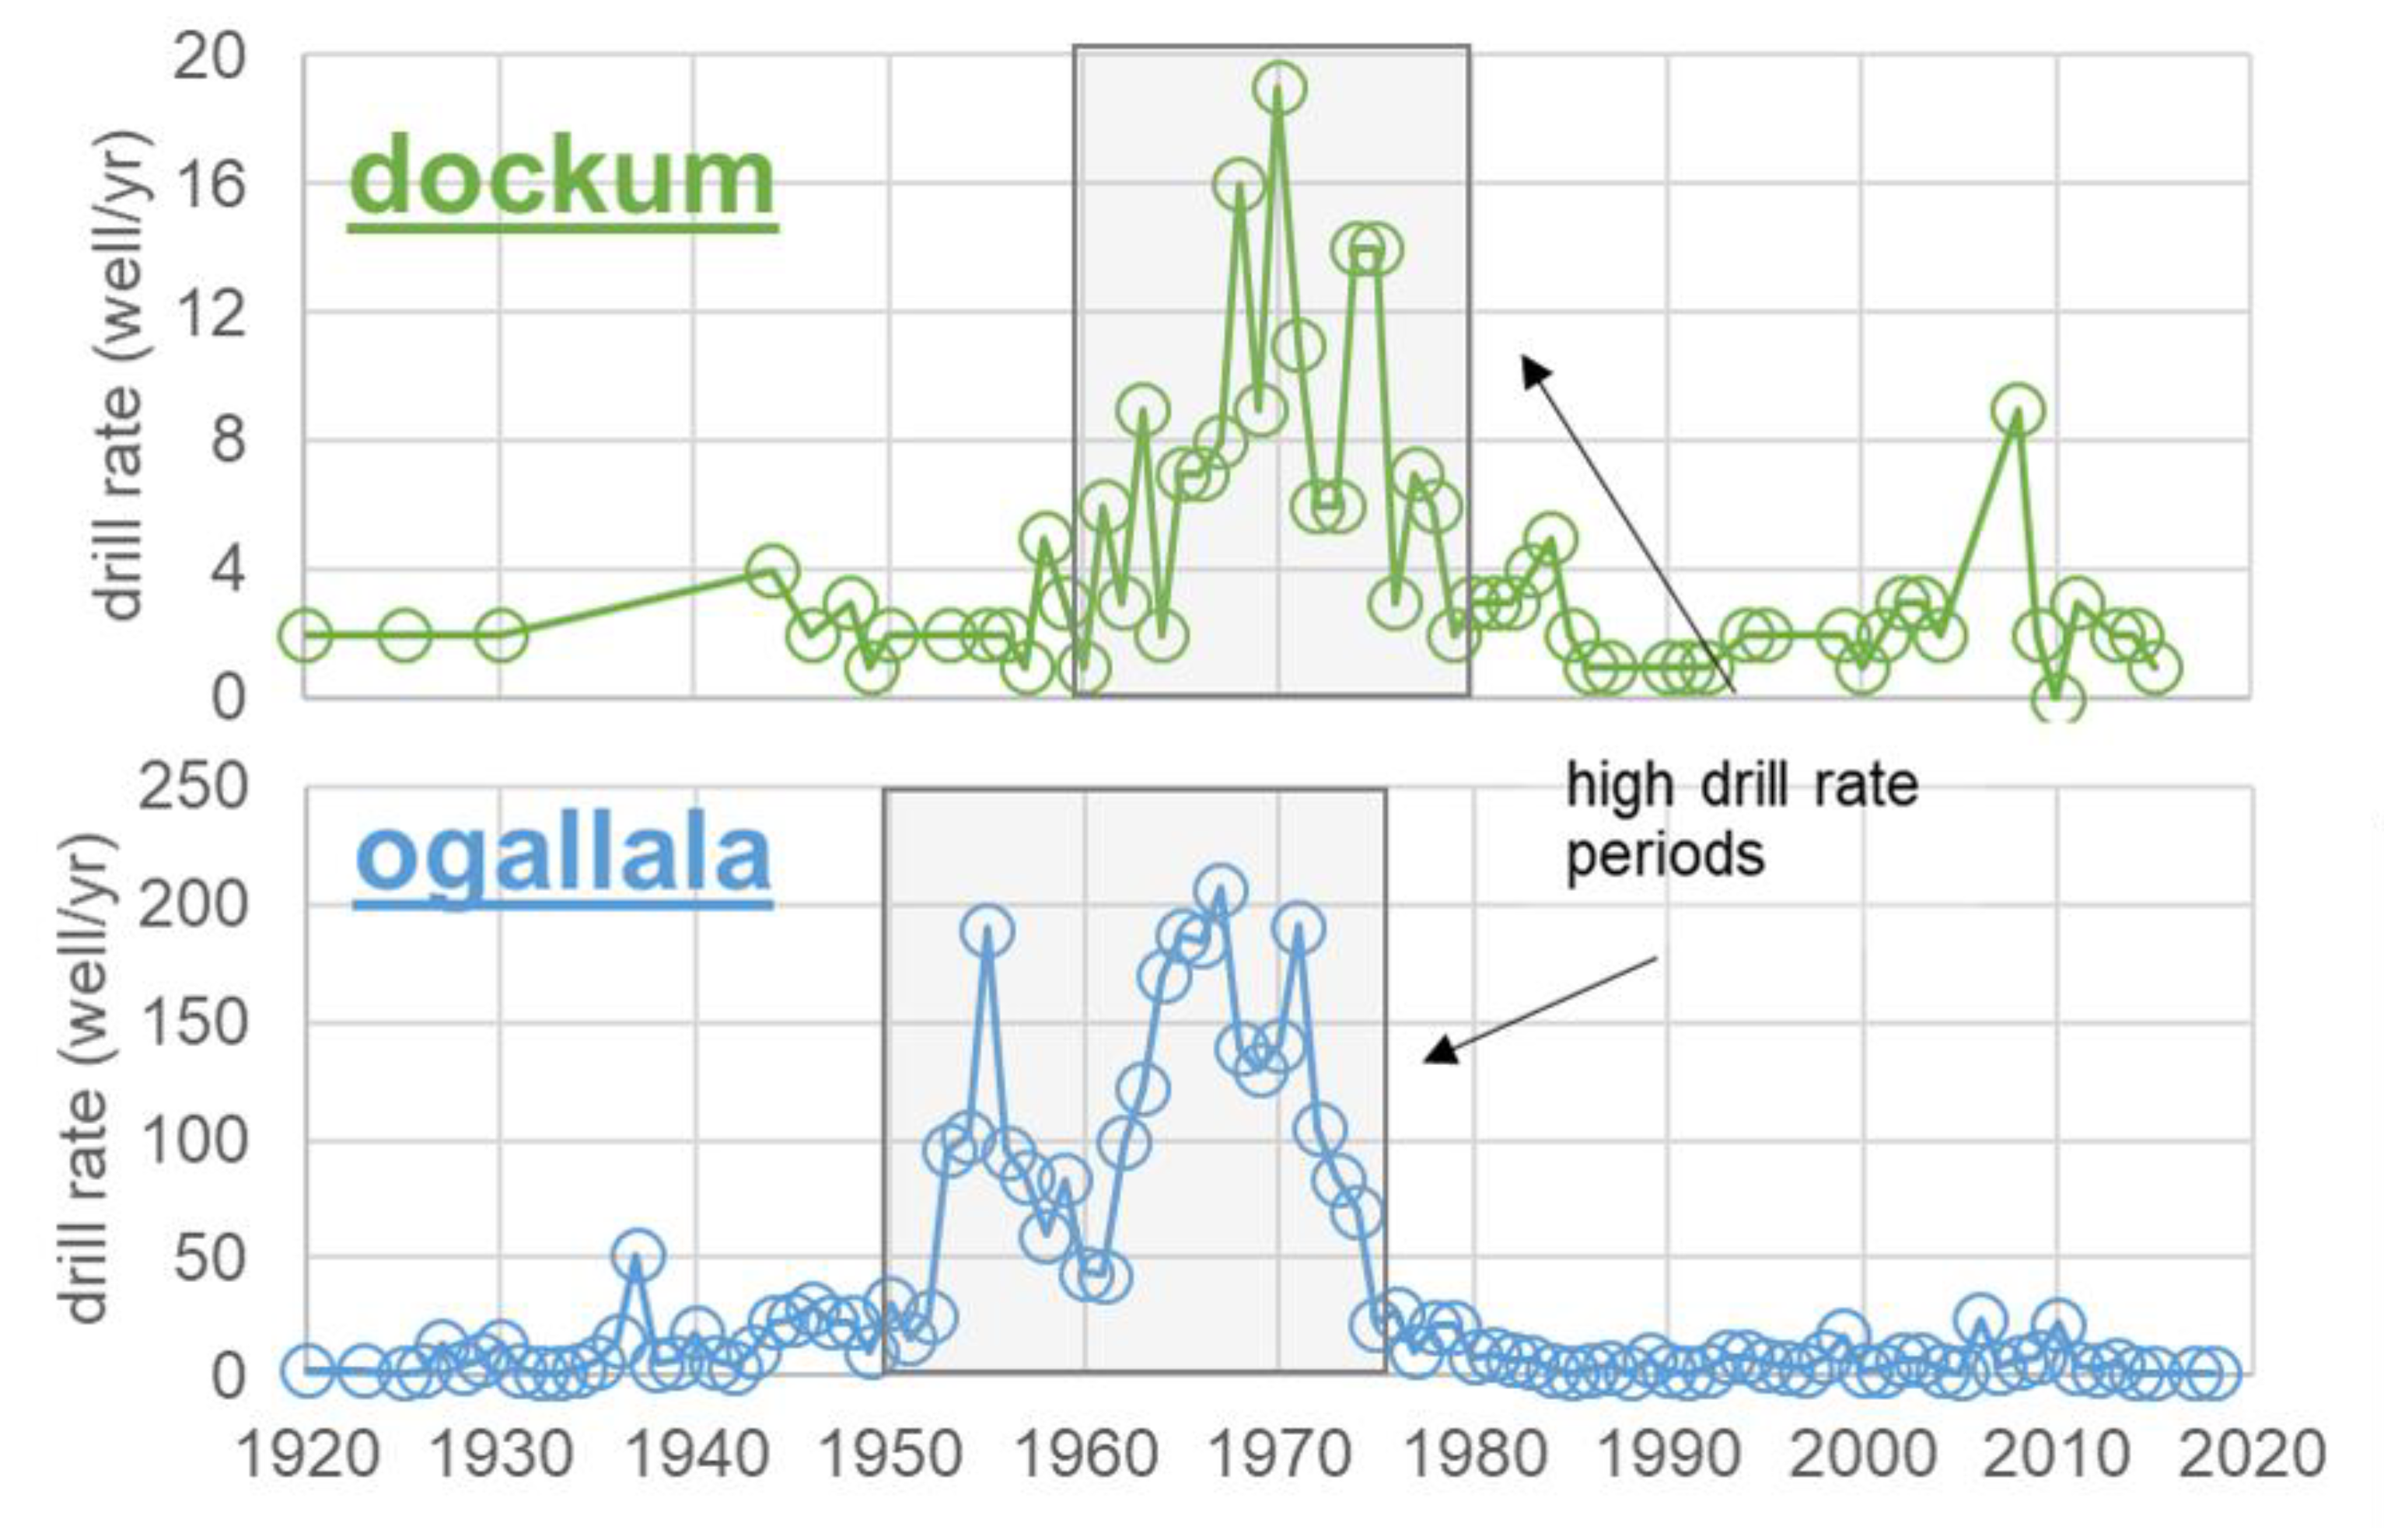
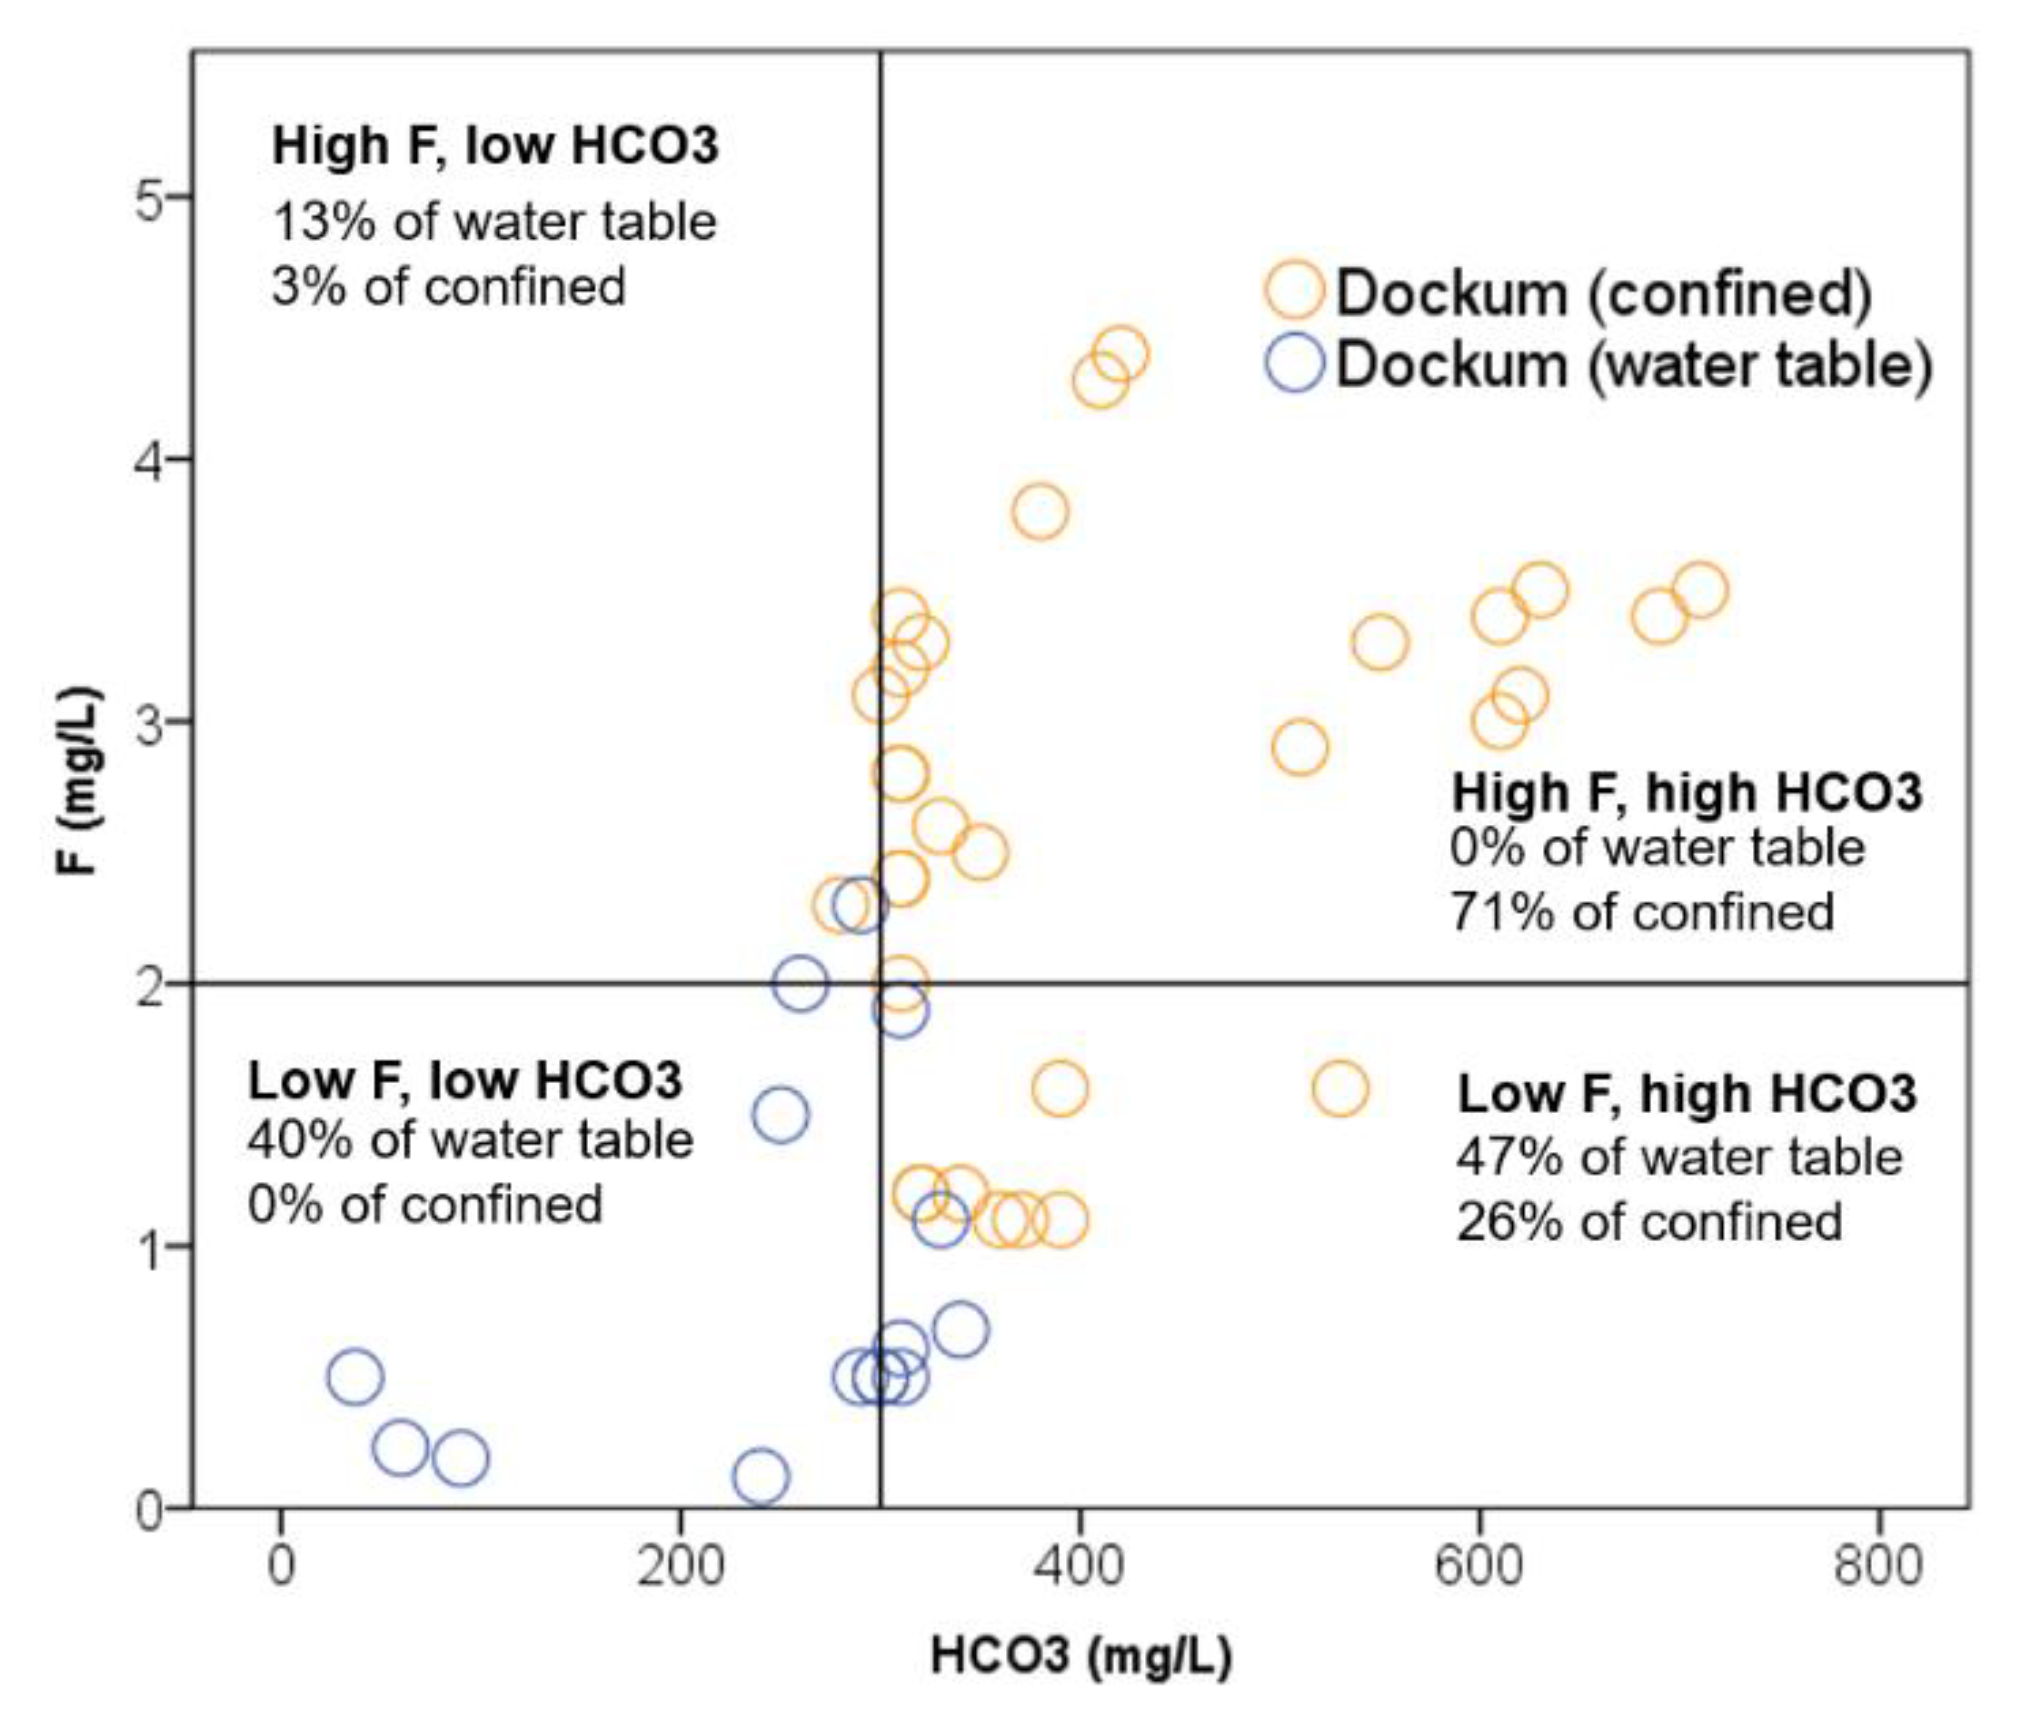
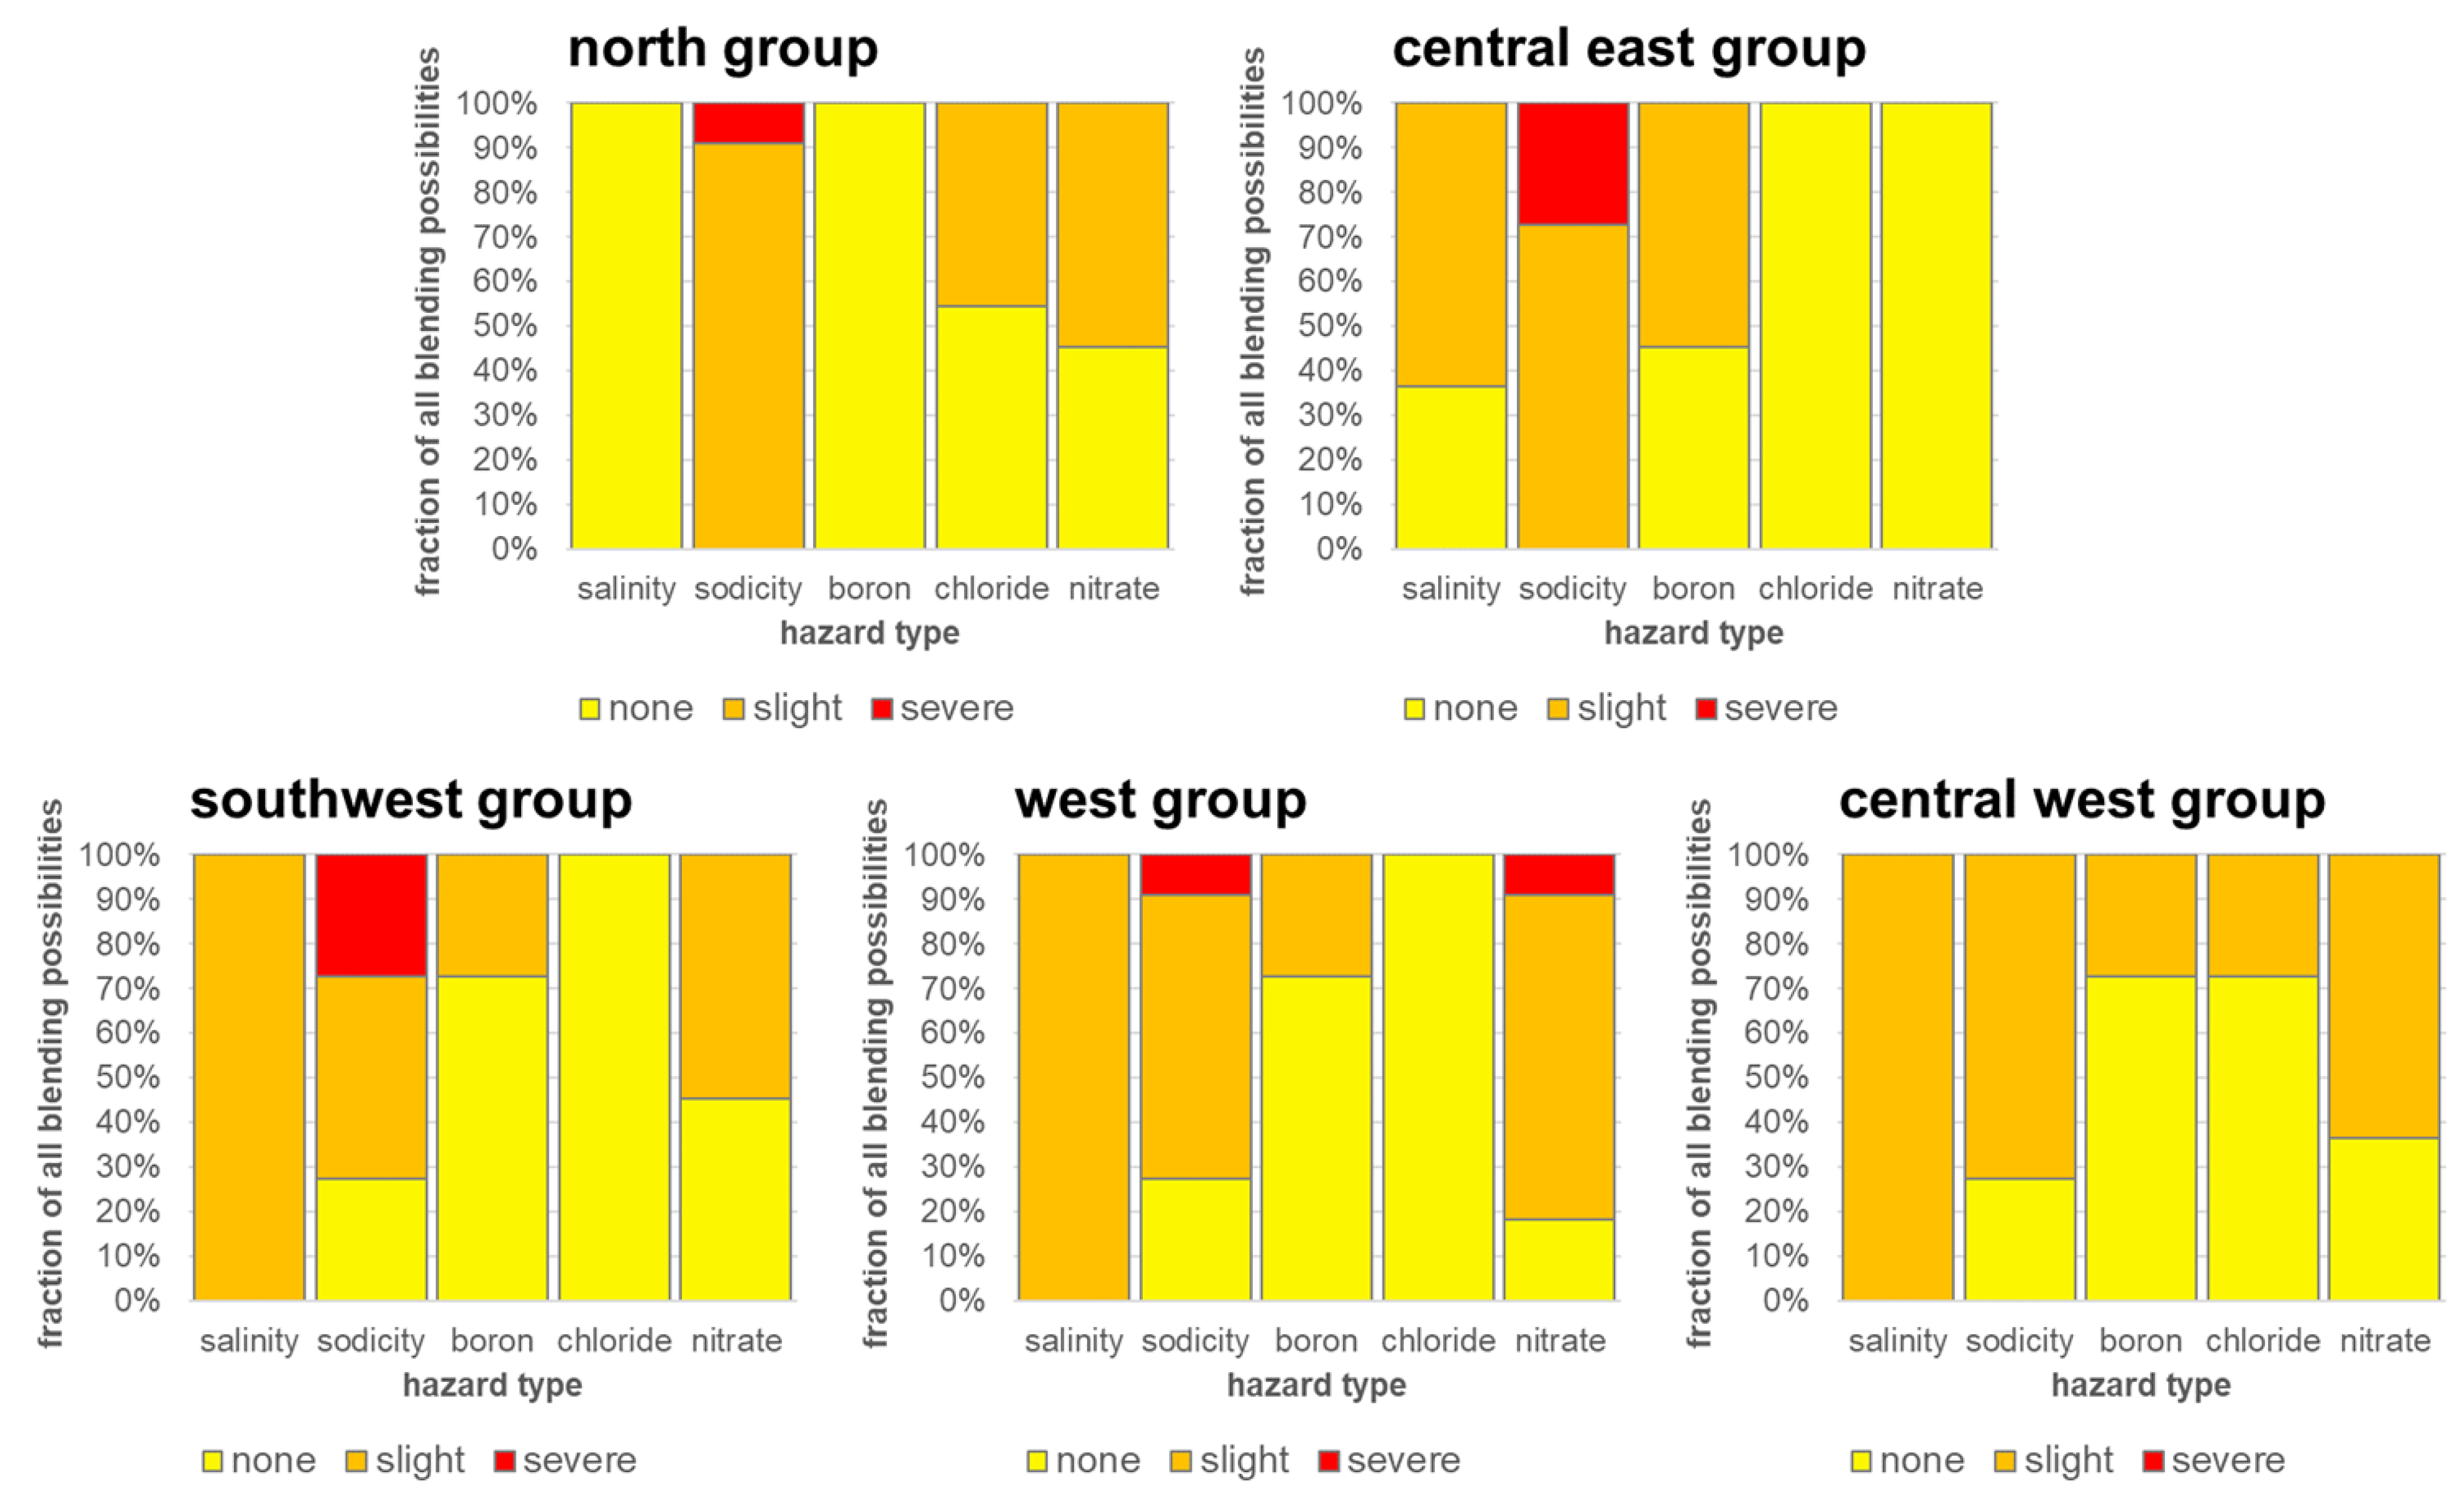
Table 1.
Selected Dockum aquifer-related groundwater studies.
| Study | Type of Study | Purpose and Connection to Dockum |
|---|---|---|
| Bradley and Kalaswad [34] | Summary of existing data | Survey of the entire Dockum aquifer in Texas in terms of history, flow, levels, water volume, and quality. |
| Hall et al. [35] | Regional sampling study | Exploration for uranium and vanadium ore deposits which originate in Dockum group sediments. |
| Hudak [36] | Regional sampling study | Comparison of alpha and beta radioactivity in groundwater taken from an area where Ogallala and Dockum aquifers coexist. |
| Huff [37] | State sampling study | Examination of select groundwater aquifers in New Mexico to understand the potential for reverse osmosis desalination. One of the saline aquifer sources is in Dockum group sediments. |
| Karim et al. [16] | Regional data analysis and decision support study | Use of the entire Dockum aquifer water quality record for suitability. Use of the Dockum to illustrate making decisions concerning brackish groundwater generally. |
| Langman and Ellis [38] | Case sampling study | Use of an area of the Ogallala aquifer in New Mexico where saltwater intrusion is expected from the lower Dockum unit. Multiple isotopic ratios used to characterize the process. |
| Rainwater et al. [39] | Case study on water treatment | Use of higher total dissolved solids (TDS) region Dockum water in reverse osmosis (RO) operation considering costs and energy for a small community |
| Nativ [40] | Regional summarization and conceptualization of existing data | Use of existing water chemistry and hydrography data to explain flow and recharge mechanisms around the Ogallala which are sometimes related to the Dockum. |
| Scanlon et al. [41] | Regional summarization and conceptualization of existing data with additional data collected by authors | Data analysis of water chemistry in wells throughout the Ogallala region to help explain the presence of elevated arsenic concentrations. The influence of higher TDS, higher Na+ Dockum groundwater is a mechanism for As mobilization from Ogallala sediments. |
Table 2.
Water level trend linear regression summary examining all years in the GWDB records from 1970 to 2021 (51 years). All trends were determined the at p = 0.01 threshold.
Table 2.
Water level trend linear regression summary examining all years in the GWDB records from 1970 to 2021 (51 years). All trends were determined the at p = 0.01 threshold.
| GWDB Well ID | County | Aquifer | Fraction of Time in Record | R2 | p-Value, Significance | Slope (cm/yr) |
|---|---|---|---|---|---|---|
| 1 North | ||||||
| 239703 | Dallam | Dockum | 13% | - | - | - |
| 707103 | Hartley | 17% | 0.060 | 0.524 | –3.3 | |
| 719501 | Dallam | 4% | - | - | - | |
| 726101 | Hartley | 6% | - | - | - | |
| 249901 | Dallam | Ogallala | 73% | 0.970 | <0.01 | –10.2 |
| 233501 | Dallam | 65% | 0.625 | <0.01 | –4.9 | |
| 262401 | Hartley | 81% | 0.839 | <0.01 | –3.8 | |
| 712401 | Hartley | 100% | 0.883 | <0.01 | –2.6 | |
| 2 Central | ||||||
| 659901 | Randall | Dockum | 67% | 0.515 | <0.01 | 1.0 |
| 742901 | Oldham | 77% | 0.259 | <0.01 | –1.0 | |
| 750601 | Deaf Smith | 81% | 0.080 | 0.069 | 0.6 | |
| 756501 | Potter | Ogallala | 96% | 0.813 | <0.01 | –1.6 |
| 763601 | Randall | 94% | 0.890 | <0.01 | –3.7 | |
| 1013305 | Deaf Smith | 96% | 0.946 | <0.01 | –6.1 | |
| 3 South | ||||||
| 1125502 | Swisher | Dockum | 79% | 0.080 | 0.073 | –2.8 |
| 1136109 | Swisher | 54% | 0.586 | <0.01 | –2.9 | |
| 1155803 | Floyd | 48% | 0.515 | <0.01 | 0.6 | |
| 2339501 | Crosby | 15% | 0.143 | 0.357 | 1.4 | |
| 1136708 | Swisher | Ogallala | 73% | 0.850 | <0.01 | –4.6 |
| 2308701 | Floyd | 98% | 0.986 | <0.01 | –1.9 | |
| 2330103 | Crosby | 100% | 0.000 | 0.908 | 0.0 | |
Table 3.
Aggregate water quality parameters for aquifers according to spatial groups from 1990 to 2021. Values shown are mean ± 95% confidence levels.
Table 3.
Aggregate water quality parameters for aquifers according to spatial groups from 1990 to 2021. Values shown are mean ± 95% confidence levels.
| Spatial Group | ||||
|---|---|---|---|---|
| Parameter | Aquifer | North | Central | South |
| Temperature (°C) | Ogallala | 19.6 ± 1.6 | 17.6 ± 0.2 | 18.9 ± 0.2 |
| Dockum | 17.7 ± 1.6 | 18.2 ± 0.6 | 20.5 ± 0.5 | |
| Specific Conductivity (uS/cm) | Ogallala | 516 ± 12 | 579 ± 5 | 673 ± 22 |
| Dockum | 1080 ± 1177 | 1447 ± 210 | 1058 ± 274 | |
| pH | Ogallala | 7.54 ± 0.02 | 7.51 ± 0.03 | 7.37 ± 0.03 |
| Dockum | 7.92 ± 0.34 | 7.88 ± 0.11 | 7.61 ± 0.14 | |
| Total Alkalinity (mg/L as CaCO3) | Ogallala | 200.4 ± 4.4 | 227 ± 4.8 | 262.4 ± 4.0 |
| Dockum | 193 ± 33.7 | 336 ± 36.9 | 305 ± 26.3 | |
| Total Hardness (mg/L as CaCO3) | Ogallala | 222 ± 5 | 235 ± 3 | 260.0 ± 9.5 |
| Dockum | 196 ± 79 | 175 ± 76 | 162 ± 30 | |
| SAR (meq/L)0.5 | Ogallala | 0.91 ± 0.06 | 7.36 ± 12.48 | 1.37 ± 0.24 |
| Dockum | 3.10 ± 5.58 | 19.99 ± 4.41 | 12.56 ± 4.80 | |
Table 4.
Basic water quality comparison for all Ogallala and Dockum aquifer samples.
| Parameter | Ogallala | Dockum | ||
|---|---|---|---|---|
| Range | Mean | Range | Mean | |
| SPC (μS/cm) | 330–1100 | 690 | 8–2500 | 1200 |
| TA (mg/L as CaCO3) | 140–370 | 240 | 48–620 | 300 |
| TH (mg/L as CaCO3) | 150–370 | 270 | 5–540 | 120 |
| SAR (mM)1/2 | 0.34–5.1 | 1.3 | 0.98–67 | 19 |
| NO3 (mg/L) | nd–38 | 12 | nd–22 | 3.5 |
| pH | 7–8.4 | 7.5 | 7.4–9.4 | 8.1 |
| ORP (mV) | (+28)–(+320) | (+190) | (–210)–(+280) | (+28) |
| DO (mg/L) | 0.13–15 | 5.8 | 0.07–7.4 | 2.1 |
| temperature (°C) | 8.9–20 | 17 | 4.9–27 | 19 |
TDS = total dissolved solids, TA = total alkalinity, TH = total hardness, SAR = sodium adsorption ratio, ORP = oxidation–reduction potential measured against a Ag/AgCl reference electrode, DO = dissolved oxygen.
Table 5.
Standard sample deviations by spatial group and for the entire study region in SPC (μS/cm) for Dockum samples only. Standard deviations are organized according to the instances when the location is kept the same and the time is changing (same well location, different sample events) and when the time is kept the same and the location is changing (same sample event, different well locations).
| Spatial Group | SPC (uS/cm) | ||
|---|---|---|---|
| Standard Deviation in Time | Standard Deviation in Space | Standard Deviation in All Samples | |
| North | 390 | 380 | 510 |
| Central east | 160 | 450 | 420 |
| Central west | 290 | 490 | 490 |
| Southwest | 88 | 83 | 110 |
| West | 30 | nes | 30 |
| All | 220 | 570 | 570 |
nes = Not enough samples to calculate standard deviation.
Table 6.
Groundwater study samples by hydro chemical class. All percentages are in reference to the total number of samples taken per aquifer, whether Dockum (n = 46) or Ogallala (n = 35).
Table 6.
Groundwater study samples by hydro chemical class. All percentages are in reference to the total number of samples taken per aquifer, whether Dockum (n = 46) or Ogallala (n = 35).
| Class | Type | Symbol | Ogallala | Dockum |
|---|---|---|---|---|
| 1 | alkali–alkali earth | Alk | 9% | 76% |
| 2 | alkali–alkali earth | AlkE | 91% | 24% |
| 3 | strong–weak acids | St-acid | 0% | 39% |
| 4 | strong–weak acids | Wk-acid | 100% | 61% |
| 5 | cation | Ca | 0% | 0% |
| 6 | cation | Mg | 23% | 0% |
| 7 | cation | NaK | 9% | 76% |
| 8 | cation | mix cation | 69% | 24% |
| 9 | anion | HCO3 | 100% | 61% |
| 10 | anion | Cl | 0% | 9% |
| 11 | anion | SO4 | 0% | 4% |
| 12 | anion | mix anion | 0% | 26% |
| 13 | facies | Mg-HCO3 | 91% | 13% |
| 14 | facies | Ca-Cl | 0% | 0% |
| 15 | facies | Na-Cl | 0% | 28% |
| 16 | facies | Na-HCO3 | 0% | 39% |
| 17 | facies | NaK-HCO3 | 9% | 9% |
| 18 | facies | CaMg-SO4Cl | 0% | 11% |
Table 7.
Spatial group tendencies for mineral and gas precipitates for calcium-, CO2-, and iron-related products. Only high saturation index minerals are shown which are likely to precipitate. The percentage values show indicate the percentage of Ogallala water in each blend.
Table 7.
Spatial group tendencies for mineral and gas precipitates for calcium-, CO2-, and iron-related products. Only high saturation index minerals are shown which are likely to precipitate. The percentage values show indicate the percentage of Ogallala water in each blend.
| Spatial Group | Tendency for Super Saturation of Minerals and Gases |
|---|---|
| North | Aragonite (0–60%); dolomite (0–90%); ferric hydroxide, goethite, hematite (all blends) |
| Central east | Aragonite (20–30%); dolomite (0–80%); |
| Central west | Ferric hydroxide, goethite, hematite (0–90%) |
| West | Dolomite (20–40%) |
| Southwest | Dolomite (10–60%) |
Table 8.
Blended water quality results for Dockum and Ogallala wells in the vicinity of each other, within the same spatial grouping. The first value indicates the predicted parameter results for the 50/50 blend of the two aquifers. Numbers in parentheses are the minimum to maximum range allowed considering all binary blend possibilities.
| Parameter | North | Central East | Central West | Southwest | West |
|---|---|---|---|---|---|
| Temp (°C) | 18.2 (18.1–18.2) | 18.2 (17.3–19.2) | 17.2 (14.6–19.7) | 18.0 (16.7–19.4) | 18.2 (17.1–19.4) |
| pH | 8.5 (7.8–9.4) | 8.1 (7.5–8.8) | 7.4 (7.4–7.5) | 7.7 (7.2–8.3) | 7.7 (7.3–8.0) |
| T–hard (ppm) | 96 (46–146) | 141 (16–266) | 225 (121–330) | 175 (14–335) | 164 (45–284) |
| SPC (dS/m, mS/cm) | 0.51 (0.37–0.66) | 0.80 (0.63–1.01) | 1.12 (0.85–1.41) | 1.10 (0.75–1.49) | 0.77 (0.77–0.78) |
| SAR (mM0.5) | 4.5 (0.5–12.2) | 5.9 (0.9–31.8) | 5.8 (1.2–13.9) | 8.0 (0.6–53.3) | 4.5 (1.4–13.7) |
| B (mg/L) | 0.09 (0.06–0.12) | 0.80 (0.19–1.41) | 0.52 (0.21–0.83) | 0.51 (0.12–0.90) | 0.53 (0.24–0.82) |
| Cl (meq/L) | 3.5 (0.0–7.0) | 1.4 (0.1–2.7) | 3.2 (1.4–5.1) | 2.0 (0.6–3.4) | 0.9 (0.9–1.0) |
| NO3 (mg/L) | 5.5 (0.0–11.1) | 2.9 (0.6–5.3) | 35.4 (2.1–68.7) | 22.5 (1.9–43.2) | 70.7 (2.2–139.3) |
T-hard = total hardness; SPC = specific conductivity; SAR = sodium adsorption ratio.
Table 9.
Hazard class ranges for determination of level of hazard category.
| Hazard Level | ||||
|---|---|---|---|---|
| Hazard Type | Unit | None | Slight | Severe |
| Salinity (SPC) | dS/m | 0–0.75 | 0.75–3 | >3 |
| Sodicity (SAR-SPC) | SAR-SPC interaction specific | |||
| Boron (B) | mg/L | 0–0.7 | 0.7–3 | 3–100 |
| Chloride (Cl-) | meq/L | 0–4 | 4–10 | >10 |
| Nitrate nitrogen (NO3-N) | mg/L | 0–5 | 5–30 | >30 |
Publisher’s Note: MDPI stays neutral with regard to jurisdictional claims in published maps and institutional affiliations. |
© 2021 by the author. Licensee MDPI, Basel, Switzerland. This article is an open access article distributed under the terms and conditions of the Creative Commons Attribution (CC BY) license (https://creativecommons.org/licenses/by/4.0/).
Share and Cite
MDPI and ACS Style
Howell, N. Comparative Water Qualities and Blending in the Ogallala and Dockum Aquifers in Texas. Hydrology 2021, 8, 166. https://doi.org/10.3390/hydrology8040166
AMA Style
Howell N. Comparative Water Qualities and Blending in the Ogallala and Dockum Aquifers in Texas. Hydrology. 2021; 8(4):166. https://doi.org/10.3390/hydrology8040166
Chicago/Turabian StyleHowell, Nathan. 2021. "Comparative Water Qualities and Blending in the Ogallala and Dockum Aquifers in Texas" Hydrology 8, no. 4: 166. https://doi.org/10.3390/hydrology8040166
Note that from the first issue of 2016, this journal uses article numbers instead of page numbers. See further details here.