Article

Evaluation and Calibration of Alternative Methods for Estimating Reference Evapotranspiration in the Senegal River Basin

1
Laboratoire Leïdi Dynamique des Territoires et Développement, Université Gaston Berger (UGB), BP 234 Saint Louis, Senegal
2
UFR S2ATA Sciences Agronomiques, de l’Aquaculture et des Technologies Alimentaires, Université Gaston Berger, BP 234 Saint-Louis, Senegal
3
Laboratoire LSAO “Laboratoire des Sciences de l’Atmosphère et de l’Océan”, Université Gaston Berger (UGB), BP 234 Saint-Louis, Senegal
4
HydroSciences Montpellier, University of Montpellier, IRD, CNRS, CC 057, 163 rue Auguste Broussonnet, 34090 Montpellier, France
5
Department of Plant and Environmental Sciences, New Mexico State University, Agricultural Science Center at Farmington, P.O. Box 1018, Farmington, NM 87499, USA
*
Author to whom correspondence should be addressed.
Hydrology 2020, 7(2), 24; https://doi.org/10.3390/hydrology7020024
Submission received: 3 April 2020 / Revised: 23 April 2020 / Accepted: 24 April 2020 / Published: 28 April 2020
(This article belongs to the Special Issue Advances in the Ecohydrology of Arid Lands)

Abstract

:
Reference evapotranspiration (ET0) is a key element of the water cycle in tropical areas for the planning and management of water resources, hydrological modeling, and irrigation management. The objective of this research is to assess twenty methods in computing ET0 in the Senegal River Basin and to calibrate and validate the best methods that integrate fewer climate variables. The performance of alternative methods compared to the Penman Monteith (FAO56-PM) model is evaluated using the coefficient of determination (R2), normalized root mean square error (NRMSE), percentage of bias (PBIAS), and the Kling–Gupta Efficiency (KGE). The most robust methods integrating fewer climate variables were calibrated and validated and the results show that Trabert, Valiantzas 2, Valiantzas 3, and Hargreaves and Samani models are, respectively, the most robust for ET0 estimation. The calibration improves the estimates of reference evapotranspiration compared to original models. It improved the performance of these models with an increase in KGE values of 45%, 32%, 29%, and 19% for Trabert, Valiantzas 2, Valiantzas 3, and Hargreaves and Samani models, respectively. From a spatial point of view, the calibrated models of Trabert and Valiantzas 2 are robust in all the climatic zones of the Senegal River Basin, whereas, those of Valiantzas 3 and Hargreaves and Samani are more efficient in the Guinean zone. This study provides information on the choice of a model for estimating evapotranspiration in the Senegal River Basin.

Graphical Abstract

1. Introduction

Evapotranspiration (ET) is an essential component for the planning and management of water resources [1,2,3,4,5], irrigation programming [6], drought studies [7], and climate change [8,9]. In addition, when combined with precipitation, evapotranspiration can be a drought index and a classification tool for climates [7,10]. In the agricultural field, evapotranspiration is an essential parameter for the management of water resources and the optimization of irrigation at the plot scale [11]. Indeed, it is used for the estimation of crop water requirements [12]. Evapotranspiration is also a climate synthesis and therefore an indicator of climate change [13,14]. In fact, the evapotranspiration process is controlled by climate variables (temperature, solar radiation, relative humidity, wind), edaphic variables (soil type), and physiological factors [15].
Reference evapotranspiration (ET0) is the estimation of the evapotranspiration from a hypothetical grass reference actively growing, completely shading the ground and not short of water with an assumed crop height of 0.12 m, a fixed surface resistance of 70 s/m, and an albedo of 0.23 [16,17]. ET0 can be determined by in situ measurements (lysimeter, pan, atmometer, scintillometer, Eddy covariance) or computed from weather data [18]. Direct measurement is indicated for evapotranspiration estimation [19,20,21]. However, instruments are expensive and difficult to maintain [2,18]. Therefore, several authors [22,23,24,25,26,27] have developed evapotranspiration estimation methods. Among these methods, Penman Monteith (FAO56-PM) is recommended as a reference method [18]. However, the number of climate variables (temperature, radiation, wind speed, and relative humidity) that it integrates constrains its use in developing countries where access to climate data is difficult [28,29,30].
In this context, alternative methods integrating fewer climate variables are used [22,23,25,27,31,32,33]. These alternative methods are classified into four categories according to climate variables that integrate [3] (i) aerodynamic [22,31,33,34,35], (ii) temperature-based [25,26,36,37,38], (iii) radiation-based [2,23,31,39,40], (iv) and combinatory methods [3,24,27]. These different methods have been developed in specific contexts. Therefore, they must be calibrated and validated for improving their performance and adapt them to other climate conditions [1,29]. In this regard, different methods of estimating ET0 have been evaluated and calibrated under various climate conditions around the world [3,12,29,41,42,43,44]. In the Senegal River Valley, Djaman et al. [29] evaluated 15 evapotranspiration estimation methods. They have shown that the models of Valiantzas, Trabert, Romanenko, Schendel, and Mahinger are more robust in this area. In another study, Djaman et al. [45] evaluated and calibrated six methods for estimating ET0 in the Senegal River Delta. Their results show that the Valiantzas 2 method is more effective among the six methods evaluated. However, these two studies are limited to specific areas of the Senegal River Basin. To our knowledge, no study has been interested in the evaluation and calibration/validation of alternative methods of estimating ET0 at the Senegal River Basin. Thus, the objective of this study is to evaluate 20 methods for estimating reference evapotranspiration and to calibrate and validate the best methods integrating fewer climate variables in order to adapt them to the context of the Senegal River Basin.

2. Materials and Methods
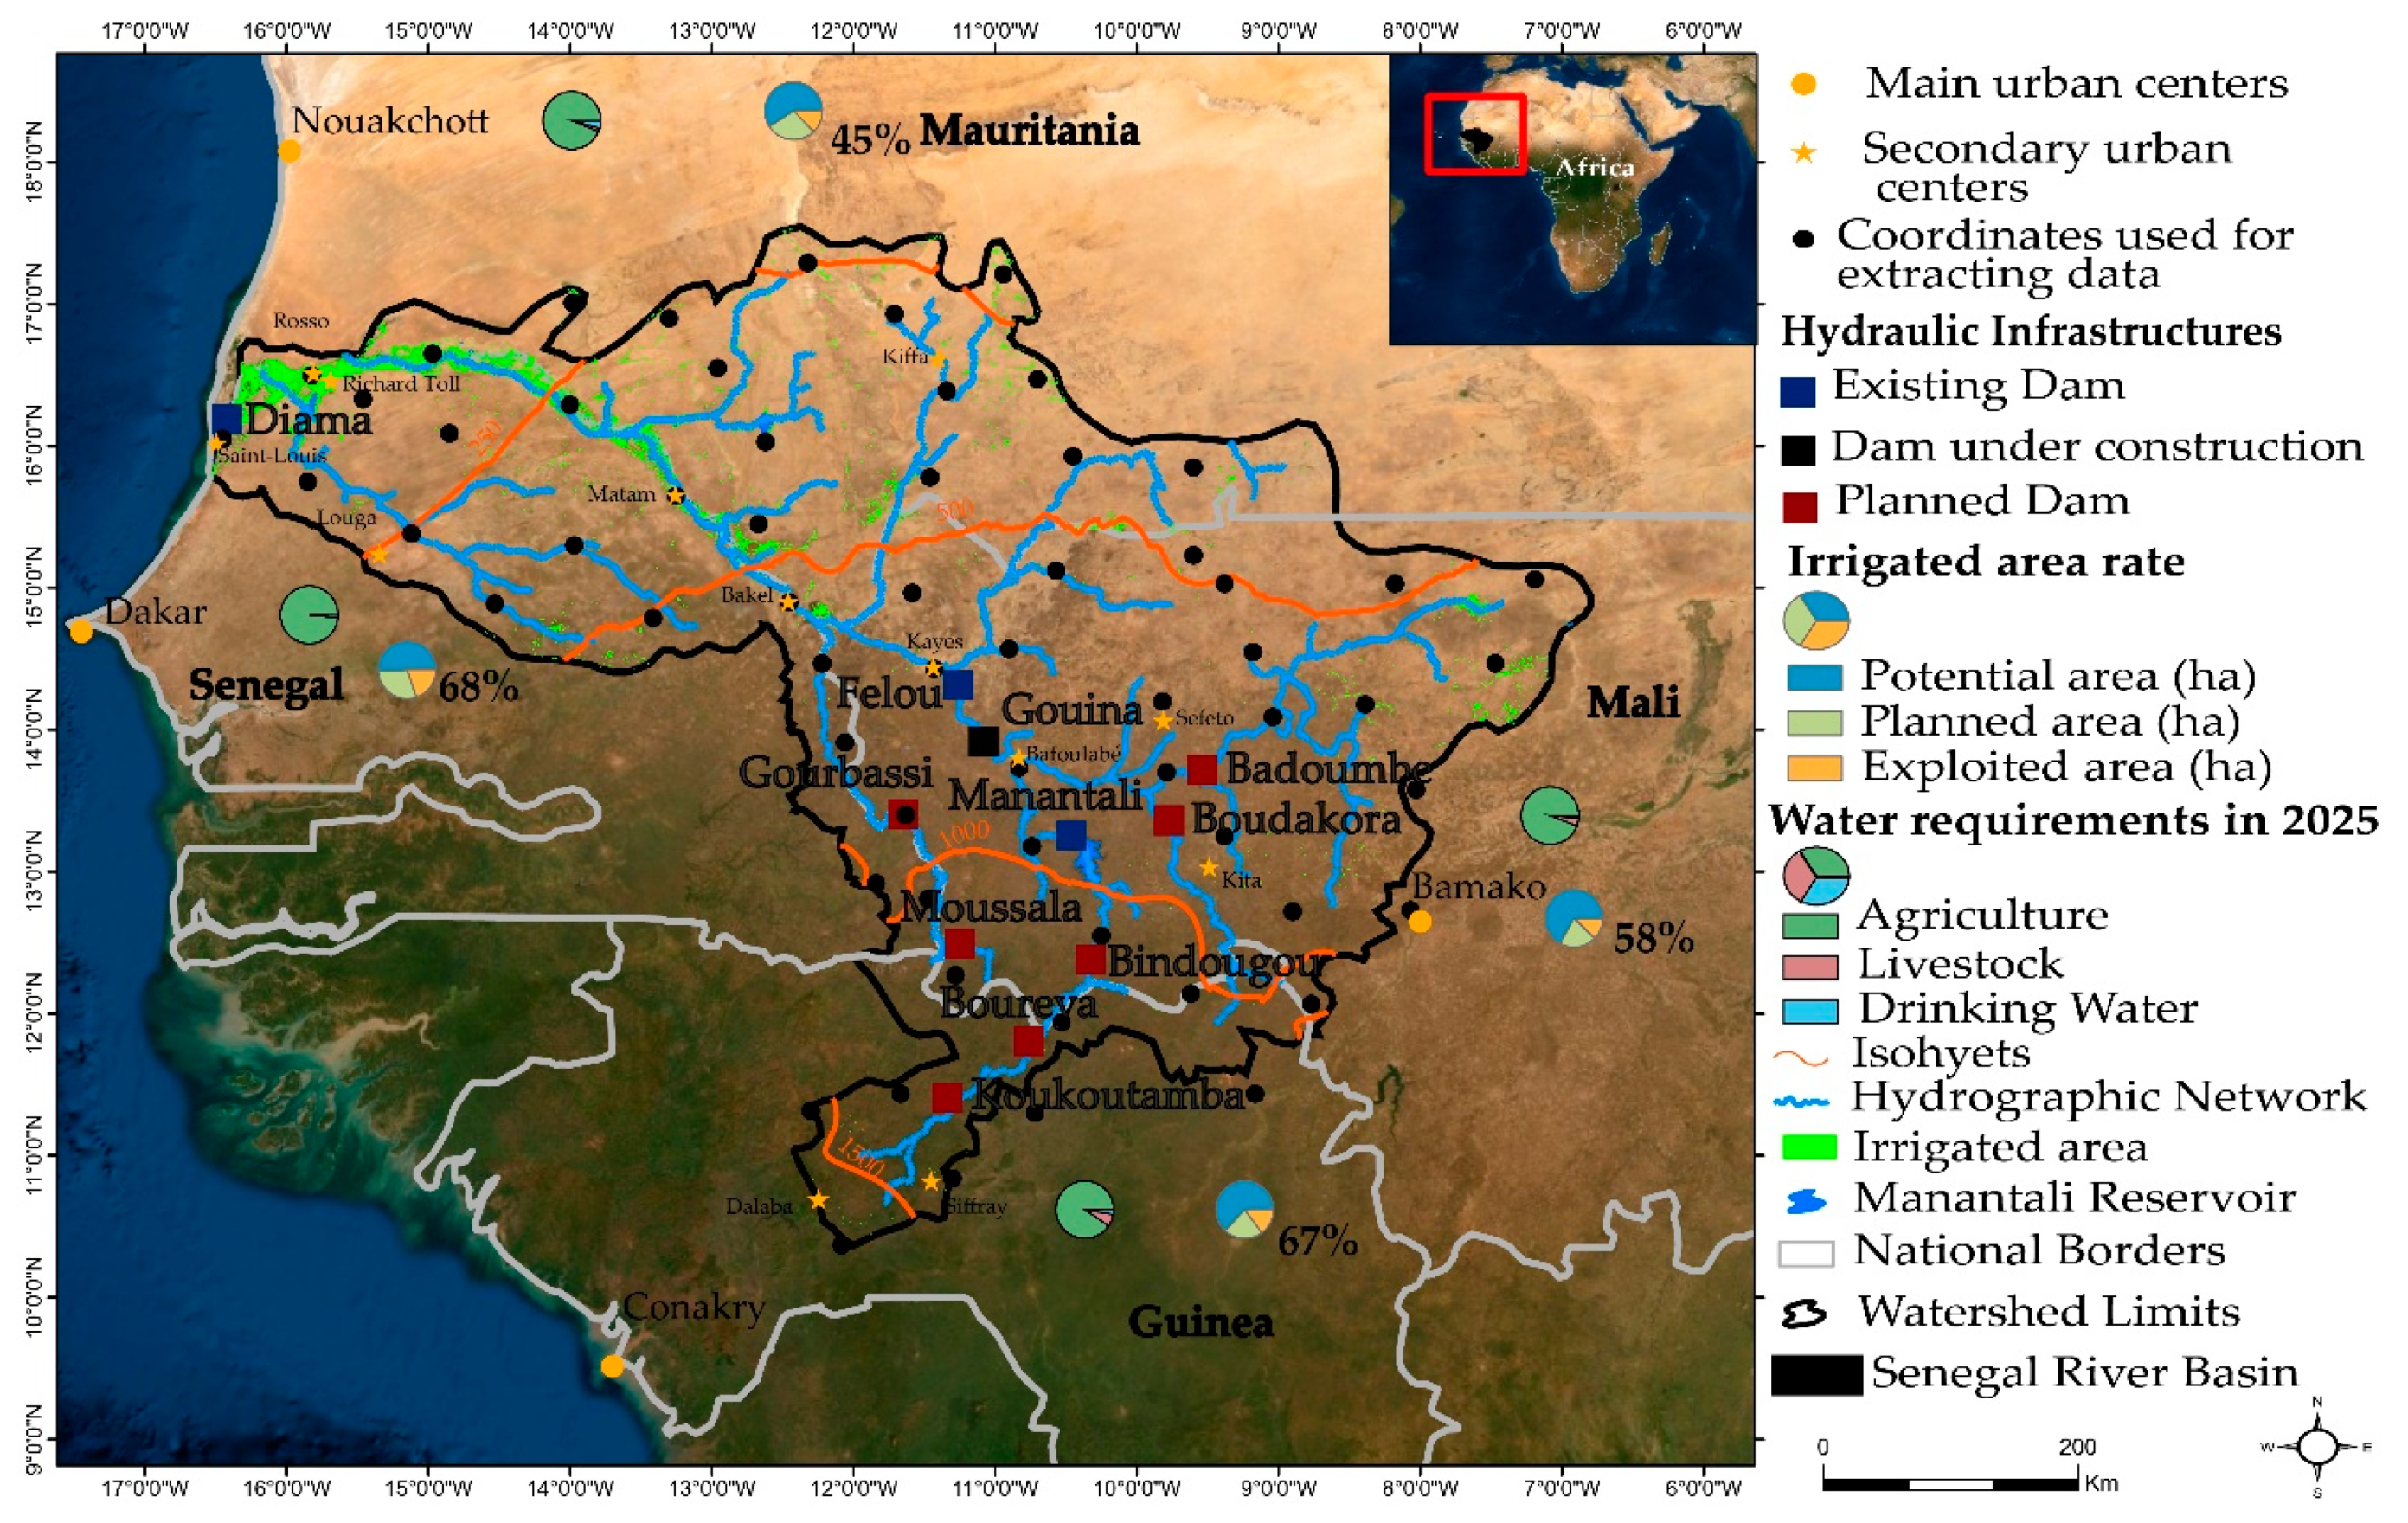
2.1. Study Area

The Senegal River Basin covers an area of 300,000 km2 [46] and extends over four countries: Guinea, Mali, Senegal, and Mauritania (Figure 1). According to the latitudinal distribution of precipitation, Dione [47] identified four main climatic zones: Guinean (average annual rainfall: P > 1500 mm), South Sudanian (1000 < P < 1500 mm), North Sudanian (500 < P < 1000 mm), and Sahelian (P < 500 mm). The Senegal River average annual flow at Bakel station (Figure 1) over the period 1950–2014 was 600 m3/s, an average annual volume of 18 billion m3. Bakel is considered as the reference station of the Senegal river basin because it is located downstream from the three Senegal River tributaries: Bafing, the Bakoye, and the Faleme. Senegal River water resources are used for hydroelectricity production, navigation, drinking water supply and irrigated agriculture [28]. The potential irrigable land at the Senegal River Basin is estimated at 408,900 hectares with an irrigated area of 21,2937 hectares [48]. The percentage of exploited potential irrigable land varies from 45 to 68% depending on the country (Figure 1). Several hydraulic infrastructures have been built by the Organization for the Development of the Senegal River (in French, Organisation pour la Mise en Valeur du fleuve Sénégal, OMVS): Diama in 1986, Manantali in 1988, and Felou in 2013. The Diama dam’s role is to stop the saltwater intrusion and to allow the development of irrigation in the Senegal River Valley and the Delta. Manantali, on the Bafing tributary, is a multifunctional dam with a capacity of 11 billion m3 of water, thus allowing an electrical production of 800 GWh/year and an irrigation capacity of 255,000 ha. Felou is a run-of-river dam with an electricity production capacity of 350 GWh/year. Several other dams are planned (Figure 1) to increase the production of hydroelectricity and to regulate the Faleme and Bakoye tributaries.

2.2. Data

In West Africa, climate data managed by national meteorological services are difficult for researchers to access due to their high cost of acquisition [30,49]. In addition, the low density of the observation network poses a problem of representativeness of these data at the scale of the watershed. However, the large-scale study of evapotranspiration requires several measurement points due to the heterogeneity of the landscapes and the variation in energy transfer processes [50]. Therefore, in this study, both reanalysis and observation data from the NASA Langley Research Center (LaRC) POWER Project funded through the NASA Earth Science/Applied Science Program (https://power.larc.nasa.gov, accessed on 20 December 2018) were used as an alternative to the observed weather station data that are inaccessible or scattered. These data have the advantage of having a spatial and temporal coverage on a global scale [51,52,53,54,55] and provide the climate variables necessary for the estimation of reference evapotranspiration [48,53]. For the extraction of reanalysis data, the coordinates of rainfall stations (Figure 1) from the OMVS database [29] were used. The climate variables extracted on a daily basis over the period 1984–2017 are: temperature (max and min), relative humidity, wind speed and solar radiation. A summary of these variables according to climate zones is given in Table 1.

2.3. Method

The methodology was organized into the following three steps: (i) calculation of the reference evapotranspiration by the FAO56-PM method and by 20 alternative methods, (ii) evaluation of the performance of these alternative methods compared to the FAO56-PM, and (iii) calibration and validation of the best methods integrating fewer climate variables.

2.3.1. Estimation of Reference Evapotranspiration

FAO56-PM (1) and twenty alternative methods (2–21) were used to estimate the reference evapotranspiration. FAO56-PM consider the following characteristics defined by Allen et al. [18]: reference surface characterized by short and green vegetation (grass for this study), adequately supplied in water, uniform height (0.12 m), albedo of 0.23, and resistance surface of 70 m/s. This method is recommended as a reference method for the estimation of ET0 without adjustment or integration of parameters [18]. Its formulation is as follows:
ET 0 FAO 56 PM = 0.408 Δ ( Rn G ) + γ Cn T + 273.3 u 2   ( es ea ) Δ + γ ( 1 + Cdu 2 )
where ET0FAO56-PM is the reference evapotranspiration (mm/day); Rn: net radiation on the crop surface (MJ·m−2d−1); G is the heat flux density of the soil (MJ·m−2d−1), which is ignored on a daily scale; T is the average daily air temperature at a height of 2 m (°C); Cn and Cd are constant values, which change according to the scale of time used (on a daily scale Cn and Cd are 900 and 0.34 respectively); u2 is the wind speed at a height of 2 m (ms−1); es is the saturated vapor pressure (kPa); ea is real vapor pressure (kPa); (es—ea) is the saturation deficit (kPa); Δ is the vapor pressure slope curve (kPa°C−1); and γ is the psychrometric constant (kPa°C−1).
The alternative methods are classified into the following four categories (Table 2): aerodynamic, radiation-based, temperature-based, and combinatory methods. The choice of these methods is justified by their frequent use, the simplicity of their implementation, and their performance under different climate conditions.

2.3.2. Performance of the Alternative Methods

The performance of alternative methods for estimating ET0 is evaluated using the coefficient of determination (R2), the normalized root mean square error (NRMSE), the percentage of bias (PBIAS), and (iv) the Kling–Gupta Efficiency (KGE) [56]. R2 provides information on the degree of agreement, the NRMSE estimates the average deviation and PBIAS gives the underestimation/overestimation of ET0 by alternative methods. KGE combines both the correlation coefficient (r), the biases (β), and the variability (γ). The formulation of these different criteria, their amplitude of variation and their optimal value are given in Table 3.

2.3.3. Calibration and Validation

Two criteria are used to choose the methods to be calibrated—the performance of the method to estimate ET0 and the number of climate variables that it integrates. The methods integrating only two or three climate variables are preferred for calibration/validation. The calibration consists of changing the constant values of the methods in order to increase their performance [57]. The objective is to optimize the value of the KGE and reduce the errors obtained during the evaluation. For this, the series is divided into two parts as recommended by Xu and Singh [1]: 2/3 of the series (1984–2005) for calibration and 1/3 (2006–2017) for validation. The calibration is done by applying the generalized method of gradient reduction [58]. For each method, a constant value is changed to optimize the KGE and reduce the NRMSE by using iteration method. R2, NRMSE, PBIAS, and KGE, as well as the Taylor diagram [59], are used to assess the performance of the methods after calibration/validation.

3. Results and Discussion

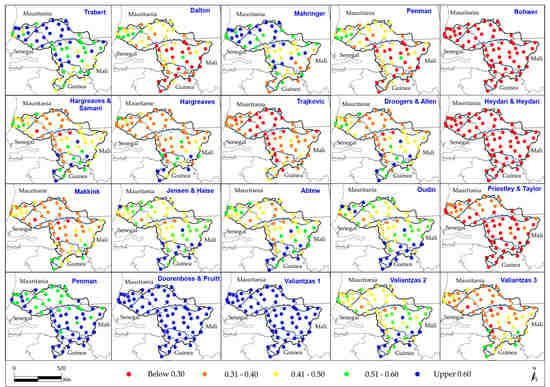
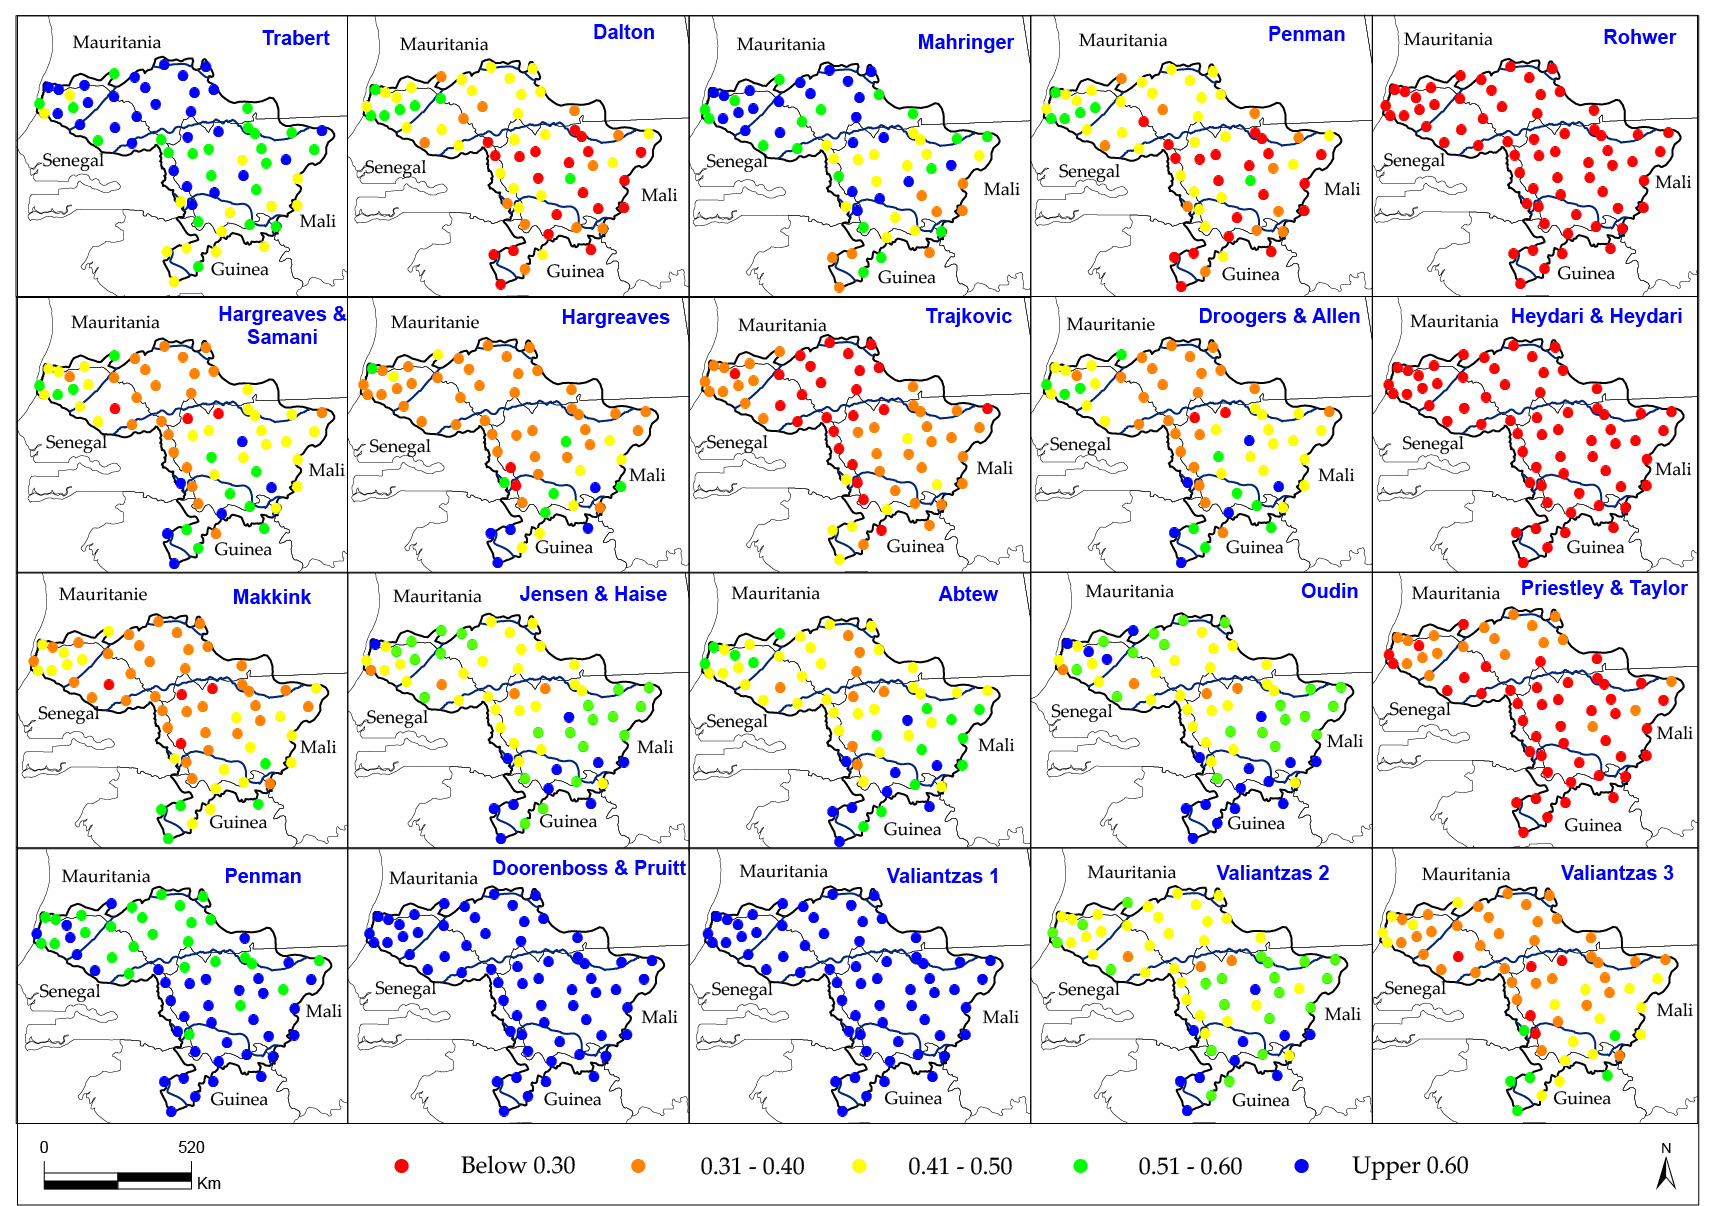
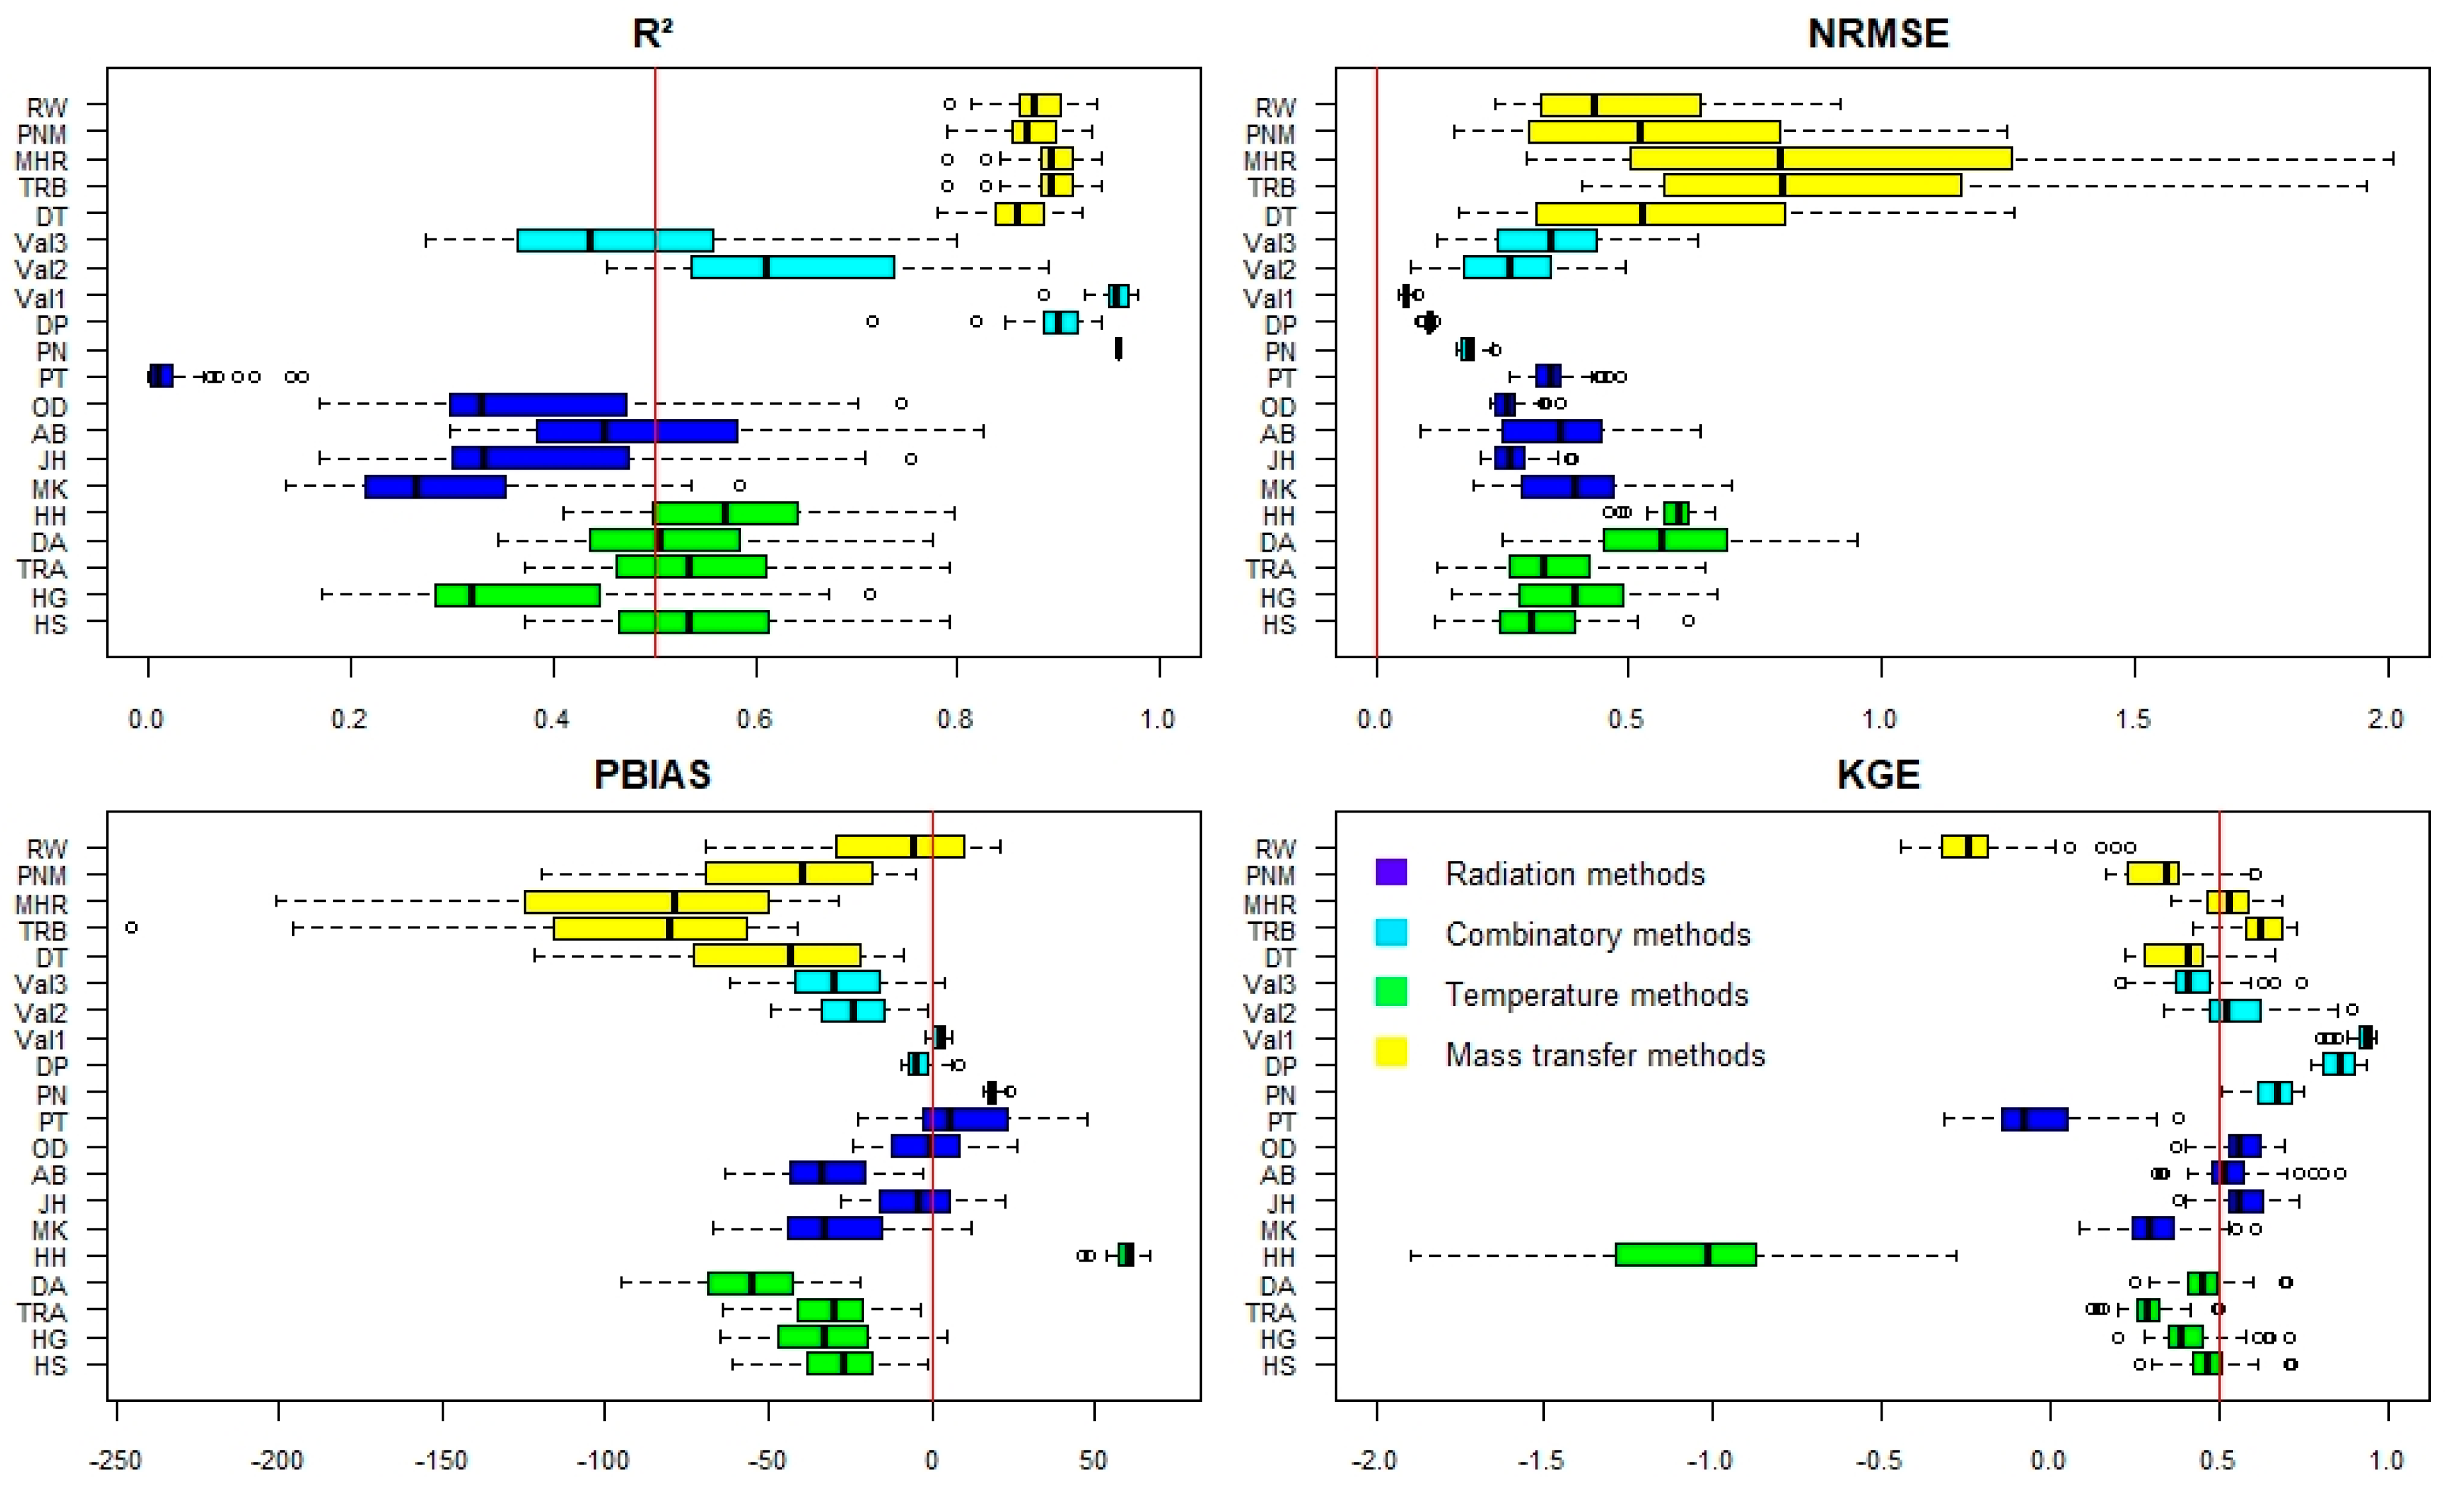
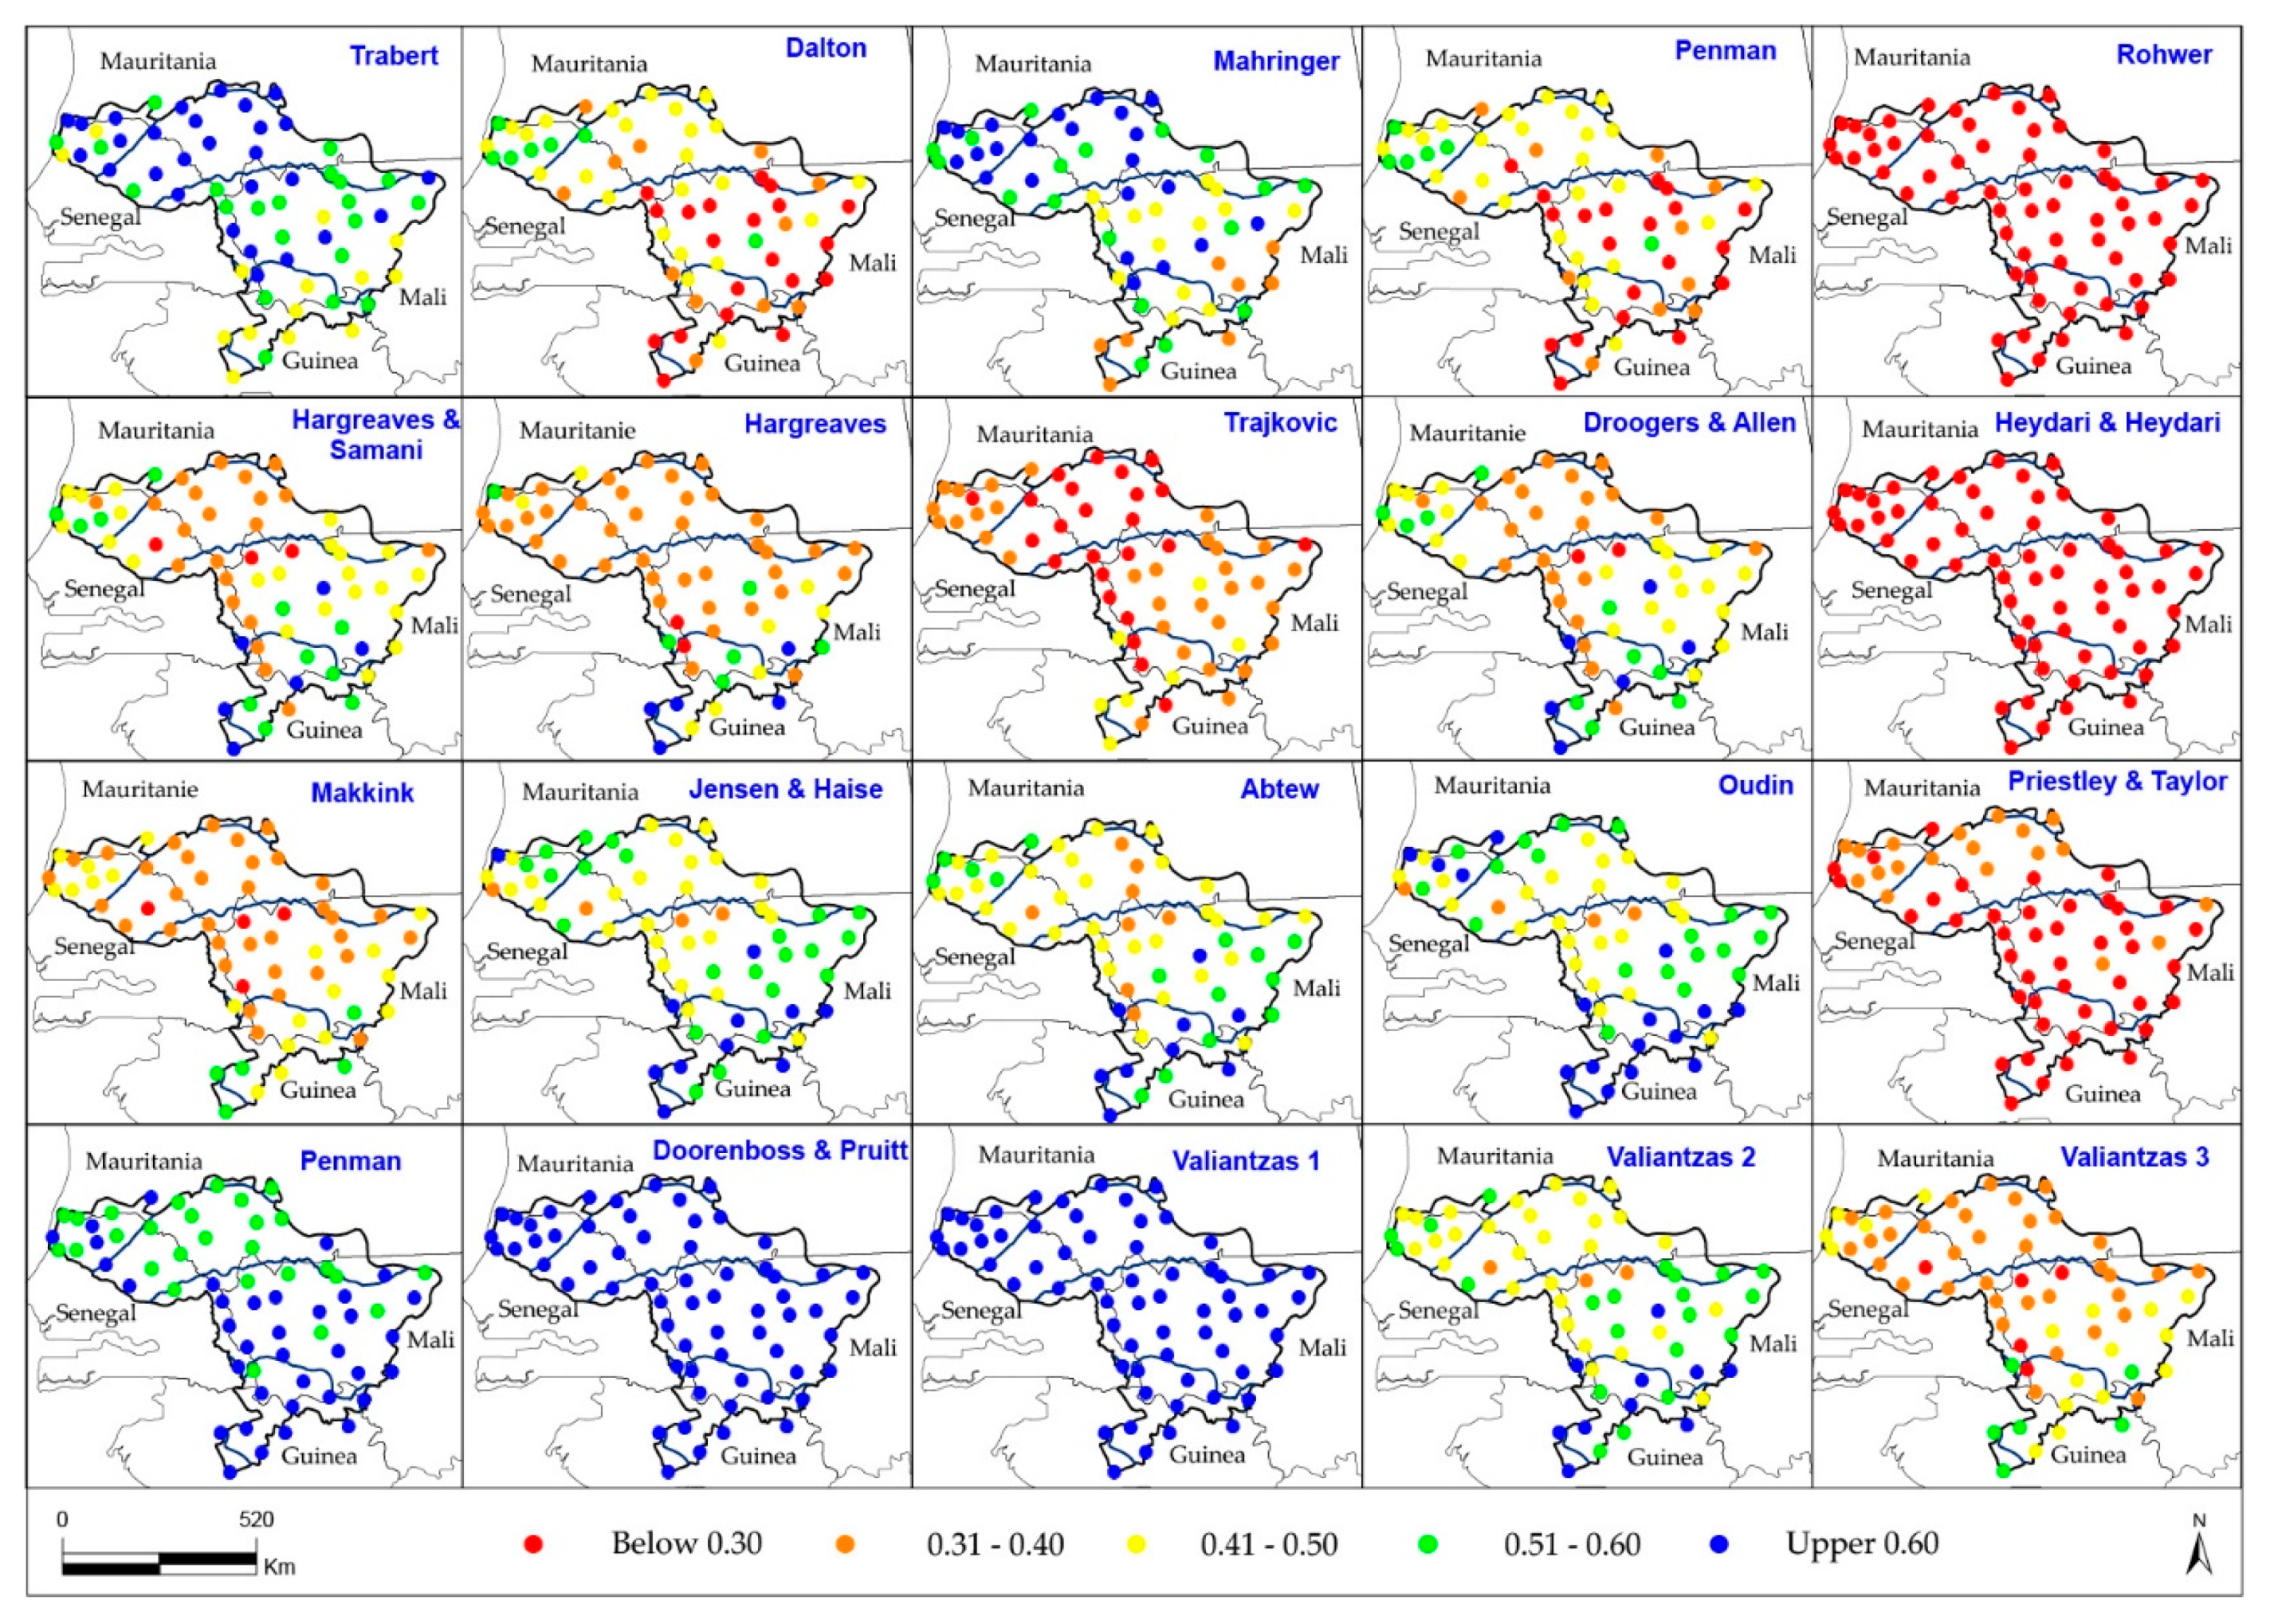
3.1. Performance of the Twenty Methods

Figure 2 shows the performance of the twenty alternative methods according to the four criteria selected. The combinatory methods of Valiantzas 1 (Val 1), Doorenboss and Pruitt (DP), and Penman (PN) are more robust for estimating reference evapotranspiration. Indeed, they have high coefficients of determination and KGE: Val 1 (R2 = 0.96, KGE = 0.93), DP (R2 = 0.90, KGE = 0.85), and PN (R2 = 0.96, KGE = 0.66). The errors of estimation of ET0 by these methods are low with NRMSE values of 0.06, 0.11, and 0.18 for Val 1, DP, and PN, respectively. PBIAS analysis shows that Val 1 and DP methods slightly underestimate ET0 (PBIAS of −2.23 for Val 1 and −9.63 for DP). In contrast, the PN method overestimates ET0 by 16.13%. The method of Val 2 has values of R2 and KGE of 0.67 and 0.55 and that of Val 3 of 0.47 and 0.42. However, compared to the FAO56-PM method, Val 2 underestimates ET0 by 48.9% and Val 3 by 61.9%.
Figure 3 shows the spatial distribution of KGE values. It shows that the combinatory models of Val 1, DP, and PN are robust in all Senegal River basin climate zones. They have KGE values that vary from 0.51 to 0.97 over the entire basin. The performance of these methods is explained by the fact that they integrate the same climate variables as those of FAO56-PM. Among the methods integrating fewer climate variables, Trabert, Val 2, Val 3, HS, and JH are most robust (Figure 2 and Figure 3). The performance of these methods varies depending on the climate zones of the basin. Indeed, Trabert’s aerodynamic method is more accurate in the Sudanian and Sahelian zones with KGE values varying from 0.69 to 0.73. Similar results were obtained by Djaman et al. [29] in the Senegal River Valley. The performance of aerodynamic methods was also noted by [3] in Iran, Singh and Xu [60] in northwestern Ontario (Canada), and Djaman et al. [61] in Tanzania and Kenya. However, Ndiaye et al. [62] have shown that aerodynamic methods perform poorly in Burkina Faso. This difference could be explained by the constant values of these methods that do not adapt to all climate conditions. The performance of aerodynamic methods is explained by the fact that wind speed and temperature play an important role in evapotranspiration in arid and semi-arid environments [63].
In the Guinean zone, the combinatory (Val 2, Val 3) and temperature-based (HS) methods give the best results for estimating ET0. Indeed, the values of KGE (Figure 2 and Figure 3) of Val 2 vary from 0.82 to 0.90, those of Val 3 from 0.53 to 0.74, and the KGE of the HS model vary from 0.53 to 0.74. Errors in estimating ET0 by these methods are also small in the Guinean area. These results are similar with those of Tabari [28] who showed the robustness of radiation and temperature-based methods in a humid climate in Iran. The performance of combinatory and temperature-based methods in the Guinean area of the basin is explained by the fact that they integrate solar radiation and temperature which have more impact on ET0 in humid climates [64,65]. According to these authors, in humid regions, the air is close to saturation and evapotranspiration is strongly influenced by the available energy (temperature and radiation).
The evaluation of the twenty alternative methods for estimating reference evapotranspiration shows overall that the combinatory methods of Doorenboss and Pruitt, Penman, Valiantzas 1, 2, the aerodynamics models of Trabert and Mahinger, the based-on temperature of Hargreaves and Samani, and Jensen and Haise’s radiation-based models present the best estimates of reference evapotranspiration. The methods of Rohwer (aerodynamics), Heydari and Heydari (based on temperature), and Priestley and Taylor (based on radiation) are less robust among the 20 methods. Based on their performance and the reduced number of climate variables they integrate, the methods of TRB, Val 2, Val 3, HS, and JH are selected for calibration.

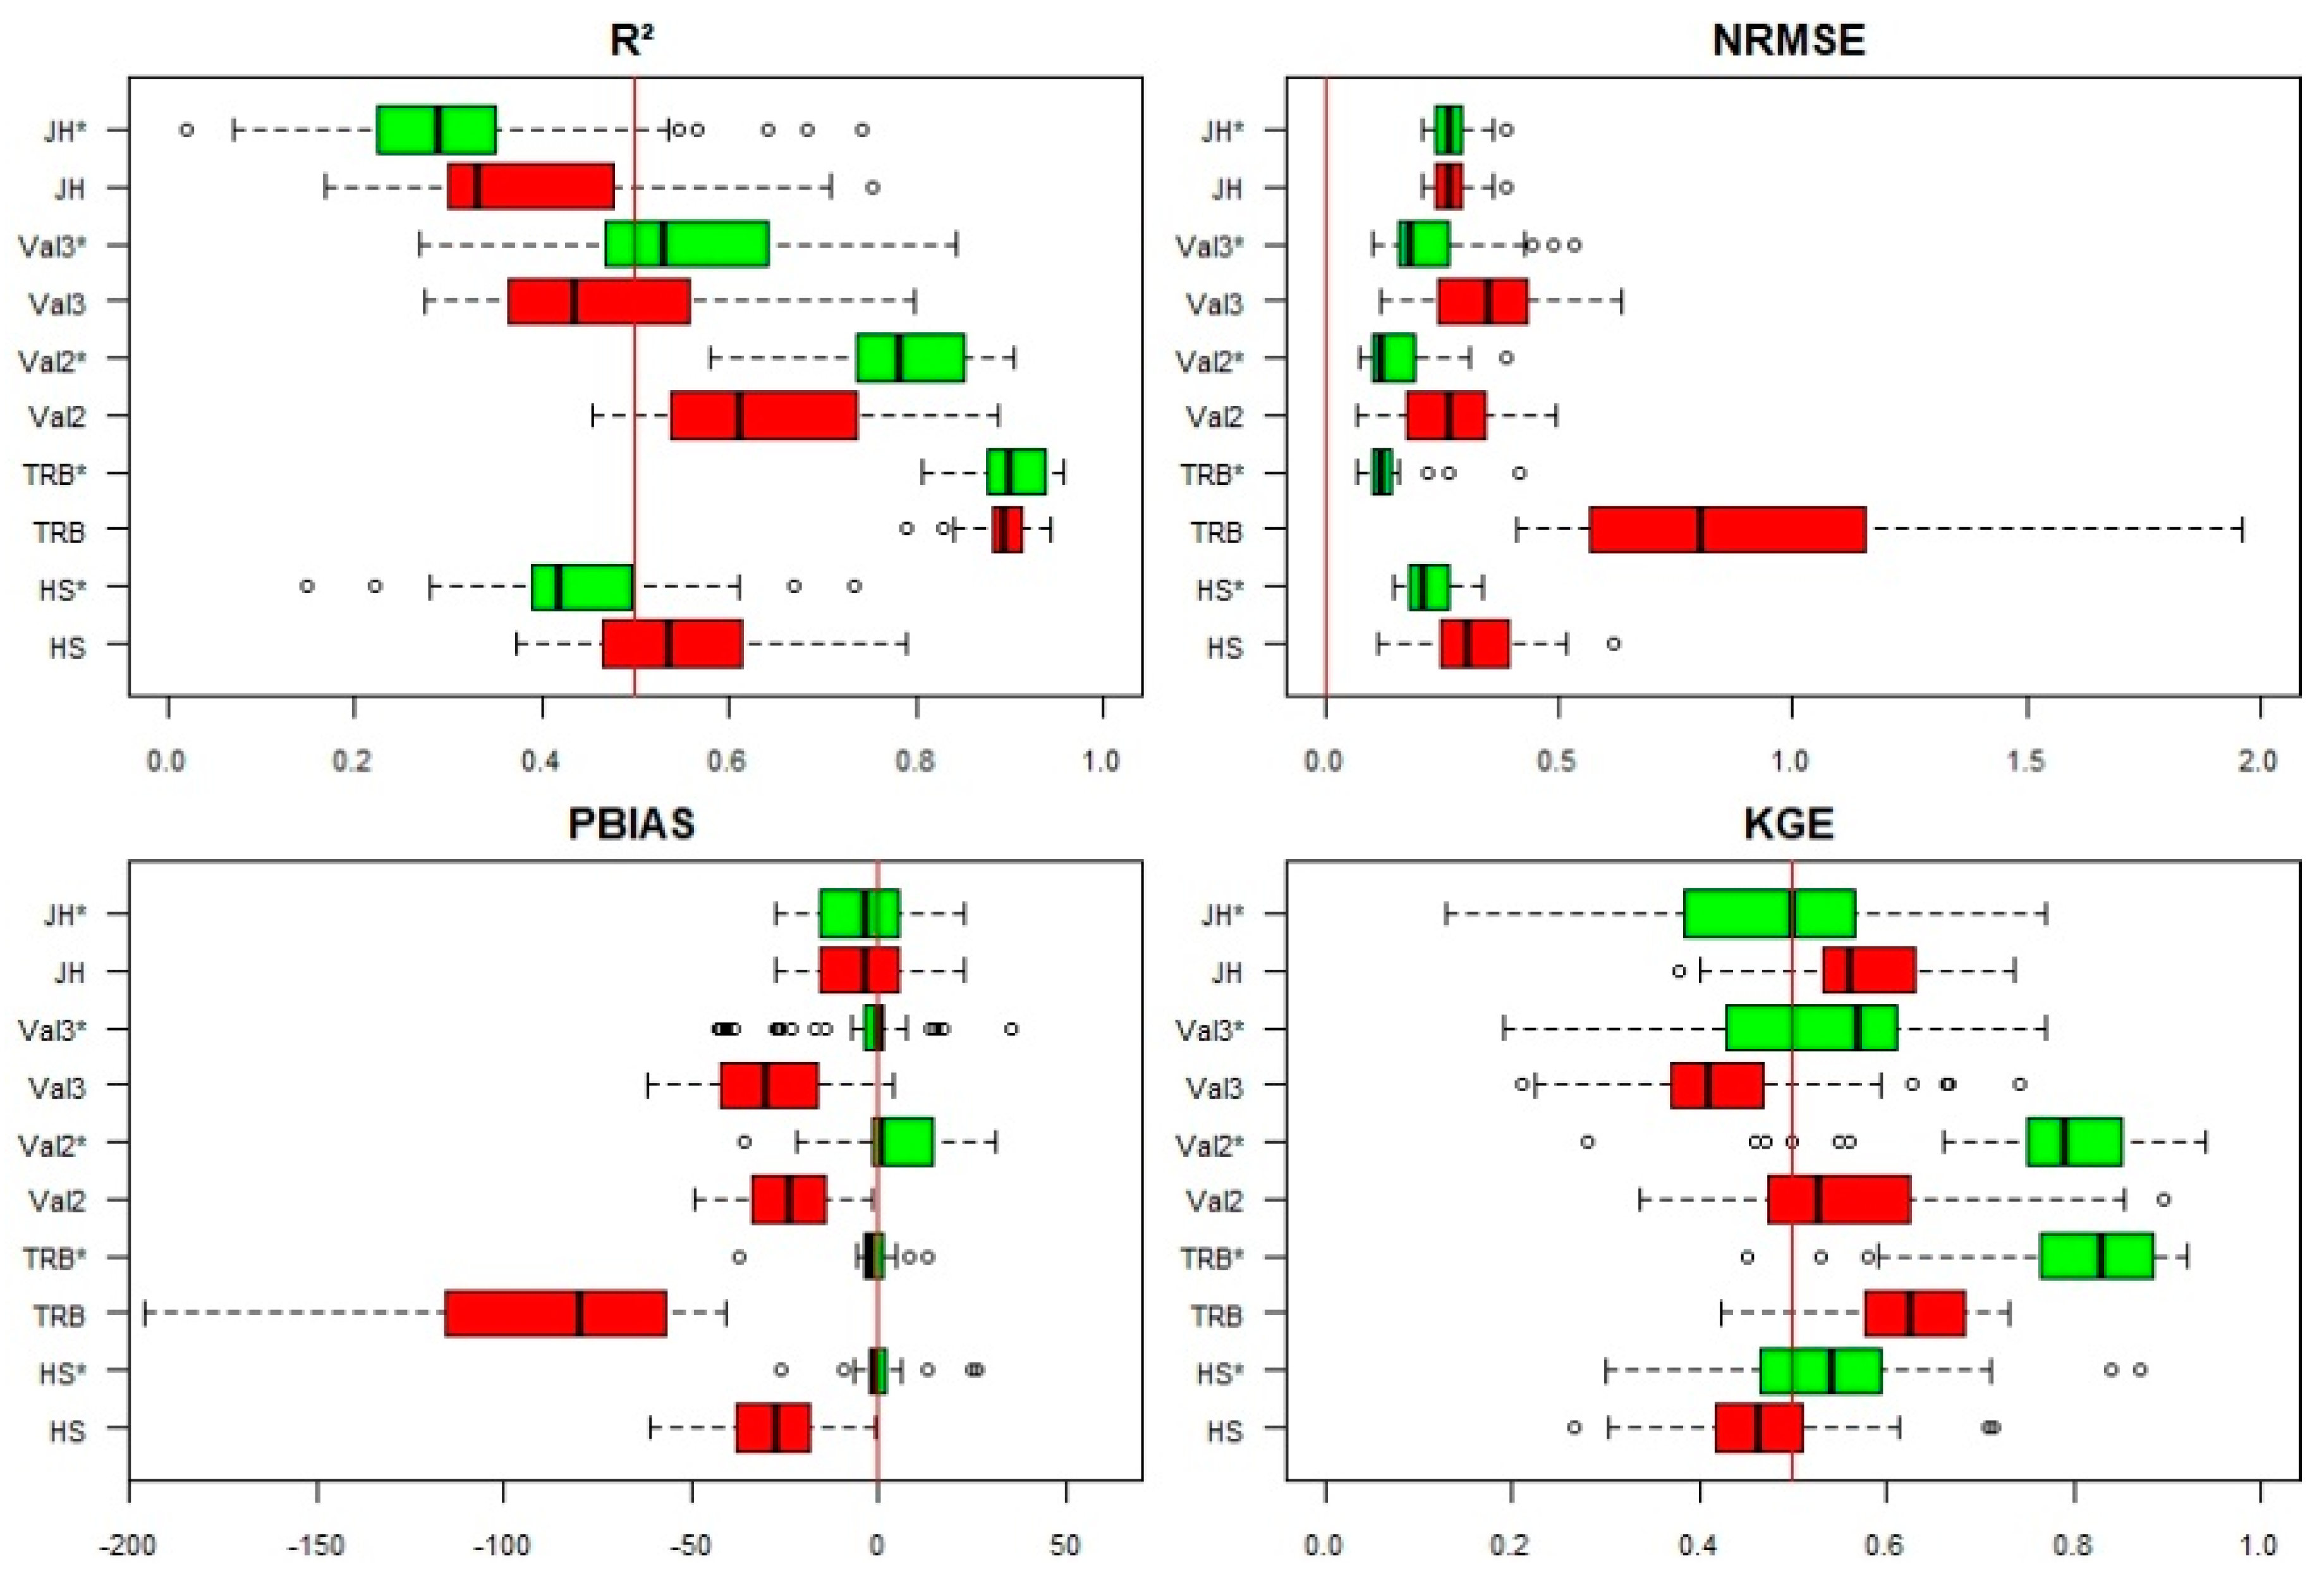
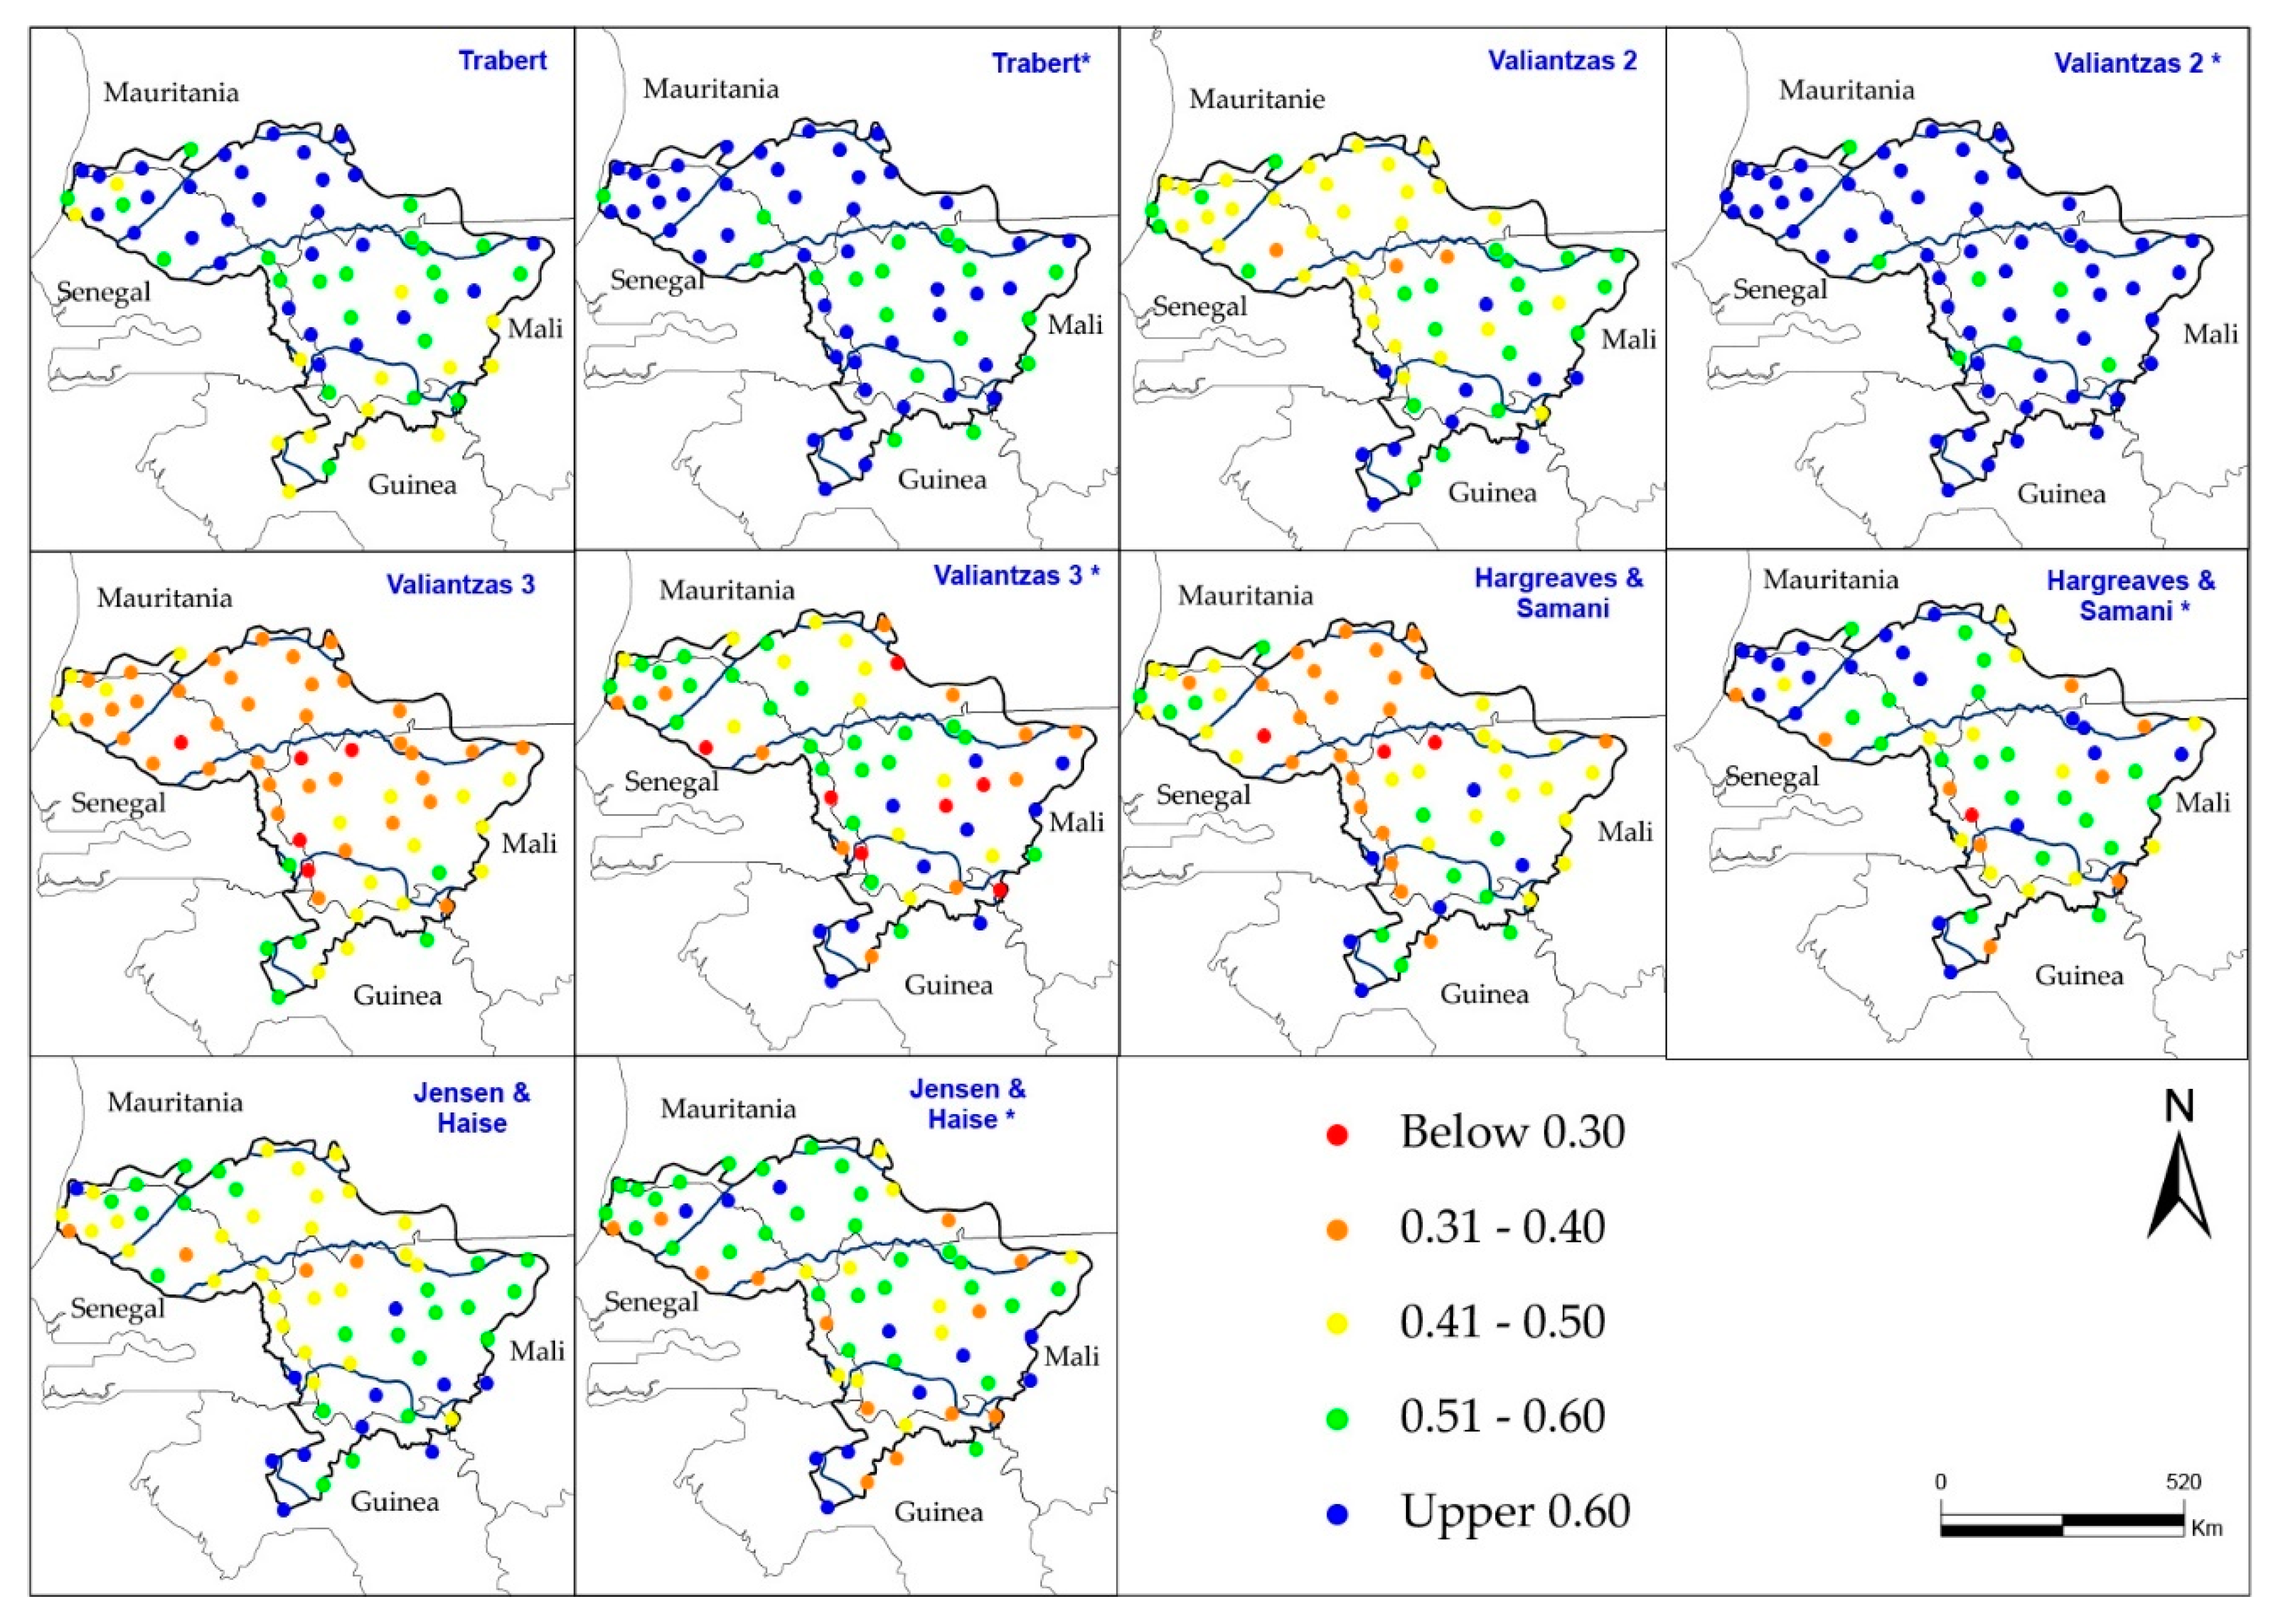
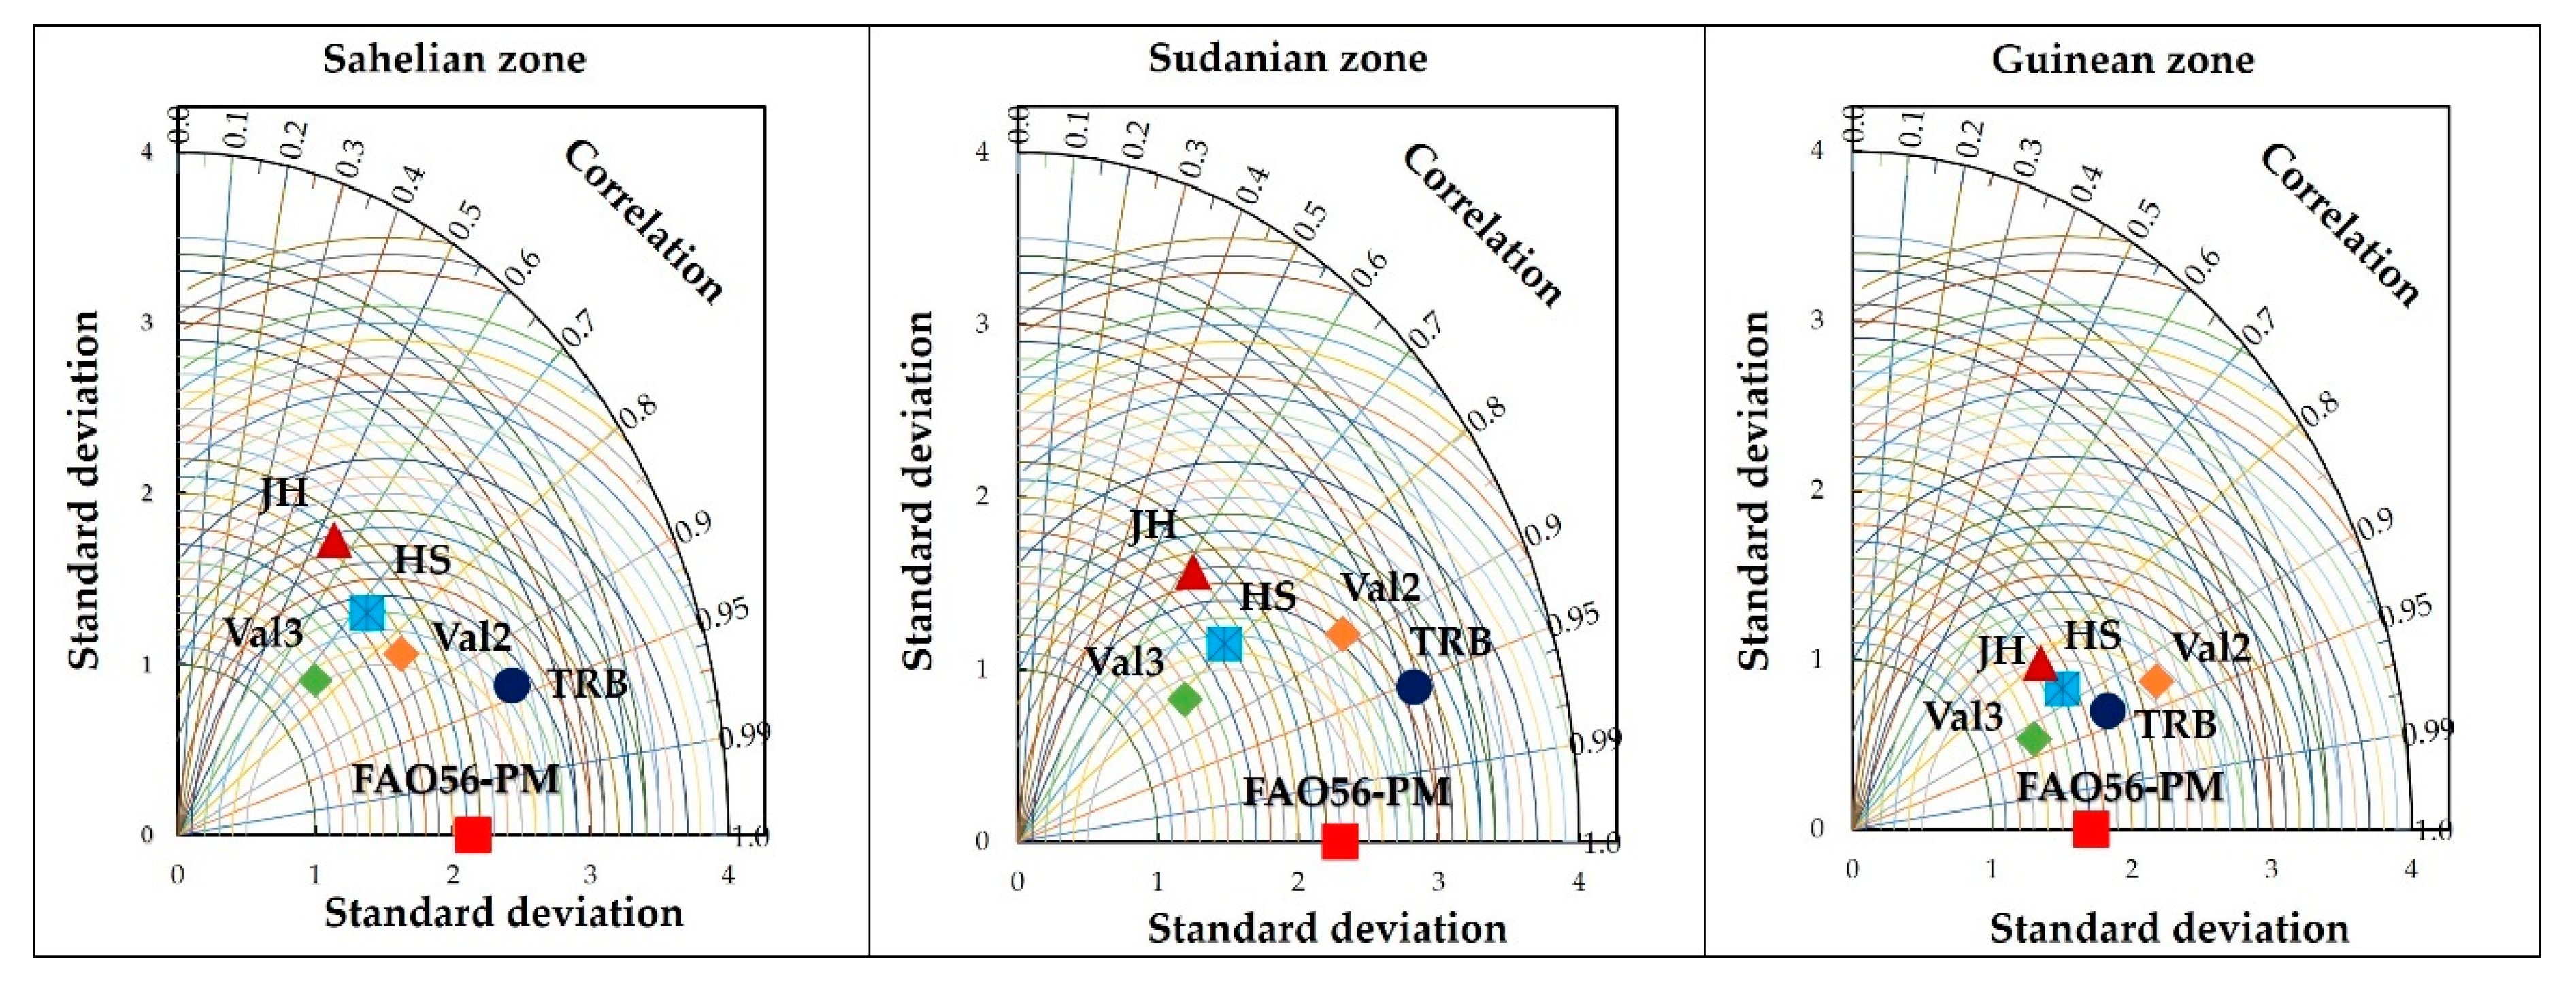
3.2. Calibration and Validation of the Best Methods

Table 4 gives the best methods for estimating ET0 before and after calibration, and Figure 4 and Figure 5 give the performance of these methods according to the previously selected evaluation criteria.
The calibration/validation improved the performance of the TRB, Val 2, Val 3, and HS methods. In fact, it increased the KGE of Trabert’s method by 32% and reduced estimation errors by 97%. However, a deterioration in the performance of the JH method is noted after calibration which is different from Irmak et al. [63], who reported that calibration of the JH method gives better results in humid climates. This deterioration could be explained by the poor performance of this method in semi-arid climates
The KGE values of the Val 2, Val 3, and HS methods are improved by 45%, 29%, and 19%, respectively, after calibration. On the other hand, the KGE of the JH method is degraded by 16% after calibration. Analysis of the results of the calibration/validation shows that the TRB and Val 2 methods always remain robust over the entire basin, while those of Val 3 and HS always remain more robust in the Guinean field. This is explained by the role of wind on the ET0 in arid environments and that of temperature and radiation in humid climates.
Data for the period 2006–2017 are used for the validation of the calibrated methods. Figure 6 gives the Taylor diagram which compares the results of the five validated methods and the FAO56-PM one as a function of climate zones, and Figure 7 gives the distribution of PBIAS. Results show that the methods of TRB and Val 2 always give the best estimates of ET0. They have the same amplitude of variation as the FAO56-PM method with high correlation coefficients between 0.93 and 0.95. The spatial distribution of the percentages of bias allows us to note that the Trabert method globally underestimates evapotranspiration from 1.1 to 37%. The most significant underestimates are noted in the Guinean zone where the Trabert method is less efficient. The Val 2 method overestimates the ET0 by 0.3%–31%, and the Val 3 methods, HS, and JH underestimate the reference evapotranspiration. These results are corroborated by those of Djaman et al. [29], who showed that the Trabert method underestimates the ET0 by 25% at the Ndiaye station in the Senegal river delta and by 6% at the Fanaye station in the Senegal river valley. In another study, Djaman et al. [45] showed that the Val 2 method underestimates the ET0 by-.13 mm in the Senegal delta. Ndiaye et al. [62] also showed that Trabert’s method underestimates ET0 in Burkina Faso.

4. Conclusions

The objective of this study is to assess the performance of 20 alternative methods for estimating reference evapotranspiration (ET0) in the Senegal river basin and to calibrate and validate the best methods in order to adapt them to the context of the Senegal river basin. The results show that the Trabert, Valiantzas 2, Valiantzas 3, Hargreaves and Samani, and Jensen and Haise methods are, respectively, the most robust for estimating ET0 in the Senegal River Basin. Calibration has improved the performance of all these methods except that of Jensen and Haise, whose performance is degraded after calibration. From a spatial point of view, the Trabert method is more efficient in the Sahelian and Sudanian zones. On the other hand, the methods integrating radiation and/or relative humidity (Valiantzas 2, Valiantzas 3, and Hargreaves and Samani) are more robust in the Guinean area of the basin. This study provides information on the choice of an ET0 estimation model based on available data and climate zones. When temperature and wind speed data are available, Trabert’s method can be used in all climatic zones of the basin for reference evapotranspiration estimation. When relative humidity, radiation, and temperature are available, the Valiantzas 2 method is recommended. The use of the Valiantzas 3 method is only encouraged when radiation and temperature are the only climate variables available. Finally, the HS method can be used when only temperature data are available. These results constitute a source of information on the choice of an adequate model for estimating reference evapotranspiration in the Senegal River Basin. This information can be useful for hydrological modeling, irrigation management, reservoir management, planning, and management of the basin’s water resources. However, the types of data (reanalyses) used can cause uncertainties in the results. In addition, the use of a single reanalysis product can also be a source of uncertainty. It would therefore be important to validate these results with in situ data even from a few stations when the availability and accessibility of the information allow.

Author Contributions

P.M.N., A.B., and L.D. designed the study, developed the methodology, and wrote the manuscript. P.M.N. collected the data and conducted the computer analysis with A.B. and L.D., while A.D. (Abdoulaye Deme), A.D. (Alain Dezetter), and K.D. reviewed and edited the paper. All authors have read and agreed to the published version of the manuscript.

Funding

This research has no funding.

Acknowledgments

Data used in this study were obtained from the NASA Langley Research Center (LaRC) POWER Project funded through the NASA Earth Science/Applied Science Program. The authors thank the two reviewers and the editors.

Conflicts of Interest

The authors declare no conflict of interest.

References

  1. Xu, C.Y.; Singh, V.P. Evaluation and generalization of temperature-based methods for calculating evaporation. Hydrol. Process. 2001, 14, 305–319. [Google Scholar]
  2. Oudin, L. Recherche d’un Modèle D’évapotranspiration Potentielle Pertinent Comme Entrée d’un Modèle Pluie-Débit Global (Search for a Relevant Potential Evapotranspiration Model as Input for a Global Rain-Flow Model). Ph.D. Thesis, L’école National de Génie Rural, des Eaux et Des Forêts (ENGREF), Paris, France, 2005; 496p. (In French). Available online: https://pastel.archives-ouvertes.fr/file/index/docid/499816/filename/memoire.pdf (accessed on 15 March 2020).
  3. Heydari, M.M.; Aghamajidi, R.; Beygipoor, G.; Heydari, M. Comparison and evaluation of 38 equations for estimating reference evapotranspiration in an arid region. FEB 2014, 23, 1985–1996. [Google Scholar]
  4. Jian, X.; Scherer, T.; Lin, D.; Zhang, X.; Refali, I. Comparison of reference evapotranspiration calculations for southeastern North Dakota. Irrig. Drain. Syst. Eng. 2013, 2, 1–9. [Google Scholar]
  5. Birhanu, D.; Kim, H.; Jang, C.; Park, S. Does the complexity of evapotranspiration and hydrological models enhance robustness? Sustainability 2018, 10, 2837. [Google Scholar] [CrossRef] [Green Version]
  6. Hong, T.; Tran, N.; Honti, M. Application of different evapotranspiration models to calculate total agricultural water demand in a tropical region. Period. Polytech. Civ. Eng. 2017, 61, 904–910. [Google Scholar] [CrossRef] [Green Version]
  7. Li, Y.; Feng, A.; Liu, W.; Ma, X.; Dong, G. Variation of aridity index and the role of climate variables in the Southwest China. Water 2017, 9, 743. [Google Scholar] [CrossRef] [Green Version]
  8. Wen, J.; Wang, X.; Guo, M.; Xu, X. Impact of climate change on reference crop evapotranspiration in Chuxiong City, Yunnan Province. Procedia Earth Planet. Sci. 2012, 5, 113–119. [Google Scholar]
  9. Tao, X.; Hua, C.; Xu, C.; Hou, Y.; Jie, M. Analysis and prediction of reference evapotranspiration with climate change in Xiangjiang River Basin, China. Water Sci. Eng. 2015, 8, 273–281. [Google Scholar]
  10. Thornthwaite, C.W. An approach toward a rational classification of climate. Geogr. Rev. 1948, 38, 55–94. [Google Scholar]
  11. Bigeard, G. Estimation Spatialisée de L’évapotranspiration à l’aide de Données Infra-Rouge Thermique Multi-Résolutions (Spatialized Evapotranspiration Estimation Using Multi-Resolution Thermal Infrared Data). Ph.D. Thesis, Université Toulouse III Paul Sabatier (UT3 Paul Sabatier), Toulouse, France, 2014; 259p. (In French). Available online: https://tel.archives-ouvertes.fr/tel-01620222/document (accessed on 15 March 2020).
  12. Muhammad, M.K.I.; Nashwan, M.S.; Shahid, S.; Ismail, T.I.; Song, Y.H.; Chung, E. Evaluation of empirical reference evapotranspiration models using compromise programming: A case study of peninsular Malaysia. Sustainability 2019, 11, 4267. [Google Scholar] [CrossRef] [Green Version]
  13. Jiao, L.; Wang, D. Climate change, the evaporation paradox, and their effects on Streamflow in Lijiang Watershed. Pol. J. Environ. Stud. 2018, 27, 2585–2591. [Google Scholar] [CrossRef]
  14. Chu, R.; Li, M.; Shen, S.; Islam, A.; Cao, W.; Tao, S.; Gao, P. Changes in reference evapotranspiration and its contributing factors in Jiangsu, a major economic and agricultural province of Eastern China. Water 2017, 9, 486. [Google Scholar] [CrossRef]
  15. Aubin, A. Estimation de L’évapotranspiration par Télédétection Spatiale en Afrique de L’Ouest: Vers une Meilleure Connaissance de Cette Variable clé Pour la Région (English Title Estimation of Evapotranspiration using Space Remote Sensing in West Africa: Towards a Better Knowledge of this Key Variable for the Region). Ph.D. Thesis, L’Universite Montpellier, Montpellier, France, 2018; 431p. (In French). Available online: https://tel.archives-ouvertes.fr/tel-02045897/document (accessed on 15 March 2020).
  16. Cosandey, C.; Robinson, M. Hydrologie Continentale; Armand Colin: Paris, France, 2000; 353p. [Google Scholar]
  17. Pereira, L.S.; Allen, R.G.; Smith, M.; Raes, D. Crop evapotranspiration estimation with FAO56: Past and future. Agric. Water Manag. 2014, 1–16. [Google Scholar] [CrossRef]
  18. Allen, R.; Pereira, L.; Raes, D.; Smith, M. Crop Evapotranspiration. Guideline for Computing Crop Requirements; FAO-Irrigation and Drainage Paper 56; FAO: Rome, Italy, 1998. [Google Scholar]
  19. Gocic, M.; Trajkovic, S. Analysis of trends in reference evapotranspiration data in a humid climate. Hydrol. Sci. J. 2014, 59, 165–180. [Google Scholar]
  20. Diop, L.; Bodian, A.; Diallo, D. Use of atmometers to estimate reference evapotranspiration in Arkansas. Afr. J. Agric. Res. 2015, 10, 4376–4683. [Google Scholar] [CrossRef] [Green Version]
  21. Douar, A. Mesure de L’évapotranspiration par Eddy Covariance. Effet de la Hauteur de Mesure et Variabilité Spatiale (Measuring Evapotranspiration by Eddy Covariance. Effect of Measuring Height and Spatial Variability). Master’s Thesis, Université Pierre-Marie-Curie, Paris, France, 2017; 44p. (In French). Available online: http://m2hh.metis.upmc.fr/wp-content/uploads/Douar_Abdelhak_memoireHH1617.pdf (accessed on 11 March 2020).
  22. Dalton, J. Experimental essays on the constitution of mixed gases; on the force of steam of vapor from waters and other liquids in different temperatures, both in a Torricellian vacuum and in air on evaporation and on the expansion of gases by heat. Mem. Manch. Lit. Philos. Soc. 1802, 5, 535–602. [Google Scholar]
  23. Makkink, G.F. Testing the Penman formula by means of lysimeters. J. Inst. Water Eng. 1957, 11, 277–288. [Google Scholar]
  24. Penman, H.L. Vegetation and Hydrology; Technical Communication No. 53; Commonwealth Bureau of Soils: Harpenden, UK, 1963; 125p. [Google Scholar]
  25. Hargreaves, G.H. Moisture availability and crop production. Trans. ASAE 1975, 18, 980–984. [Google Scholar]
  26. Hargreaves, G.H.; Samani, Z.A. Reference crop evapotranspiration from temperature. Am. Soc. Agric. Eng. 1985, 1, 96–99. [Google Scholar]
  27. Valiantzas, J. Simple ET0 of Penman’s equation without wind/or humidity data. II: Comparisons Reduced Set-FAO and other methodologies. Am. Soc. Civ. Eng. 2013, 139, 9–19. [Google Scholar] [CrossRef] [Green Version]
  28. Tabari, H. Evaluation of reference crop evapotranspiration equations in various climates. Water Resour. Manag. 2010. [Google Scholar] [CrossRef]
  29. Djaman, K.; Balde, A.B.; Sow, A.; Muller, B.; Irmak, S.; Ndiaye, M.K.; Saito, K. Evaluation of sixteen reference evapotranspiration methods under sahelian conditions in Senegal River Valley. J. Hydrol. Reg. Stud. 2015, 3, 139–159. [Google Scholar] [CrossRef] [Green Version]
  30. Bodian, A.; Diop, L.; Panthou, G.; Dacosta, H.; Deme, A.; Dezetter, A.; Ndiaye, P.M.; Diouf, I.; Vichel, T. Recent trend in hydroclimatic conditions in the Senegal River Basin. Water 2020, 12, 436. [Google Scholar] [CrossRef] [Green Version]
  31. Trabert, W. Neue beobachtungen über verdampfungsgeschwindigkeiten (New observations about evaporation rates). Meteorol. Z. 1896, 13, 261–263. (In German) [Google Scholar]
  32. Penman, H.L. Natural evaporation from open water, bare soil and grass. Proc. R. Meteorol. Soc. 1948, 193, 120–145. [Google Scholar]
  33. Abtew, W. Evapotranspiration measurement and modeling for three wetland systems in South Florida. Water Resour. Bull. 1996, 32, 465–473. [Google Scholar]
  34. Rohwer, C. Evaporation from Free Water Surfaces; Technical Bulletin 271; US Department of Agriculture: Washington, DC, USA, 1931. [Google Scholar]
  35. Mahringer, W. Verdunstungsstudien am Neusiedler see. Arch. Meteorol. Geophys. Bioklimatol. Ser. B 1970, 18, 1–20. [Google Scholar]
  36. Trajkovic, S.; Stojvic, V. Effect of wind speed on accuracy of Turc method in humid climate. Archit. Civ. Eng. 2007, 5, 107–113. [Google Scholar]
  37. Droogers, P.; Allen, R.G. Estimating reference evapotranspiration under inaccurate data conditions. Irrig. Drain. Syst. 2002, 16, 33–45. [Google Scholar] [CrossRef]
  38. Heydari, M.M.; Heydari, M. Evaluation of pan coefficient equations for estimating reference crop evapotranspiration in the arid region. Arch. Agron. Soil Sci. 2014, 60, 715–731. [Google Scholar] [CrossRef]
  39. Jensen, M.E.; Haise, H.R. Estimating evapotranspiration from solar radiation. J. Irrig. Drain. Div. 1963, 89, 15–41. [Google Scholar]
  40. Priestley, C.H.B.; Taylor, R.J. On the assessment of surface heat flux and evaporation using large scale parameters. Mon. Weath. Rev. 1972, 100, 81–92. [Google Scholar]
  41. Doorenbos, J.; Pruitt, W.O. Guidelines for Predicting Crop Water Requirements; FAO Irrigation and Drainag, Paper No. 24; FAO: Rome, Italy, 1977. [Google Scholar]
  42. Xu, C.Y.; Singh, V.P. Evaluation and generalization of radiation-based methods for calculating evaporation. Hydrol. Process. 2000, 14, 339–349. [Google Scholar]
  43. Ahooghalandari, M.; Khiadani, M.; Jahromi, M.E. Calibration of Valiantzas’ reference evapotranspiration equations for the Pilbara region, Western Australia. Appl. Clim. 2016. [Google Scholar] [CrossRef]
  44. Čadro, S.; Uzunovi, M.; Žurovec, J.; Žurovec, O. Validation and calibration of various reference evapotranspiration alternative methods under the climate conditions of Bosnia and Herzegovina. Int. Soil Water Conserv. Res. 2017, 5, 309–324. [Google Scholar] [CrossRef]
  45. Djaman, K.; Tabari, H.; Balde, A.B.; Diop, L.; Futakuchi, K.; et Irmak, S. Analyses, calibration and validation of evapotranspiration models to predict grass-reference evapotranspiration in the Senegal river delta. J. Hydrol. Reg. Stud. 2016, 8, 82–94. [Google Scholar] [CrossRef] [Green Version]
  46. Bodian, A. Approche par Modélisation Pluie-Débit de la Connaissance Régionale de la Ressource en Eau: Application dans le Haut Bassin du Fleuve Sénégal ( Rain-Flow Modeling Approach to Regional Knowledge of Water Resources: Application in the Upper Basin of the Senegal River ). Ph.D. Thesis, Université Cheikh Anta Diop de Dakar, Dakar, Senegal, 2011; 211p. (In French). Available online: http://hydrologie.org/THE/BODIAN.pdf (accessed on 10 March 2020).
  47. Dione, O. Evolution Climatique Récente et Dynamique Fluviale dans les Hauts Bassins des Fleuves Sénégal et Gambie ( Recent Climate Evolution and Fluvial Dynamics in the High Basins of the Senegal and Gambia Rivers). Ph.D. Thesis, Université de Lyon 3 Jean Moulin, ORSTOM, Paris, France, 1996; 438p. (In French). Available online: http://horizon.documentation.ird.fr/exl-doc/pleins_textes/pleins_textes_7/TDM_7/010012551.pdf (accessed on 10 March 2020).
  48. SDAGE-OMVS. Etat des Lieux et Diagnostique; Rapport Provisoire 2009, Rapport de Phase III; SDAGE-OMVS: Dakar, Senegal, 2011. [Google Scholar]
  49. Bodian, A.; Dezetter, A.; Deme, A.; Diop, L. Hydrological evaluation of TRMM rainfall over the upper Senegal River Basin. Hydrology 2016, 3, 15. [Google Scholar] [CrossRef] [Green Version]
  50. Srivastava, P.; Han, D.; Ramirez, M.A.; Islam, T. Comparative assessment of evapotranspiration derived from NCEP and ECMWF global datasets through Weather Research and Forecasting model. Atmos. Sci. Lett. 2013, 14, 118–125. [Google Scholar] [CrossRef]
  51. Poccard-Leclercq, I. Etude Diagnostique de Nouvelles Données Climatiques: Les Réanalyses. Exemples D’application aux Précipitations en Afrique Tropicale (Diagnostic Study of New Climate Data: Reanalyses. Application to Precipitation in Tropical Africa). PhD. Thesis, Géographie. Université de Bourgogne, Dijon, France, 2000; 255p. (In French). [Google Scholar]
  52. Ruane, A.C.; Goldberg, R.; Chryssanthacopoulos, J. Climate forcing datasets for agricultural modeling: Merged products for gap-filling and historical climate series estimation. Agric. For. Meteorol. 2015, 200, 233–248. [Google Scholar]
  53. Martins, D.S.; Paredes, P.; Razia, T.; Pires, C.; Cadima, J.; Pereira, L. Assessing reference evapotranspiration from reanalysis weather products. An application to the Iberian Peninsula. Int. J. Climatol. 2016, 37, 1–20. [Google Scholar] [CrossRef]
  54. Stackhouse, P.W.; Westberg, D., Jr.; Chandler, W.S.; Zhang, T.; Hoell, J.M. Prediction of Worldwide Energy Resource (POWER): Agroclimatology Methodology. 2018; 52p. Available online: https://power.larc.nasa.gov/documents/POWER_Data_v9_methodology.pdf (accessed on 20 December 2018).
  55. Purnadurga, G.T.V.; Kumar, L.; Rao, K.K.; Barbosa, H.; Mall, R.K. Evaluation of evapotranspiration estimates from observed and reanalysis data sets over Indian region. Int. J. Climatol. 2019, 39, 5791–5800. [Google Scholar] [CrossRef]
  56. Gupta, H.V.; Kling, H.; Yilmaz, K.K.; Martinez, G.F. Decomposition of the mean squared error and NSE performance criteria: Implications for improving hydrological modeling. J. Hydrol. 2009, 377, 80–91. [Google Scholar]
  57. Valipour, M. Calibration of mass transfer-based methods to predict reference crop evapotranspiration. Appl. Water Sci. 2015, 1–11. [Google Scholar] [CrossRef] [Green Version]
  58. Bogawski, P.; Bednorz, E. Comparison and validation of selected evapotranspiration models for conditions in Poland (Central Europe). Water Resour. Manag. 2014, 28, 5021–5038. [Google Scholar] [CrossRef] [Green Version]
  59. Taylor, K.E. Summarizing multiple aspects of model performance in a single diagram. J. Geophys. Res. Atmos. 2011, 106, 7183–7192. [Google Scholar] [CrossRef]
  60. Singh, V.P.; Xu, C.Y. Dependence of evaporation on meteorological variables at different time scales and intercomparison of estimation methods. Hydrol. Process. 1997, 12, 429–442. [Google Scholar]
  61. Djaman, K.; Koudahe, K.; Sall, M.; Kabenge, I.; Rudnick, D.; Irmak, S. Performance of twelve mass transfer based reference evapotranspiration models under humid climate. J. Water Resour. Prot. 2017, 9, 1347–1363. [Google Scholar] [CrossRef] [Green Version]
  62. Ndiaye, P.M.; Bodian, A.; Diop, L.; Djaman, K. Evaluation de vingt méthodes d’estimation de l’évapotranspiration journalière de référence au Burkina Faso. Physio-Géo 2017, 11, 129–146. [Google Scholar]
  63. Tabari, H.; Talaee, P.H. Sensitivity of evapotranspiration to climatic change in different climates. Glob. Planet. Chang. 2014, 115, 16–23. [Google Scholar]
  64. Irmak, S.; Allen, R.G.; Whitty, E.B. Daily grass and alfalfa-reference evapotranspiration estimates and alfalfa-to-grass evapotranspiration ratios in Florida. J. Irrig. Drain. Eng. 2003, 129, 360–370. [Google Scholar] [CrossRef]
  65. Ambas, V.T.; Baltas, E. Sensitivity analysis of different evapotranspiration methods using a new sensitivity coefficient. Glob. Nest J. 2012, 14, 335–343. [Google Scholar]
Figure 1. Senegal River Basin, stations used for the extraction of climatic variables, hydraulic infrastructures, water uses, and needs by sector of activity.
Hydrology 07 00024 g001
Figure 2. Performance of the methods according to the selected evaluation criteria. The red line in each figure represents the threshold values of each evaluation criterion.
Hydrology 07 00024 g002
Figure 3. Spatial repartition of Kling–Gupta Efficiency (KGE) values.
Hydrology 07 00024 g003
Figure 4. Method performance before and after calibration: (red color: before calibration; green color: After calibration).
Hydrology 07 00024 g004
Figure 5. KGE values obtained after calibration of the best methods over the period 1984–2005. (* calibrated methods).
Hydrology 07 00024 g005
Figure 6. Taylor’s diagram of the best methods over the validation period according to climatic zones.
Hydrology 07 00024 g006
Figure 7. Spatial distribution of percentage of bias (PBIAS) between the best methods and that of FAO56-PM.
Hydrology 07 00024 g007
Table 1. Average values of climatic variables.
Climate Zone *u2 (m s−1)Tmax (°C)Tmin (°C)Rh (%)Rs (MJ m−2)ET0 (mm day−1)
Guinean 1.7030.4221.1867.6519.654.54
Sudanian2.2234.8822.4542.0320.726.30
Sahelian3.0037.1222.9529.0021.298.01
Read: u2 wind speed, Tmax maximum temperature, Tmin minimum temperature, Rh relative humidity, Rs solar radiation, ET0 reference evapotranspiration, * according to Dione’s breakdown [47], the basin is subdivided into four climate zones (Guinean, South Sudanese, North Sudanian, and Sahelian), but in this study, for a better readability of the results, the subdivisions of the Sudanian zone were not taken into account. Thus, the zones considered were Guinean, Sudanese, and Sahelian.
Table 2. Characteristics of the 20 alternative methods used.
CategoriesReferences FormulaAbbreviation
AerodynamicDalton [21] ET 0 = ( 0.3648 + 0.07223 u 2 ) ( es ea ) DN(2)
Trabert [30] ET 0 = 0.3075   u 2 ( es ea )       TRB(3)
Penman [31] ET 0 = 0.35 ( 1 + 0.24 u 2 ) ( es ea ) PNM(4)
Rohwer [33] ET 0 = 0.44 ( 1 + 0.27 u 2 ) ( es ea ) RW(5)
Mahringer [34] ET 0 = 0.15072   3.6 u 2 ( es ea ) MHR(6)
TemperatureHargreaves [24] ET 0 = 0.0135 × 0.408 Rs ( T + 17.8 ) HG(7)
Hargreaves and Samani [25] ET 0 = 0.408 × 0.0023 ( T + 17.8 ) ( Tmax Tmin ) 0.5 Ra HS(8)
Trajkovic [35] ET 0 = 0.408 × 0.0023 ( T + 17.8 ) ( Tmax Tmin ) 0.424 Ra TRA(9)
Droogers and Allen [36] ET 0 = 0.408 × 0.0025 ( T + 16.8 ) ( Tmax Tmin ) 0.5 Ra DA(10)
Heydari and Heydari [37] ET 0 = 0.0023 Ra ( T + 9.519 ) ( Tmax Tmin ) 0.611 HH(11)
RadiationMakkink [22] ET 0 = 0.61   Δ Δ + γ × Rs λ 0.012 MK(12)
Jensen and Haise [38] ET 0 = 0.025 ( T 3 ) R s JH(13)
Priestley and Taylor [39] ET 0 = α Δ Δ + γ × Rn λ PT(14)
Abtew [32] ET 0 = 0.53 R s λ AB(15)
Oudin [2] ET 0 = Rs × T + 5 100 OD(16)
CombinatoryPenman [23] ET 0 = [ Δ Δ + γ ( Rn G ) + γ Δ + γ × 6.43 ( 1 + 0.053 u 2 ) ( es ea ) ] / λ PNM(17)
Doorenboss and Pruitt [40] ET 0 = [ Δ Δ + γ ( Rn G ) + 2.7 γ γ + Δ ( 1 + 0.864 u 2 ) ( es ea ) ] / λ   DP(18)
Valiantzas [26] ET 0 = 0.0393 R s T + 9.5 0.19 R s 0.6   φ 0.15 + 0.048 ( T + 20 ) ( 1 H r 100 ) u 2 0.7 Val 1(19)
Valiantzas [26] ET 0 = 0.0393 R s T + 9.5 0.19 R s 0.6   φ 0.15 + 0.078 ( T + 20 ) ( 1 H r 100 ) Val 2(20)
Valiantzas [26] ET 0 = 0.0393 R s T + 9.5 0.19 R s 0.6   φ 0.15 + 0 , 0061 ( T + 20 ) ( 1.12 T T m i n 2 ) 0.7 Val 3(21)
Read: ET0 reference evapotranspiration (mm); u2 represents the wind speed measured at 2 m from the ground (ms−1); (es—ea) saturation deficit (kPa); T is the average temperature (°C); Tmax—maximum temperature (°C); Tmin—minimum temperature (°C); Ra is the extraterrestrial radiation (MJ m−2d−1); ∆ is the saturating vapor pressure curve (kPa°C−1); γ is the psychrometric constant (kPa°C−1); λ is the latent heat of vaporization (MJ m−2d−1); Rs is the short wavelength solar radiation (MJ m−2d−1); Rn is the radiation net (MJ m−2d−1) and α is a constant value (1.26 for humid areas and 1.74 for semi-arid areas). These coefficients are considered to be constant for a given region [41]. φ represents the latitude of the station in radian degree, and λ is the latent heat of vaporization (MJ.m−2d−1).
Table 3. Range and optimum value of the evaluation criteria.
Criteria.FormulaRangeOptimum Value
R 2 i = 1 n ( ET 0 alt   ET 0 FAO 56 PM ¯ ) 2 i = 1 n ( ET 0 FAO 56 PM ET 0 FAO 56 PM   ¯ ) 2 0 to 1 1 (22)
NMRSE 1 n i = 1 n ( ET o alt ET 0 FAO 56 PM ) 2       1 n i = 1 n ( E T o alt )       0 to +∞ 0 (23)
PBIAS [ 1 n i = 1 n ( ET o alt ET 0 FAO 56 PM ) 2       1 n i = 1 n ( ET o alt )       ] * 100 −∞ to +∞0 (24)
KGE 1 ( r 1 ) 2 + ( β 1 ) 2 + ( α 1 ) 2 −∞ to 11 (25)
R2—coefficient of determination; E T 0 a l t —evapotranspiration estimated by an alternative method;   E T 0 F A O 56 P M —evapotranspiration estimated by the FAO56-PM method; NMRSE—normalized mean error between alternative methods and that of FAO56-PM; PBIAS—percentage of biases between methods (negative values represent an underestimation and positive ones an overestimation). KGE is the Kling–Gupta Efficiency coefficient; it is made up of three variables: r—the correlation coefficient between the alternative methods evaluated and that of FAO56-PM, α—the variability, and β—the gaps that exist between the alternative methods evaluated and that of FAO56-PM.
Table 4. Best reference evapotranspiration (ET0) estimation methods before and after calibration.
ReferencesBefore CalibrationAfter Calibration
Trabert [30] ET 0 TR = 0.3075   u 2 ( es ea ) ET 0 TRcal = 2.770 u 2 ( es ea )
Valiantzas [26] ET 0 val 2 = 0.0393 R s × T + 9.5 0.19 R s 0.6   φ 0.15 + 0.078 ( T + 20 ) ( 1 H r 100 ) ET 0 val 2 cal = 0.027 R s × T + 9.5 0.19 R s 0.6   φ 0.15 + 0.159 ( T + 20 ) ( 1 H r 100 )
Valiantzas [26] ET 0 val 3 = 0.0393 R s × T + 9.5 0.19 R s 0.6   φ 0.15 + 0.0061 ( T + 20 ) ( 1.12 T T m i n 2 ) 0.7 ET 0 val 3 cal = 0.026 R s × T + 9.5 0.19 R s 0.6   φ 0.15 + 0.018 ( T + 20 ) ( 1.12 T T m i n 2 ) 0.7
Jensen and Haise [38] ET 0 JH = 0.025 ( T 3 ) R s ET 0 JHcal = 0.027 ( T 3 ) R s
Hargreaves and Samani [25] ET 0 HS = 0.408 × 0.0023 ( T + 17.8 ) ( Tmax Tmin ) 0.5 Ra ET 0 HScal = 0.408 × 0.0031 ( T + 17.8 ) ( Tmax Tmin ) 0.5 Ra

