Article

Hydrochemical Analysis of Groundwater in Remah and Al Khatim Regions, United Arab Emirates

1
Civil & Environmental Engineering Department, United Arab Emirates University, Al Ain 15551, UAE
2
National Water Center, United Arab Emirates University, Al Ain 15551, UAE
3
Geology Department, United Arab Emirates University, Al Ain 15551, UAE
*
Author to whom correspondence should be addressed.
Hydrology 2019, 6(3), 60; https://doi.org/10.3390/hydrology6030060
Submission received: 13 June 2019 / Revised: 8 July 2019 / Accepted: 8 July 2019 / Published: 11 July 2019

Abstract

:
Groundwater constitutes an important part of the available water resources in arid areas. Knowledge of the quantitative and qualitative status of groundwater is a key aspect in optimal groundwater management. The purpose of this study was to provide technical information on the groundwater in the sand aquifer of two neighboring areas in the United Arab Emirates to support stakeholders working towards sustainable groundwater development. The chemical characteristics of the groundwater have been used to identify the processes controlling groundwater chemistry and assess the suitability of the groundwater for agricultural purposes. Despite tapping into the same aquifer, considerable differences in groundwater quality were found between the two study areas. The area with a shallower water table showed clear indications of irrigation return flow deteriorating the groundwater quality. Using standard agricultural indices, the groundwater at both study areas is classified as unfit for agricultural purposes. However, considering that groundwater is the only available water source for irrigation, it will continue to be used for agriculture. This indicates the need for improved irrigation management and the development of new strategies for sustainable groundwater development in arid areas in the context of food security.

Graphical Abstract

1. Introduction

Groundwater is an important part of the total water resource in arid and semiarid regions [1,2]. In the United Arab Emirates (UAE), located in the southeastern part of the Arabian Peninsula, groundwater is the main source for irrigation of agricultural areas because the climate is arid with no reliable surface water resources. Despite the scarcity of water, water demand in the UAE has increased tremendously over the last decade. The rapid population growth, industrial development, and booming economy have increased water demand in various sectors [3]. Thus, the sustainable use of groundwater in light of the increasing demand has become a serious challenge. The over-exploitation of groundwater resources has already caused severe impacts such as salinization of groundwater, desertification, and degeneration of vegetation [4].
The sustainable management of water resources depends upon the comprehensive understanding of the hydrogeological systems, their behavior, and their evolution processes [5,6,7]. Groundwater quality reflects the combined effects of many hydrochemical processes such as weathering, dissolution, ions exchange, and various biological processes along the groundwater flow path [8]. Therefore, hydrochemical analysis is commonly carried out to study the characteristics of the aquifer, salinity problems, and recharge of the aquifer [9,10]. Furthermore, the hydrochemical analysis can also be used to identify the interaction of water with minerals comprising rocks and sediments that can thus provide insights into aquifer heterogeneity and connectivity and into the physical and chemical processes controlling water quality [11,12].
The processes affecting the groundwater composition vary in different areas along the subsurface flow path of water. The process of dissolution typically occurs in the recharge area, ions exchange phenomena occur during the flow whereas evaporation, precipitation and ion exchange dominate the discharge area in controlling groundwater chemistry [13,14].
In the United Arab Emirates, only few hydrochemical studies are available to date. A study conducted in the Dubai sand aquifer showed high mineralization of groundwater due to increased resident time, irrigation return flow, rock water interaction and lack of recharge due to rainfall [15]. However, this saline groundwater is used for agricultural purposes, mainly to irrigate date palm [16]. In the Emirate of Abu Dhabi, studies have been conducted in the area of Liwa [17,18], the western coast [19,20], and the eastern region [21,22]. The shallow sand dune aquifer of Abu Dhabi has been the subject of a study by Imes and Wood [23], who suggested that the increase of solute observed in the groundwater is a result of the upward transport of solute from underlying mudstone and evaporate, and the loss of groundwater through evaporation. Elmahdy and Mohamed [24] identified groundwater potential zones through resistivity surveys and from remote sensing data for the sand dune aquifer of Abu Dhabi. However, there are still considerable knowledge gaps in many parts of the emirate including areas where groundwater is extensively used for irrigated agriculture.
This study focuses on two neighboring agricultural areas, Remah and Al Khatim, which are located in the Mideastern region of Abu Dhabi Emirate. The agricultural farms in Al Khatim produce dates, whereas in Remah, greenhouses are used for growing vegetables for commercial production. Large variations in salinity have been observed between these two areas, and despite the extensive use of groundwater for irrigation, little is known about the hydrochemistry of the groundwater. There is also an industrial area located upstream of Remah and Al Khatim. To date, little attention has been given to the problem of groundwater salinity in the area or to a potential effect of the industrial activities on the groundwater quality.
In 2005, notable effects of agricultural activities on groundwater levels and salinity have been confirmed at Al Khatim [25]. The study also predicted further declines in groundwater levels and quality if current agricultural practices were continued. The purpose of the present study was to provide up to date technical information and further evidence of the effects of current agricultural practices to support farmers, decision makers and other stakeholders working towards sustainable groundwater development. The objectives of this study were to: (1) assess the groundwater chemistry of the sand aquifer in the study area considering natural conditions (geological, hydrogeological, and climatic influences) and man-made (agricultural) influences, and (2) evaluate the suitability of the groundwater for agricultural purposes. Two types of approaches are used to achieve the objectives, these are: (1) the development of geospatial water quality maps, and (2) the examination of the suitability of the groundwater for irrigation purposes based on sodium percentage (Na%), sodium adsorption ratio (SAR), magnesium hazard (MH), and Kelly’s index (KI).

2. Study Area

The study areas Al Khatim and Remah lie in the east of the UAE between Abu Dhabi and Al Ain (Figure 1). The Emirate is characterized by an arid climate having an average rainfall of less than 100 mm/year and a very high rate of potential evaporation (2–3 m/year) [18].
The geomorphology of Al Khatim and Remah area includes sand dune ridges, and inland sabkhas [26]. The city of Al Ain, in the proximity of the study area, is known as the largest oases of the Arabian Peninsula [27]. The only perennial surface-water resource is the spring at Ayn Al Fayda which is located about 15 km south of Al Ain. The spring originates from Miocene gypsum and clay layers through thin Quaternary loose sediments [28]. There are many farms and plantation forests in the study area [29,30,31].
The groundwater is mainly used for farming and for municipal irrigation. Excessive withdrawal of groundwater and low recharge rate in the area has caused a significant decline of the groundwater levels and an increase of salinity. Due to the extensive agricultural activities in the region, the application of chemical fertilizers and pesticides is likely contaminating the groundwater and affecting the groundwater quality [22]. Increased groundwater salinity and the rapid decrease in the water table is of significant concern for the sustainable management of the groundwater resources in the area.

2.1. Geology and Hydrogeology

The topographic surface of Al Ain area shows a high elevation surface containing a westerly directed trough axis [27]. The porosity and permeability of the karst limestone, marly limestone, and the marl layers are low. Large volume of rainwater flow as surface runoff. The flow mostly occurs from the eastern region (Al Ain) and towards the desert in the west (study area) [24]. The extension of wadi courses to the western part, towards the study area, is dominated by dune fields with most of the study area covered by Quaternary deposits. The Quaternary deposits recognized here are of four types that include fluvial deposits, desert plain deposits, sabkha deposits, and aeolian sand [32,33]. The study area, having sand dunes, is identified as a no-recharge area with all the precipitation captured by the sand dunes and later evaporated [23].
Quaternary sediments are in abundance in the study area (Figure 2). Among them are the 10,000 years old Rub Al Khali formation which are mainly the aeolian deposit dunes [34]. Hili formation are the older quaternary sediments, which are up to 2.6 million years old and they consist of cemented aeolin deposits and fluvial sediments [34].

2.2. Hydrogeological Units

There are four identified hydrogeological units in the Emirate of Abu Dhabi [26], as shown in Figure 3: (1) The carbonate aquifer in the north and east (Hafeet Mountain), (2) the sand dune aquifer (linear and star sand) in the south and west, (3) the western gravel aquifer in the east, and (4) the coastal aquifer in the west along the coast of the Arabian Gulf.
In this paper, the focus will be on the sand dune aquifer, because the study area falls in this aquifer. The sand dune aquifer covers about 74% of the total area in the United Arab Emirates and yet it is the least studied aquifer in the UAE. The sand dune aquifer can be categorized into two types based on the dune shapes. The first type is the linear dunes which receive water from Hafeet Mountain and the western gravel aquifer located in the northeast of Abu Dhabi emirate. The second type is barchan-like shaped, and it is located in the southern part of Abu Dhabi which is stretched between Liwa and Madinat Zayed, receiving water from Oman and Saudi Arabia [24].
The elevation of the sand dune aquifer gradually increases from sea level at the Arabian Gulf until it reaches 250 m above ground level in the southcentral part at the Liwa Al Batin basin. There are pockets of fresh water in the Quaternary sand dunes between Madinat Zayed and Liwa. Investigation at Bu Hasa oil field indicates the presence of similar freshwater deposits [3]. This aquifer shows high spatial variability in chemical properties of groundwater which may be influenced by the climate, aquifer geological characteristics, and the water table depth [3].
The groundwater formations in the UAE are broadly classified into two categories. The upper unit which consists of the Quaternary unconsolidated clastic sediments which are found in the desert or sand aquifer throughout UAE and the lower unit which is composed of loosely cemented, calcareous sandstones, sandy limestone, gypsum, and silty chalk [24].
The groundwater is recharged from precipitation in the eastern region at the Northern Oman Mountains and Hafeet Mountain. The lithological map (Figure 4) shows that the water moves under the ground from the east (Hafeet Mountain) passing through the study area and flowing towards the west (Arabian Gulf).
The groundwater level is deep at Remah, on average 155.5 m below ground level, and at Al Khatim, the recorded groundwater level is 32.6 m below ground level. Over the last 20 years, the water level in both study areas has dropped significantly due to groundwater abstraction for agricultural irrigation. In Al Khatim, the water level declined by around 15 m while in Remah, the decline in groundwater has reached between 40 m to almost 200 m in some areas, mainly because of the disconnect (lower hydraulic conductivity) of the lower part of the aquifer with the surface [34].

3. Materials and Methods

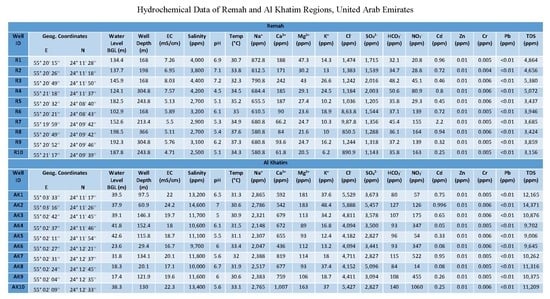
3.1. Sample Collection and Analysis

A comprehensive field survey was conducted in both study areas (Remah and Al Khatim). Ten bore wells were randomly selected in each area (Figure 5), based on accessibility, well conditions and permission of the farmers. To assist in the well selection process, farmers were interviewed to confirm the selected wells are in good condition and are used for irrigation purposes. The groundwater level was measured using water level meter and the samples were collected immediately after the measurement. The purpose of measuring water level prior to the collection of samples was to obtain water level readings that were not affected by the pumping activity to collect the samples. Twenty groundwater samples (10 samples from each study area) were collected. The water samples collected from the wells were transferred into polyethylene bottles having nitric acid (HNO3) for preservation and stored in an ice box. Electrical conductivity, salinity, and pH were determined in the field during sampling using a U-52, Horiba, multiparameter probe. The concentrations of major cations and anions (Na+, K+, Ca2+, Mg2+, Cl, SO4, HCO3−, and NO3−) and trace metals (Cd, Cr, Zn, and Pb) were estimated in the laboratory following APHA [35] standards. For the purpose of metal analysis, the instrument Inductively Coupled Plasma Spectroscopy—Optimal Emission Spectrometry (ICP-OES) was used for the investigation of trace metals with instrument detection limit (IDL) of 0.005 mg/L for Cd, Zn, and Cr and 0.004 mg/L for Pb.
The selection of cations and anions to be analyzed was based on the conditions of the study area and the usage of these groundwater wells. Sodium, chloride, and calcium were selected because they are helpful in the identification of the source of salinity in the groundwater through sodium chloride relationship. Magnesium, potassium, bicarbonate, and sulfate ions can be helpful in exploring and understanding the sand dune aquifer with types of rocks that are playing a role in determining the groundwater chemistry.
The study area is located within an agricultural region and thus usage of fertilizer is likely. Furthermore, an industrial area is located upstream of the study area. Therefore, trace metals were included in the groundwater analysis because they can be helpful in determining the effect of anthropogenic activities (agricultural and industrial) on the groundwater chemistry. Particularly, cadmium can be an indicator of fertilizer use and was therefore included in the analysis
Statistical analysis, data categorization, development of water quality maps, and water quality analysis were carried out using Minitab 17, Microsoft Excel 2017, Arc GIS 10.3, and AquaChem (2014.2) water-quality software, respectively.

3.2. Development of Water Quality Maps

The maps of different water quality parameters were developed in Arc GIS 10.3 based on field analyzed data. The geostatistical analysis was used to create the quality maps for different parameters of the collected groundwater samples for Al Khatim and Remah area. Base maps of study area boundary were prepared using ground values. The detailed maps of all parameters were created using data interpolation techniques (inverse distance weighted).

3.3. Suitability of Groundwater for Irrigation Use

The suitability of groundwater for irrigation depends upon its mineral constituents and thus can influence both the soil and the plants [18]. To assess the quality of groundwater for agricultural purpose, the following criteria were used: sodium percentage (Na%), sodium adsorption ratio (SAR), salinity hazards (EC), magnesium hazard, and Kelly’s index (KI). All the concentrations for these criteria are in units of milliequivalents/ liter.
Sodium adsorption ratio (SAR) [36] is used to determine the suitability of groundwater for agricultural purposes. The SAR indicates the degree of replacement of sodium ions with other ions that results in sodium hazard. The SAR can be expressed as (Equation (1)):
SAR   =   Na + Ca 2 +   +   Mg 2 + 2
Sodium percentage (Na%) [37] can be used to study the sodium hazards. A low value of sodium percentage is good for irrigation, whereas a higher value indicates its unsuitability for irrigation. It can be expressed as (Equation (2)):
Na %   =   Na + + K + Na +   +   K +   +   Ca 2 +   +   Mg 2 +   ×   100
Salinity Hazard (EC) is the presence of salt content in the irrigation water. Excess concentration of salt in the water and soil affects the crop yield and degrades the soil [37]. The suitability of water for irrigation purpose was divided into four classes by Wilcox [37], with an electrical conductivity greater than 3000 µS/cm in irrigation water is considered unsuitable for irrigation use.
Magnesium Hazard (MH) measures the concentration of magnesium relative to that of magnesium plus calcium of water and was expressed by Raghunath [38] as (Equation (3)):
MH   =   Mg 2 + ( Ca 2 +   +   Mg 2 + )   ×   100
The water associated with magnesium ratio exceeding 50 has higher alkalinity and thus it affects crop yield negatively [18]. Water with magnesium hazard less than 50 is considered safe for irrigation.
Kelly’s Index (KI) [39] measures the presence of sodium with respect to calcium and magnesium and can be expressed as (Equation (4)):
KI   =   Na + Ca 2 +   +   Mg 2 +
A Kelly’s index value greater than 1 indicates excess sodium in the water and is categorized as unsuitable for irrigational purposes, whereas a value less than 1 indicates the suitability of water for irrigation use.

4. Results

4.1. Hydrochemical Analysis of Results

The results of the hydrochemical analysis are shown in Table 1. The coefficient of variation (CV), which is the ratio of standard deviation to the mean, was used to describe the variability of groundwater properties, with CV ≤ 15% indicating low variability, 15% < CV ≤ 35% indicating moderate variability, and CV > 35% indicating high variability [40]. As seen from Table 1, there is a moderate to high variability in most parameters.
The different groundwater parameters were compared to WHO standard guideline values (if applicable) [41] for drinking water. As seen from Table 1, most parameters exceed the drinking water guidelines, owing to a generally high level of dissolved solids.
Geospatial quality maps were developed for EC, salinity, pH, Na, Cl, Ca, Mg, K, SO4, HCO3, and NO3. The results for the individual parameters are discussed below in more detail.

4.1.1. Electrical Conductivity and Salinity

Electrical conductivity (EC) of groundwater shows a rapid determination of total dissolved solids, it is an important parameter to demarcate salinity hazard. The mean value of EC of the samples in Remah is 6.2 mS/cm which is less as compared to the mean value in Al Khatim samples 19.84 mS/cm.
Salinity of groundwater also shows the same pattern as EC, the mean value of salinity in Remah is 3350 mg/L whereas it is much higher in Al Khatim 11,770 mg/L. Geospatially, the higher salinity was observed in Al Khatim at the south, whereas in Remah higher salinity is recorded in the north (Figure 6). The salinity of groundwater dictates its suitability for irrigation purposes.

4.1.2. Hydrogen-Ion Concentration (pH) and Temperature

A pH of water is mainly related to the amount of dissolved CO2, CO32−, and HCO3 [42]. pH value lower than 7 indicates acidity and a higher number indicates alkalinity. Values of pH in the Remah region range from 4.48 to 7.16, and in the Al Khatim region they range from 5.02 to 7.03. Thus, at both study areas, the water can be classified as acidic to neutral (Figure 6). The groundwater temperature at the time of collection in Al Khatim region has an average temperature of 31.6 °C whereas the average temperature recorded in Remah samples was 34.6 °C.

4.1.3. Major Ions

The major cations and anions investigated in the groundwater samples are sodium (Na+), potassium (K+), calcium (Ca2+), magnesium (Mg2+), chloride (Cl) and sulfate (SO42−). Their distribution is presented below:
Sodium concentration in Remah was observed higher in the north, and it decreases towards the south with a mean value of 694.9 mg/L, whereas in Al Khatim region it is higher in the south with a mean value of 2452.6 mg/L (Figure 7). The concentration of sodium has an important role in the evaluation of groundwater quality for irrigation because it increases the hardness of soil and the reduction in its permeability [43].
The chloride concentration spatial distribution map also shows almost a similar pattern as in the sodium ion (Figure 7), where the concentration of chloride ion (mean: 1115.5 mg/L) is higher in the north of Remah and it is higher in the south and northwest in Al Khatim region (mean: 4729.9 mg/L).
The calcium concentration recorded in the samples of Remah has an average value of 136.9 mg/L, the quality maps show the higher concentration in the north of Remah and it decreases towards the south (Figure 8). In Al Khatim samples, the concentration was much lower as compared to Remah. The average concentration in Al Khatim is 78.1 mg/L where the higher concentration occurs in the middle of the Al Khatim region and lower concentration in the north and south. With the movement of groundwater through the vadose zone, it interacts with the soil and rocks and dissolves them [44]. The most common form of calcium in groundwater is because of the limestone or dolomite dissolution.
Magnesium concentration in the collected samples of the two study areas shows the average magnesium ion concentration in Remah region is 29.2 mg/L, and the concentration at Al Khatim is higher with a mean value of 124.7 mg/L. The quality maps indicate higher magnesium concentration in the north of Remah, whereas in Al Khatim higher concentration is in the south (Figure 8).
Potassium ion concentration as shown in the spatial distribution map (Figure 8), is higher in the north of Remah and decreases towards the south, but the overall mean concentration is higher in Al Khatim (mean: 27.4 mg/L) than Remah (mean: 15.6 mg/L). Specifically, in Al Khatim the higher concentration of potassium ion occurs in the south. The sources of potassium ion in groundwater are the igneous rocks as feldspars (orthoclase and microcline), sedimentary rocks as silicate, and some mica and clay minerals [45]. Furthermore, agricultural fertilizers can be a source of potassium in groundwater.
Sulfate concentration ranges from 1114.3 mg/L to 2015.9 mg/L in Remah with the mean of 1512.6 mg/L. The spatial quality map (Figure 9) shows that concentration of sulfate is higher in the north of Remah and lower in the south. In the study area Al Khatim, the concentration ranges from 2827 mg/L to 5457 mg/L with a mean of 3632 mg/L. The spatial distribution shows the concentration is higher in the south and decreases towards the north. However, there is one sample in the north which displays a higher concentration. The source of sulfate in the study area is the sedimentary rocks, gypsum (CaSO4.2H2O) and anhydrite (CaSO4) which is present in the study area and was also reported by Murad et al. [22].
The spatial distribution of bicarbonate shows lower concentration in the south and northwest of Remah with the mean value of 39.3 mg/L (Figure 9). However, the bicarbonate concentration in Al Khatim is higher in the north with an average concentration of 104.3 mg/L. The sources of bicarbonate are either the presence of carbon dioxide and/or the dissolution of carbonate rocks [22].
The spatial quality maps show higher concentration of nitrate in the south, the mean value of nitrate in Remah is 96.4 mg/L. At Al Khatim, the concentration is higher in the north, and it decreases in the south (Figure 9). The mean of all the samples in Al Khatim shows nitrate as 315.7 mg/L. The concentration is comparatively lower in Remah and higher in Al Khatim. The nitrate levels are generally high in both areas and mostly above the WHO [46] limit of 45 mg/L. Because the study areas contain poultry farms and camel farms, it is likely that the animal manure and the underground septic tanks are contributing to the concentration of nitrate in both study areas. Furthermore, nitrate fertilizers are likely to be widely used in the study areas, and nitrate leaching to the groundwater is therefore highly probable, particularly considering the sandy soil prevalent in the study areas.
The results of chemical analysis of groundwater in the Remah area indicate the anions sequence as SO42− > Cl > NO3− > HCO3 and cations Na+ > Ca2+ > Mg2+ > K+. Whereas in Al Khatin the anions sequence is Cl > SO42− > NO3 > HCO3− and cations sequence as Na+ > Ca2+ > Mg2+ > K+.

4.1.4. Trace Metals

The presence of higher concentration of trace metals in the groundwater poses a serious hazard to human health. The source of trace metals is mostly anthropogenic, such as the effluents from industrial entities. The concentration of these heavy metals is compared to the WHO [47] drinking water guidelines (Table 2).
Cadmium data exceed the WHO [47] guidelines, and thus quality maps were developed only for cadmium (Figure 10). The concentration of cadmium reported high variability in both Remah and Al Khatim regions. The quality maps show a higher concentration of cadmium in the north of Remah, and it decreases towards the south. In Al Khatim higher concentration are seen in the south and northeast. The analysis shows that cadmium exceeded the WHO [47] guideline values in all the collected samples.
The data for chromium in both Remah and Al Khatim shows low variability, and they were found to be below the WHO [47] standard guidelines. The zinc concentration in Remah shows moderate variability, whereas in Al Khatim it shows low variability. The zinc values were also found below the standard WHO values. The concentrations of lead in both Remah and Al Khatim were below the acceptable limit of 0.01 mg/L, which is in accordance with WHO guideline limits [47].

4.2. Groundwater Levels and Salinity

Groundwater level was measured below the ground level (BGL) for all the groundwater wells. The level of groundwater in Remah region ranges between 102.5 m to 197.98 m with an average water level of 155.5 m. The deep-water level was recorded in Remah region as compared to Al Khatim. In the Al Khatim region, the water level varied from 17.1–42.2 m with an average of 32.6 m.
In the Al Khatim region, salinity level is observed higher (mean: 11,770 mg/L) where the water table is shallow (mean: 32.6 m), and comparatively in Remah less salinity (mean: 3350 mg/L) was measured where water table is deep (mean: 115.5 m) (Figure 11). Possible reasons for higher salinity in Al Khatim could be irrigation return flow carrying higher levels of dissolved solids.

4.3. Suitability for Irrigation Use

The suitability of groundwater for agricultural use in Remah and Al Khatim was assessed using agricultural indices. Sodium adsorption ratio (SAR) shows a mean value of 18.7, which indicates the groundwater is unsuitable for irrigational purposes in both study areas (Table 3).
Sodium percentage (Na%) categorizes five samples of Remah as doubtful, whereas the remaining samples showed unsuitability for irrigation purpose. The average Na% is 74.1 in both study areas (Table 3). Thus, Na% indicates that water in both areas is unsuitable for irrigation purposes.
Salinity Hazard (EC) shows the amount of salinity in the water, with the range of more than 3000 µS/cm being unsuitable for irrigation purposes (Table 3). The average EC in Remah is 6200 µS/cm and in Al Khatim 19,800 µS/cm. Among the total of 20 samples, all the samples show EC higher than 3000 µS/cm. Thus, the overall results show that the water is not suitable for irrigation in terms of salinity for both the study areas.
Magnesium Hazard (MH) value in all the samples (Table 3) of both study areas is less than 50%, thus it indicates that the alkalinity of groundwater is in permissible limits. The mean value of MH in all the samples is 25.8%. This index indicates that water is safe to be used for agricultural purpose from the magnesium hazard perspective.
Kelly’s Index (KI) in all the samples (Table 3) shows value greater than 1 which indicates that the water is unsafe for agriculture activities.

5. Discussion

In summary, comparing the two study areas, the following general statements can be derived from the water chemistry investigations. The groundwater at Al Khatim area (in comparison with Remah area) is characterized by:
Shallow groundwater level
Higher EC and salinity
Higher concentrations of all ions
Higher concentrations of cadmium, with all other metals being approximately equal to Remah
The higher salinity and generally the higher concentrations of all parameters are likely a result of the shallow water table at Al Khatim. Irrigation water returning to the aquifer may increase the salinity and the concentration of major anions and cations. The presence of irrigation water return flow at Al Khatim was confirmed by EAD [34]. The study also discussed that this case is unlikely in Remah. EAD [34] reported values of hydraulic conductivity of 1 m/day at Remah, indicating a very slow movement of groundwater. Combined with the low water table, irrigation return flow would require a very long time to reach the water table in this area. In contrast, hydraulic conductivity values of 29 m/day were reported at Al Khatim, indicating that irrigation return flow may reach the shallow water table quickly. Thus, the differences in hydrochemical composition of the groundwater at the two study areas can be attributed to the irrigation return flow, owing to the difference in the water table.

5.1. General Hydrochemistry

From the Piper diagram (Figure 12), the groundwater from both study areas can be clearly classified as sodium-chloride water. All samples plot fairly close to each other indicating they are of similar water type. The cations triangle shows the dominance of sodium + potassium, with sodium accounting for 99% of the share. The anions triangle is dominated by chloride, followed by sulfate. Here, the samples from Remah plot slightly above the samples from Al Khatim, indicating a dominance of sulfate over chloride at Remah. In fact, the 20 samples collected from the two study areas can be divided into two geochemical groups as follows:
  • Na–Ca–SO4–Cl (Samples: R1, R2, R3, R4, R5, R6, R7, R8, R9, R10, AK8)
  • Na–Ca–Cl–SO4 (Samples: AK1, AK2, AK3, AK4, AK5, AK6, AK7, AK9, AK10)
All samples from Remah fall into the first group, and all but one sample (AK8) from Al Khatim fall into the second group.
The Schoeller diagram [48] shows higher concentrations of chloride, sodium, and sulphate ions and lower concentration of potassium, bicarbonates, and magnesium ions in all samples (Figure 13). Also, a clear grouping of the samples can be observed, with samples from Al Khatim having generally higher concentrations of the different water quality parameters.
Regarding water genesis, Sulin’s graph [49] (not shown) indicates that all the samples collected in Remah and Al Khatim are identified as being of old meteoric origin ( Na Cl   >   1 ) and Na2SO4 water type ( Na - Cl SO 4   <   1 ) .
The plot of calcium + magnesium and sulfate + bicarbonate should be along the 1:1 equiline if the main reaction is due to the dissolution of dolomite, gypsum, calcite, and anhydrite [18]. If the ions are exchanged from liquid (groundwater) to solid (calcite, dolomite and gypsum rocks), the process is known as ion exchange. However, if the case is reversed and the ions are exchanged from the solid (calcite, dolomite and gypsum rocks) to the liquid (groundwater), the process is then termed as reverse ion exchange process. The samples of Al Khatim and Remah (Figure 14a) can be seen in the ion exchange region, thus the ion exchange is the dominant process. The phenomena of ion exchange occur during percolation of water [13,14], since the study areas are agricultural intense and pumping rate is high [34], thus the water does not have enough time for dissolution of rocks.
The plot of sodium versus chloride (in mEq/L) shows dominance of chloride over sodium in Al Khatim (Figure 14b). The samples should fall on the 1:1 equiline if the source of both ions are halite dissolution [18]. The halite dissolution can be seen in the samples of deep aquifer of Remah. The silicate weathering is out of question because the concentration of bicarbonate is less in both study areas. However, in this study the dominance of chloride ions shows possibly ion exchange process, thus cation exchange is the dominant process in both study areas. Another evidence which also rule out the silicate weathering is the higher concentration of chloride (average Al Khatim: 4730 mg/L; Remah: 1116 mg/L) over sodium (average Al Khatim: 2453 mg/L; Remah: 695 mg/L), also shown in Figure 14b. A groundwater study conducted in Delhi by Datta and Tyagi [50] attributed higher concentration of sodium over chloride to the evidence of silicate weathering.
The relationship between calcium and sulfate concentration (in mEq/L) shows the dominance of sulfate over calcium (Figure 15) in both study areas. The excess of sodium and chloride, when combined with calcium and sulfate, forms CaCl2 and Na2SO4 type of groundwater. The high sulfate concentrations are likely a result of the presence of volcanic and sedimentary rocks (gypsum and anhydrite) [22]. The chloride and sulfate dominate the overall alkalinity of groundwater with respect to bicarbonate and nitrate; which possibly shows the alkaline nature of groundwater and not the sand dune aquifer.

5.2. Trace Metal Contamination

Cadmium enters the groundwater through anthropogenic activities. It is a nonessential toxic metal, which is mostly found in phosphate fertilizers [51]. Considering the extensive agricultural activities in the study areas, the use of fertilizers is a likely source of the elevated cadmium concentrations found in the groundwater at both study areas.
Chromium enters groundwater through anthropogenic activities and leaches from topsoil and rocks, Zinc enters the groundwater from mining, smelting metals and steel production and lead finds its way to groundwater from the combustion of leaded gasoline and ore smelting [52,53]. The concentrations of these trace metals (zinc, chromium, and lead) are below the permissible WHO [47] limits.

5.3. Suitability for Irrigation

The suitability for irrigation was assessed using Na%, SAR, EC, MH, and Kelly’s index. With the exception of MH, all assessed indices show that the groundwater in the study area is unsuitable or unsafe for agricultural purposes. The extended Wilcox plot of Remah and Al Khatim (Figure 16) shows that all samples fall in the C4-S4 category confirming that the groundwater of Remah and Al Khatim area is not suitable for irrigation of traditional crops due to very high sodium hazard and very high salinity.

5.4. Effect of Agriculture on Groundwater Quality

Groundwater abstraction for irrigation has led to a significant decline of groundwater levels in both study areas. At Al Khatim, groundwater levels dropped from 16 m below ground level in 2002 [25] to 33 m below ground level in 2017 (this study) but are still well above sea level (around 100 m asl). At Remah, groundwater levels dropped from 114 m below ground level in 2002 [34] to 156 m below ground level in 2017 (this study) and are now around 5 m below sea level. However, as the study areas are located almost 60 km away from the Arabian Gulf, seawater intrusion is unlikely to be the source of increased salinity.
Several indicators point at agricultural return flow affecting the groundwater quality at Al Khatim. Elevated concentrations of substances related to fertilizer use (nitrate, cadmium) can be observed at Al Khatim as well as a generally elevated TDS concentration. A relatively shallow groundwater table and permeable sediments promote irrigation return flow. A study conducted in a neighboring region also confirmed irrigation return flow as the source of groundwater contamination [20]. In contrast, the groundwater at Remah does not seem to be influenced by irrigation return flow, which was also confirmed by a recent study [34].
While the groundwater at the study area has significant natural salinity, current management practices tend to further deteriorate groundwater quality. Most of the farms use flood irrigation, which promotes evaporation considering the high temperatures prevalent in the UAE, and thus concentration of salts. These salts are subsequently leached to the groundwater, increasing the salinity. With increasing soil salinity, farmers need to apply more water to maintain the salt balance, which in turn increases irrigation return flow and subsequent salinization of the groundwater.
The observed effects of agricultural activities on groundwater quality in the study area are common effects observed in other parts of the UAE [15,34] and in arid areas in general [54]. Improved groundwater management addressing the reduction of irrigation return flow could help improve groundwater quality and availability [16].

6. Conclusions

The groundwater from two neighboring agricultural areas, Remah and Al Khatim, located in the Emirate of Abu Dhabi, was investigated in terms of general hydrochemistry and suitability for irrigation. Both areas tap into the same sand dune aquifer, and the hydrochemistry is expected to be similar. However, due to differences in surface elevation and subsurface permeability, the water table at Al Khatim is found at shallow depth (mean = 32.6 m BGL), while at Remah, the water table is deep below the surface (mean = 155.5 m BGL). The difference in depth to groundwater has shown effects on the hydrochemistry. At Al Khatim, where groundwater is at shallow depth, irrigation return flow plays a major role leading to increased salinity and elevated concentrations of all investigated parameters. While the cation sequence shows a clear dominance of sodium over all other cations at both study areas, there are differences in the anions sequence with chloride being the dominant anion at Al Khatim and sulfate being the dominant cation at Remah.
Elevated concentrations of nitrate, potassium, and cadmium indicate pollution of the groundwater from the agricultural activities in the study area. The nearby industrial area appears to have no adverse effect on the water quality because the concentrations of other metals (except cadmium) were below guideline limits.
The groundwater at both study areas is intensively used for agricultural irrigation. However, based on the concentration of total dissolved solids, the groundwater in both areas can be characterized as brackish water. A range of indices was used to assess the suitability of the groundwater for irrigation. The assessment showed that the water at both study areas is unsuitable or unsafe for irrigation of traditional crops and may only be suitable to irrigate salt-tolerant crops. Irrigation return flow was found to have a major impact on the groundwater quality where the water table is shallow and soils are permeable. However, in the absence of other freshwater resources, groundwater will continue to be the only available water source for agricultural irrigation. It is, therefore, of paramount importance to improve irrigation management and to continue assessing groundwater resources across the UAE to enable the evidence-based development of integrated strategies for food security and water resources management.

Author Contributions

Conceptualization, Q.K. and M.M.M.; Data curation, Q.K. and M.U.L.; Formal Analysis, Q.K. and M.U.L.; Funding acquisition, M.M.M. and Q.K.; Investigation, Q.K. and M.U.L.; Methodology, Q.K. and E.K.; Project administration, D.M.A. and M.M.M.; Supervision, D.M.A.; M.M.M. and E.K.; Validation, M.M.M., E.K. and D.M.A.; Visualization, Q.K.; Writing-original draft, Q.K.; Writing-review and editing, E.K., M.M.M., and D.M.A.

Funding

The research was funded by Civil & Environmental Engineering Department, United Arab Emirates University.

Acknowledgments

Special thanks go to Mohamed Shafi from UAE University for his help in data collection and Anand Dev Gupta from Engineering Research International for his help in laboratory analysis of data.

Conflicts of Interest

The funder had no role in the design of the study; in the data acquisition, analyses, or interpretation of data; or in the writing of the manuscript.

References

  1. Keesari, T.; Kulkarni, U.P.; Deodhar, A.; Ramanjaneyulu, P.S.; Sanjukta, A.K.; Kumar, U.S. Geochemical characterization of groundwater from an arid region in India. Environ. Earth Sci. 2014, 71, 4869–4888. [Google Scholar] [CrossRef]
  2. Tsujimura, M.; Abe, Y.; Tanaka, T.; Shimada, J.; Higuchi, S.; Yamanaka, T.; Davaa, G.; Oyunbaatar, D. Stable isotopic and geochemical characteristics of groundwater in Kherlen River basin, a semi-arid region in eastern Mongolia. J. Hydrol. 2007, 333, 47–57. [Google Scholar] [CrossRef] [Green Version]
  3. Rizk, Z.S.; Alsharhan, A.S. Water resources in the United Arab Emirates. Dev. Water Sci. 2003, 50, 245–264. [Google Scholar]
  4. Lapworth, D.J.; MacDonald, A.M.; Tijani, M.N.; Darling, W.G.; Gooddy, D.C.; Bonsor, H.C.; Araguás-Araguás, L.J. Residence times of shallow groundwater in West Africa: Implications for hydrogeology and resilience to future changes in climate. Hydrogeol. J. 2013, 21, 673–686. [Google Scholar] [CrossRef]
  5. Brkić, Ž.; Briški, M.; Marković, T. Use of hydrochemistry and isotopes for improving the knowledge of groundwater flow in a semiconfined aquifer system of the Eastern Slavonia (Croatia). Catena 2016, 142, 153–165. [Google Scholar] [CrossRef]
  6. Eissa, M.A.; Thomas, J.M.; Hershey, R.L.; Dawoud, M.I.; Pohll, G.; Dahab, K.A.; Gomaa, M.A.; Shabana, A.R. Geochemical and isotopic evolution of groundwater in the Wadi Watir watershed, Sinai Peninsula, Egypt. Environ. Earth Sci. 2014, 71, 1855–1869. [Google Scholar]
  7. Sophocleous, M. Groundwater management practices, challenges, and innovations in the High Plains aquifer, USA—lessons and recommended actions. Hydrogeol. J. 2010, 18, 559–575. [Google Scholar] [CrossRef]
  8. Jeevanandam, M.; Kannan, R.; Srinivasalu, S.; Rammohan, V. Hydrogeochemistry and groundwater quality assessment of lower part of the Ponnaiyar River Basin, Cuddalore district, South India. Environ. Monit. Assess. 2007, 132, 263. [Google Scholar] [CrossRef]
  9. Jianhua, S.; Qi, F.; Xiaohu, W.; Yonghong, S.; Haiyang, X.; Zongqiang, C. Major ion chemistry of groundwater in the extreme arid region northwest China. Environ. Geol. 2009, 57, 1079–1087. [Google Scholar] [CrossRef]
  10. Zhu, G.F.; Li, Z.Z.; Su, Y.H.; Ma, J.Z.; Zhang, Y.Y. Hydrogeochemical and isotope evidence of groundwater evolution and recharge in Minqin Basin, Northwest China. J. Hydrol. 2007, 333, 239–251. [Google Scholar] [CrossRef]
  11. Cartwright, I.; Weaver, T.R. Hydrogeochemistry of the Goulburn Valley region of the Murray Basin, Australia: Implications for flow paths and resource vulnerability. Hydrogeol. J. 2005, 13, 752–770. [Google Scholar] [CrossRef]
  12. Wells, C.M.; Price, J.S. The hydrogeologic connectivity of a low-flow saline-spring fen peatland within the Athabasca oil sands region, Canada. Hydrogeol. J. 2015, 23, 1799. [Google Scholar] [CrossRef]
  13. Adams, S.; Titus, R.; Pietersen, K.; Tredoux, G.; Harris, C. Hydrochemical characteristics of aquifers near Sutherland in the Western Karoo, South Africa. J. Hydrol. 2001, 241, 91–103. [Google Scholar] [CrossRef] [Green Version]
  14. Tóth, J. Groundwater as a geologic agent: An overview of the causes, processes, and manifestations. Hydrogeol. J. 1999, 7, 1–14. [Google Scholar]
  15. Ahmed, I.; Tariq, N.; Al Muhery, A. Hydrochemical characterization of groundwater to align with sustainable development goals in the Emirate of Dubai, UAE. Environ. Earth Sci. 2019, 78, 44. [Google Scholar] [CrossRef]
  16. Al-Muaini, A.; Green, S.; Dakheel, A.; Abdullah, A.-H.; Dahr, W.A.A.; Dixon, S.; Kemp, P.; Clothier, B. Irrigation management with saline groundwater of a date palm cultivar in the hyper-arid United Arab Emirates. Agric. Water Manag. 2019, 211, 123–131. [Google Scholar] [CrossRef]
  17. Al-Katheeri, E.S.; Howari, F.M.; Murad, A.A. Hydrogeochemistry and pollution assessment of quaternary–tertiary aquifer in the Liwa area, United Arab Emirates. Environ. Earth Sci. 2009, 59, 581. [Google Scholar] [CrossRef]
  18. Iqbal, J.; Nazzal, Y.; Howari, F.; Xavier, C.; Yousef, A. Hydrochemical processes determining the groundwater quality for irrigation use in an arid environment: The case of Liwa Aquifer, Abu Dhabi, United Arab Emirates. Groundw. Sustain. Dev. 2018, 7, 212–219. [Google Scholar] [CrossRef]
  19. Mohamed, A.M.O. Groundwater Management. Available online: https://www.taylorfrancis.com/ (accessed on 12 July 2018).
  20. Sanford, W.E.; Wood, W.W. Hydrology of the coastal sabkhas of Abu Dhabi, United Arab Emirates. Hydrogeol. J. 2001, 9, 358–366. [Google Scholar] [CrossRef]
  21. Mohamed, M.M.; Hassane, A.B. Hydrochemistry assessment of groundwater quality in Al-Ain city, UAE. Environ. Earth Sci. 2016, 75, 353. [Google Scholar] [CrossRef]
  22. Murad, A.; Mahgoub, F.; Hussein, S. Hydrogeochemical variations of groundwater of the northern Jabal Hafit in eastern part of Abu Dhabi Emirate, United Arab Emirates (UAE). Int. J. Geosci. 2012, 3, 410. [Google Scholar] [CrossRef]
  23. Imes, J.L.; Wood, W.W. Solute and isotope constraint of groundwater recharge simulation in an arid environment, Abu Dhabi Emirate, United Arab Emirates. Hydrogeol. J. 2007, 15, 1307–1315. [Google Scholar] [CrossRef]
  24. Elmahdy, S.I.; Mohamed, M.M. Groundwater of Abu Dhabi Emirate: A regional assessment by means of remote sensing and geographic information system. Arab. J. Geosci. 2015, 8, 11279–11292. [Google Scholar] [CrossRef]
  25. Othman, A.K. Quantitative and Qualitative Assessment of Groundwater Resources in Al-Khatim Area, UAE. Master’s Thesis, United Arab Emirates University, Al-Ain, UAE, 2005. [Google Scholar]
  26. Embabi, N.S.; Yahia, M.A.; Al Sharhan, A.S. The National Atlas of UAE; United Arab Emirates University: Al Ain, UAE, 1993. [Google Scholar]
  27. El-Ghawaby, M.A.; El-Sayed, M.I. The structural and sedimentological setting of the Quaternary deposits in Al-Ain area, UAE. J. Arid Environ. 1997, 35, 627–640. [Google Scholar] [CrossRef]
  28. El-Shami, F. The hydrogeochemistry of the spring of Ain Bu Sukhanah, UAE. Arab Gulf J. Sci. Res. 1990, 8, 34–36. [Google Scholar]
  29. Abou El-Enin, H.S. Structurally controlled features in Jabal Hafit. Bull. Geog. Soc. Kuwait 1993, 151, 1–63. [Google Scholar]
  30. Baghdady, A.R. Petrography, Mineralogy and Environmental Impacts of the Sand Dune Fields of the Greater Al Ain Area, United Arab Emirates. Ph.D. Thesis, Faculty of Science, Ain Shams University, Ain Shams, Egypt, 1998. [Google Scholar]
  31. Garamoon, H.K. Hydrogeological and Geomorphological Studies on the Abu Dhabi-Dubai-Al Ain Triangle, UAE. Ph.D. Thesis, Ain Shames University, Cairo, Egypt, 1996. Unpublished. [Google Scholar]
  32. Hamdan, A.A.; Anan, H.S. Cretaceous/Tertiary boundary in the United Arab Emirates; Earth Science Series 7; MERC, Ain Shams University: Cairo, Egypt, 1993; Volume 7, pp. 223–231. [Google Scholar]
  33. Hamdan, A.R.A.; Bahr, S. Lithostratigraphy of the Paleogene succession of northern Jabal Hafit, Al Ain area, United Arab Emirates; Earth Science Series; Middle East Research Center, Ain Shams University: Cairo, Egypt, 1992; Volume 6, pp. 201–224. [Google Scholar]
  34. EAD. Groundwater Atlas of Abu Dhabi Emirate; Groundwater Wells and Soil Salinity Mapping of Abu Dhabi Emirate Project, Environment Agency: Abu Dhabi, UAE, 2018. [Google Scholar]
  35. American Public Health Association. Standard Method for Examination of Water and Wastewater, 21st ed.; American Public Health Association: Washington, DC, USA, 2005; 1220p. [Google Scholar]
  36. Richards, L.A. Diagnosis and Improvement of Saline and Alkali Soils; Wolters Kluwer, LWW: Philadelphia, PA, USA, 1954; Volume 78. [Google Scholar]
  37. Wilcox, L.V. Classification and Use of Irrigation Waters; U.S. Dept. of Agriculture: Washington, DC, USA, 1995.
  38. Raghunath, H.M. Ground Water: Hydrogeology, Ground Water Survey and Pumping Tests, Rural Water Supply and Irrigation Systems, 2nd ed.; New Age International (p) ltd Publishers: New Delhi, India, 1987. [Google Scholar]
  39. Kelley, W.P.; Brown, S.M.; Liebig, G.F., Jr. Chemical effects of saline irrigation water on soils. Soil Sci. 1940, 49, 95–108. [Google Scholar] [CrossRef]
  40. Wilding, L.P. Spatial variability: Its documentation, accommodation and implication to soil surveys. In Soil Spatial Variability; Nielsen, D.R., Bouma, J., Eds.; Purdon: Wageningen, The Netherlands, 1985; pp. 166–194. [Google Scholar]
  41. WHO. Guidelines for Drinking Water Quality, 3rd ed.; Recommendations; WHO: Geneva, Switzerland, 2004; Volume 1. [Google Scholar]
  42. Hem, J.D.; Durum, W.H. Solubility and occurrence of lead in surface water. J. Am. Water Works Assoc. 1973, 65, 562–568. [Google Scholar] [CrossRef]
  43. Tijani, M. Hydrogeochemical assessment of groundwater in Moro area, Kwara State, Nigeria. Environ. Geol. 1994, 24, 194–202. [Google Scholar] [CrossRef]
  44. Ahmed, A.; Clark, I. Groundwater flow and geochemical evolution in the Central Flinders Ranges, South Australia. Sci. Total Environ. 2016, 572, 837–851. [Google Scholar] [CrossRef]
  45. Khalifa, M.A. Geohydrology and the Source of Flowing Well Water in Al-Neima Area, Al, Abu Dhabi Emirate, UAE; National Drilling Company and United States Geological Survey: Abu Dhabi, UAE, 2003; Volume 9. [Google Scholar]
  46. Edition, F. Guidelines for drinking-water quality. WHO Chron. 2011, 38, 104–108. [Google Scholar]
  47. WHO. The Guidelines for Drinking-Water Quality, 4th ed.; WHO Library Cataloguing: Geneva, Switzerland, 2011. [Google Scholar]
  48. Scholler, H. Qualitative Evaluation of Groundwater Resources; Methods and techniques of groundwater investigations and development; UNESCO: Paris, France, 1965; pp. 54–83. [Google Scholar]
  49. Sulin, V.A. Basis of Classification of Natural Waters; USSR Academy of Science: Moscow, Russia, 1948. (in Russian) [Google Scholar]
  50. Datta, P.S.; Tyagi, S.K. Major ion chemistry of groundwater in Delhi area: Chemical weathering processes and groundwater flow regime. J. Geol. Soc. India 1996, 47, 88–179. [Google Scholar]
  51. Bandara, J.M.R.S.; Wijewardena, H.V.P.; Bandara, Y.M.A.Y.; Jayasooriya, R.G.P.T.; Rajapaksha, H. Pollution of River Mahaweli and farmlands under irrigation by cadmium from agricultural inputs leading to a chronic renal failure epidemic among farmers in NCP, Sri Lanka. Environ. Geochem. Health Kew 2011, 33, 439–453. [Google Scholar] [CrossRef] [PubMed]
  52. Carolyn, K. Lead Contamination in Our Environment, Online Magazine Environmental Quality in the 21st Century; Yale-New Haven Institute: New Haven, CT, USA, 1997. [Google Scholar]
  53. Rajappa, B.; Manjappa, S.; Puttaiah, E.T. Monitoring of heavy metal concentration in groundwater of Hakinaka Taluk, India. Contemp. Eng. Sci. 2010, 3, 90–183. [Google Scholar]
  54. Foster, S.; Pulido-Bosch, A.; Vallejos, Á.; Molina, L.; Llop, A.; MacDonald, A.M. Impact of irrigated agriculture on groundwater-recharge salinity: A major sustainability concern in semi-arid regions. Hydrogeol. J. 2018, 26, 2781–2791. [Google Scholar] [CrossRef]
Figure 1. Al Khatim and Remah study areas located in the eastern region of United Arab Emirates.
Hydrology 06 00060 g001
Figure 2. Geological map of the study areas showing geological formations in and around the study areas.
Hydrology 06 00060 g002
Figure 3. Maps of the Abu Dhabi groundwater aquifers (modified after Elmahdy and Mohamed [24]).
Hydrology 06 00060 g003
Figure 4. The different formations are: (A) Lithological formation of groundwater-bearing rocks; (B,C) east and west topographic profile and showing the groundwater flow path (modified after Elmahdy and Mohamed [24]).
Hydrology 06 00060 g004
Figure 5. Sampled groundwater wells and land use map for Al Khatim and Remah study areas.
Hydrology 06 00060 g005
Figure 6. Spatial distribution of electrical conductivity (EC), salinity, and pH.
Hydrology 06 00060 g006
Figure 7. Spatial distribution of sodium (Na+), and chloride (Cl) ions.
Hydrology 06 00060 g007
Figure 8. Spatial distribution of calcium (Ca2+), magnesium (Mg2+), and potassium (K+) ions.
Hydrology 06 00060 g008aHydrology 06 00060 g008b
Figure 9. Spatial distribution of bicarbonate (HCO3), sulfate (SO4), and nitrate (NO3) ions.
Hydrology 06 00060 g009
Figure 10. Spatial distribution of cadmium ion.
Hydrology 06 00060 g010
Figure 11. Box plot comparing groundwater level and salinity of Remah and Al Khatim.
Hydrology 06 00060 g011
Figure 12. Piper plot for Remah (R) and Al Khatim (AK).
Hydrology 06 00060 g012
Figure 13. Schoeller plot of the collected groundwater samples at Al Khatim (AK) and Remah (R).
Hydrology 06 00060 g013
Figure 14. (a) Ca + Mg versus SO4 + HCO3; (b) Na versus Cl plot for Remah and Al Khatim.
Hydrology 06 00060 g014
Figure 15. Ca versus SO4 plot for Remah and Al Khatim.
Hydrology 06 00060 g015
Figure 16. Extended Wilcox plot showing irrigation water classification.
Hydrology 06 00060 g016
Table 1. Descriptive statistics of chemical concentration and water depth in groundwater in Remah and Al Khatim (CV: coefficient of variation).
Remah
ParametersMinMaxMeanCVWHO [41]
EC (mS/cm)4.786.218%0.78–31.2
Salinity (mg/L)25004400335020%
TDS (mg/L)31565380414818%500–1500
pH4.57.25.915%6.5–8.5
Na (mg/L)58187369514%200
Cl (mg/L)8511474116319%200–600
Ca (mg/L)6224213745%75–200
Mg (mg/L)21472929%30–150
K (mg/L)6.2271542%10
SO4 (mg/L)11432016151320%200–400
HCO3 (mg/L)32513915%300
NO3 (mg/L)211649660%45
Water Depth (m)10319815620%
Al Khatim
EC (mS/cm)172419.812%0.78–31.2
Salinity (mg/L)970014,60011,77013%
TDS (mg/L)900614,37110,89313%500–1500
pH5.027.03610%6.5–8.5
Na (mg/L)20472865245311%200
Cl (mg/L)40945888473013%200–600
Ca (mg/L)436100768422%75–200
Mg (mg/L)8918312528%30–150
K (mg/L)12482745%10
SO4 (mg/L)28275457363224%200–400
HCO3 (mg/L)8014010417%300
NO3 (mg/L)14106031695%45
Water Depth (m)17423330%
Table 2. Descriptive statistics for trace metal concentration in groundwater in Remah and Al Khatim (CV: coefficient of variation).
Remah
ParameterMinMaxMeanCVWHO [47]
Cd (mg/L)0.250.960.627569.89%0.003
Zn (mg/L)0.0050.0090.007320.41%5
Cr (mg/L)0.0040.0060.005312.1%0.05
Pb (mg/L)<0.01<0.01
Al Khatim
Cd (mg/L)0.0520.9960.429378.8%0.003
Cr (mg/L)0.0050.0060.00559.12%0.05
Zn (mg/L)0.0070.0090.008219.4%5
Pb (mg/L)<0.01<0.01
Table 3. Groundwater classification for irrigation use (R: Remah; AK: Al Khatim).
Well IDNa%Salinity Hazard EC (µS/cm)SARMH (%)KI (mEq/L)
R174%726014.729.52.8
R276%69501522.83.2
R369%803012.322.82.2
R472%757012.320.82.5
R571%513011.819.62.4
R680.7%589014.830.44.1
R784.8%550018.138.35.5
R881%511014.6304.2
R981.7%576016.130.54.4
R1084.1%471016.335.65.3
AK174%22,00026.333.82.8
AK274.3%24,20026.336.02.9
AK370%19,70021.721.72.3
AK470%18,00020.618.12.3
AK571%18,70022.319.12.5
AK674%16,70022.6302.9
AK767%20,10020.718.82.1
AK873%17,10024.018.62.6
AK969%19,60021.418.92.2
AK1065%22,30021.321.21.9
Minimum65.5%471011.818.11.9
Maximum84.8%24,20026.338.35.5
Mean74.1%13,015.518.725.83.1
Na%: 60–80 doubtful and >80 unsuitable; Salinity: >3000 mg/L unsuitable; SAR: >9 unsuitable; MH: <50% safe; KI: >1 unsafe.

