Article

Hydrometeorological Trends in a Low-Gradient Forested Watershed on the Southeastern Atlantic Coastal Plain in the USA

by
Devendra M. Amatya
1,*,
Timothy J. Callahan
2,
Sourav Mukherjee
1,
Charles A. Harrison
1,
Carl C. Trettin
1,
Andrzej Wałęga
3,
Dariusz Młyński
3 and
Kristen D. Emmett
4
1
USDA Forest Service, Cordesville, SC 29434, USA
2
Department of Geology and Environmental Geosciences, College of Charleston, Charleston, SC 29424, USA
3
Department of Engineering Sanitary and Water Management, University of Agriculture in Krakow, 31-120 Krakow, Poland
4
USDA Forest Service, Asheville, NC 28804, USA
*
Author to whom correspondence should be addressed.
Hydrology 2024, 11(3), 31; https://doi.org/10.3390/hydrology11030031
Submission received: 5 January 2024 / Revised: 19 February 2024 / Accepted: 21 February 2024 / Published: 26 February 2024
(This article belongs to the Special Issue Forest Hydrometeorology)

Abstract

:
Hydrology and meteorological data from relatively undisturbed watersheds aid in identifying effects on ecosystem services, tracking hydroclimatic trends, and reducing model uncertainties. Sustainable forest, water, and infrastructure management depends on assessing the impacts of extreme events and land use change on flooding, droughts, and biogeochemical processes. For example, global climate models predict more frequent high-intensity storms and longer dry periods for the southeastern USA. We summarized 17 years (2005–2021) of hydrometeorological data recorded in the 52 km2, third-order Turkey Creek watershed at the Santee Experimental Forest (SEF), Southeastern Coastal Plain, USA. This is a non-tidal headwater system of the Charleston Harbor estuary. The study period included a wide range of weather conditions; annual precipitation (P) and potential evapotranspiration (PET) ranged from 994 mm and 1212 mm in 2007 to 2243 mm and 1063 in 2015, respectively. The annual runoff coefficient (ROC) varied from 0.09 in 2007 (with water table (WT) as deep as 2.4 m below surface) to 0.52 in 2015 (with frequently ponded WT conditions), with an average of 0.22. Although the average P (1470 mm) was 11% higher than the historic 1964–1976 average (1320 mm), no significant (α= 0.05) trend was found in the annual P (p = 0.11), ROC (p = 0.17) or runoff (p = 0.27). Runoff occurred on 76.4% of all days in the study period, exceeding 20 mm/day for 1.25% of all days, mostly due to intense storms in the summer and lower ET demand in the winter. No-flow conditions were common during most of the summer growing season. WT recharge occurred during water-surplus conditions, and storm-event base flow contributed 23–47% of the total runoff as estimated using a hydrograph separation method. Storm-event peak discharge in the Turkey Creek was dominated by shallow subsurface runoff and was correlated with 48 h precipitation totals. Estimated precipitation intensity–duration–frequency and flood frequency relationships were found to be larger than those found by NOAA for the 1893–2002 period (for durations ≥ 3 h), and by USGS regional frequencies (for ≥10-year return intervals), respectively, for the same location. We recommend an integrated analysis of these data together with available water quality data to (1) assess the impacts of rising tides on the hydroperiod and biogeochemical processes in riparian forests of the estuary headwaters, (2) validate rainfall–runoff models including watershed scale models to assess land use and climate change on hydrology and water quality, and (3) inform watershed restoration goals, strategies, and infrastructure design in coastal watersheds.

1. Introduction

This study analyzed the most recent 17 years’ (2005–2021) of hydro-meteorological data in the Turkey Creek watershed, a 52 km2 forested area in coastal South Carolina that lies adjacent to long-term study areas within the Santee Experimental Forest (SEF) and the Francis Marion National Forest. The purpose was to synthesize water budget data and derive relationships for precipitation intensity–duration–frequencies (PIDF) and flow duration and frequencies. Long-term hydrology, climate, and species-specific land-cover data from headwater forested watersheds are important in the geo-environmental and ecological sciences as well as in modeling for environmental impact studies. In September of 1989, a major hurricane (Hugo) affected this area, such that forest regeneration and the hydrology conditions were reportedly recovered only by 2004 [1]. We used data from this watershed-scale monitoring system to answer two key questions. For example, (a) how will a changing climate affect the hydrology (particularly streamflow and ET) of this relatively less-intensively managed forest ecosystem? and (b) how have runoff and peak discharges, which affect stormwater and road infrastructure design, responded, and what could change in the future when high intensity storm events are forecast for the region?

1.1. Rationale

The U.S. Environmental Protection Agency (EPA) estimates that 5260 km2 (2029 mi²) of forest will be cleared for urban development in South Carolina by the year 2050 [2]. Emmett [3] noted that harvesting is the predominant agent of forest canopy cover loss in the southeastern US, affecting 42% of the region’s forest area from 1986–2010, based on an analysis of the North American Forest Dynamics—Attribution dataset (NAFD-ATT) [4]. Urbanization, in some cases after forest clearing, results in more impervious cover which increases surface runoff due to reduced soil–water infiltration and groundwater recharge [2,5,6] as well as evapotranspiration (ET) [7]. Schueler [8] noted in their review of urban stream research that as little as 10% of impervious cover in a watershed may alter hydrological processes and impair water quality. Nagy and Lockaby [9] noted that rising land values, increased market concentrations, increased road accessibility, and ultimately higher opportunity costs for maintaining forested land contributed to the conversion of forested to urban land and degradation of aquatic and terrestrial systems in Georgia, USA. These cultural and socioeconomic factors associated with increased urbanization are common globally and are likely to continue in the southeastern United States [10]. The Charleston Metropolitan Area in South Carolina is one such urban center, and development within which threatens adjacent, less developed watersheds in coastal South Carolina [11]. For example, long-term watersheds at the US Forest Service Santee Experimental Forest within the Francis Marion National Forest are at the wildland–urban interface of the urbanizing Charleston area [12].
Long-term hydrologic, climatic, and species-specific land-cover data have a multitude of uses and applications. These include modeling and quantifying ecohydrological processes controlling water flow paths and residence time [13,14,15], assessment of the impacts of land use change and forest disturbance on flooding and droughts [16] and conservation of ecosystems [17,18], risk assessment tools for extreme events [19,20], and a consideration of societal needs [15,21,22].
Past studies have used long-term data from small, paired, upland forested watersheds to examine ecohydrologic processes including hillslope process-based runoff generation mechanisms (for example see [23,24]). However, some observational studies have been carried out at only limited sites on the low-gradient southeastern Coastal Plain forested watersheds, consisting of wetland forests and pine flatwoods, and where the position of a shallow water table driven by rainfall and ET generally dictates runoff [25,26,27,28,29,30,31,32,33,34,35]. Most of those studies were focused on relatively small first-order watersheds on the Atlantic Coastal Plain and analyses using long-term data from the larger watersheds are scarce but are becoming increasingly important as the recent focus on water quantity and quality has rather shifted to a landscape or regional scales [36,37,38]. In addition, results reported in literature for effects of afforestation and deforestation on streamflow and peak flow in those small watersheds cannot be simply extrapolated to large watersheds [38,39] because of more complexities within land use (e.g., managed, and natural forests, wetlands, lakes, open lands, urban use) and their interactions [38].

1.2. Background and Related Work

Previous studies focused on the water budget [40,41], water budget modeling [40,42], event rainfall–runoff analysis using historical data [43,44], and the water quality [41,45,46] of a third-order, relatively undisturbed, Turkey Creek watershed at the Santee Experimental Forest. The major disturbance to the forest occurred due to Hurricane Hugo that decimated the tree stands [47]. Most of these earlier studies presumed the watershed area was much larger than the more recent LiDAR-based estimate (7260 ha vs. 5240 ha) [48]. Amatya et al. [49] presented additional ecohydrological and socioeconomic characteristics and discussed key elements for watershed management including water resource assessment, modeling integrated water resources management, environmental and social impact assessment, and land use planning on such a typical coastal forest watershed. Similarly, additional short-term ecohydrological studies on this and adjacent sites were also synthesized by Amatya et al. [50].
Amatya et al. [49] also highlighted several key scientific questions left for future potential studies that would help address multiple hydrology and water resources issues on this rapidly urbanizing forested landscape. One question was “what are the uncertainties associated with current knowledge of surface and groundwater (SGW) interactions and their partitioning that affect the key ecosystem services like water supply, and ultimately water quality, and biogeochemical processes and transport.” The SGW part was partially addressed in studies by Callahan et al. [51] and Amatya et al. [52], which used a modified version of a Curve Number-based rainfall–runoff model [53] using storm event data recorded in two first-order sub-catchments nested within Turkey Creek and other similar headwater catchments in the region. The authors concluded that the soil saturation coefficient, as a proxy of antecedent moisture condition, is a key parameter used to describe the partitioning of runoff into overland surface and shallow subsurface runoff. Similarly, Amatya et al. [25] attempted to answer the questions “what are the mechanisms and rates of feedback between topography, hydrology, ecology (vegetation) and how do these vary as a function of local climate using a paired watershed data?” Furthermore, two studies addressed the questions “what is/are the cause(s) of the high methylization efficiency of mercury (Hg) in these streams, and how do forest management practices affect Hg transport and methylization [54]?” Silvicultural practices such as prescribed burning and mechanical thinning which are routinely undertaken in this study watershed interfere with Hg storage in forests and potentially increase Hg export downstream. Those areas can be hotspots for transformation into methylmercury (MeHg) facilitated by anaerobic microbes. Therefore, an accurate quantification of streamflow is needed for estimating impacts of the forest management on Hg export, as a function of streamflow, in these forested watersheds. Lastly, a project focused on the question “how does the interaction of downstream tidal energy with the Turkey Creek watershed flow affect the hydrological and biogeochemical processes including net primary productivity, carbon balance and greenhouse gas emissions?” [55]. The motivation was that tidally mediated processes downstream are dependent upon the seasonal flow dynamics of this headwater system.

2. Study Objectives

The first objective of this study was to analyze the most recent 17 years of (2005–2021) rainfall, stream flow, peak flow rates, potential ET (PET), ET, and groundwater data for the trends and patterns in their responses to rainfall observed on the study watershed (Turkey Creek), and to compare them with those reported in earlier studies for this watershed to assess the potential effects of climate change, such as more frequent high-intensity storm events. The second objective was to derive the daily rainfall and flow frequency duration curves, PIDFs and flood frequencies that are generally used in watershed and stream restoration projects, low flow monitoring to protect stream aquatic habitats, and to inform the design and management of stormwater, roadway, and drainage infrastructure.

3. Materials and Methods

3.1. Study Site

The study site is the Turkey Creek watershed (WS78) in the Santee Experimental Forest (Figure 1) originally established by the USDA Forest Service in 1964 and monitored through 1984. Recognizing the importance of reference watershed data in a rapidly changing coastal environment, stream gauging was reestablished in Turkey Creek in 2004 to facilitate a large-scale eco-hydrological monitoring and modeling program [56]. The present WS-78 gauging station is approximately 800 m upstream of the original location; it is instrumented with a real-time stream gauge sensor and a rain gauge (http://waterdata.usgs.gov/sc/nwis/uv?site_no=02172035, accessed on 20 February 2024). The gauging station is operated in cooperation with the US Geological Survey (USGS) and the College of Charleston. This paper presents the analysis of data collected from 2005 to 2021.
This third-order watershed is located at 33°08′ N latitude and 79°47′ W longitude near the small town of Huger, in Berkeley County of South Carolina (Figure 1), and 60 km northeast of the city of Charleston (metropolitan area population of approximately 900,000). It is one of the headwaters of the East Branch of the Cooper River, a major tributary of the Cooper River, which drains to Charleston Harbor. The Turkey Creek watershed is similar to other low-gradient forest watersheds in the southeastern Atlantic coastal plain where rapid urban development has been ongoing since the 1990s. The elevation of the watershed varies from 3.5 m at the outlet to 11.5 m above mean sea level (a.m.s.l.) [48]; Table 1.
The sub-tropical climate is characteristic of the coastal plain, with hot and humid summers and moderate winters. The minimum and maximum air temperatures, based on the 1951–2008 period of records at the Santee Experimental Forest, were −8.5 °C and 37.7 °C, respectively, with an average daily temperature of 18.4 °C. Annual precipitation ranged from 830 mm to 1940 mm; and the average precipitation was 1370 mm [27]. Winters are generally wet due to low evapotranspiration (ET) demands, and low intensity, long-duration rain events. Summers are influenced by high ET demands and short-duration, high-intensity storms; tropical depression storms affect the region during July and October.
Land use within the watershed is comprised of 88% pine forest (mostly regenerated loblolly (Pinus taeda L.) and long leaf pine (Pinus palustris)), 10% wetlands and water, and 2% agricultural lands, roads, and open areas [40]. Detailed description of land use and forest cover and types and management are in Morrison [57]; see Appendix A Figure A1 for a land use and land cover map. The watershed was heavily impacted by Hurricane Hugo in September 1989, and the forest overstory trees were almost completely destroyed [47]. The current forests are a mixture of remnant large trees, natural regeneration, and about 1000 ha of planted pine [58] (Table 1). The forests are managed using prescribed fire and thinning to reduce fuel hazards and minimize wildfire risks as well as to manage longleaf pine restoration efforts and wildlife habitat (such as red-cockaded woodpecker, Picoides borealis, an endangered species). Treatments to reduce hazardous fuel mainly include broadcast burning, which was as much as 93% of the watershed in 2012, as well as thinning, low intensity under-burn, stand clearcut, and site preparation. The areas and their percentages of total watershed area where such treatments were implemented on the watershed for 2005 to 2021 period are provided in Appendix A Table A1 [59]. However, the areas harvested for timber, which was minimal being below 3% (2019) of total area (e.g., well below the harvesting level in surrounding area), and hydrologic soil groups and their distributions, are provided elsewhere [57,60]. The watershed is also used for recreational purposes such as hunting, fishing, bird watching, hiking, canoeing, biking, historical tours, horse riding, all-terrain vehicle (ATV) use, and agriculture [49].
The geology of the study site is defined by the Floridan/Santee aquifer which is partially confined beneath the watershed, where the top of the Santee Limestone is approximately 20 m below ground surface (bgs) on the western side of the watershed and about 13 m bgs in the eastern area (Figure 1). More details are given in Amatya et al. [49]. The soils in the watershed are mostly poorly drained soils of Wahee (clayey, mixed, thermic Aeric Ochraquults) and Lenoir (clayey, mixed, thermic Aeric Paleaquults) series [61] (Table 1). The watershed also contains small areas of somewhat poorly and moderately well-drained sandy and loamy soils such as Goldsboro and Lynchburg (both fine loamy sand) as shown in the soils map in Appendix A Figure A2. Details of soil types are given elsewhere [49,57]. The watershed contains about 56% (2934 ha) wetlands on planted pine (based on the NWI classification https://www.fws.gov/wetlands/, accessed on 17 March 2021), 26% (1392 ha) of other forested wetlands, and <1% (39.7 ha) of isolated wetlands.

3.2. Data Collection

A list of recorded hydrometeorological variables used in the study analysis is shown in Table 2.

3.2.1. Rainfall

There are two automatic tipping bucket rain gauges in the study watershed. One gauge is associated with the Campbell Scientific CR10X weather station located near the middle of the Turkey Creek (TC) watershed; another rain gauge is associated with USGS stream gage 02172035; (https://waterdata.usgs.gov/monitoring-location/02172035/, accessed on 20 February 2024) at the watershed outlet (Figure 1). An additional gauge is on Lotti Road just outside the eastern boundary of the watershed. In this study (2005–2021), daily rainfall data from only the TC gauge were used for the analysis (Table 2). Since data from the USGS gauge were partially unavailable for February, March, October, and November of 2005, data from the Lotti gauge were used for the year 2005 instead of the TC gauge when it was still not in operation. Event times and tipping percentages from the Lotti gauge were also used to help fill in gaps in the data. Because the manual rain gauges overflowed during the extreme rain event of 3–4 October 2015, the TC manual/tipping bucket ratio from 28 September 2015 to 2 October 2015 was used to estimate rainfall totals from 2–8 October 2015. After the freezing rain and snow event of 3 January 2018, TC meltwater totals and data from a Pluvio weighing bucket gauge at the distant SEF location [62] were used to estimate precipitation during the 3–8 January 2018 period. Data from each of the automatic rain gauges were verified and calibrated using an adjacent manual rain gauge. Breakpoint event rainfall data from the loggers were processed to obtain daily, monthly, and annual totals for each of the three gauges [62,63].

3.2.2. Streamflow

Streamflow records for the 2005 to 2021 period (Table 2) were obtained from a USGS gauging station with real time stage measurements at 15 min intervals using a Sutron Satlink 2 datalogger connected to a bubbler-type water level sensor anchored on the stream bottom at the gauging station, which is located at the outlet of the watershed near the bridge on Hwy 41 (https://waterdata.usgs.gov/monitoring-location/02172035/, accessed on 20 February 2024) (Figure 1). Flow rates were calculated by the USGS using a stage–discharge relationship. The 15 min flow rates were integrated to obtain the daily, monthly, and annual totals [62,63]. Missing daily data in early 2005 were extrapolated using a calibration relationship with nearby watershed (WS80) [30].

3.2.3. Weather Data and Potential Evapotranspiration (PET)

Weather data from two automated stations were available to estimate daily PET for the 2005–2021 study period. The first station (TC), located in the middle of the study site (Figure 1) (Table 2), was installed in October 2005 to measure precipitation, air temperature, soil temperature, relative humidity, wind speed and direction, and solar radiation on a half-hourly basis. The second station on a 27 m tall tower also measures air temperature, relative humidity, net radiation, wind speed and direction on a 15 min basis above a forest canopy on nearby WS80 watershed. Details of the stations are provided elsewhere [62,63,64].

3.2.4. Groundwater

Groundwater data were measured as the depth below the ground surface at the well location, with ground elevations rectified using NAVD88 datum. It was measured using water table wells, shallow piezometers (2.5 m depth below ground), and also deeper piezometers (up to 20 m depth) placed into the top of the Gordon Aquifer (Santee Limestone), an important groundwater resource in the region [51]; see Table 2. Time series data for groundwater dynamics at four sites in the watershed were collected on an hourly basis starting in June 2006 on areas representing four major categories of soils (Rains, Goldsboro, Lenoir, and Lynchburg series) in the uplands on the left (south) bank of the watershed and in a fifth well in an area with Wahee soil (on the right bank) starting in January 2011 (Figure 1) [62,63]. Automatically recorded data collection at all sites was discontinued in May 2019.
Water elevation data from shallow water table wells for the 2006 to 2021 period were compared to the piezometric data to estimate groundwater recharge in the unconfined aquifer using the water table fluctuation (WTF) method and an estimate of drainable porosity [51,65], and the Darcy flux method [66,67] during static conditions in the absence of storm events. The WTF method is a short-term estimate that assumes that soil water deficits are satisfied by the storm event and the infiltrating water has a direct impact on the water table. The Darcy flux method is a longer-term estimate for a catchment-scale approximation of groundwater recharge potential. Drainable porosity (i.e., specific yield) of the soil was estimated using water table response data for 13 selected rainfall events from July 2006 to December 2007. Water table and piezometer water level data were used from one of the Lenoir soils sites near the TC weather station near the headwaters. Descriptions of well and piezometer installation, the water level monitoring procedure, and recharge estimates are provided in Callahan et al. [51].

3.3. Data Analysis

Rainfall, Streamflow, Evapotranspiration, and Weather

Measured data on rainfall and runoff coefficient (ROC), computed as a unitless number by dividing annual runoff by rainfall, and estimated PET and ET for the 2005–2021 period were analyzed for their mean annual (calendar year), standard deviation, and coefficient of variation. Similarly, annual ET was approximated by calculating the difference between the annual rainfall and runoff, though this implies the assumption of a negligible change in soil moisture storage. Weather data collected on a half-hourly basis were processed to obtain daily averages. Weather data for 2005 were obtained from the SEF Headquarters [68] and data from the study site were used for 2006 to 2021. Daily average weather data were then used to estimate daily potential evapotranspiration (PET) using the Priestley–Taylor (P–T) method [69] for a standard grass reference [64]. Daily PET estimated using maximum and minimum temperature based daily average temperature from 2006–2010 was decreased by 5% to match the daily average temperature obtained by averaging all 30 min readings, consistent with the rest of the 2011–2021 period. However, daily P-T PET for 2015–2021 period estimated using the weather data from the nearby WS80 tower station was used in this study due to an issue with solar radiation used for computing net radiation. The P-T PET-based daily PET were used to obtain total annual PET in this study. All annual analyses were based on a calendar year. Similar analyses were also conducted using water years (April–March), but for 2006–2021 only, when the soils were relatively wetter and near saturation, and potentially with minimal change in storage year-to-year resulting in less variability in annual ET (Appendix A Table A2). Analyses were also carried out by growing (April–October) and dormant (November–March) seasons (Appendix A Table A3).
Daily (24 h) rainfall records were analyzed for their annual distribution including for various storm sizes. Depth-based daily rainfall as well as streamflow were used to analyze rainfall intensity–duration–frequencies as well as flow duration–frequencies, respectively, for the April 2005–December 2021 period using the Weibull probability distribution method [70]. Flow duration curves were also analyzed for relatively dry years (2007, 2012), wet years (2015, 2020), and normal years (2008, 2013).
Daily streamflow (only from 2006–2021) was also used to quantify partitioned baseflow following the automated recursive digital filtering procedure reported by Arnold et al. [71]. The average of Pass1 and Pass2 filtering techniques was used to compute estimated daily base flow. In addition, relationships between daily peak discharges and corresponding rainfall for various durations were explored. Similarly, both the daily water table depths from the five wells and the water levels in the deeper piezometers were also plotted to examine their response to rainfall, general trends, and seasonal variabilities. Additionally, the Pettitt test [72] was employed to detect change, if any, and its significance in trend in piezometric deep water table data. The Pettitt test is based on the U statistic. The null hypothesis assumes a change point detection in water table time series, with an alternative hypothesis lacking the change point. The null hypothesis is rejected if U is higher than Ucrit.

3.4. Trend Analysis

Interannual trends in all the above hydroclimatic variables were estimated using the Sen’s slope estimator [73] and tested for significance based on the modified Mann–Kendall (M–K) trend test [73,74,75] under the null hypothesis of no trend (α = 0.05). The M–K test is a non-parametric test that considers the test statistic, S, to have a zero mean and variance estimated using methods by Kendall [74] and Mann [75]. Sen [73] developed a non-parametric procedure for estimating the true slope (change per unit time) given a linear trend is present in a time series. Libiseller and Grimvall [76] developed the modified Mann–Kendall trend test for detection of trend in environmental data in the presence of covariates. In this study, we used the modified Mann–Kendall trend test methodology for testing against the null hypothesis of no trends (at 5% significance level) in our hydrometeorological dataset.

3.5. Design of Rainfall and Flood Frequency Analyses for Infrastructure Vulnerability Assessment

3.5.1. Generalized Extreme Value Analysis

Generalized extreme value analysis (GEV) [77] was used to perform a frequency analysis of extreme rainfall events. GEV analysis is a specific technique within extreme value theory that utilizes the GEV distribution for practical modeling and analysis of extreme events. We employed the Block Maxima (BM) method to restrict attention to the yearly maxima of 24 h and 48 h rainfall estimates over a given time period (2005–2021). This method is generally applied to study the upper-tail characteristics of climate extremes [77]. In this study, the GEV methodology is preferred over other extreme value-based modeling approaches, such as the Generalized Pareto Distribution for exceedances, to make the analysis comparable with the one adopted in NOAA-Atlas14 [78].The GEV is a three-parameter distribution comprising of the location (µ), scale (σ), and shape (ξ) parameters, and the theoretical cumulative distribution function of a real-valued random variable, X, can be written as [77]
F G E V x μ , σ , ε ) = e x p 1 + ε σ ( x μ 1 / ε ,   μ R , σ > 0 ,   ε 0  
The parameter estimation was performed by using the L-moment methodology [79]. L-moment-based estimations are more stable and more robust in the presence of extreme values with small sample size [80,81]. This is because L-moments do not have sample size-related bounds [79,82]. The p-quantile of the GEV distribution was then estimated as,
q p = 1 l n ( 1 p ) ε 1 × σ ε + μ ,   ε 0  
where (1 − p) is the non-exceedance probability.

3.5.2. Log-Pearson Type III (LPIII) Distribution

Design discharge estimation using 17-year streamflow datasets was performed by fitting annual maxima to log-Pearson type III (LPIII) distribution. The LPIII is a statistical method of fitting frequency distribution values for predicting flood at specific sites and is used extensively in hydrologic applications. We used the LPIII distribution because it is highly recommended for use by the U.S. federal agencies as well as by many hydrologists/practitioners for flood frequency analyses [83]. This is consistent with the USGS computer program PEAKFQW version 5.2.0, which fits the annual peak-flow data to an LPIII distribution [84]. This method has the advantage of extrapolating event data with return periods well beyond the pragmatic flood events. These frequencies were compared with those obtained by the USGS regional regression equations [84] regionalized to a function of drainage area and 24 h, 50 yr PI derived for the same watershed and rain gauge location, respectively.

4. Results and Discussion

4.1. Annual Rainfall, Streamflow, ROC, ET, and PET

Annual rainfall data are summarized in Table 3 for the 17-year (2005–2021) study period. Rainfall varied from as low as 994 mm in 2007 to as high as 2243 mm in 2015, with an average of 1470 mm and a COV of 0.23. This COV is greater than the 0.18 observed during 13-year historic 1964–1976 period reported by Amatya and Trettin [85], likely due to low and high extremes that were 27% lower and 64% higher, respectively, than the historic average of 1320 mm for the study site as well as the long-term (1946–2008) average of 1370 mm for the nearby the SEF headquarters rain gauge [27]. The highest rainfall in 2015 was an indirect result of Hurricane Joaquin (which stayed in the ocean off the coast) leading to extremely high precipitation that resulted in 470 mm in a 2-day (3–4 October) period, which was close to the 440 mm recorded at Charleston airport [86]. Eleven out of the seventeen years, particularly from 2013 to 2020, yielded higher than long-term average rainfall.
The estimated annual Priestley–Taylor (P-T)-based PET ranged from 1116 mm in 2009 to as high as 1350 mm in 2019, with an average of 1255 mm (Table 3), similar to the water year-based PET of 1254 mm which also had a COV of 0.05 (Appendix A Table A2). This average was about 10% higher than the average of 1137 mm for the 1946–2008 period obtained by Dai et al. [27] and about 5% higher than the 1194 mm average for the 2011–2021 period, both calculated using the Hargreaves–Samani PET method. In addition, the P-T average of 1255 mm was 16% higher than 1079 mm average obtained by Amatya and Trettin [85] using the Thornthwaite PET method for the 1964–1976 period using data from the SEF weather station. One possible reason for the higher P-T-based PET may also be due to omission of daily soil heat flux in the energy component and inherent differences in the PET methods compared here [63,87]. It may also be explained by differences in the in recording periods.
Annual streamflow varied from as low as 23 mm in 2012 to as high as 1517 mm in the extremely wet year of 2015 (Table 3; Figure 2). Note that the relatively dry year of 2012, preceded by an even drier year in 2011, resulted in the lowest flow (23 mm) and lowest ROC (0.02) for the entire period of record. Interestingly, 2007 had a similar dry period yet yielded a higher flow and ROC of 94 mm and 0.09, respectively, compared to 2012 despite 2007 having the lowest rainfall on record. We presume this was due to wetter antecedent conditions in 2006 compared to 2011. In addition, the potential energy demands of 2599 mm PET in 2011–2012 were also higher than the 2510 mm recorded for 2006–2007. This potentially resulted in a higher total 2 year ET of 2080 mm with increased storage compared to only 1903 mm for 2006–2007, with a wetter initial year of 2006 compared to the initial year of 2011, yielding a 133 mm lower flow in 2011–2012 (Table 3). Notably, the water year-based ET of 1023 mm in 2007 (Appendix A Table A2) was 123 mm higher than the calendar year ET of 900 mm (Table 3). The same is true for the water year-based ET estimation for 2011 and 2012 both of which have higher ET than the corresponding calendar year values (Table 3). On an annual basis, the water year-basis ET may be more realistic because it minimizes the storage effects due to ET when its demand is the lowest in April.
Average annual flow response to the rainfall, as shown by the ROC of 0.24, ranged from 0.02 to 0.68 in 2015 due to the extreme rainfall event. This average is consistent with the average from the water year-based value (Appendix A Table A2) of 0.24 reported for the 1964–1976 period with only 1320 mm rainfall [85] as well as for the small 155 ha WS77 watershed, with similar management practices, for the 2011–2019 period but with slightly higher average (1496 mm) rainfall [25]. Hazardous fuel treatment for understory removal on about 93% of the watershed (Appendix A Figure A2) in the dry year of 2012 might not have affected flows due to the very dry conditions. This is consistent with the authors of [60] who noted that these systems (whether treated or untreated) may respond similarly in extreme wet and/or dry conditions. A double mass curve analysis using cumulative annual flow versus rainfall (not shown) indicates some rising flow trend starting in 2015 as also observed in Figure 2.
Average annual ET of 1077 mm for this period (Table 3) (similar to the water-year average ET of 1079 mm; Appendix A Table A2) was 9.6% higher than the 983 mm obtained for the relatively drier historic 1964–1976 period [84], indicating that the system is moisture limited [
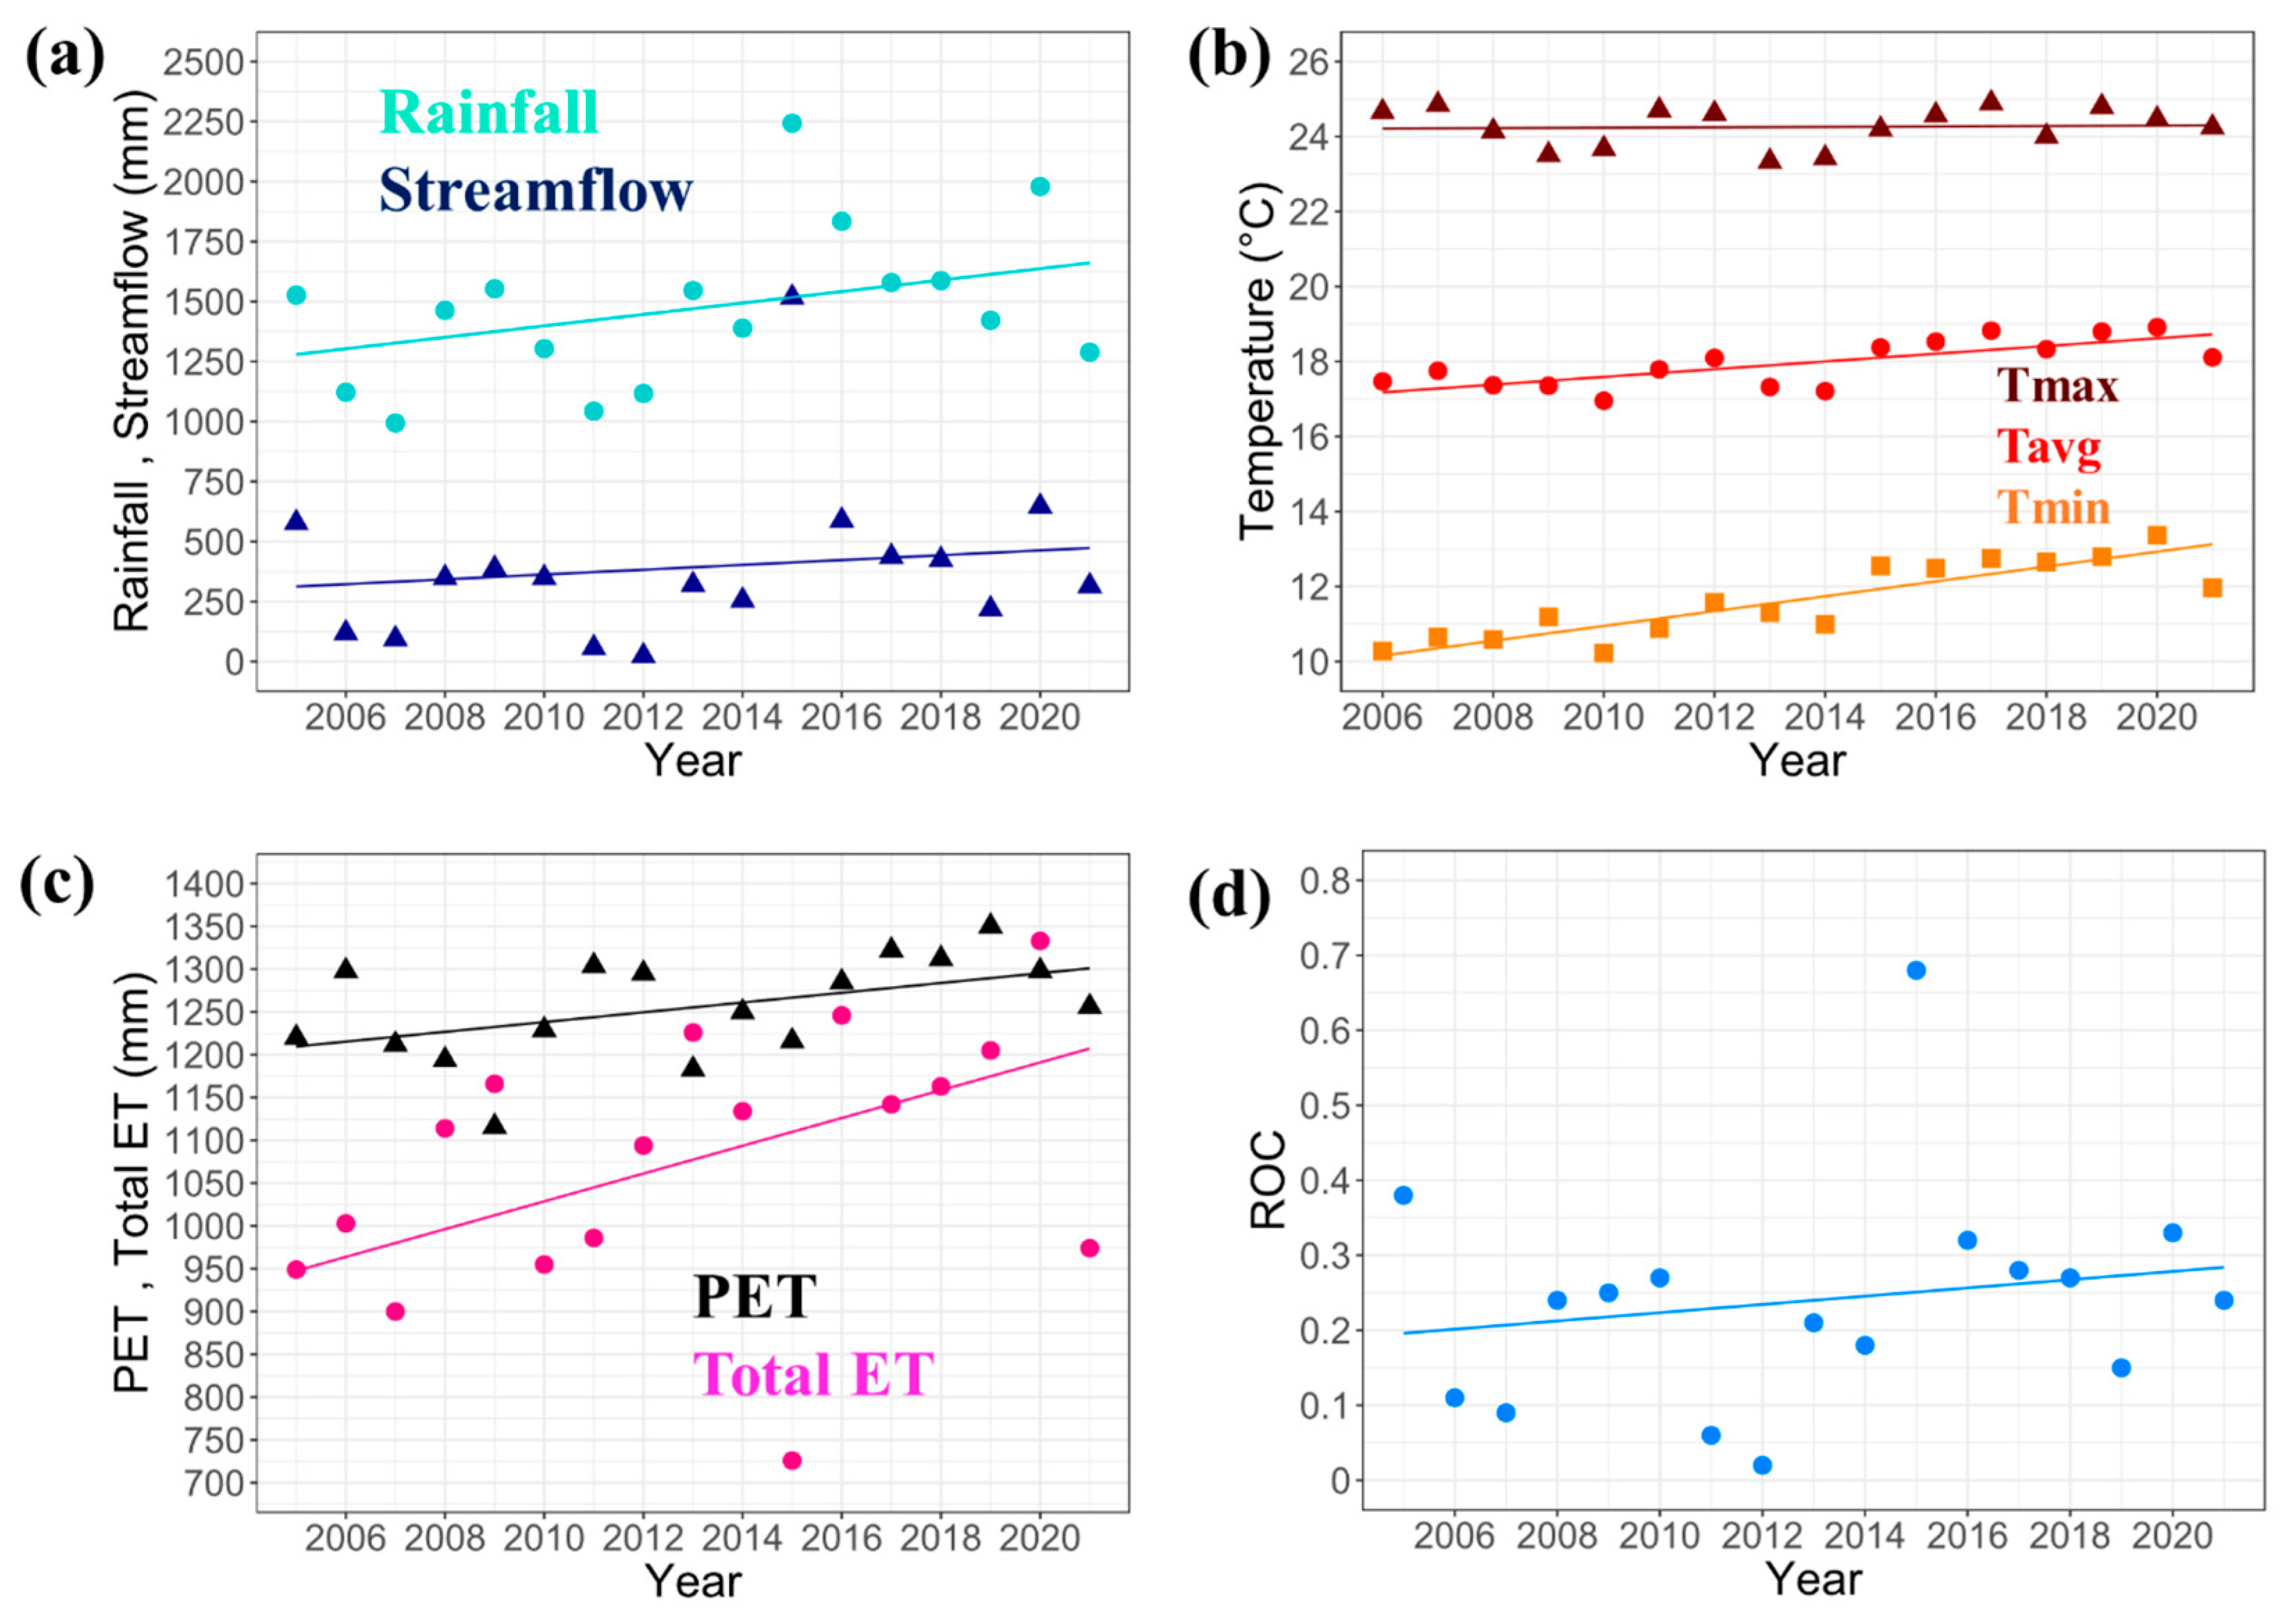
88]. This was mainly attributed to a higher but insignificant rising trend of rainfall (Figure 3a; Table 4 shown below), providing increased recharge (soil moisture), as well as significantly increasing temperature and PET (Figure 3b,c). The annual ET/Rain ratios varied from 0.32 in the wettest year of 2015 to as high as 0.98 in 2012, with an average of 0.76 (same for the water-year; Appendix A Table A2). This value indicates that about 76% of annual rainfall, on average, is lost to ET, assuming no storage and loss to groundwater. This also indicates that, despite abundant moisture from the rainfall in 2015, the available energy of 1216 mm PET might have limited additional ET loss in this year as opposed to the ET loss of 1094 mm in 2012, close to the rainfall amount, with abundant energy of 1295 mm PET (Table 3). The ET/PET ratio varied from 0.74 in the year 2007 with the lowest rainfall to as high as 1.05 (e.g., ET > PET) in 2009, with an average of 0.86 (Table 3). These data show that, given the moisture and energy available to evaporate it, the percentage increase in annual ET loss can likely be higher than the percentage loss as drainage to streamflow.
Annual ET, calculated here as the difference between total rainfall (not throughfall after canopy interception) and streamflow assuming no other losses, can be expected to be higher than the grass-reference PET during wet years due to higher seasonal evaporative losses from rainfall intercepted by the forest canopy [89,90]. In addition, long-term annual ET may be close to the PET of these forested wetlands with relatively abundant moisture [25,32,89,91]. These results are important indicators for understanding pre-development hydrology and stormwater management practices on these forest lands.

4.2. Trends in Annual Rainfall, Temperature, Streamflow, Runoff Coefficient (ROC), PET, and ET

Annual rainfall including the year of 2015 with or without the extreme wet month of October both showed increasing, but not significant (p = 0.11 and p = 0.12, respectively), trends (Figure 3a; Table 4). This is consistent with Mizzell et al. [92] who observed gauges across the State of South Carolina as well as the authors of [27] who also found a slight increase but not a significant change in annual rainfall observed at the Santee Experimental Forest gauge over the period of 1946–2008 [27]. Increasing annual trends (Sens’s slope) are also exhibited by minimum, average, and maximum temperatures (Figure 3b), with the minimum and average showing a statistically significant trend (p-value < 0.05) but not the maximum temperature (p = 0.92) (Table 4). The increasing trend in average temperature is consistent with [27] who also reported a steady increase in temperature at the SEF station during the 1981–2008 and Mizzell et al. [92] who also reported a steady increase in temperatures across the state of SC since the 1970s. Both the estimated p-T-based annual PET and total ET (rainfall–streamflow) show significant increasing trends, with p = 0.003 and p = 0.04, respectively (Table 4). Annual streamflow reflected the temporal pattern of the rainfall, also yielding a non-significant (p = 0.46) trend for the same 17-year period (Figure 3a). The annual ROC, response of streamflow to rainfall, exhibited an increasing, but also non-significant (p = 0.43), linear trend (Figure 3d similar to the streamflow (Figure 3a).
The effects of a significant increase in temperature (Figure 3b) and increasing (p = 0.03) trend in PET (Figure 3c) were likely offset by slightly increasing rainfall (Figure 3a), resulting in non-significant trends in streamflow (p = 0.46) and ROC (p = 0.43). This is similar to Dai et al. [27]’s inference that an increase in temperature will further reduce streamflow due to an increase in ET demands if the increased demand is not offset by additional precipitation. Although some of these results are also consistent with those reported for a long-term pine plantation study site in North Carolina [93], a longer period of data may be needed for a definitive conclusion about the trends at this site. Nonetheless, this information on recent trends for these hydrological variables may be of interest to forest managers, engineers, and land use planners.

4.3. Monthly Rainfall and Streamflow

Measured monthly streamflow responded to corresponding rainfall as shown in Figure 4 for 2005 to 2021 period. The plot clearly indicates that the study period yielded more wet months, exceeding 200 mm rain, starting in 2014 (21 months) compared to the previous 9-year period (15 months), with extended no flow months, particularly in 2006–2007 and 2011–2012. Those four years yielded very low annual ROC values as discussed above. The wet year of 2015 had 726 mm of flow during October due to an indirect effect of Hurricane Joaquin [94]. Other high rainfall months were October 2016 (316 mm; Hurricane Matthew) and August 2020 (429 mm; Hurricane Isaias). Based on the National Weather Service https://www.weather.gov/chs/TChistory (accessed on 20 February 2024), from 1950 to 2018, more tropical cyclones occurred during “cool” El Nino-Southern Oscillation (ENSO) conditions (i.e., La Nina) compared to “warm” ENSO conditions (i.e., El Nino), with major hurricanes during 2019–2021 under La Nina or neutral ENSO conditions https://www.washingtonpost.com/weather/2022/04/27/la-nina-triple-hurricanes-tornadoes/ (accessed on 20 February 2024). Some months with extended no flows occurred in relatively dry years of 2006, 2007, 2011, and 2012 with below average rainfall (Figure 4). The mean monthly ROC of 0.24 is consistent with that of 0.22 obtained for the annual period (Table 1).
On the water year basis (analyzed for 2006–2021), the growing season’s (April–October) ROC of 0.30 was 50% higher than that (0.20) of the dormant season (November–March) despite nearly 71% (1041 mm) of the average total rainfall (1469 mm) being recorded in the growing season (Appendix A Table A3). This was likely due to the growing season average ET of 795 mm, which was 179% higher than the dormant season average (285 mm) with its reduced ET demands. The growing season ET was 73.6% of the average annual ET of 1079 mm, consistent with similar other regional studies [26,90].

4.4. Daily Rainfall Frequency Duration

Daily rainfall frequency duration for the 2005–2021 period (6209 days) is shown in Figure 5a. Daily rainfall exceeded 60 mm and 12.5 mm for 1% (62 days) and 10% of the time, respectively. The data show that 24 h rainfall exceeded 100 mm or more 0.2% of the time (12 days) (Figure 5b), most of which occurred since 2015. Most of these large events were associated with tropical storm events (Figure 5a), with a 24 h total of 271 mm and 471 mm over two days on 3–4 October of 2015 (Hurricane Joaquin), 219 mm on 8 October 2016 (Hurricane Matthew), and 206 mm on 5 September 2019 (Hurricane Dorian). The highest recorded total rain in October of 2015 was consistent with Mizzell et al. [86] who reported that all time precipitation records were set across the coastal plain, with totals ranging from 254 mm to over 660 mm.
The data in Figure 5b show the number of daily precipitation events of various sizes recorded during the study period. The number of storm events is increasing, but not significant, for all rain sizes; the steepest trend was for 26–50 mm size storms, with the largest number (19) in 2015 followed by (17) in 2017.
However, how these storm event rainfall sizes are translated into storm runoff event dynamics are yet to be examined. For example, using the rainfall–runoff data from this site for the 1964–1976 historic period, La Torres Torre [43] found that runoff–rainfall ratios were greater for wet (winter–spring) periods compared to dry (summer-fall) periods and runoff response was related to antecedent soil moisture conditions for wet and dry conditions. The second part of the runoff response was, however, partially studied by Epps et al. [28] for streamflow and direct runoff as response to storm events response linking them also to position of the pre-event water table position. In addition, recently Amatya et al. [52] linked the direct runoff response to pre-event water table and a soil profile saturation parameter by using data from first-order low-gradient coastal catchments including two nested ones from this study site.

4.5. Daily Flow Duration Frequency Curves

Daily flow duration curves are presented in Figure 6 for the 2005–2021 period since regeneration of forest stands 15 years after Hurricane Hugo impacted the area in 1989 [1]. The smaller plot on the right of Figure 6 shows the 1% to 100% exceedance probability behavior for stream flow (discharge). The data showed that the daily flow exceeded zero discharge 75.7% of the time, compared to the value of 79% of the time observed by Amatya and Radecki-Pawlik [95] using 13 years (1964–1976) of historic data from this watershed. However, no significant trend in annual outflows was observed (Figure 3a). The frequency plot also shows that this third-order coastal watershed had no flow for about a quarter of the year, on average. Flows of 10.0 mm day−1 or higher occurred <1.21% of the time, with the highest daily flow of 256.8 mm on 5 October 2015 by 242 mm on 4 October, 205 mm on 6 October, and 116.7 mm on 7 October in 2015, as a result of nearly 500 mm rain during 3–4 October (Figure 5a). Similarly, Hurricane Matthew produced 96.2 mm of flow on 8 October 2016, as a result of a 200 mm storm total. This trend is consistent with other studies reporting potentially higher and more intensive storms and peak flows [27,93]. Flows less than 5.0 mm day−1 occurred 95.7% of time, most of which (59%) occurred during winter (December–February) and spring (March–May) periods. Flows larger than 15.0 mm day−1 were observed mostly during the fall (September-November) season. These results have implications in managing infrastructure for flow for flood resilience as well as in planning for ecological restorations [96,97].
An analysis of daily baseflow computed using an automatic digital filtering technique for the 2006–2021 period provided a mean daily baseflow of 0.22 m3 s−1, which is about 35% of the measured mean daily runoff of 0.634 m3 s−1. Using a baseline separation method on Florida coastal watersheds, La Torre Torres et al. [44] found a baseflow of 23%, on average, of total runoff for 41 storm events analyzed from this study watershed for the 1964–1976 historic period. This average was lower than the 47% reported by Morrison [57] using a different partitioning method for 15 events of the recent 2011–2015 period. These results show a wide variation in base flow estimates depending upon the analyzed period, temporal scale, and method of partitioning.

4.6. Daily Flow Rate Frequencies for Dry, Wet, and Normal Years

Daily flow rate duration curves for two relatively dry (2007, 2012), two relatively normal (2008, 2013), and two relatively wet (2015, 2020) years in the 2006–2021 period are shown in 
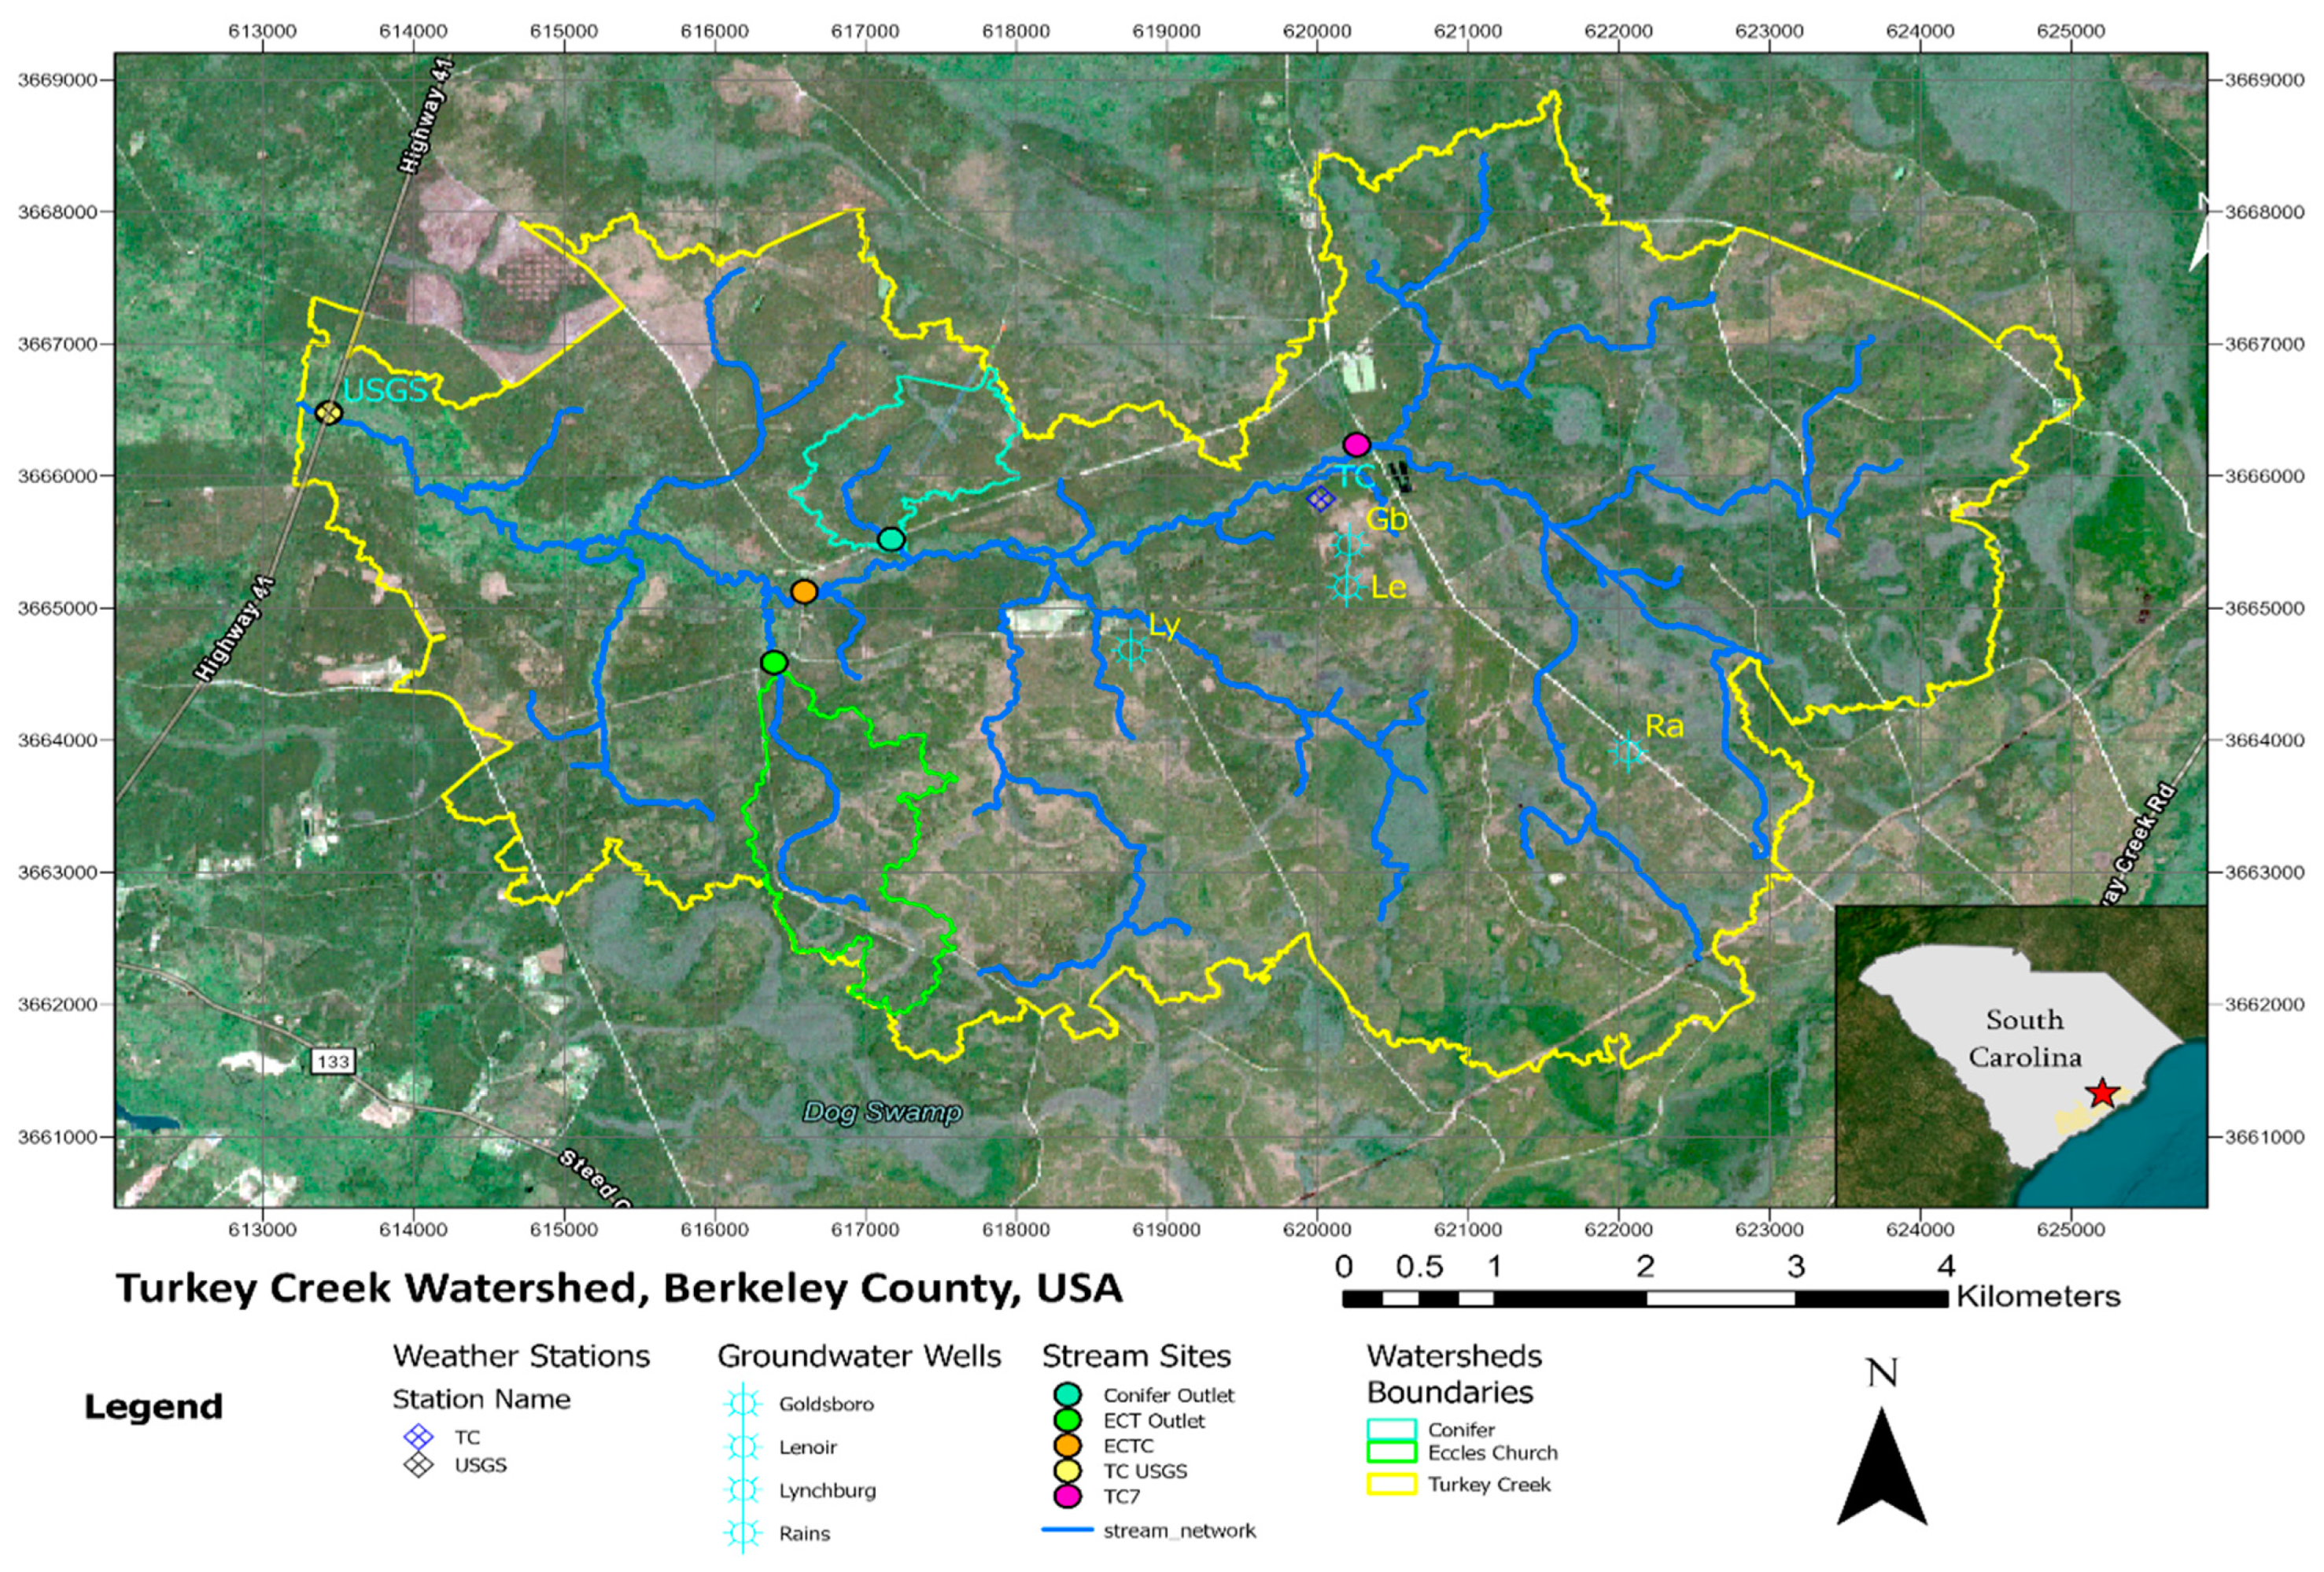
Figure 7. During dry conditions, both curves for 2007 and 2012 are plotted lower compared to curves for normal and wet years. The flow rates for all ranges of frequency are lowest and have small variability compared to the wet and normal years. The small amount of variability in flow during dry years is caused by higher water storage and a lower water table (as shown below under the Water Table section) in forested watersheds with high ET demand and influence of groundwater sources in total streamflow. Moreover, large areas of poorly drained Wahee soil series on the right streambank (Figure 1) may play a dominant role in recharging stream during dry season. Flow during dry years was observed only for about 20 to 60% of analyzed period, which can have an adverse impact on stream ecosystem health potentially due to stressful conditions caused by low oxygen and concentrated chemicals. The wet years yielded the highest low flow rates, compared to normal and dry years, that are important for ecosystems to ensure optimal biodiversity of macroinventerebrates [98,99]. The extremely high flow rates during the wet years were caused by extreme rainfall and very shallow water table elevations causing soil saturation (Figure 5a). Curves for normal years, showing the highest variability in flow, lie between the curves for wet and dry conditions. Compared to dry years, wet years resulted in a lower number of zero flow days (about 10 of 20% of analyzed period), with the rest yielding low flow rates, consistent with Figure 6.

4.7. Peak Discharge versus Rainfall of Various Duration
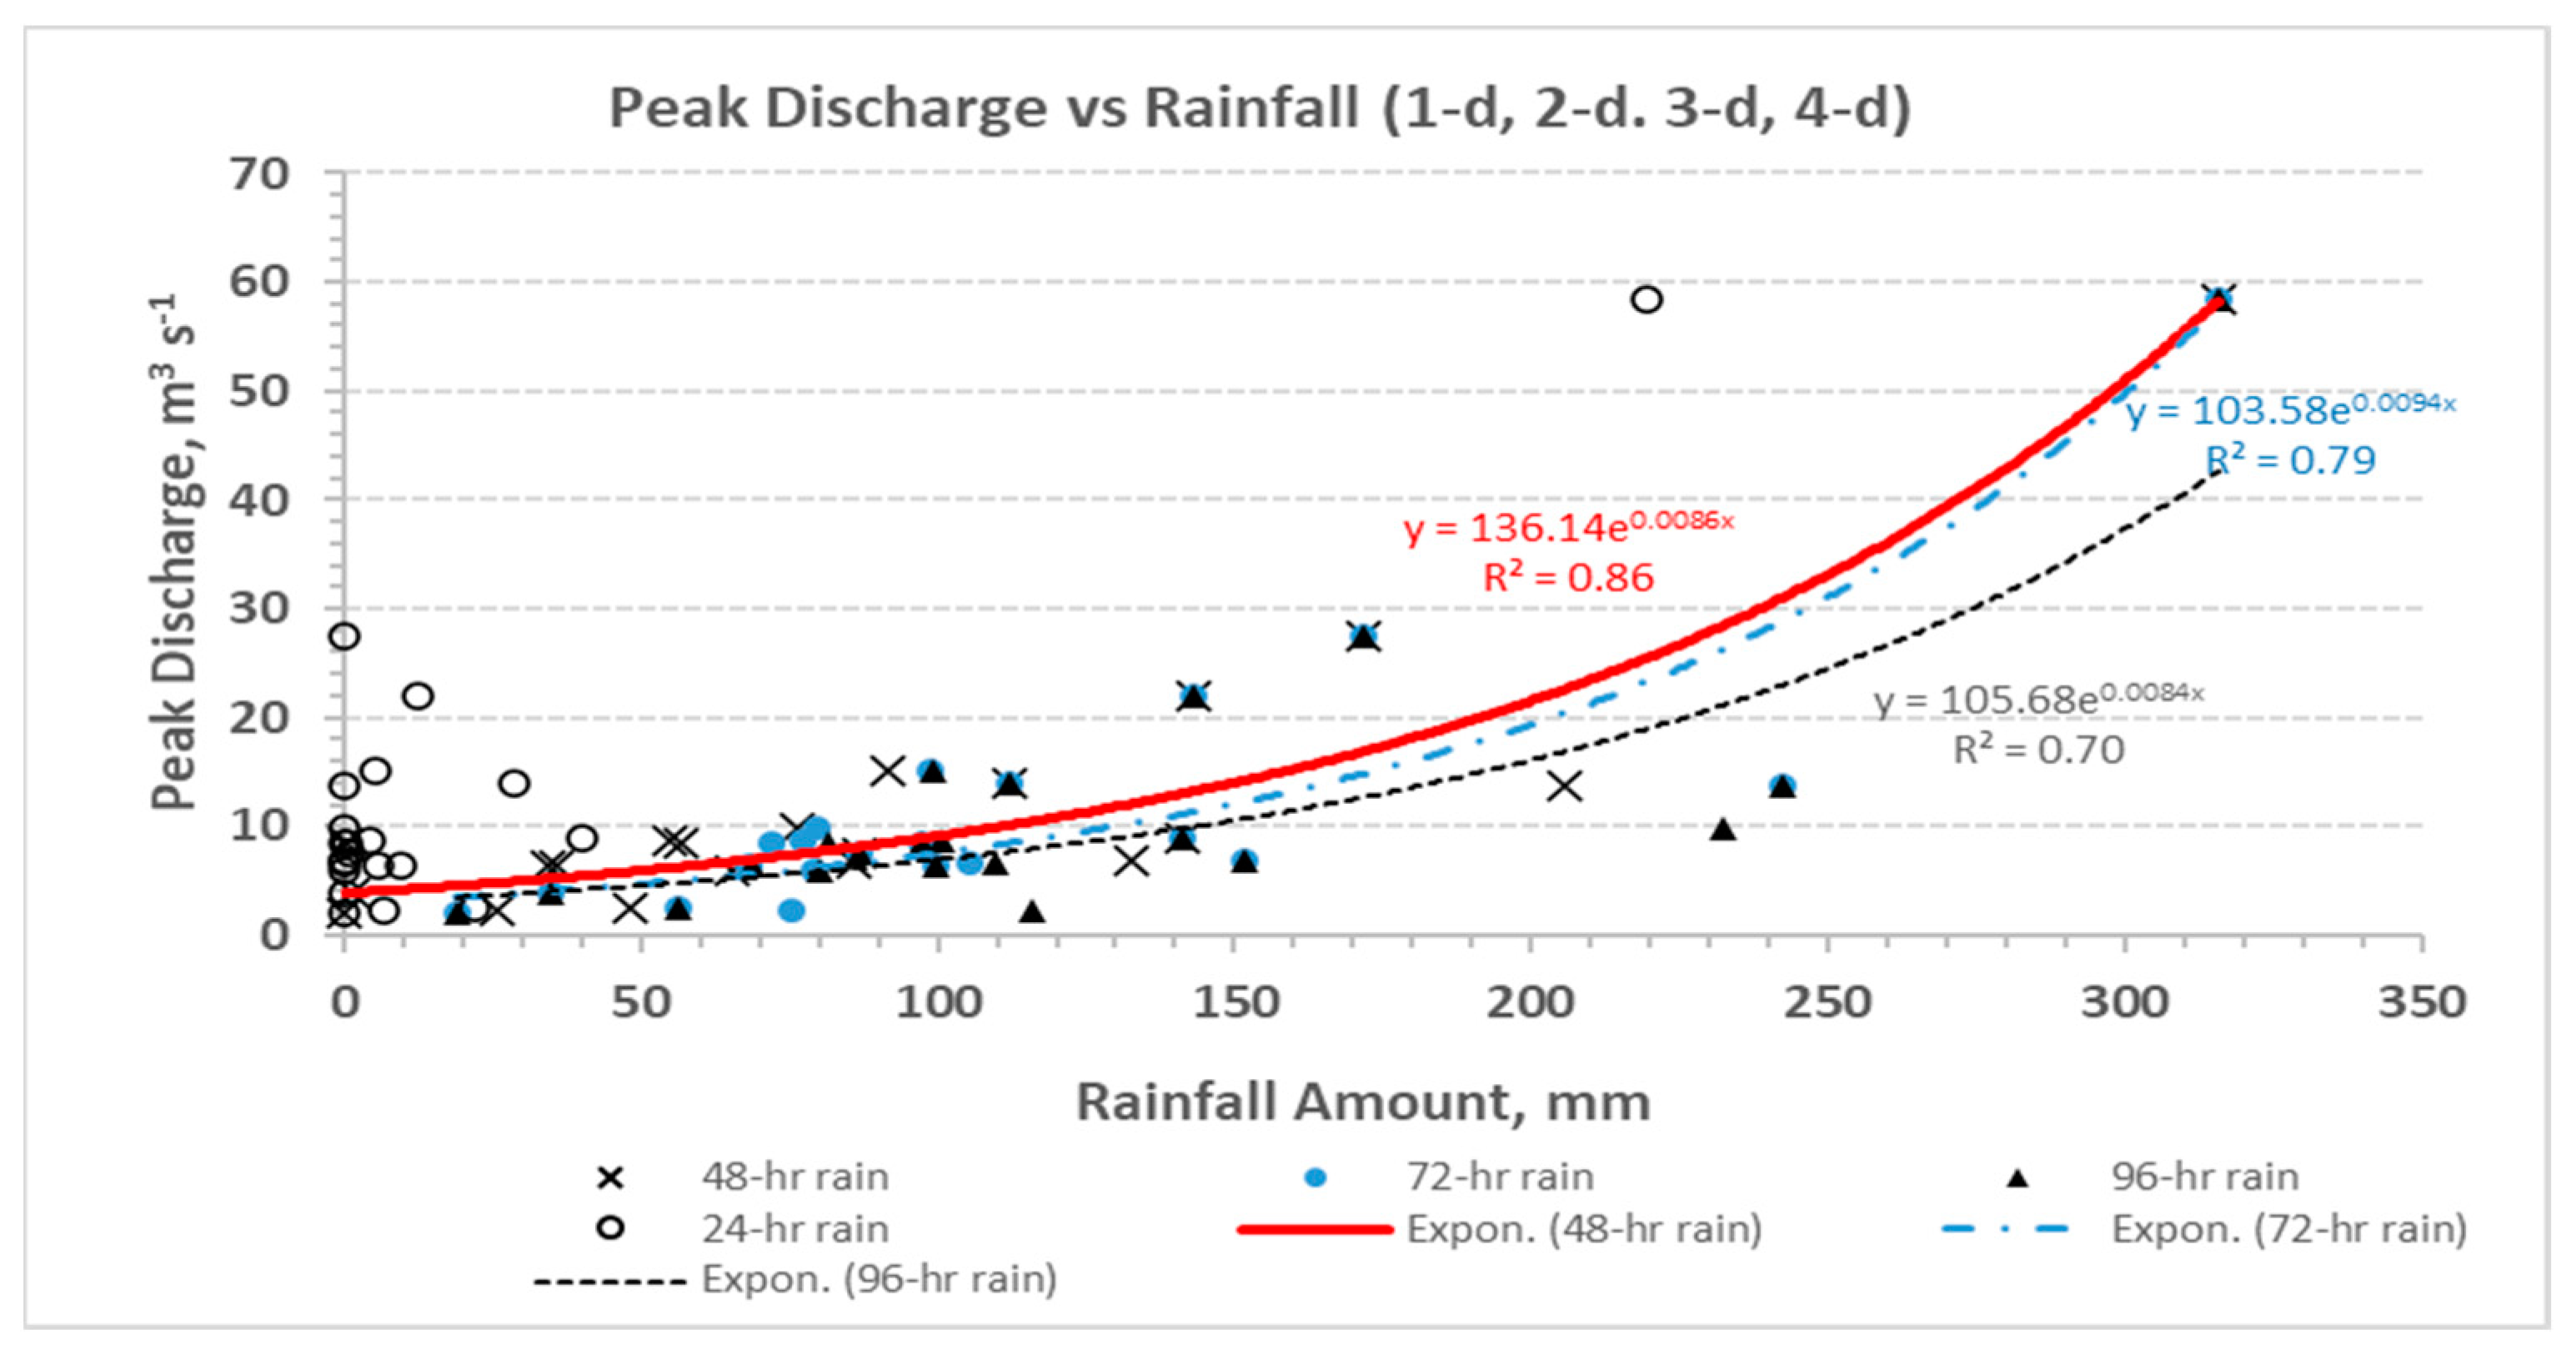
The data in Figure 8 show fitted lines using exponential relationships for observed peak discharges with their corresponding rainfall amounts accumulated over 24, 48, 72, and 96 h durations prior to the peak discharge for the study period, except for the extremely large event of 3–5 October 2015. An exponential increase in runoff for storm events with the water table near or above the surface was reported in earlier studies for nearby watersheds [30,100].
Apparently, the strongest relationship of the peak discharge on this 52 km2 watershed was found for the 48 h duration with the highest R2 of 0.86 followed by the 72 h duration (R2 = 0.79). Coincidentally, the USGS estimated peak discharge of approximately 158 m3 s−1 for that excluded October extreme event (https://nwis.waterdata.usgs.gov/nwis/peak?site_no=02172035&agency_cd=USGS&format=html; accessed on 20 February 2024) was the result of a 48 h rainfall amount exceeding 470 mm. There was no relationship with the 24 h (daily) duration, indicating that the time of concentration (tc) (defined as the time of flow travel from the most remote point on the watershed to its outlet) used for identifying rainfall intensity in event hydrologic models [19,53] for computing flood discharges for water infrastructure design on watersheds of these sizes should exceed 24 h or more. This implies an effect of a larger storm cell size yielding a longer tc as the watershed size increases [19]. The tc of a near 3 h storm duration was estimated for computing design discharges for a much smaller 160 ha WS80 watershed [11,19] adjacent to this study site. Most large peak discharges likely resulted for events when most watershed had saturated/ponded soil conditions or near surface water table (WT) depths (25–27 October 2008; 4–6 October 2015; 8 October 2016; see the following section) possibly contributing to overland surface or shallow subsurface runoff on these low-gradient poorly drained landscape [52].

4.8. Water Table

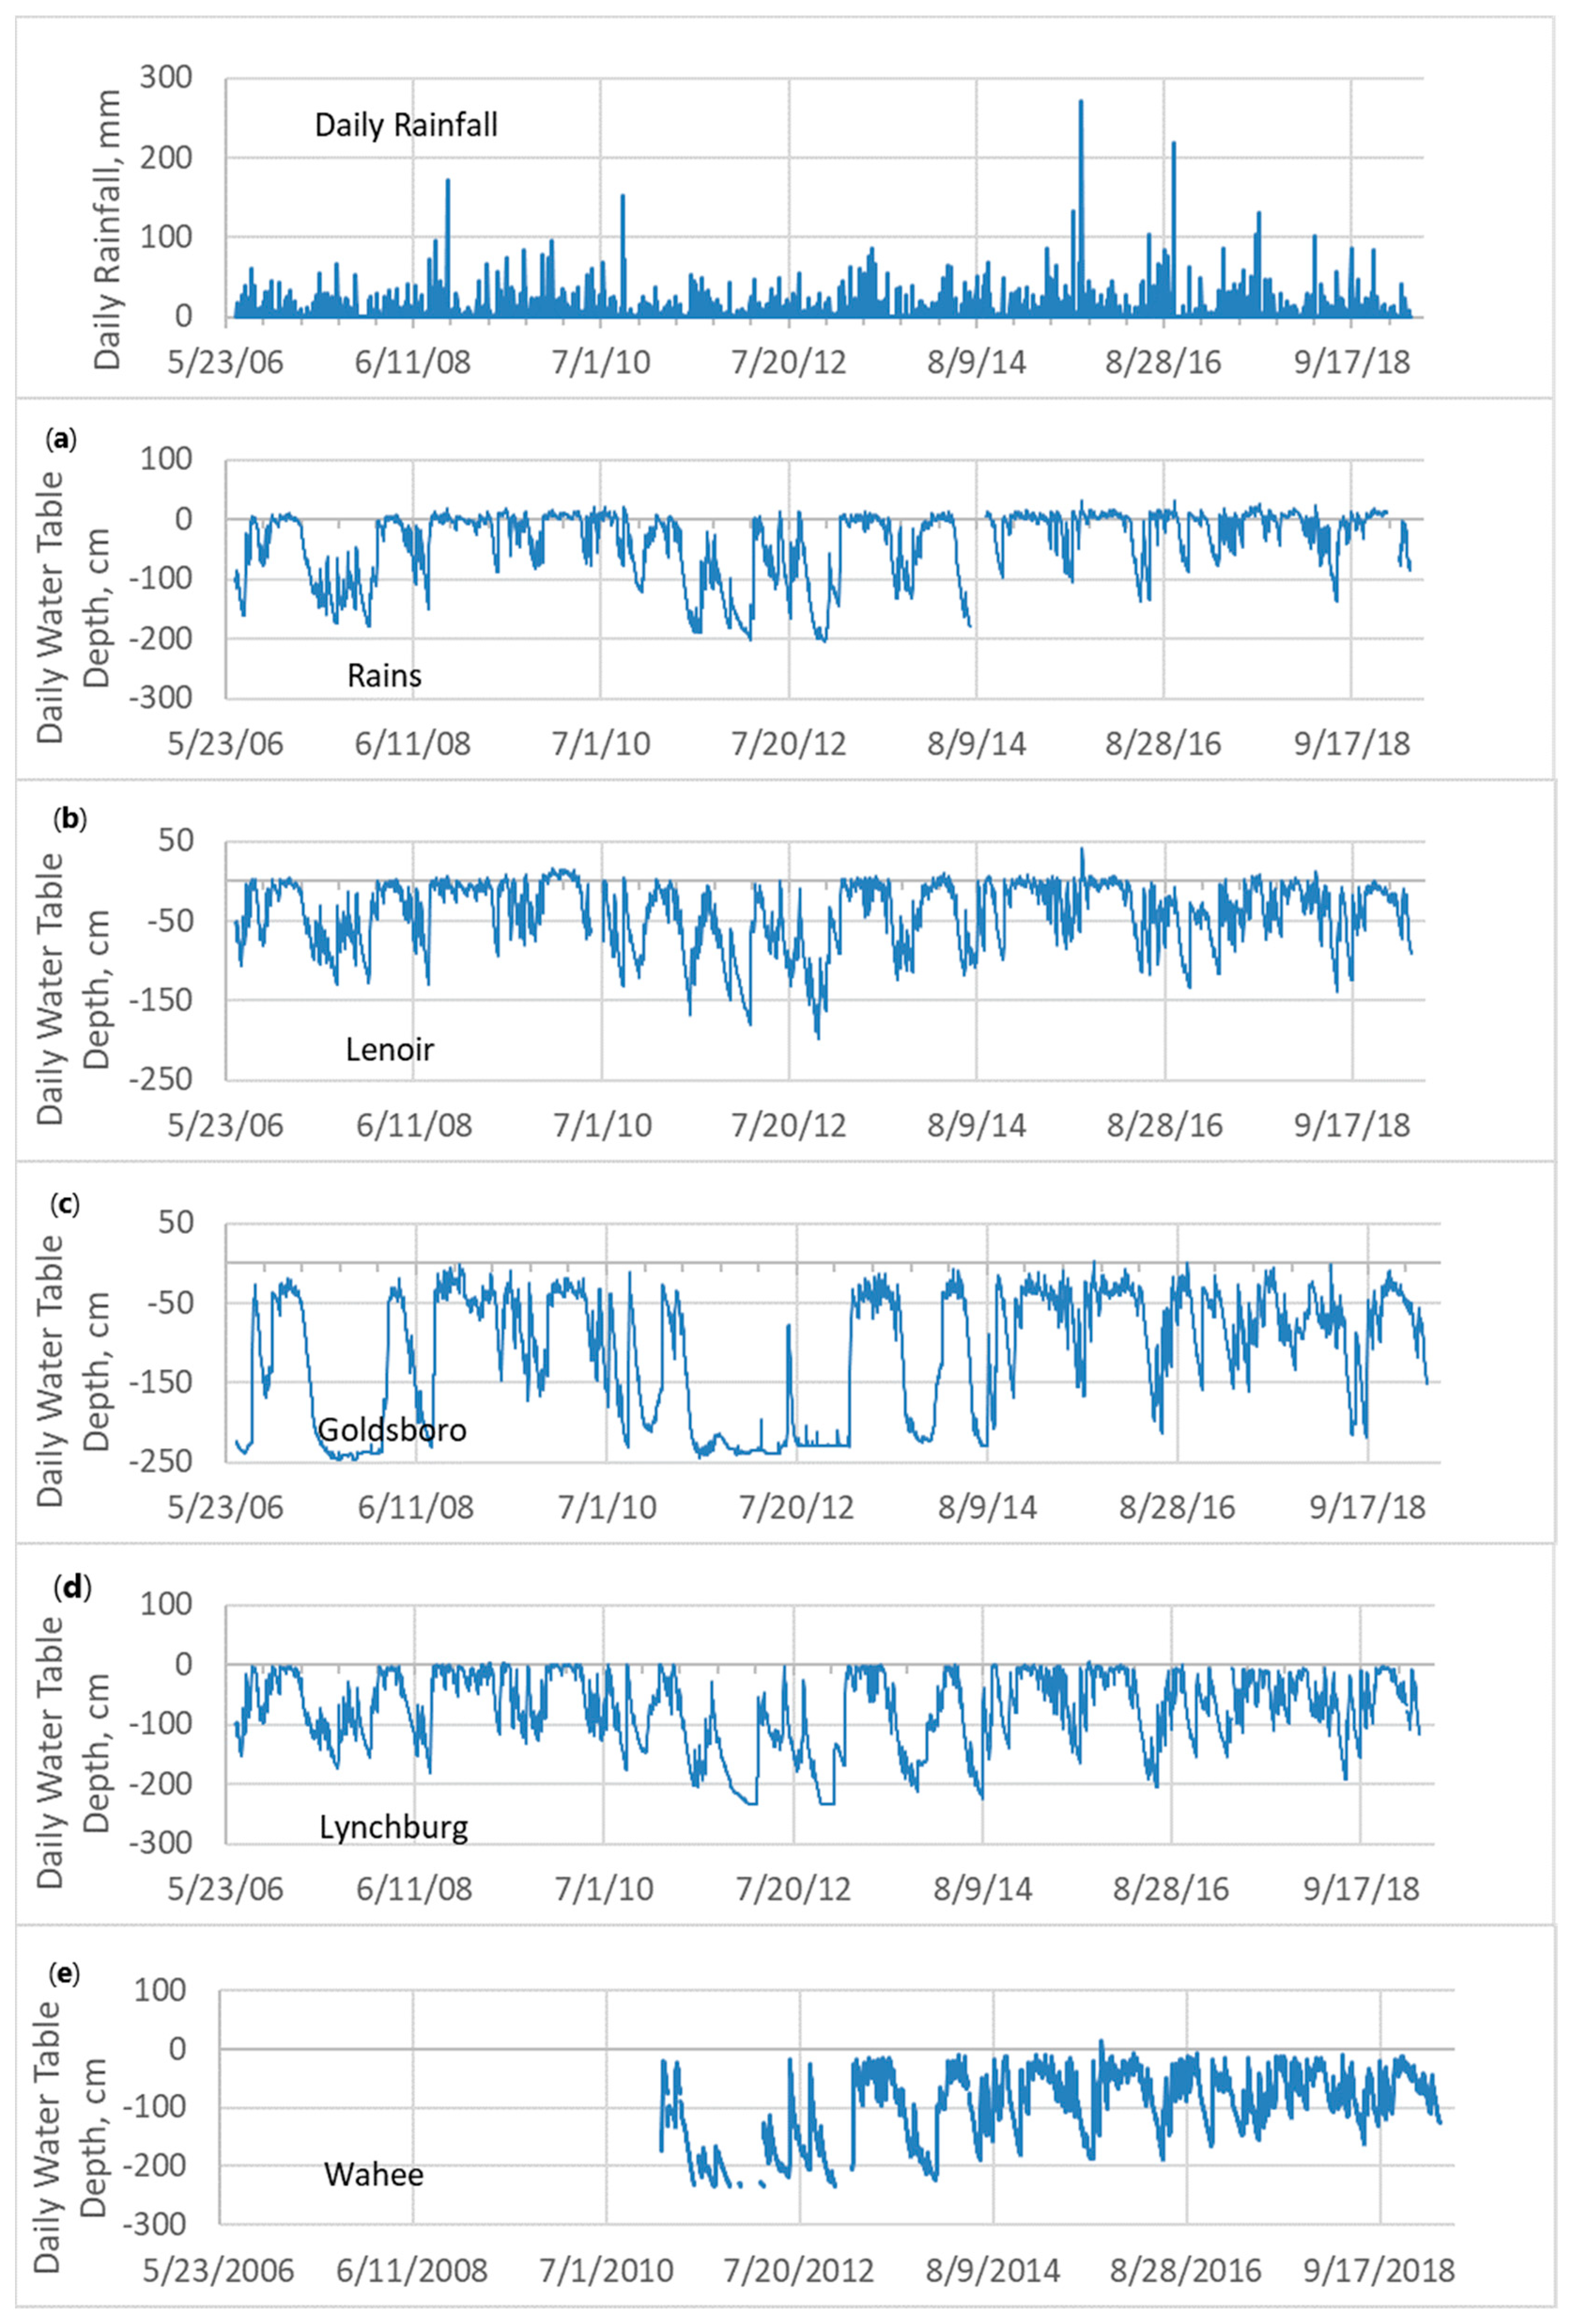
Time series data of WT dynamics from wells in four dominant soil types are presented together with daily rainfall in Figure 9. Earlier work by Amatya et al. [60] using data through 2016 showed no significant trends for daily water table position (p = 0.84 for Rains; =0.28 for Lenoir; 1.00 for Goldsboro, and 0.48 for Lynchburg) at well locations on the study site. No data analysis was carried out for the Wahee well due to limited data.
The mean WT depth for that period varied from about 46 cm for the wells in Rains and Lenoir soils to 122 cm for the well in the well-drained Goldsboro soil, with WT depths of 85 cm for the well in moderately drained Lynchburg soil. A similar pattern for mean water table depths was obtained for the data extended through 2021, with a WT as deep as 2.5 m for the Goldsboro location to even surface ponding of as much as 46 cm for the Lenoir soil during the extreme event of 3–4 October 2015, when all the other wells also responded with a WT at the surface [94]. However, the duration of saturation and ponding depended on the soil type, as shown by Williams and Amatya [101] who referred to soil drainage class and soil taxonomy in their analysis. Any additional rainfall during pre-saturated conditions may result in localized as well as watershed-wide overland runoff [52] with a potential for large peak discharge flooding the area, as observed during the 3–4 October 2015 extreme event discussed above.
In a recent storm-event modeling study, Amatya et al. [52] used data from two catchments within the Turkey Creek watershed, and a third adjacent small watershed (WS80), each <210 ha in area. Modeling results showed that a threshold rainfall amount of 110 mm generated shallow surface runoff in addition to shallow subsurface flow due to saturation-excess conditions. The pre-event water table elevation with a soil saturation coefficient (α) model parameter described the saturated depth necessary to partition the storm event volume into overland surface and subsurface runoff. Variability in event runoff was attributed to seasonal trends in water table elevation fluctuation as regulated by soil moisture and evapotranspiration [28,44,102]. During the extreme rainfall events of 3–4 October 2015, and 8 October 2016, water tables across the watershed responded similarly, rising to the surface with sustained ponding in some well locations, likely contributing to surface runoff and peak discharge. Note that the water table response (Figure 8) shows several saturation-excess periods of varying durations, especially for the more poorly drained sites with Lenoir, Lynchburg, and Rains soil series. The extreme storm event of 3–4 October 2015 created saturated or near-saturated conditions for several months at those sites.
A comparative analysis of groundwater position data in the shallow well (screened from surface to 3 m deep) and deeper subsurface piezometer (screened at 14.5 m deep) at the same location as the water table well in the Lenoir soil (upper Turkey Creek) (Figure 10) provided an average recharge estimate to the surficial aquifer of 114 ± 60 mm y−1 [51]. The main factor influencing recharge estimates was antecedent water table level, which in turn was influenced by landscape position and soil texture. The shallow water table conditions at this site support a large range of natural wetlands and create management challenges across the region [103]. Modest changes in the position of the water table can lead to either groundwater flooding and concomitant management challenges for silvicultural activities, or to ecosystem stresses related to dry conditions in wetlands during times of below-normal precipitation or because of groundwater withdrawal.
Plots for both the water table and piezometric data in Figure 10 indicate a possible change in the trend or a break point somewhere between 2010 and 2012. Results of Pettitt’s test for change detection for the significance level α of 0.05. are presented in Table 5.
Analysis of Pettitt’s test using a critical value depends on the number of observations (77 and 79 values for water table and piezometer water depth in this case) in the time-series and the assumed significant level. Based on Jaiswal et al. [104], the critical values analyzed for the 0.05 significance level were determined as 459 and 478 for the water table and piezometer data, respectively. The analysis indicated that the break point could have occurred on 9 December 2012 or 1 April 2010. However, the computed values of U for the Pettitt test were lower than the Ucrit, indicating a lack of trend and lack of break-change points in both the water table and piezometric data.

4.9. Precipitation Intensity–Duration–Frequencies and Design Flood Frequencies

Compared to the mean onsite 24 h and 48 h precipitation depths for the 2005–2021 period, the NOAA-Atlas14 values for the 1893–2002 period considerably underestimate the precipitation for the 10-, 25-, 50-, and 100-year return intervals for the same rain-gauge location (Figure 11a,b).
As expected, the single on-site precipitation depths exhibit a wider range of uncertainty depicted by the larger confidence intervals mainly due to their relatively brief data record period. We did not use data from some other on-site gauges within its vicinity but highly recommend that this be explored in future. Similar underestimates, by 10–60% for durations ≥2 h, were observed by [19] with errors increasing for longer return intervals when compared to estimates using data from the adjacent WS80 watershed. Based on these results, it would likely be useful to re-evaluate the hydro-geomorphologic risk analysis of culverts located within this study site, that were noted by [20] as being vulnerable to NOAA-based 100 yr 30 min precipitation intensities.
The data in Figure 12 show that the 2-, 5-, and 10-year design flow rates estimated by the regional USGS regression equations for the coastal plain region [105] seem to match with those obtained using the Log Pearson Type III (LPIII) fitted flow rates for the on-site observed annual maximum peak discharge data.
The USGS regression equation derived flow rates for 25-year and longer return intervals seem to be underestimated, especially for the 100-year return interval compared to the on-site data. Like with the precipitation intensities discussed above, the larger uncertainty bands for the on-site LPIII estimates (Figure 12) are likely due to use of the shorter recording period than the USGS methods.
In an earlier study using 13 years (1964–1976) of historic data with just the Pearson Type III model, Amatya and Radecki-Pawlik [95] reported similar design discharges to those reported by the USGS method [84] for return periods of ≤10-years but lower values, with underpredictions by as much as 29%, than the USGS ones for the higher return periods (Figure 12). Results from the recent 2005–2021 period show much larger mean design flow rates than those obtained from the current USGS method updated by Feaster et al. [105], which suggests increasing frequencies and sizes of larger peak discharges (Figure 6 and Figure 8), consistent with related increases in PIs and sizes (Figure 5 and Figure 11). These results emphasize that planners and designers should take precautionary measures while designing climate resilient stormwater and road drainage infrastructure using the published USGS regional regression equations on such watersheds.

5. Summary and Conclusions

This article described 17 years’ worth (2005–2021) of hydro-meteorological data in the Turkey Creek watershed, a 52 km2 area within the Francis Marion National Forest in coastal South Carolina. Conditions during the period of study ranged from very dry to extremely wet. Consistent with other studies, annual mean and annual minimum air temperature, observed annual precipitation, streamflow, runoff coefficient, and ET (as the difference between rainfall and streamflow) all showed increases, but with considerable variability and no statistically significant trends. Both the mean annual rainfall (1470 mm) and streamflow (362 mm) were larger than those during the 1964–1976 period with 1320 mm rainfall and 337 mm of streamflow. These findings on mean annual streamflow are similar (391 mm) to those reported for an adjacent smaller watershed (310–400 mm) with similar management and for relatively less forested coastal plain watersheds in Georgia reported by Bosch et al. [106]. Although annual rainfall and their daily intensities and frequencies as well as storm events were shown to be increasing with increased flooding potential, the watershed did not have flow approximately 25% of time, similar to the 22% found during the historic period. Either increased variability in the recent summer–fall precipitation and/or management practices may explain that small difference. Some rainfall differences were observed from June to September, months characterized by high intensity, short duration storms as reported earlier by Haley [40] and La Torre Torres [43]. These observations may have implications in managing streamflow for ecological restorations in the face of rising temperatures observed in this study. Daily peak discharge was highly correlated to 48 h duration rainfall, suggesting the effects of storm sizes and possibly the storage on flooding in the watershed. In addition, the on-site rainfall intensity–duration–frequencies as well as the peak discharges for the frequencies in the ≥25-year return intervals were substantially higher than the published NOAA data, the USGS regional equations, and the historic data-based flood frequencies for this location. One reason is both the published NOAA PIDFs [78] and the USGS design discharge data [84], which uses the NOAA PIDFs, extend only up to the year 2013 in contrast with this on-site data from the year for 2005–2021. These frequencies, developed using <30-years of on-site data, will be useful for stormwater infrastructure design, post-event assessments, and mitigation of environmental impacts [107]; however, the results should be cautiously interpreted as minimum conditions.
Annual ET was a significant component of the water budget; however, the assumed negligible change in storage was contradicted by the on-site water table data. For example, in 2011, the water table depth (WTD) was 45 cm at the beginning of January and ended at 166 cm at the end of December in the Rains soil site (Figure 8), indicating a large soil water deficit. Thus, the actual ET in 2011 was likely more than the estimated ET of 986 mm (Table 3) but less than the PET of 1304 mm. In 2012, WTD ended in December at 69 cm (Figure 8), indicating a large gain in soil water storage, in which case the estimated ET of 1094 mm may also be uncertain. In other words, the assumption of negligible change in storage on a year-to-year basis, particularly at the calendar year interval, may result in large uncertainties in ET estimates (Table 1; Appendix A Figure A2). The potential implications of this are understanding vegetation productivity, water availability and demand, local hydrometeorology, closure of the surface energy budget [108], and several other roles that ET plays [109]. The recent installations of eddy covariance-based flux towers accompanied by new soil moisture sensors on the adjacent paired watershed at Santee Experimental Forest should provide more accurate ET estimates including its components of transpiration and understory evaporation as well as sub-annual ET estimates for these coastal forests.

6. Future Directions

Studies on precipitation extremes (very wet and very dry) in natural ecosystems of similar watersheds are limited, but there is a pressing need to identify (1) how these events affect ecosystem processes and functions for sustainable habitat management and restoration, and (2) how scientists can improve predictions. For example, increased precipitation giving rise to elevated water table and increased soil moisture may impact soil water processes while encouraging invasive plant infestations [110], thus reducing biodiversity and limiting recreational access. Extreme dry conditions may also result in plant infestations [111], reduce base flows into groundwater-supported ecosystems such as aquatic habitats [112], and increase the frequency and severity of wildfire [113]. Hydrology data (particularly, event runoff ratios, runoff components, and evapotranspiration) can be used as “reference” information for the “pre-development” scenario design/analysis on watersheds with similar characteristics. Ongoing studies on carbon and greenhouse gas emission rates in tidally mediated freshwater forested riparian wetlands [55] are focused on whole-scale ecosystem shifts associated with sea level rise and climate change.
Resource issues are becoming more complex in forested watersheds like those in the coastal plain region of the southeastern U.S that provide a multitude of ecosystem services. However, these forests are increasingly facing various types of disturbances, with the potential to affect hydrology and water quality of streams draining these systems. For example, Francis Marion National Forest acts as a buffer to urbanization from the surrounding Charleston metropolitan area [50]. Urban development is intensifying and advancing towards the Francis Marion National Forest boundary as shown in Appendix A Figure A3. However, within the national forest boundary, the land use is predominately forest, with insignificant changes in land use type [114] based on an analysis of the National Land Cover Database from 2001–2016 [115]. Additionally, the forest canopy within Francis Marion National Forest, and particularly the Turkey Creek Watershed, is highly stable compared to the surrounding unprotected forested area as shown in Appendix A Figure A4 [116]. Hydrological studies of the Turkey Creek watershed, therefore, provide critical “pre-development” reference conditions for the increasingly urbanizing and dynamic surrounding landscape.
Over the past decade, increased rainfall has led to water surplus conditions, reflected in the shallow water table conditions and longer duration of saturation-excess runoff conditions. This leads to longer hydroperiods in depression and floodplain wetlands, supporting those ecosystems which had previously endured multiple droughts during the 2000–2015 period. However, saturated soils create challenges, such as disrupted timber and road management and erosion and increased runoff to receiving waterways [19]. Climate change impacts in the region, such as sea level rise and related saltwater intrusion (both in surface water and groundwater) are affecting the overall drainage of watersheds and placing stress on drinking water resources [117,118]. The Gordon Aquifer (hydrogeologically equivalent to the Floridan Aquifer) is locally confined by a low permeability unit in the form of the Parkers Ferry Formation in the western portion of the Turkey Creek watershed; this unit is absent beneath the eastern half of the watershed. Previous research showed an average of about 50–175 mm per year of recharge from analysis of groundwater level data in the eastern section [103]. Forested watersheds such as Turkey Creek serve as an important water reservoir and provide services to groundwater-dependent ecosystems [119].
Relatively long-term studies inform decisions in rapidly urbanizing areas affected by similar environmental conditions. Multi-site studies may be warranted to accurately understand these complex forest systems in the face of changing land cover/use and climate. Multi-site studies can clarify the linkage between meteorological conditions and localized extreme storm events driven by atmospheric rivers, and extratropical cyclones, which are common phenomena in this region [120]. Adequate resources are critical for securing high quality long-term data from successful multi-purpose monitoring like this one for proper management of land and water in an integrated, sustainable way [15,21]. Because long-term monitoring is often resource restricted, new data-driven models of varying complexities and scales could be developed and tested [121] and existing ecohydrological models like SWAT [41,122] and others could be improved with watershed data to understand processes and evaluate impacts of various management treatments, including large-scale forest restoration (i.e., longleaf pine [123]).

Author Contributions

Conceptualization, D.M.A.; methodology, D.M.A., S.M., C.A.H., A.W. and D.M.; software, S.M. A.W. and D.M.; validation, K.D.E., S.M., A.W. and D.M.; formal analysis, D.M.A., T.J.C., A.W., D.M. and K.D.E.; investigation, D.M.A. and T.J.C.; investigation, D.M.A.; resources, C.C.T.; data curation, D.M.A., S.M. and C.A.H.; writing—original draft, D.M.A., S.M., A.W., D.M. and K.D.E.; writing—review & editing, D.M.A., T.J.C., C.C.T. and A.W.; visualization, S.M.; supervision, D.M.A.; project administration, D.M.A.; funding acquisition, C.C.T.. All authors have read and agreed to the published version of the manuscript.

Funding

A part of this research was funded to the College of Charleston by the US Department of Agriculture, Forest Service Southern Research Station, federal grant #20-CA-11330180-013.

Data Availability Statement

Data used in this article can be found and downloaded from these links: https://doi.org/10.2737/RDS-2022-0027 and https://doi.org/10.1002/hyp.14549.

Acknowledgments

The authors would like acknowledge Julie Arnold, Biological Technician at USDA Forest Service, Santee Experimental Forest, Alton Gaskins and Andy Macyeka at Francis Marion & Sumter National Forest, and US Geological Survey for their various levels of support with data and information related to the study site. The authors sincerely thank Peter Caldwell at Forest Service Southern Research Station and David Shelley, formerly with National Park Service Congaree National Park, SC for their constructive suggestions and comments that helped improve the manuscript. We also thank Norm Levine and Landon Knapp of the Lowcountry Hazards Center at the College of Charleston for their efforts creating the location map.

Conflicts of Interest

The authors declare no conflicts of interest.

Appendix A

Figure A1. Land use map for the Turkey Creek watershed (WS-78; red boundary) (Source: USGS, USDA, Census, SCDNR) (After Morrison, [57]).
Hydrology 11 00031 g0a1
Table A1. Treatment areas and percentage of total watershed area for 2005–2021 period.
Hazardous Fuel Treatment Clearcut/Thinning
YearAcresHectares% of WatershedAcresHectares% of Watershed
20053122126424.1
20069660391174.65221.10.40
200711,545467489.2
20087624308758.9
20099538386273.75221.10.40
20108425341165.1
20115481221942.36124.70.47
201214,6165917112.916968.41.31
2013241397718.6382154.72.95
20147986323361.7
20159603897.48534.40.66
201611,024446385.216968.41.31
20175500222742.5
20182777112421.5
20196470261950.0275111.32.12
20203006121723.24417.80.34
20212973120423.07530.40.58
Figure A2. Soils map for the Turkey Creek watershed (WS-78; red boundary). (Source: STATSGO, NRCS, USDA) (After Morrison [57]).
Hydrology 11 00031 g0a2
Table A2. Annual, using Water Year (April–March), measured rainfall and streamflow, estimated Priestley-Taylor (P-T) potential evapotranspiration (PET), and calculated runoff coefficient (ROC), ET, ET/P-T PET, and ET/Rain values for 2005–2021.
YearRainfall, mmP-T PET, mmFlow, mmROCET, mmET/P-T PETET/Rainfall
2005142512195740.48510.70.6
2006115212971470.1310050.770.87
200710701217470.0410230.840.96
2008138611583460.2510400.90.75
2009172711275900.3411371.010.66
2010119812391460.1210520.850.88
201110331335190.0210140.760.98
201212101274910.0811190.880.92
2013153711693260.2112111.040.79
2014145311933650.2510880.910.75
20152214125215120.687020.560.32
2016166813044380.2612300.940.74
2017161113064570.2811540.880.72
2018152013144060.2711140.850.73
2019161213533490.2212630.930.78
2020201812876830.3413351.040.66
2021114512711320.1210130.80.88
Average146912543900.2410790.860.76
Std dev327653500.161510.120.16
COV0.220.050.90.670.140.140.21
Table A3. Seasonal mean measured rainfall, streamflow, and calculated runoff coefficient (ROC), and evapotranspiration (ET) using water year (April–March) data for 2005–2021. GS = Growing Season (April-October) and DS = Dormant Season (November-March).
Water YearRainfall (GS)Rainfall (DS)Flow (GS)Flow (DS)ET (GS)ET (DS)ROC (GS)ROC (DS)
mmmmmmmmmmmmmmmm
200510853404301446551960.400.42
2006791360261217662390.030.34
20077213481477213020.000.13
20081119266258888621780.230.33
200910047241544368492880.150.60
2010862336100467622900.120.14
20117163161457023110.020.02
201271749217747004190.020.15
20131053485245818074040.230.17
20149425111592057833060.170.40
2015166554912162964492530.730.54
201613852833845410012300.280.19
20171323288382749412130.290.26
201810155061672398482660.160.47
2019995617932559023620.090.41
2020145756041127210462890.280.48
202184330212577182950.150.02
Mean10414282461447952850.200.30
Std dev277137289121141660.180.18
COV0.270.321.170.840.180.230.900.60
Figure A3. Change in development map for the Charleston Metropolitan Area, Francis Marion National Forest (black boundary), and Turkey Creek watershed (WS-78; yellow boundary) in South Carolina. Based on analysis of the National Land Cover Database 2001 and 2016 land cover layers. [115].
Hydrology 11 00031 g0a3
Figure A4. Change in forest canopy phenology map for Francis Marion National Forest and Turkey Creek watershed (WS-78; yellow boundary) in South Carolina. Map shows a gross measure of the instability of landscape dynamics from 2008–2017 based on change in phenological composition and characteristics [116]. (Source: LanDAT Geospatial Data. 2019. USDA Forest Service. Available online: https://landat.org/maps; accessed on 4 October, 2021).
Hydrology 11 00031 g0a4

References

  1. Jayakaran, A.; Williams, T.M.; Ssegane, H.S.; Amatya, D.M.; Song, B.; Trettin, C.C. Hurricane impacts on a pair of coastal forested watersheds: Implications of selective hurricane damage to forest structure and streamflow dynamics. Hydrol. Earth Syst. Sci. 2014, 18, 1151–1164. [Google Scholar] [CrossRef]
  2. Kramer, M.G. Our Built and Natural Environments: A Technical Review of the Interactions Among Land Use, Transportation, and Environmental Quality; Environmental Protection Agency: Washington, DC, USA, 2013; 148p. [Google Scholar]
  3. Emmett, K. Changing Forest Dynamics from Yellowstone to the Great Smoky Mountains. In Proceedings of the Forest, Climate and Society Seminar Series, the French National Institute for Agriculture, Food, and the Environment (INRAE) Office, Champenoux, France, 19 September 2022. [Google Scholar]
  4. Schleeweis, K.; Moisen, G.G.; Toney, C.; Schroeder, T.A.; Huang, C.; Freeman, E.A.; Goward, S.N.; Dungan, J.L. NAFD-ATT Forest Canopy Cover Loss from Landsat, CONUS, 1986–2010; ORNL DAAC: Oak Ridge, TN, USA, 2020. [Google Scholar] [CrossRef]
  5. O’Driscoll, M.; Clinton, S.; Jefferson, A.; Manda, A.; McMillan, S. Urbanization effects on watershed hydrology and in-stream processes in the southern United States. Water 2010, 2, 605–648. [Google Scholar] [CrossRef]
  6. Day, C.A.; Bremer, K.A. Modeling urban hydrology: A comparison of new urbanist and traditional neighborhood design surface runoff. Int. J. Geosci. 2013, 4, 891. [Google Scholar] [CrossRef]
  7. Zheng, Q.; Hao, L.; Huang, X.; Sun, L.; Sun, G. Effects of Urbanization on Watershed Evapotranspiration and Its Components in Southern China. Water 2020, 12, 645. [Google Scholar] [CrossRef]
  8. Schueler, T. The importance of imperviousness. Watershed Prot. Tech. 1994, 1, 100–111. [Google Scholar]
  9. Nagy, R.C.; Lockaby, B.G. Urbanization in the Southeastern United States: Socioeconomic forces and ecological responses along an urban-rural gradient. Urban Ecosyst. 2010, 14, 71–86. [Google Scholar] [CrossRef]
  10. Weir, D.N.; Greis, J.G. The Southern Forest Futures Project: Summary Report; General Technical Report SRS-168; U.S. Department of Agriculture Forest Service, Southern Research Station: Asheville, NC, USA, 2012; 54p. [Google Scholar]
  11. Corbin, J.; Morgan, H.; Patrohay, E.; Williams, T.; Amatya, D.M.; Darnault, C. Hydrologic Modeling of Development Effect Scenarios on a Relatively Undisturbed Coastal Forest Watershed. J. S. C. Water Resour. 2021, 8, 39–50. [Google Scholar]
  12. Amatya, D.M.; Trettin, C.C. Long-term ecohydrologic monitoring: A case study from the Santee Experimental Forest, South Carolina. J. S. C. Water Resour. 2019, 6, 46–55. [Google Scholar] [CrossRef]
  13. Alexander, R.B.; Boyer, E.W.; Smith, R.A.; Schwartz, G.E.; Moore, R.B. The role of headwater streams in downstream water quality. J. Am. Water Resour. Assoc. 2007, 43, 41–59. [Google Scholar] [CrossRef]
  14. Moran, M.S.; Peters, D.P.C.; McClaran, M.P.; Nichols, M.H.; Adams, M.B. Long-term data collection at USDA experimental sites for studies of ecohydrology. Ecohydrology 2008, 1, 377–393. [Google Scholar] [CrossRef]
  15. Tetzlaff, D.; Carey, S.K.; McNamara, J.P.; Laudon, H.; Soulsby, C. The essential value of long-term experimental data for hydrology and water management. Water Resour. Res. 2017, 53, 2598–2604. [Google Scholar] [CrossRef]
  16. Bosch, D.D.; Sheridan, J.M.; Lowrence, R.R.; Hubbard, R.K.; Strickland, T.C.; Feyereisen, G.W.; Sullivan, D.G. Little River Experimental Watershed Database. Water Resour. Res. 2007, 43, W09470. [Google Scholar] [CrossRef]
  17. Gibbins, C.; Vericat, D.; Batalla, R.J. When is stream invertebrate drift catastrophic? The role of hydraulics and sediment transport in initiating drift during flood events. Freshw. Biol. 2007, 52, 2369–2384. [Google Scholar] [CrossRef]
  18. Wyżga, B.; Amirowicz, A.; Radecki-Pawlik, A.; Zawiejska, J. Hydromorphological conditions, potential fish habitats and the fish community in a mountain river subjected to variable human impacts, the Czarny Dunajec, Polish Carpathians. River Res. Appl. 2009, 5, 517–536. [Google Scholar] [CrossRef]
  19. Amatya, D.M.; Tian, S.; Marion, D.A.; Caldwell, P.; Laseter, S.; Youssef, M.A.; Grace, J.M.; Chescheir, G.M.; Panda, S.; Ouyang, Y.; et al. Estimates of Precipitation IDF Curves and Design Discharges for Road-Crossing Drainage Structures: Case Study in Four Small Forested Watersheds in the Southeastern, U.S. J. Hydrol. Eng. 2021, 26, 05021004. [Google Scholar] [CrossRef]
  20. Panda, S.S.; Amatya, D.M.; Grace, J.M.; Caldwell, P.; Marion, D.A. Extreme precipitation-based vulnerability assessment of road-crossing drainage structures in forested watersheds using an integrated environmental modeling approach. Environ. Model. Softw. 2022, 155, 105413. [Google Scholar] [CrossRef]
  21. Lovett, D.M.; Burns, D.A.; Driscoll, C.T.; Jenkins, J.C.; Mitchell, M.J.; Rustad, L.; Shanley, J.B.; Likens, G.E.; Haeuber, R. Who needs environmental monitoring? Front. Ecol. Environ. 2007, 5, 253–260. [Google Scholar] [CrossRef]
  22. Vose, J.M.; Swank, W.T.; Adams, M.B.; Amatya, D.M.; Campbell, J.; Johnson, S.; Swanson, F.J.; Kolka, R.; Lugo, A.E.; Musselman, R.; et al. The role of experimental forests and ranges in the development of ecosystem science and biogeochemical cycling research. In USDA Forest Service Experimental Forests and Ranges; Hayes, D.C., Stout, S.L., Crawford, R.H., Hoover, A.P., Eds.; Springer: New York, NY, USA, 2014; pp. 387–403. [Google Scholar] [CrossRef]
  23. Swank, W.T.; Vose, J.M.; Elliott, K.J. Long-term hydrologic and water quality responses following commercial clearcutting of mixed hardwoods on a southern Appalachian catchment. For. Ecol. Manag. 2001, 143, 163–178. [Google Scholar] [CrossRef]
  24. Tajchman, S.J.; Fu, H.; Kochenderfer, J.N. Water and energy balance of a forested Appalachian watershed. Agric. For. Meteorol. 1997, 84, 61–68. [Google Scholar] [CrossRef]
  25. Amatya, D.M.; Herbert, S.; Trettin, C.C.; Hamidi, M.D. Evaluation of Paired Watershed Runoff Relationships since Recovery from a Major Hurricane on a Coastal Forest—A Basis for Examining Effects of Pinus palustris Restoration on Water Yield. Water 2021, 13, 3121. [Google Scholar] [CrossRef]
  26. Amatya, D.M.; Skaggs, R.W. Long-term hydrology and water quality of a drained pine plantation in North Carolina. Trans. ASABE 2011, 54, 2087–2098. [Google Scholar] [CrossRef]
  27. Dai, Z.; Trettin, C.C.; Amatya, D.M. Effects of Climate Variability on Forest Hydrology and Carbon Sequestration on the Santee Experimental Forest in Coastal South Carolina (General Technical Report SRS-172); USDA Forest Service, Southern Research Station: Asheville, NC, USA, 2013. [Google Scholar]
  28. Epps, T.; Hitchcock, D.; Jayakaran, A.D.; Loflin, D.; Williams, T.M.; Amatya, D.M. Characterization of storm flow dynamics of headwater streams in the South Carolina lower Coastal Plain. J. Am. Water Resour. Assoc. 2013, 49, 76–89. [Google Scholar] [CrossRef]
  29. Eshleman, K.N.; Pollard, J.S.; O’Brien, A.K. Interactions between groundwater and surface water in a Virginia coastal plain watershed. Hydrol. Processes 1994, 8, 389–410. [Google Scholar] [CrossRef]
  30. Harder, S.V.; Amatya, D.M.; Callahan, T.J.; Trettin, C.C.; Hakkila, J. Hydrology and water budget for a first-order forested Atlantic Coastal Plain watershed, South Carolina. J. Am. Water Resour. Assoc. 2007, 43, 563–575. [Google Scholar] [CrossRef]
  31. Pyzoha, J.E.; Callahan, T.J.; Sun, G.; Trettin, C.C.; Miwa, M. A Conceptual Hydrologic Model for a Forested Carolina Bay Depressional Wetland on the Coastal Plain of South Carolina, USA. Hydrol. Processes 2008, 22, 2689–2698. [Google Scholar] [CrossRef]
  32. Skaggs, R.W.; Chescheir, G.M.; Fernandez, G.P.; Amatya, D.M.; Diggs, J. Effects of Land Use on Soil Properties and Hydrology of Drained Coastal Plain Watersheds. Trans. ASABE 2011, 54, 1357–1365. [Google Scholar] [CrossRef]
  33. Slattery, M.C.; Gares, P.A.; Phillips, J.D. Multiple modes of storm runoff generation in a North Carolina coastal plain watershed. Hydrol. Processes 2006, 20, 2953–2969. [Google Scholar] [CrossRef]
  34. Sun, G.; McNulty, S.G.; Amatya, D.M.; Skaggs, R.W.; Swift, L.W.; Shepard, J.P.; Riekerk, H. A comparison of the hydrology of the coastal forested wetlands/pine flatwoods and the mountainous uplands in the southern, U.S. J. Hydrol. 2002, 263, 92–104. [Google Scholar] [CrossRef]
  35. Williams, T.M. Evidence of runoff production mechanisms in low gradient coastal forested watersheds. In Proceedings of the ASABE Annual International Meeting, Minneapolis Convention Center, Minneapolis, MN, USA, 17–20 June 2007. [Google Scholar]
  36. Andréassian, V.; Oddos, A.; Michel, C.; Anctil, F.; Perrin, C.; Loumagne, C. Impact of spatial aggregation of inputs and parameters on the efficiency of rainfall-runoff models: A theoretical study using chimera watersheds. Water Resour. Res. 2004, 40, W05209. [Google Scholar] [CrossRef]
  37. Trettin, C.C.; Amatya, D.M.; Gaskins, T.; Miniat, C.F.; Chow, A.; Callahan, T. Watershed Response to Longleaf Pine Restoration—Application of Paired Watersheds on the Santee Experimental Forest. In Working Watersheds and Coastal Systems: Research and Management for a Changing Future, Proceedings of the Sixth Interagency Conference on Research in the Watersheds, Shepherdstown, WV, USA, 23–26 July 2018; Latimer, J.S., Trettin, C.C., Bosch, D.D., Lane, C.R., Eds.; e-General Technical Report SRS-243; U.S. Department of Agriculture Forest Service, Southern Research Station: Asheville, NC, USA, 2019; pp. 194–201. [Google Scholar]
  38. Wei, X.; Li, Q.; Zhang, M.; Liu, W.; Fan, H. Chapter 11—Forest Cover Changes and Hydrology in Large Watersheds. In Forest Hydrology: Processes, Management, and Applications; Amatya, D.M., Williams, T.M., Bren, L., de Jong, C., Eds.; CABI Publishers: Wallingford, UK, 2016; pp. 180–191. [Google Scholar]
  39. Shaman, J.; Stieglitz, M.; Burns, D. Are big basins just the sum of small catchments? Hydrol. Processes 2004, 18, 3195–3206. [Google Scholar] [CrossRef]
  40. Haley, E.B. Field Measurements and Hydrologic Modeling of the Turkey Creek Watershed, South Carolina. Master’s Thesis, College of Charleston, Charleston, SC, USA, 2007. [Google Scholar]
  41. Amatya, D.M.; Callahan, T.J.; Trettin, C.C.; Radecki-Pawlik, A. Hydrologic and Water Quality Monitoring on Turkey Creek Watershed, Francis Marion National Forest, SC. In Proceedings of the Annual ASABE Int’l Meeting, Reno, NV, USA, 21–24 June 2009. ASABE paper # 09-5999. [Google Scholar]
  42. Amatya, D.M.; Jha, M.K. Evaluating SWAT model for a low gradient forested watershed in Coastal South Carolina. Trans. ASABE 2011, 54, 2151–2163. [Google Scholar] [CrossRef]
  43. La Torre Torres, I. Seasonal Relationships between Precipitation and Stream Flow Patterns Related to Watershed Characteristics of Two Third-Order Coastal Plain Watersheds in South Carolina. Master’s Thesis, College of Charleston, Charleston, SC, USA, 2008. [Google Scholar]
  44. La Torre Torres, I.; Amatya, D.M.; Callahan, T.J.; Sun, G. Seasonal rainfall-runoff relationships in a lowland forested watershed in the Southeastern USA. Hydrol. Processes 2011, 25, 2032–2045. [Google Scholar] [CrossRef]
  45. Muwamba, A.; Amatya, D.M.; Trettin, C.C.; Glover, J. Comparing nutrients export from first, second, and third order watersheds at South Carolina Atlantic Coastal Plain. In Headwaters to Estuaries: Advances in Watershed Science and Management: Proceedings of the 5th Interagency Conference On Research in the Watersheds (General Technical Report SRS-211), North Charleston, SC, USA, 2–5 March 2015; Stringer, C.E., Krauss, K.W., Latimer, J.S., Eds.; USDA Forest Service, Southern Research Station: Asheville, NC, USA, 2016; pp. 83–88. [Google Scholar]
  46. Trettin, C.C.; Amatya, D.M.; Muwamba, A.; Glover, J.; Wenerick, W. Chapter 15: Ecoregion 8.5.3 Southern Coastal Plain: Santee Experimental Forest, South Carolina. In Biological Responses to Stream Nutrients: A Synthesis of Science from Experimental Forests and Ranges; Doug Ryan, D., Ed.; PNW-GTR-981; Pacific Northwest Station, USDA Forest Service: Washington, DC, USA, 2022; pp. 389–414. [Google Scholar]
  47. Hook, D.D.; Buford, M.A.; Williams, T.M. Impact of Hurricane Hugo on the South Carolina Coastal Plain forest. J. Coast. Res. 1991, 8, 291–300. [Google Scholar]
  48. Amatya, D.M.; Trettin, C.C.; Panda, S.; Ssegane, H. Application of LiDAR data for Hydrologic Assessments of Low-gradient Coastal Watershed Drainage Characteristics. J. Geogr. Inf. Syst. 2013, 5, 171–195. [Google Scholar] [CrossRef]
  49. Amatya, D.M.; Callahan, T.J.; Hansen, W.F.; Trettin, C.C.; Radecki-Pawlik, A.; Meire, P. Turkey Creek—A case study of ecohydrology and integrated watershed management in the low-gradient Atlantic Coastal Plain, U.S.A. J. Water Resour. Protect. 2015, 7, 792–814. [Google Scholar] [CrossRef]
  50. Amatya, D.M.; Callahan, T.J.; Trettin, C.C. Synthesis of 10 years of studies on Turkey Creek watershed. In Headwaters to Estuaries: Advances in Watershed Science and Management, Proceedings of the Fifth Interagency Conference on Research in the Watersheds, North Charleston, SC, USA, 2–5 March 2015; Stringer, C.E., Krauss, K.W., Latimer, J.S., Eds.; e-General Technical Report SRS-211; US Department of Agriculture Forest Service, Southern Research Station: Asheville, NC, USA, 2016; 302p. [Google Scholar]
  51. Callahan, T.J.; Vulava, V.M.; Passarello, M.C.; Garrett, C.G. Estimating groundwater recharge in lowland watershed. Hydrol. Processes 2012, 26, 2845–2855. [Google Scholar] [CrossRef]
  52. Amatya, D.M.; Callahan, T.J.; Walega, A.; Morrison, A.; Vulava, V. Storm Event Analysis of Four Forested Catchments on the Atlantic Coastal Plain using MSME, a Modified SCS-CN Runoff Model. J. Hydrol. 2022, 608, 127772. [Google Scholar] [CrossRef]
  53. Walega, A.; Amatya, D.M.; Caldwell, P.; Marion, D.; Panda, S. Assessment of storm direct runoff and peak flow rates using improved SCS-CN models for selected forested watersheds in the Southeastern United States. J. Hydrol. Reg. Stud. 2020, 2, 100645. [Google Scholar] [CrossRef]
  54. Ku, P.; Tsui, M.; Farmer, T.; Chen, H.; Amatya, D.M.; Trettin, C.; Chow, A. Effects of Forest Management Practice (Prescribed Burning) on Mercury Transport: A Case Study in a Paired Experimental Watershed in Lower Coastal Plain of South Carolina; Oak Ridge National Lab. (ORNL): Oak Ridge, TN, USA, 2021. [Google Scholar]
  55. Trettin, C.C.; Czwartacki, B.; Allan, C.; Amatya, D.M. Linking freshwater tidal hydrology to carbon cycling in bottomland hardwood wetlands. In Headwaters to Estuaries: Advances in Watershed Science and Management, Proceedings of the Fifth Interagency Conference on Research in the Watersheds, North Charleston, SC, USA, 2–5 March 2015; Stringer, C.E., Krauss, K.W., Latimer, J.S., Eds.; US Department of Agriculture Forest Service, Southern Research Station: Asheville, NC, USA, 2016. [Google Scholar]
  56. Amatya, D.M.; Trettin, C.C. Development of watershed hydrologic research at Santee Experimental Forest, Coastal South Carolina. In Advancing the Fundamental Sciences, Proceedings of the Forest Service National Earth Sciences Conference, San Diego, CA, 18–22 October 2004; Furniss, M.J., Clifton, C.F., Ronnenberg, K.L., Eds.; General Technical Report PNW-GTR-689; USDA Forest Service, Pacific Northwest Research Station: Portland, OR, USA, 2007; Volume 1, pp. 180–190. [Google Scholar]
  57. Morrison, A. Storm Event Analysis at Varying Watershed Scales: Turkey Creek, Santee Experimental Forest, South Carolina. Master’s Thesis, College of Charleston, Charleston, SC, USA, 2016. [Google Scholar]
  58. Gaskins, A.; (Forest Service District Range Office, Francis Marion National Forest, Huger, SC, USA). Personal communication, 2022.
  59. Maceyka, A.; (Francis Marion and Sumter National Forest, Huger, SC, USA). Personal communication, 2023.
  60. Amatya, D.M.; Chescheir, G.M.; Williams, T.M.; Skaggs, R.W. Long-term water table dynamics of forested wetlands: Drivers and their effects on wetland hydrology in the Southeastern Atlantic Coastal Plain. Wetlands 2020, 40, 65–79. [Google Scholar] [CrossRef]
  61. Soil Conservation Service. Soil Survey of Berkeley County, South Carolina; Soil Conservation Service: Washington, DC, USA, 1980. [Google Scholar]
  62. Amatya, D.M.; Trettin, C.C.; Harrison, C.A.; Arnold, J.A. Long-term hydro-meteorology and water quality data from low-gradient catchments of varying scales on the Santee experimental Forest, South Carolina. Hydrol. Processes 2022, 36, e14549. [Google Scholar] [CrossRef]
  63. Amatya, D.M.; Trettin, C.C. Santee Experimental Forest, Watershed 78: Streamflow, Water Chemistry, Water Table, and Weather Data; Forest Service Research Data Archive: Fort Collins, CO, USA, 2022. [Google Scholar] [CrossRef]
  64. Amatya, D.M.; Harrison, C.A. Grass and forest potential evapotranspiration comparison using 5 methods in the Atlantic Coastal Plain. J. Hydrol. Eng. 2016, 21, 05016007. [Google Scholar] [CrossRef]
  65. Healy, R.W.; Cook, P.G. Using groundwater levels to estimate recharge. Hydrogeol. J. 2002, 10, 91–109. [Google Scholar] [CrossRef]
  66. Scanlon, B.R.; Healy, R.W.; Cook, P.G. Choosing appropriatetechniques for quantifying groundwater recharge. Hydrogeol. J. 2002, 10, 18–39. [Google Scholar] [CrossRef]
  67. Coes, A.L.; Spruill, T.B.; Thomasson, M.J. Multiple-method estimationof recharge rates at diverse locations in the North Carolina Coastal Plain, USA. Hydrogeol. J. 2007, 15, 773–788. [Google Scholar] [CrossRef]
  68. Amatya, D.M.; Trettin, C.C. Santee Experimental Forest Headquarters: Climate Data; Forest Service Research Data Archive: Fort Collins, CO, USA, 2020. [Google Scholar] [CrossRef]
  69. Priestley, C.H.B.; Taylor, R.J. On the assessment of surface heat flux and evaporation using large-scale parameters. Mon. Weather Rev. 1972, 100, 81–92. [Google Scholar] [CrossRef]
  70. Kizilersu, A.; Kreer, M.; Thomas, A.W. The Weibull distribution. Significance 2018, 15, 10–11. [Google Scholar] [CrossRef]
  71. Arnold, J.G.; Allen, P.M.; Muttiah, R.; Bernhardt, G. Automated Baseflow Separation and Recession Analysis Techniques. Groundwater 1995, 33, 1010–1018. [Google Scholar] [CrossRef]
  72. Dhorde, A.G.; Zarenistanak, M. Three-way approach to test data homogeneity: An analysis of temperature and precipitation series over southwestern Islamic Republic of Iran. J. Ind. Geophys. Union 2013, 17, 233–242. [Google Scholar]
  73. Sen, P.K. Estimates of the regression coefficient based on Kendall’s tau. J. Am. Stat. Assoc. 1968, 63, 1379–1389. [Google Scholar] [CrossRef]
  74. Kendall, M.G. Rank Correlation Methods; Griffin: Oxford, UK, 1948. [Google Scholar]
  75. Mann, H.B. Nonparametric tests against trend. Econom. J. Econom. Soc. 1945, 1, 245–259. [Google Scholar] [CrossRef]
  76. Libiseller, C.; Grimvall, A. Performance of partial Mann-Kendall tests for trend detection in the presence of covariates. Environmetrics 2002, 13, 71–84. [Google Scholar] [CrossRef]
  77. Coles, S.; Bawa, J.; Trenner, L.; Dorazio, P. An Introduction to Statistical Modeling of Extreme Values; Springer: London, UK, 2001; Volume 208, p. 208. [Google Scholar]
  78. Perica, S.; Pavlovic, S.; St Laurent, M.; Trypaluk, C.; Unruh, D.; Wilhite, O. Precipitation-Frequency Atlas of the United States; Volume 11, Version 2.0: Texas; U.S. Department of Commerce: Silver Spring, MD, USA, 2018. [Google Scholar]
  79. Hosking, J.R.M. L-Moments: Analysis and estimation of distributions using linear combinations of order statistics. J. Roy. Statist. Soc. Ser. B 1990, 52, 105–124. [Google Scholar] [CrossRef]
  80. Nerantzaki, S.D.; Papalexiou, S.M. Assessing extremes in hydroclimatology: A review on probabilistic methods. J. Hydrol. 2022, 605, 127302. [Google Scholar] [CrossRef]
  81. Martins, E.S.; Stedinger, J.R. Generalized maximum-likelihood generalized extreme-value quantile estimators for hydrologic data. Water Resour. Res. 2000, 36, 737–744. [Google Scholar] [CrossRef]
  82. Hosking, J.R.M.; Wallis, J.R. Regional Frequency Analysis: An Approach Based on L-Moments; Cambridge University Press: Cambridge, UK, 1997. [Google Scholar] [CrossRef]
  83. England, J.F., Jr.; Cohn, T.A.; Faber, B.A.; Stedinger, J.R.; Thomas, W.O., Jr.; Veilleux, A.G.; Kiang, J.E.; Mason, R.R., Jr. Guidelines for Determining Flood Flow Frequency—Bulletin 17C (ver. 1.1, May 2019); Techniques and Methods 4-B5; U.S. Geological Survey: Reston, VA, USA, 2019. [Google Scholar] [CrossRef]
  84. Feaster, T.D.; Gotvald, A.J.; Weaver, J.C. Magnitude and Frequency of Rural Floods in the Southeastern United States; Scientific Investigations Report 2009-5156; U.S. Geological Survey: Conway, SC, USA, 2009; Volume 3, 226p. [Google Scholar]
  85. Amatya, D.M.; Trettin, C.C. Annual Evapotranspiration of a Forested Wetland Watershed, SC; Paper # 07-2222; Annual Conference of the ASABE: St. Joseph, MI, USA, 2007. [Google Scholar]
  86. Mizzell, H.; Malsick, M.; Tyler, W. The historic South Carolina rainfall and major floods of October 1–5, 2015. J. S. C. Water Resour. 2016, 3, 3–7. [Google Scholar] [CrossRef]
  87. Amatya, D.M.; Skaggs, R.W.; Gregory, J.D. Comparison of methods for estimating REF-ET. J. Irrig. Drain. Eng. 1995, 121, 427–435. [Google Scholar] [CrossRef]
  88. Amatya, D.M.; Williams, T.M.; Nettles, J.E.; Skaggs, R.W.; Trettin, C.C. Comparison of Hydrology Two Atlantic Coastal Plain Forests, U.S.A. Trans. ASABE 2019, 62, 1509–1529. [Google Scholar] [CrossRef]
  89. Amatya, D.M.; Dai, Z.; Tian, S.; Sun, G. Long-term PET and ET of two Different Forests on the Atlantic Coastal Plain. ET Special Collection. Trans. ASABE 2016, 59, 647–660. [Google Scholar]
  90. Sun, G.; Noormets, A.; Gavazzi, M.; McNulty, S.G.; Chen, J.; Domec, J.-C.; King, J.; Amatya, D.M.; Skaggs, R.W. Energy and Water Balances of Two Contrasting Loblolly Pine Plantations on the Lower Coastal Plain of North Carolina, USA. For. Ecol. Managem. 2010, 259, 1299–1310. [Google Scholar] [CrossRef]
  91. Liu, Y.; Kumar, M. Role of meteorological controls on interannual variations in wet-period characteristics of wetlands. Water Resour. Res. 2016, 52, 5056–5074. [Google Scholar] [CrossRef]
  92. Mizzell, H.; Malsick, M.; Abramyan, I. South Carolina’s climate report card: Understanding South Carolina’s climate trends and variability. J. S. C. Water Resour. 2014, 1, 4–9. [Google Scholar] [CrossRef]
  93. Marion, D.A.; Sun, G.; Caldwell, P.V.; Ford, C.R.; Ouyang, Y.; Amatya, D.M.; Clinton, B.D.; Conrads, P.A.; Gull-Laird, S.; Dai, Z.; et al. Chapter 9: Managing Forest Water Quantity and Quality Under Climate Change. In Climate Change Adaptation and Mitigation Management Options: A Guide for Natural Resource Managers in Southern Forest Ecosystems; Vose, J., Kleipzig, K., Eds.; CRC Press: Boca Raton, FL, USA, 2013; 496p. [Google Scholar]
  94. Amatya, D.M.; Harrison, C.A.; Trettin, C.C. Hydro-meteorologic assessment of October 2015 extreme precipitation event on Santee Experimental Forest watersheds, SC. J. S. C. Water Resour. 2016, 3, 19–30. [Google Scholar]
  95. Amatya, D.M.; Radecki-Pawlik, A. Flow Dynamics of Three Forested Watersheds in Coastal South Carolina, U.S.A. Acta Scient. Pol.–Form. Circumiectus 2007, 6, 3–17. [Google Scholar]
  96. Bower, L.M.; Peoples, B.K.; Eddy, M.C.; Scott, M.C. Quantifying flow–ecology relationships across flow regime class and ecoregions in South Carolina. Sci. Total Environ. 2022, 802, 149721. [Google Scholar] [CrossRef]
  97. Vogel, R.M.; Fennessey, N.M. Flow duration curves II: A review of applications in water resources planning. J. Am. Water Resour. Assoc. 1995, 31, 1029–1039. [Google Scholar] [CrossRef]
  98. Wałęga, A.; Kędzior, R.; Książek, L.; Młyński, D.; Strużyński, A.; Grela, J.; Madej, P.; Skalski, T. Flow predictability indicates the ecological quality of the river: A case of invertebrates in Central Europe. Ecol. Indic. 2022, 143, 109308. [Google Scholar] [CrossRef]
  99. Frankiewicz, P.; Radecki-Pawlik, A.; Wałęga, A.; Łapińka, M.; Wojtal-Frankiewicz, A. Small hydraulic structures, big environmental problems: Is it possible to mitigate the negative impacts of culverts on stream biota? Environ. Rev. 2021, 29, 510–528. [Google Scholar] [CrossRef]
  100. Young, C.E.; Klawitter, R.A. Hydrology of Wetland Forest Watersheds; Report, No. 4; Council on Hydrology Clemson University Water Resources Research Institute: Clemson, SC, USA, 1968; pp. 29–38. [Google Scholar]
  101. Williams, T.M.; Amatya, D.M. Coastal plain soils and geomorphology: A key to understanding forest hydrology. In Headwaters to Estuaries: Advances in Watershed Science and Management, Proceedings of the Fifth Interagency Conference on Research in the Watersheds, North Charleston, SC, USA, 2–5 March 2015; Stringer, C.E., Krauss, K.W., Latimer, J.S., Eds.; e-General Technical Report SRS-211; US Department of Agriculture Forest Service, Southern Research Station: Asheville, NC, USA, 2016; 302p. [Google Scholar]
  102. Griffin, M.P.; Callahan, T.J.; Vulava, V.M.; Williams, T.J. Influence of soil type and antecedent soil moisture conditions on storm-event flow pathways in lower coastal plain watersheds of the southeastern United States. Water Resour. Res. 2014, 50, 8265–8280. [Google Scholar] [CrossRef]
  103. Callahan, T.J.; Amatya, D.M.; Stone, P. Coastal forests and groundwater: Using case studies to understand the effects of drivers and stressors for resource management. Sustainability 2017, 9, 447. [Google Scholar] [CrossRef]
  104. Jaiswal, R.K.; Lohani, A.K.; Tiwari, H.L. Statistical Analysis for Change Detection and Trend Assessment in Climatological Parameters. Environ. Process 2015, 2, 729–749. [Google Scholar] [CrossRef]
  105. Feaster, T.D.; Gotvald, A.J.; Weaver, J.C. Methods for Estimating the Magnitude and Frequency of Floods for Urban and Small, Rural Streams in Georgia, South Carolina, and North Carolina, 2011; US Geological Survey: Reston, VA, USA, 2014. [Google Scholar]
  106. Bosch, D.D.; Coffin, A.W.; Sheridan, J.; Pisani, O.; Endale, D.M.; Strickland, T.C. Little River Experimental Watershed, a keystone in understanding of coastal plain watersheds. Hydrol. Processes 2021, 35, e14334. [Google Scholar] [CrossRef]
  107. Keefer, T.O.; Renard, K.G.; Goodrich, D.C.; Heilman, P.; Unkrich, C.L. Quantifying Extreme Rainfall Events and their Hydrologic Response in the Walnut Gulch Experimental Watershed in Southeastern Arizona. In ASABE 1st Climate Change Symposium: Adaptation and Mitigation Conference Proceedings 2015; American Society of Agricultural and Biological Engineers: St. Joseph, MI, USA, 2015; p. 1. [Google Scholar]
  108. Pascolini-Campbell, M.A.; Reager, J.T.; Fisher, J.B. GRACE-based mass conservation as a validation target for basin-scale evapotranspiration in the contiguous United States. Water Resour. Res. 2020, 56, 2019WR026594. [Google Scholar] [CrossRef]
  109. Fisher, J.B.; Melton, F.; Middleton, E.; Hain, C.; Anderson, M.; Allen, R.; McCabe, M.F.; Hook, S.; Baldocchi, D.; Townsend, P.A.; et al. The future of evapotranspiration: Global requirements for ecosystem functioning, carbon and climate feedbacks, agricultural management, and water resources. Water Resour. Res. 2017, 53, 2618–2626. [Google Scholar] [CrossRef]
  110. Blanche, C.A.; Hodges, J.D.; Nebeker, T.E.; Moehring, D.M. Southern pine beetle: The host dimension. Bulletins 1983, 764. Available online: https://scholarsjunction.msstate.edu/mafes-bulletins/764 (accessed on 20 February 2024).
  111. Kolb, T.E.; Fettig, C.J.; Ayres, M.P.; Bentz, B.J.; Hicke, J.A.; Mathiasen, R.; Stewart, J.E.; Weed, A.S. Observed and anticipated impacts of drought on forest insects and diseases in the United States. For. Ecol. Manag. 2016, 380, 321–334. [Google Scholar] [CrossRef]
  112. Mosley, L.M. Drought impacts on the water quality of freshwater systems; review and integration. Earth Sci. Rev. 2015, 140, 203–214. [Google Scholar] [CrossRef]
  113. Addington, R.N.; Hudson, S.J.; Hiers, J.K.; Hurteau, M.D.; Hutcherson, T.F.; Matusick, G.; Parker, J.M. Relationships among wildfire, prescribed fire, and drought in a fire-prone landscape in the South-Eastern United States. Int. J. Wildland Fire 2015, 24, 778–783. [Google Scholar] [CrossRef]
  114. Emmett, K.D.; Pomara, L.Y.; Riitters, K.; Schroeder, T. Leveraging remotely sensed data to understand drivers of forest change for the Southeastern, U.S. In Proceedings of the International Association of Landscape Ecology North America Annual Meeting, Virtual, 11–14 April 2022. [Google Scholar]
  115. Dewitz, J. National Land Cover Database (NLCD) 2016 Products (Ver. 3.0, November 2023); U.S. Geological Survey: Reston, VA, USA, 2019. [Google Scholar] [CrossRef]
  116. Brooks, B.-G.J.; Lee, D.C.; Pomara, L.Y.; Hargrove, W.W. Monitoring Broadscale Vegetational Diversity and Change across North American Landscapes Using Land Surface Phenology. Forests 2020, 11, 606. [Google Scholar] [CrossRef]
  117. Conrads, P.A.; Roehl, E.A., Jr.; Daamen, R.C.; Cook, J.B. Simulation of Salinity Intrusion along the Georgia and South Carolina Coasts Using Climate-Change Scenarios; Scientific Investigation Report 2013-5036; U.S. Geological Survey: Reston, VA, USA, 2013; 92p. Available online: https://pubs.usgs.gov/sir/2013/5036/ (accessed on 20 February 2024).
  118. Cherry, G.S.; Peck, M.F. Saltwater Intrusion in the Floridan Aquifer System near Downtown Brunswick, Georgia, 1957–2015; Open-File Report 2017–2010; U.S. Geological Survey: Reston, VA, USA, 2017; 10p. [Google Scholar] [CrossRef]
  119. Eamus, D.; Fu, B.; Springer, A.E.; Stevens, L.E. Groundwater Dependent Ecosystems: Classification, Identification Techniques and Threats. In Integrated Groundwater Management; Jakeman, A.J., Barreteau, O., Hunt, R.J., Rinaudo, J.D., Ross, A., Eds.; Springer: Cham, Switzerland, 2016. [Google Scholar] [CrossRef]
  120. Mukherjee, S.; Mishra, A.K. Cascading effect of meteorological forcing on extreme precipitation events: Role of atmospheric rivers in southeastern, U.S. J. Hydrol. 2021, 601, 126641. [Google Scholar] [CrossRef]
  121. Amatya, D.M.; Fialkowski, M.; Bitner, A. A Numerical Water Table Depth Computing Model for Poorly Drained Soils. Wetlands 2018, 39, 39–54. [Google Scholar] [CrossRef]
  122. Sun, G.; Caldwell, P.; Noormets, A.; McNulty, S.G.; Cohen, E.; Moore Myers, J.; Domec, J.-C.; Treasure, E.; Mu, Q.; Xiao, J.; et al. Upscaling key ecosystem functions across the conterminous United States by a water-centric ecosystem model. J. Geophys. Res. Biogeosci. 2011, 116, G00J05. [Google Scholar] [CrossRef]
  123. Amatya, D.M.; Hamidi, D.; Trettin, C.C.; Dai, Z. Simulating Hydrology of Current Stands and Post-longleaf Pine Restoration in Coastal South Carolina. In Enhancing Landscapes for Sustainable Intensification and Watershed Resiliency—Proceedings of the 7th Interagency Conference on Research in the Watersheds, Corvallis, OR, USA, 16–19 November 2020; Latimer, J.S., Bosch, D.D., Faustini, J., Lane, C.R., Trettin, C.C., Eds.; Gen. Tech. Rep. SRS–264; U.S. Department of Agriculture Forest Service, Southern Research Station: Asheville, NC, USA, 2022; 217p. [Google Scholar] [CrossRef]
Figure 1. Location of the Turkey Creek watershed in the Francis Marion National Forest in the lower coastal plain of South Carolina. The larger outline is the watershed boundary (yellow) with streams (blue) delineated on true-color satellite image. Two nested catchments (in green and maroon lines) are also shown in Morrison [57]. Groundwater wells on four major soil series (Gb—Goldsboro; Le—Lenoir; Ly—Lynchburg; and Ra—Rains) are also shown together with stream monitoring stations. The hatched circle marks the Turkey Creek watershed outlet, USGS stream gaging station 02172035 including a rain gauge. TC is the weather station in the middle of the watershed.
Hydrology 11 00031 g001
Figure 2. Annual rainfall, streamflow, and runoff coefficients for the 2005–2021 period. Broken horizontal lines are the average for the rain (1470 mm) and for the streamflow (362 mm). Long-term (1946–2008) average is 1370 mm. Sloped lines are general trends.
Hydrology 11 00031 g002
Figure 3. Annual trends in (a) rainfall, and streamflow, (b) minimum, average, and maximum temperature, (c) potential evapotranspiration, and total evapotranspiration, and (d) ratio of flow and rain (ROC) for 2006–2021. The p-values estimated for non-parametric M-K test are also presented for each variable. (d) The scatter points indicate the yearly values and the lines indicate linear trends in each of the plots.
Hydrology 11 00031 g003
Figure 4. Monthly rainfall (thin light blue bars) and streamflow (thick dark blue line) for 2006–2021. Horizontal lines are the average for the rain (122.7 mm) (broken brown) and the flow (solid yellow) 31.1 mm).
Hydrology 11 00031 g004
Figure 5. (a) Daily rainfall frequency–duration curves and (b) annual trends in the number of storm sizes for three different categories of rainfall: rainfall storm totals > 100 mm, storm totals between 51–100 mm, and storm totals between 26–50 mm.
Hydrology 11 00031 g005
Figure 6. Daily flow frequency duration curves. A closer view of the lower exceedance values is shown at right.
Hydrology 11 00031 g006
Figure 7. Daily flow rates frequency duration curves for dry years of 2007 and 2012, normal years of 2008 and 2013, and wet years of 2015 and 2020.
Hydrology 11 00031 g007
Figure 8. Relationship of peak discharge with rainfall amounts for 24, 48, 72-, and 96 h durations observed during the 2005–2021 period without the estimated discharge of extreme event on 5 October 2015.
Hydrology 11 00031 g008
Figure 9. Daily water table fro9m shallow groundwater wells on five dominant soil types: (a) Rains, (b) Lenoir, (c) Goldsboro, (d) Lynchburg, and (e) Wahee for 2006 to 2021 period.
Hydrology 11 00031 g009
Figure 10. Groundwater head data (2006–2020) for the upper Turkey Creek location. Water table and piezometric head for a 14.5-m deep piezometer are shown. Lenoir soil series (clayey Aeric Paleaquults). The vertical separation of the two data series indicates a consistent albeit small downward hydraulic gradient between the water table and deeper groundwater system.
Hydrology 11 00031 g010
Figure 11. NOAA-Atlas14 and on-site-based (a) 24 h precipitation depths and (b) 48 h precipitation depths corresponding to specific return intervals. The onsite precipitation depths are calculated using the GEV analysis. The circles indicate the best estimates, and the error bars indicate the 5–95% confidence intervals of precipitation depth.
Hydrology 11 00031 g011
Figure 12. Comparison of 2, 5-, 10-, 25-, 50-, and 100-year design flow rates estimated using on-site annual maximum peak flow rate with LPIII distribution fit, results from Pearson Type III (published in Amatya and Radecki-Pawlik (2007) [95]), and regional USGS regression equation. The error bars indicate 5–95% confidence intervals for the LPIII distribution fit.
Hydrology 11 00031 g012
Table 1. Watershed characteristics.
CharacteristicsValues
Elevation range, m 3.5–11.5
Average basin slope, % <2.0
Area, ha 5240
Channel Slope, % 0.1
Maximum Channel length, m 2020
Dominant soil types aLenoir, Wahee, Lynchburg, Goldsboro, Rains
B-horizon soil hydraulic conductivity, cm/s10−5, 10−4, 10−3, 10−2, 10−3
Vegetation categoriesPine mixed, Loblolly pine
a Lenoir soil series: fine, mixed, semiactive, thermic Aeric Paleaquults (loam to sandy clay). Wahee soil series: fine, mixed, semiactive, thermic Aeric Endoaquults (fine sandy to clay loam). Lynchburg soil series: fine-loamy, siliceous, semiactive, thermic Aeric Paleaquults (loamy fine sand to sandy clay loam). Goldsboro soils series: fine-loamy, siliceous, subactive, thermic Aquic Paleudults (loamy sand to sandy loam). Rains: fine-loamy, siliceous, semiactive, thermic Typic Paleaquults (sandy loam to ssandy clay loam).
Table 2. List of recorded hydro-meteorologic variables and their characteristics.
No. RecordedRecorderRecorder RecorderRecordRecordedAnalyzed Remarks
VariableTypeNumbersLocationLengthUnitUnit
1RainfallTipping bucket1-Auto/
1-Man
Middle of WS782005–20210.25 mm/tipmm/dayManual backup; gap fill
2StreamflowSutron Bubbler1WS78 Outlet2005–2021cfsmm/dayStarting from March 2005
3Air Temperature Vaisala1Middle of WS782005–2021°C°CStarting late October 2005
4Relative HumidityVaisala1Middle of WS782005–2021%%Starting late October 2005
5Wind SpeedMet One1Middle of WS782005–2021m s−1m s−2Starting late October 2005
6Solar RadiationLICOR/Apogee1Middle of WS782005–2021W m2Mj m2 d−1Starting late October 2005
7Shallow GWWL-165Distributed2006–2019cmcmStaring mid 2006
8Deep GWManual well3 piezometersMiddle of WS782006–2021cmcmStaring mid 2007
Table 3. Annual rainfall, streamflow (runoff), Priestley–Taylor (P-T) potential evapotranspiration (PET), ROC, ET, ET/P-T PET, and ET/Rain values for 2005–2021.
YearRainfall mmPET, mmFlow,
mm
ROC, Flow/RainET, mmET/P-T PETET/Rain
2005152712204000.2611270.780.74
2006112212981190.1110030.770.89
20079941212940.099000.740.91
2008146311943490.2411140.930.76
2009155311163870.2511661.050.75
2010130412293490.279550.780.73
201110431304570.069860.760.94
201211171295230.0210940.850.98
2013154611833200.2112261.040.79
2014138912502550.1811340.910.82
20152243121611670.5210760.600.48
2016183412855880.3212460.970.68
2017157913224370.2811420.860.72
2018158713124240.2711630.890.73
2019142213502180.1512050.890.85
2020197912986460.3313331.030.67
2021128912063150.249740.770.76
AVERAGE147012553620.2211080.860.78
SD331.1060.62269.990.12115.540.120.12
COV0.230.050.750.530.100.140.15
Table 4. Results of Modified MK Test. The results showing statistically significant (p-value < 0.05) trends are indicated in italics.
Variable (Units)Whole Study PeriodExcluding Year 2015Direction
Modified MK TestSen Slope (Per Decade)Modified MK TestSen Slope (Per Decade)
Z-Statisticsp-ValueZ-Statisticsp-Value
Rainfall (mm)1.610.11238.381.580.12220.96Positive
Streamflow (mm)0.740.46100.560.630.53103.57Positive
PET (mm)2.930.00357.082.710.00765.36Positive
Total ET (mm)2.10.04162.292.480.01184.17Positive
ROC0.780.430.060.680.50.05Positive
Tmax (°C)0.050.960.060.10.920.06Positive
Tmin (°C)3.740.00021.983.967.53 × 10−52.15Positive
Tavg (°C)2.480.011.032.570.011.08Positive
Table 5. Results of Pettitt test for water table and piezometer water depth.
VariableUcritUKPResults
TC water table45938512.19.20120.29no change point
TC piezometer4784784.01.20100.22no change point
Disclaimer/Publisher’s Note: The statements, opinions and data contained in all publications are solely those of the individual author(s) and contributor(s) and not of MDPI and/or the editor(s). MDPI and/or the editor(s) disclaim responsibility for any injury to people or property resulting from any ideas, methods, instructions or products referred to in the content.

