
Drought Severity and Trends in a Mediterranean Oak Forest

Abstract
:1. Introduction
2. Materials and Methods
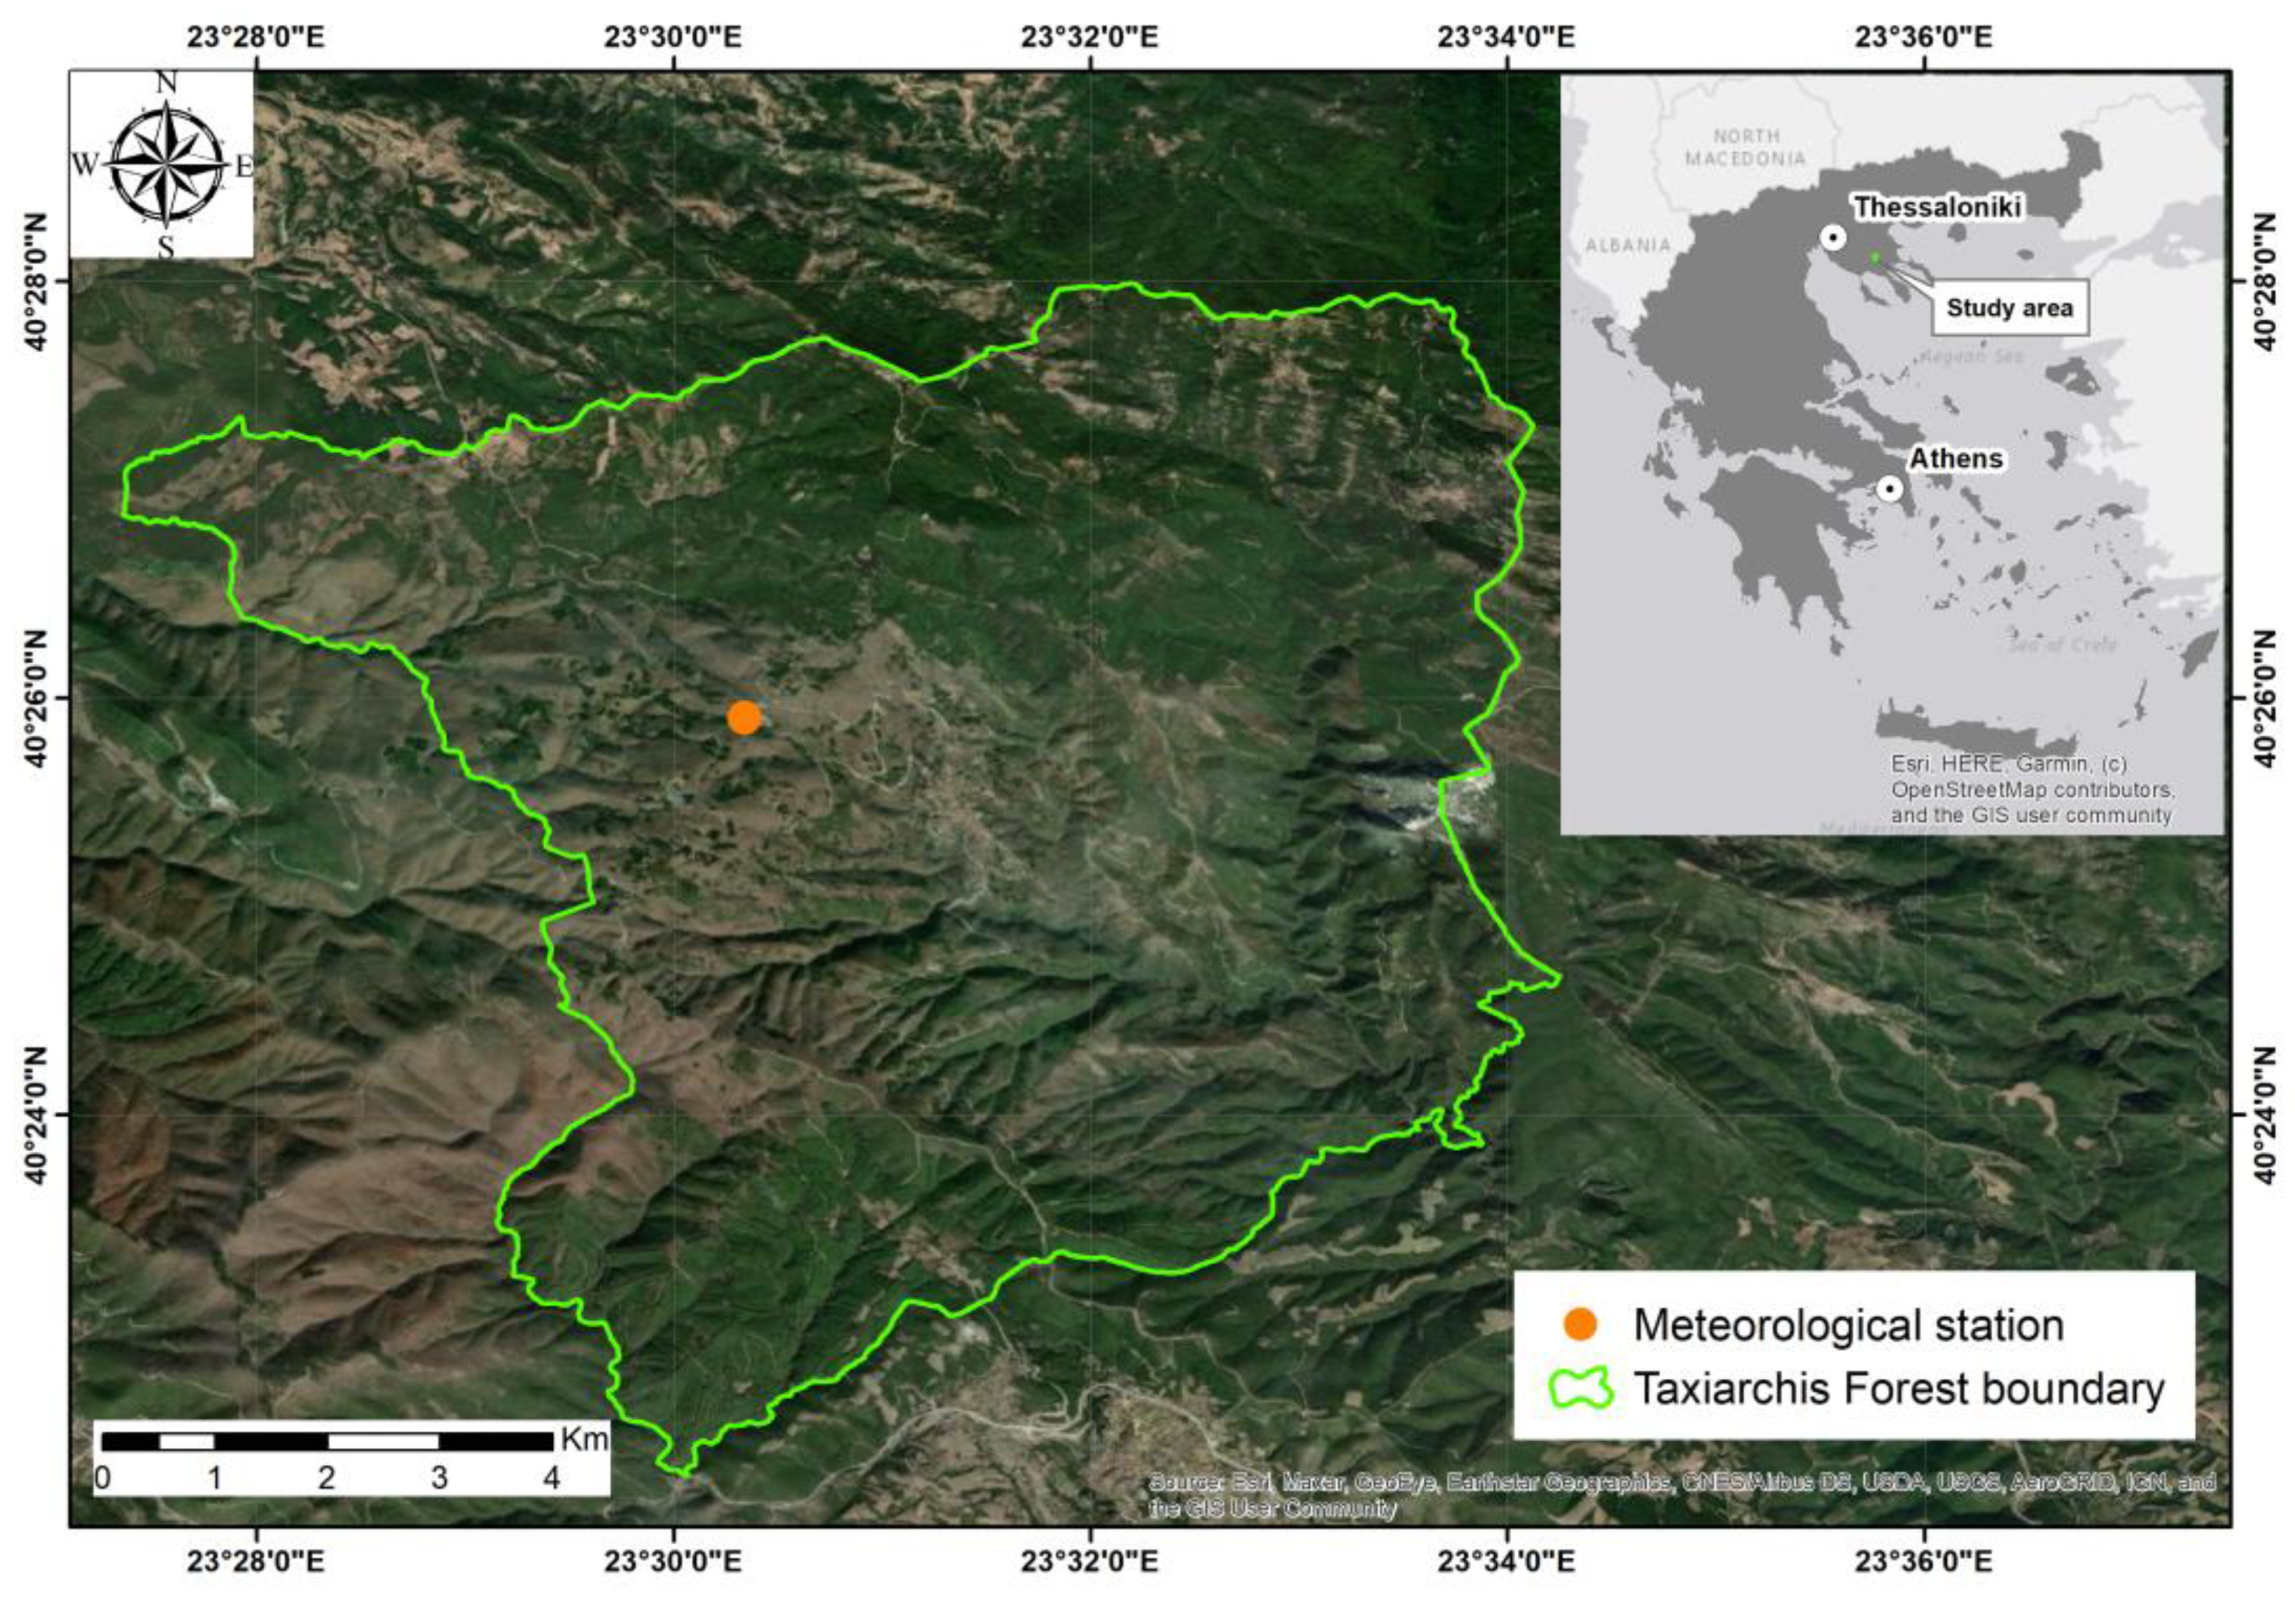
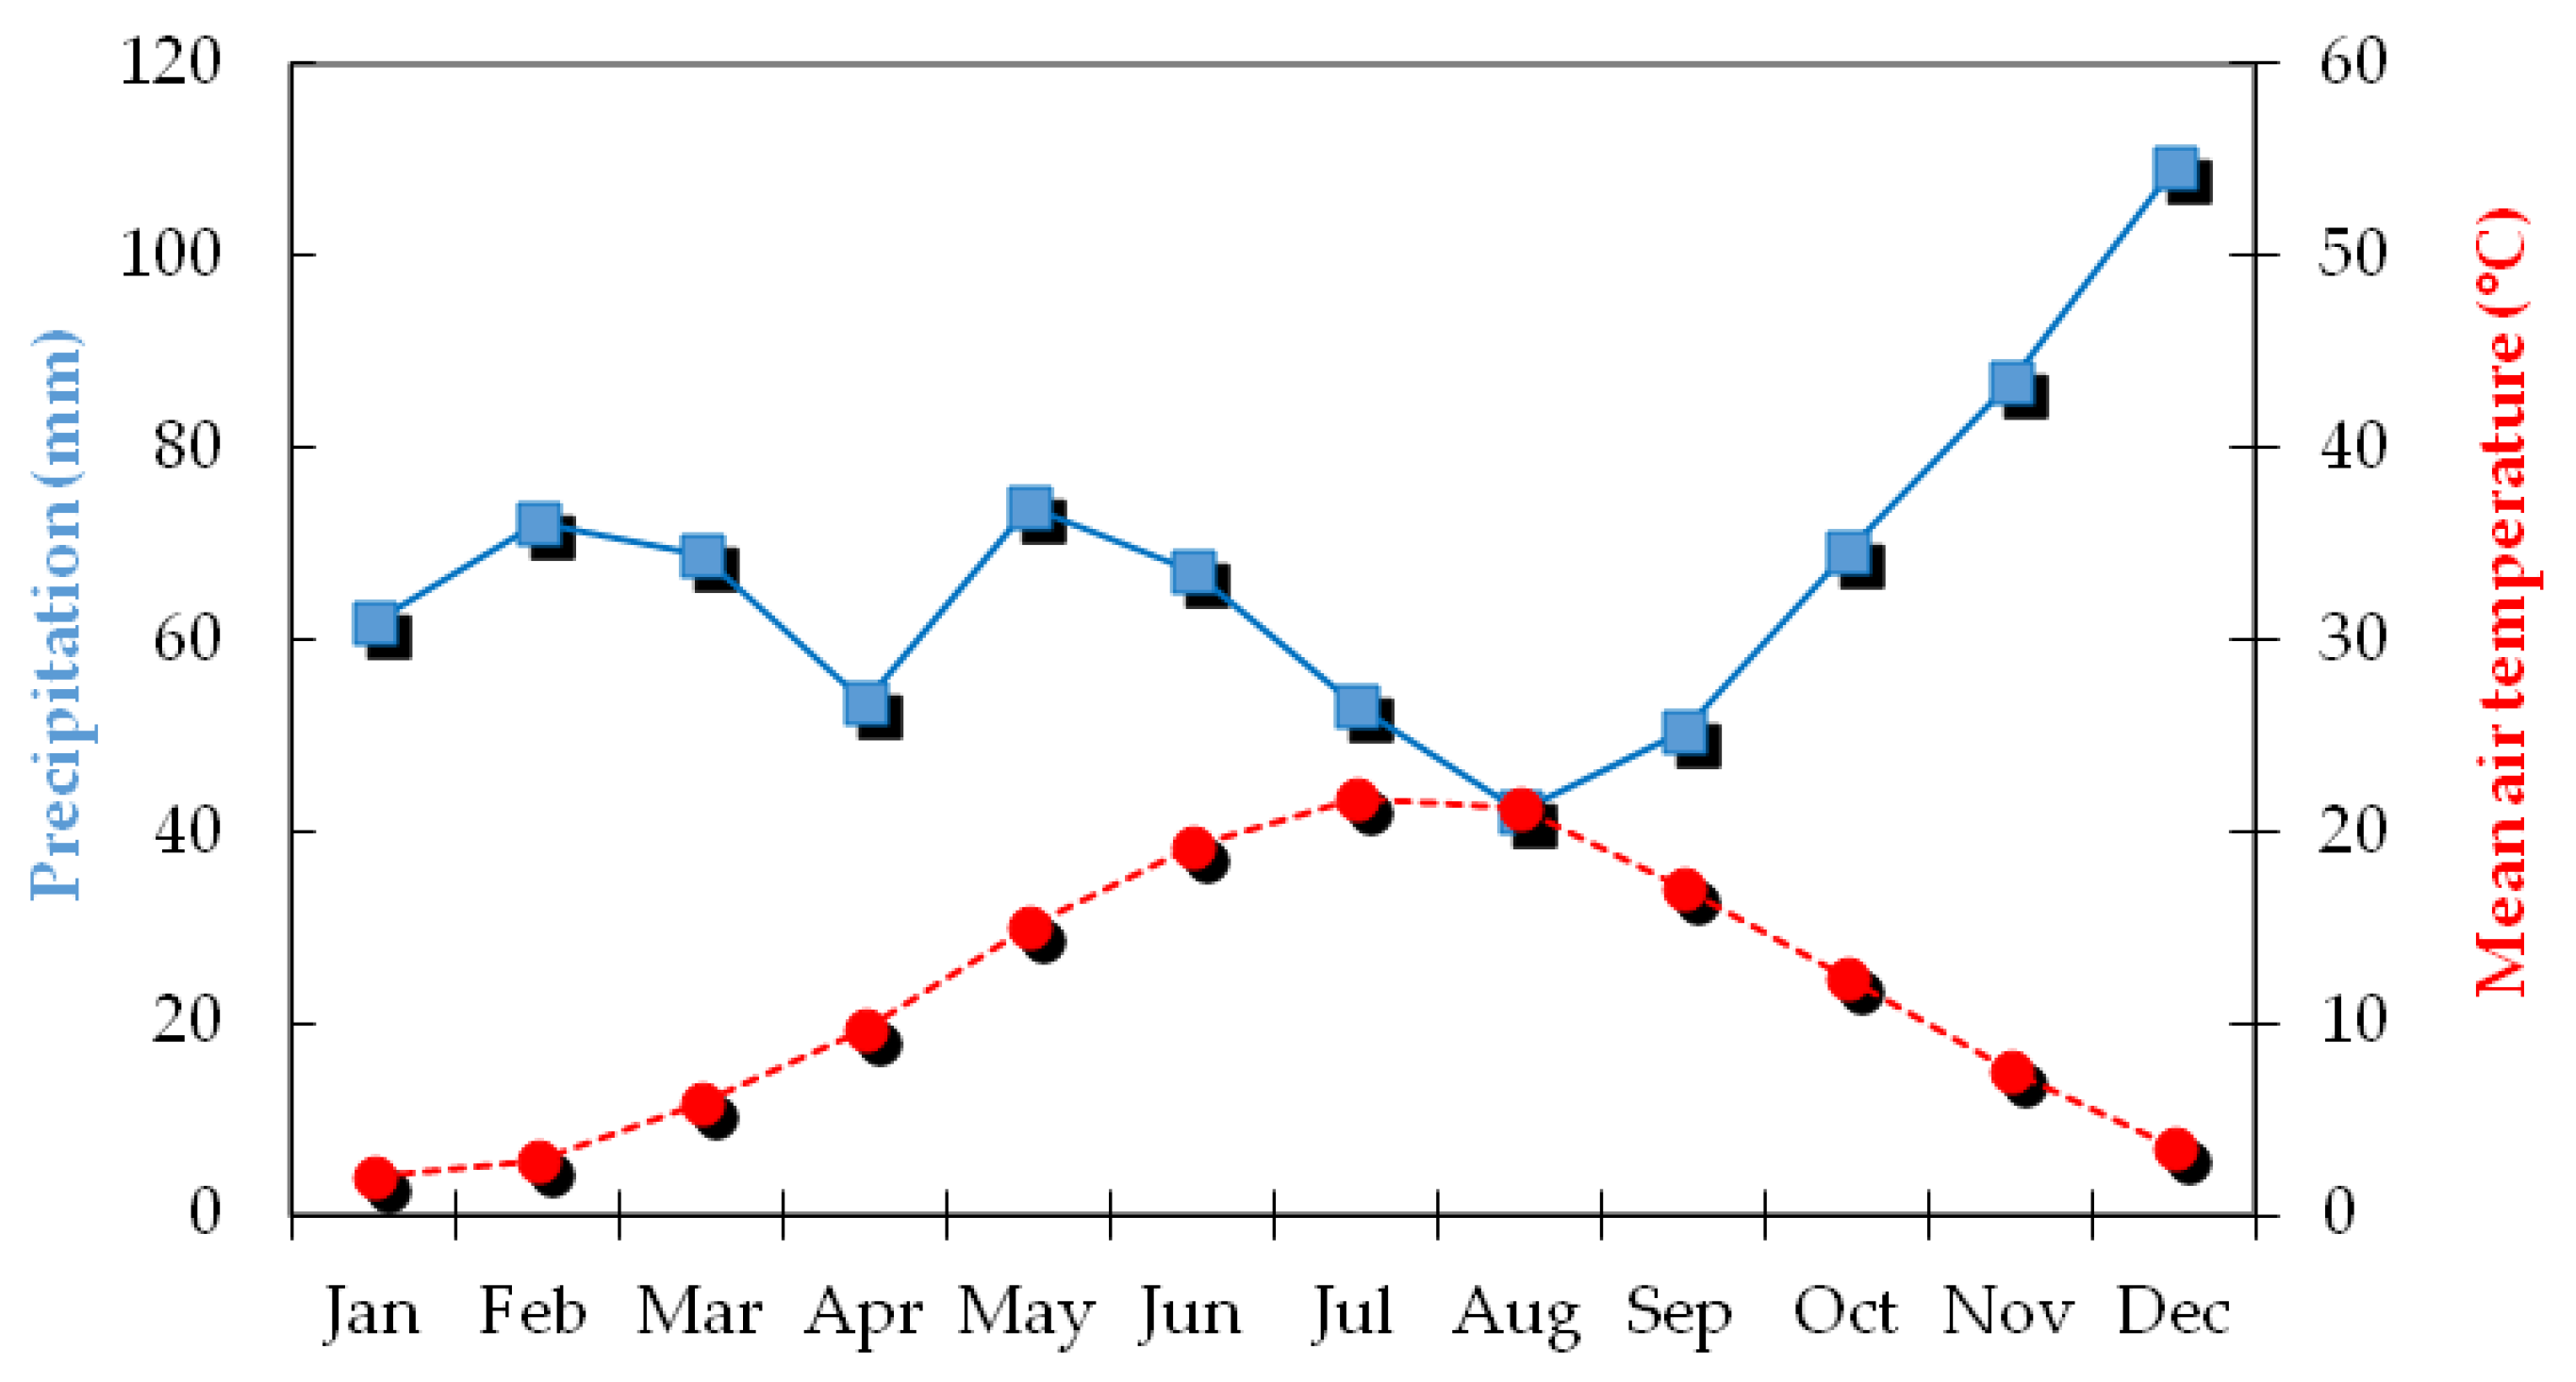
2.1. Study Area
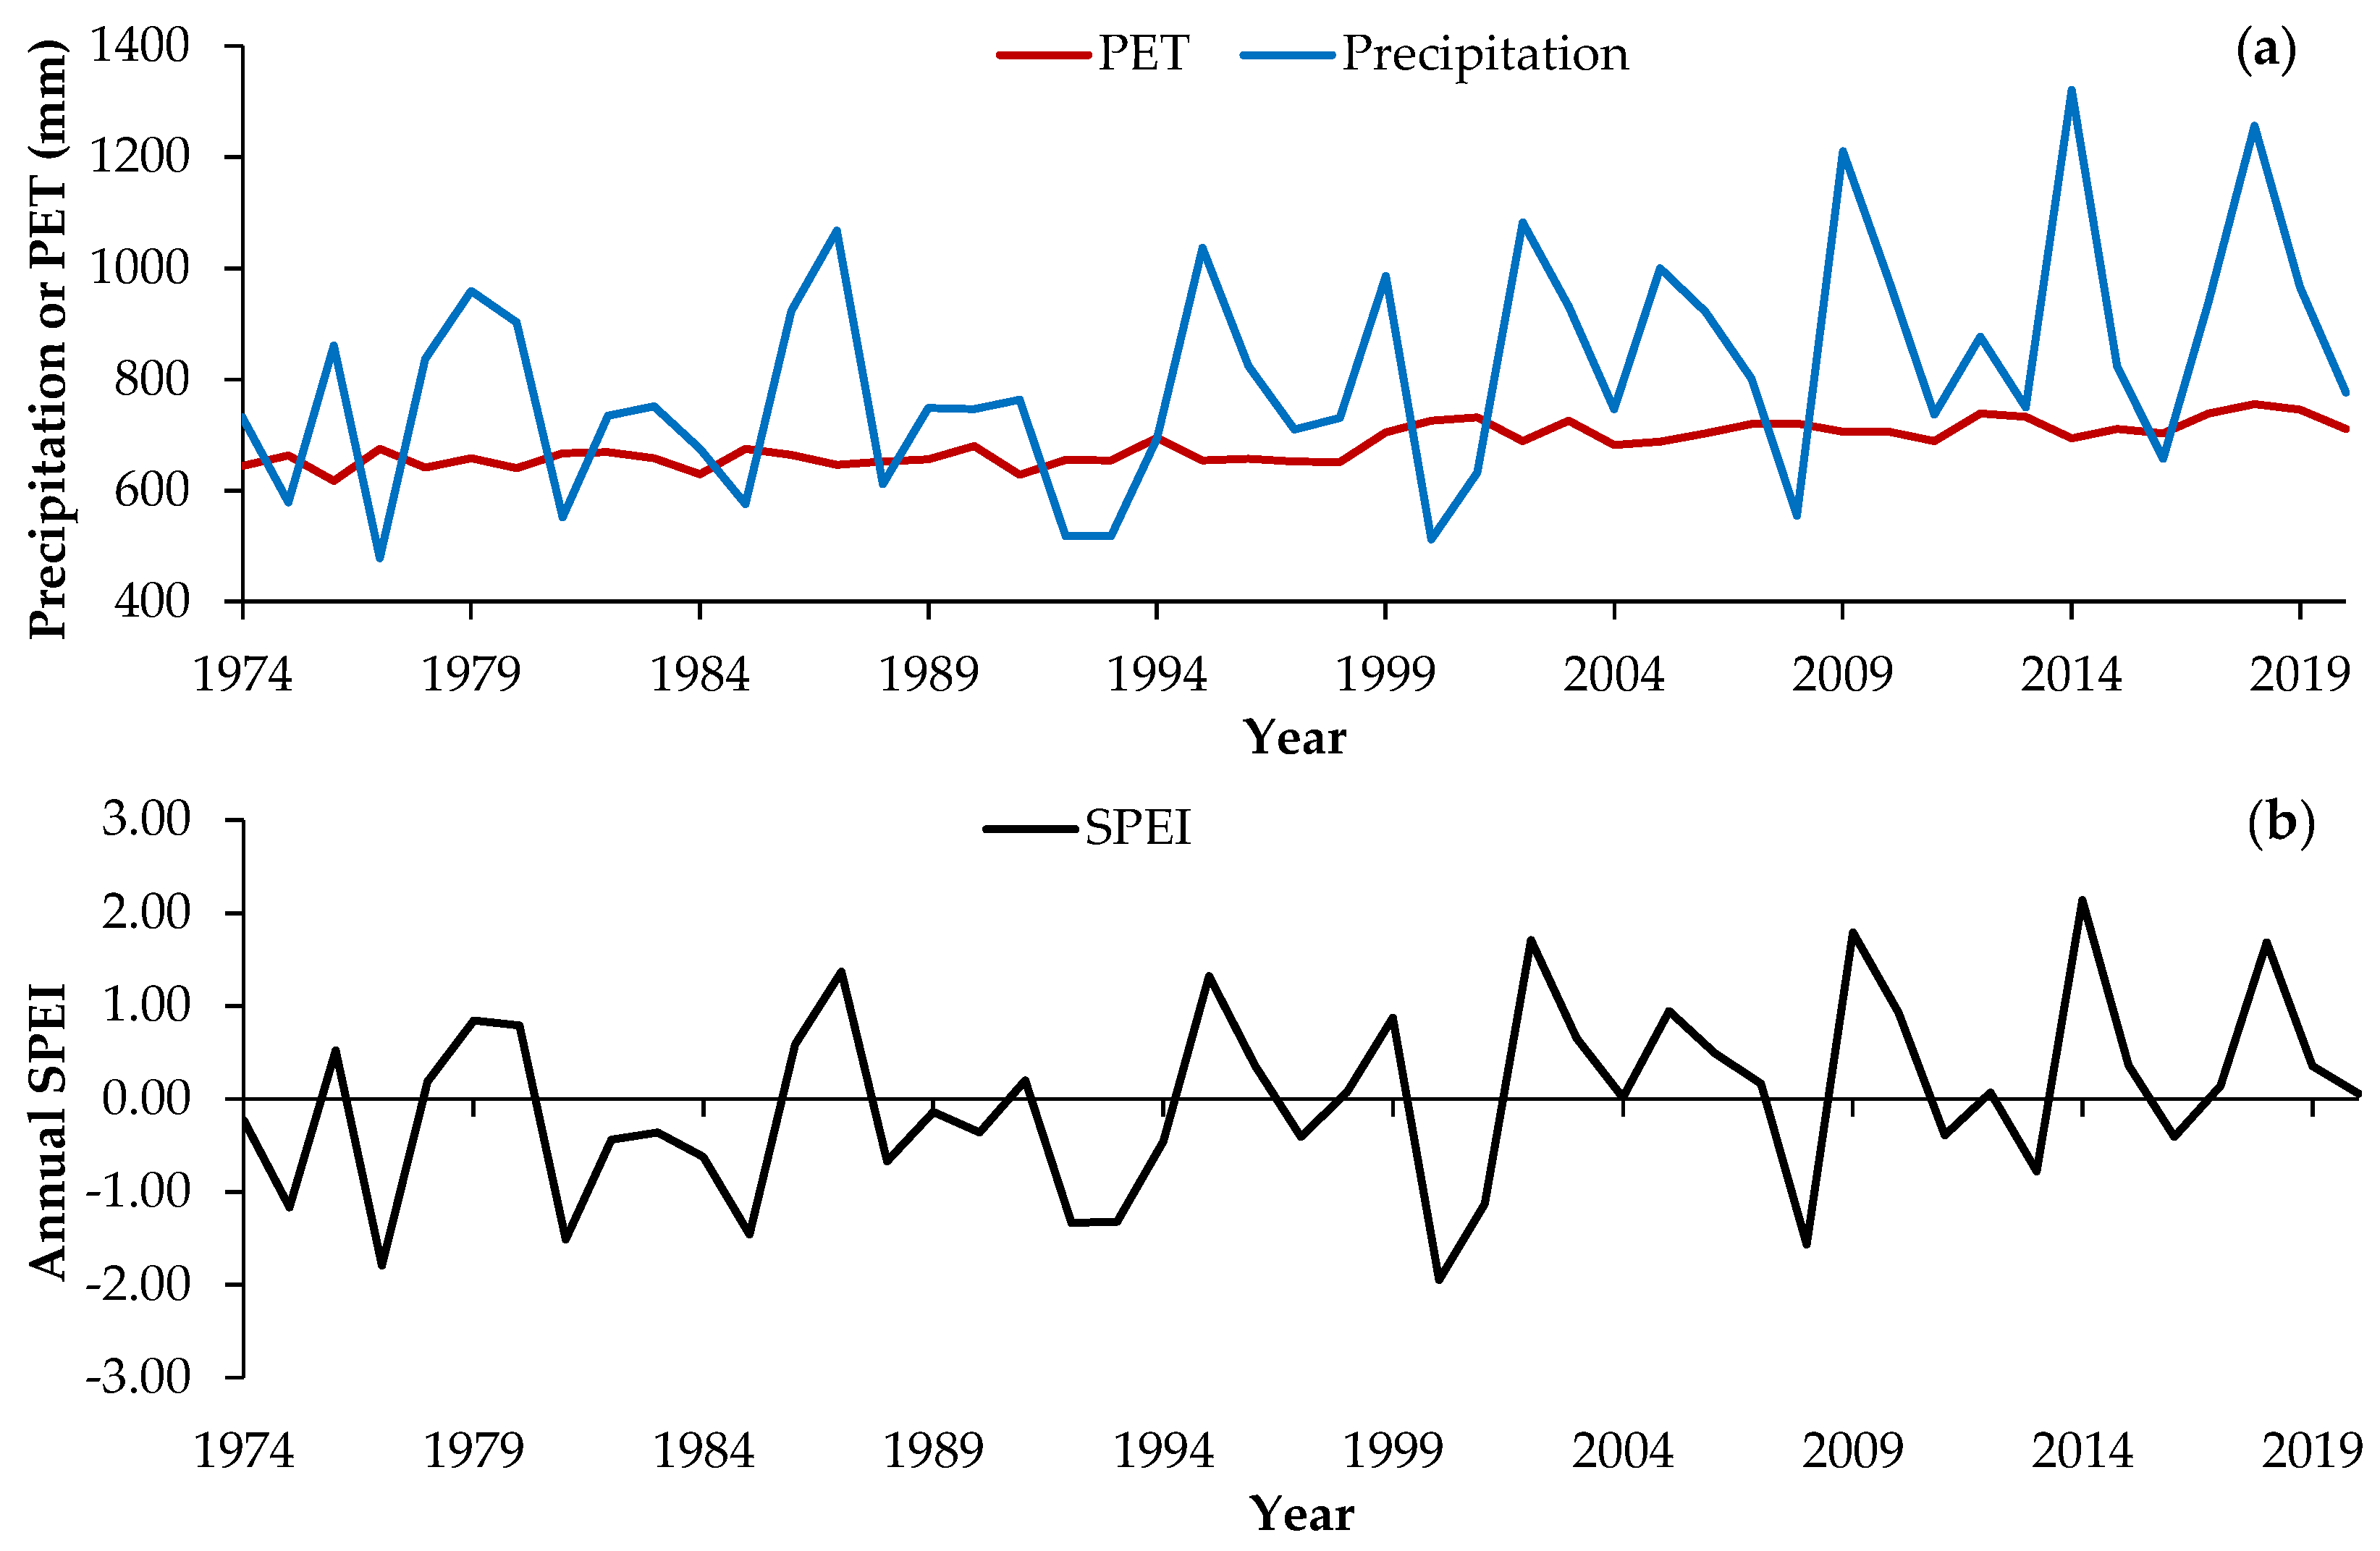
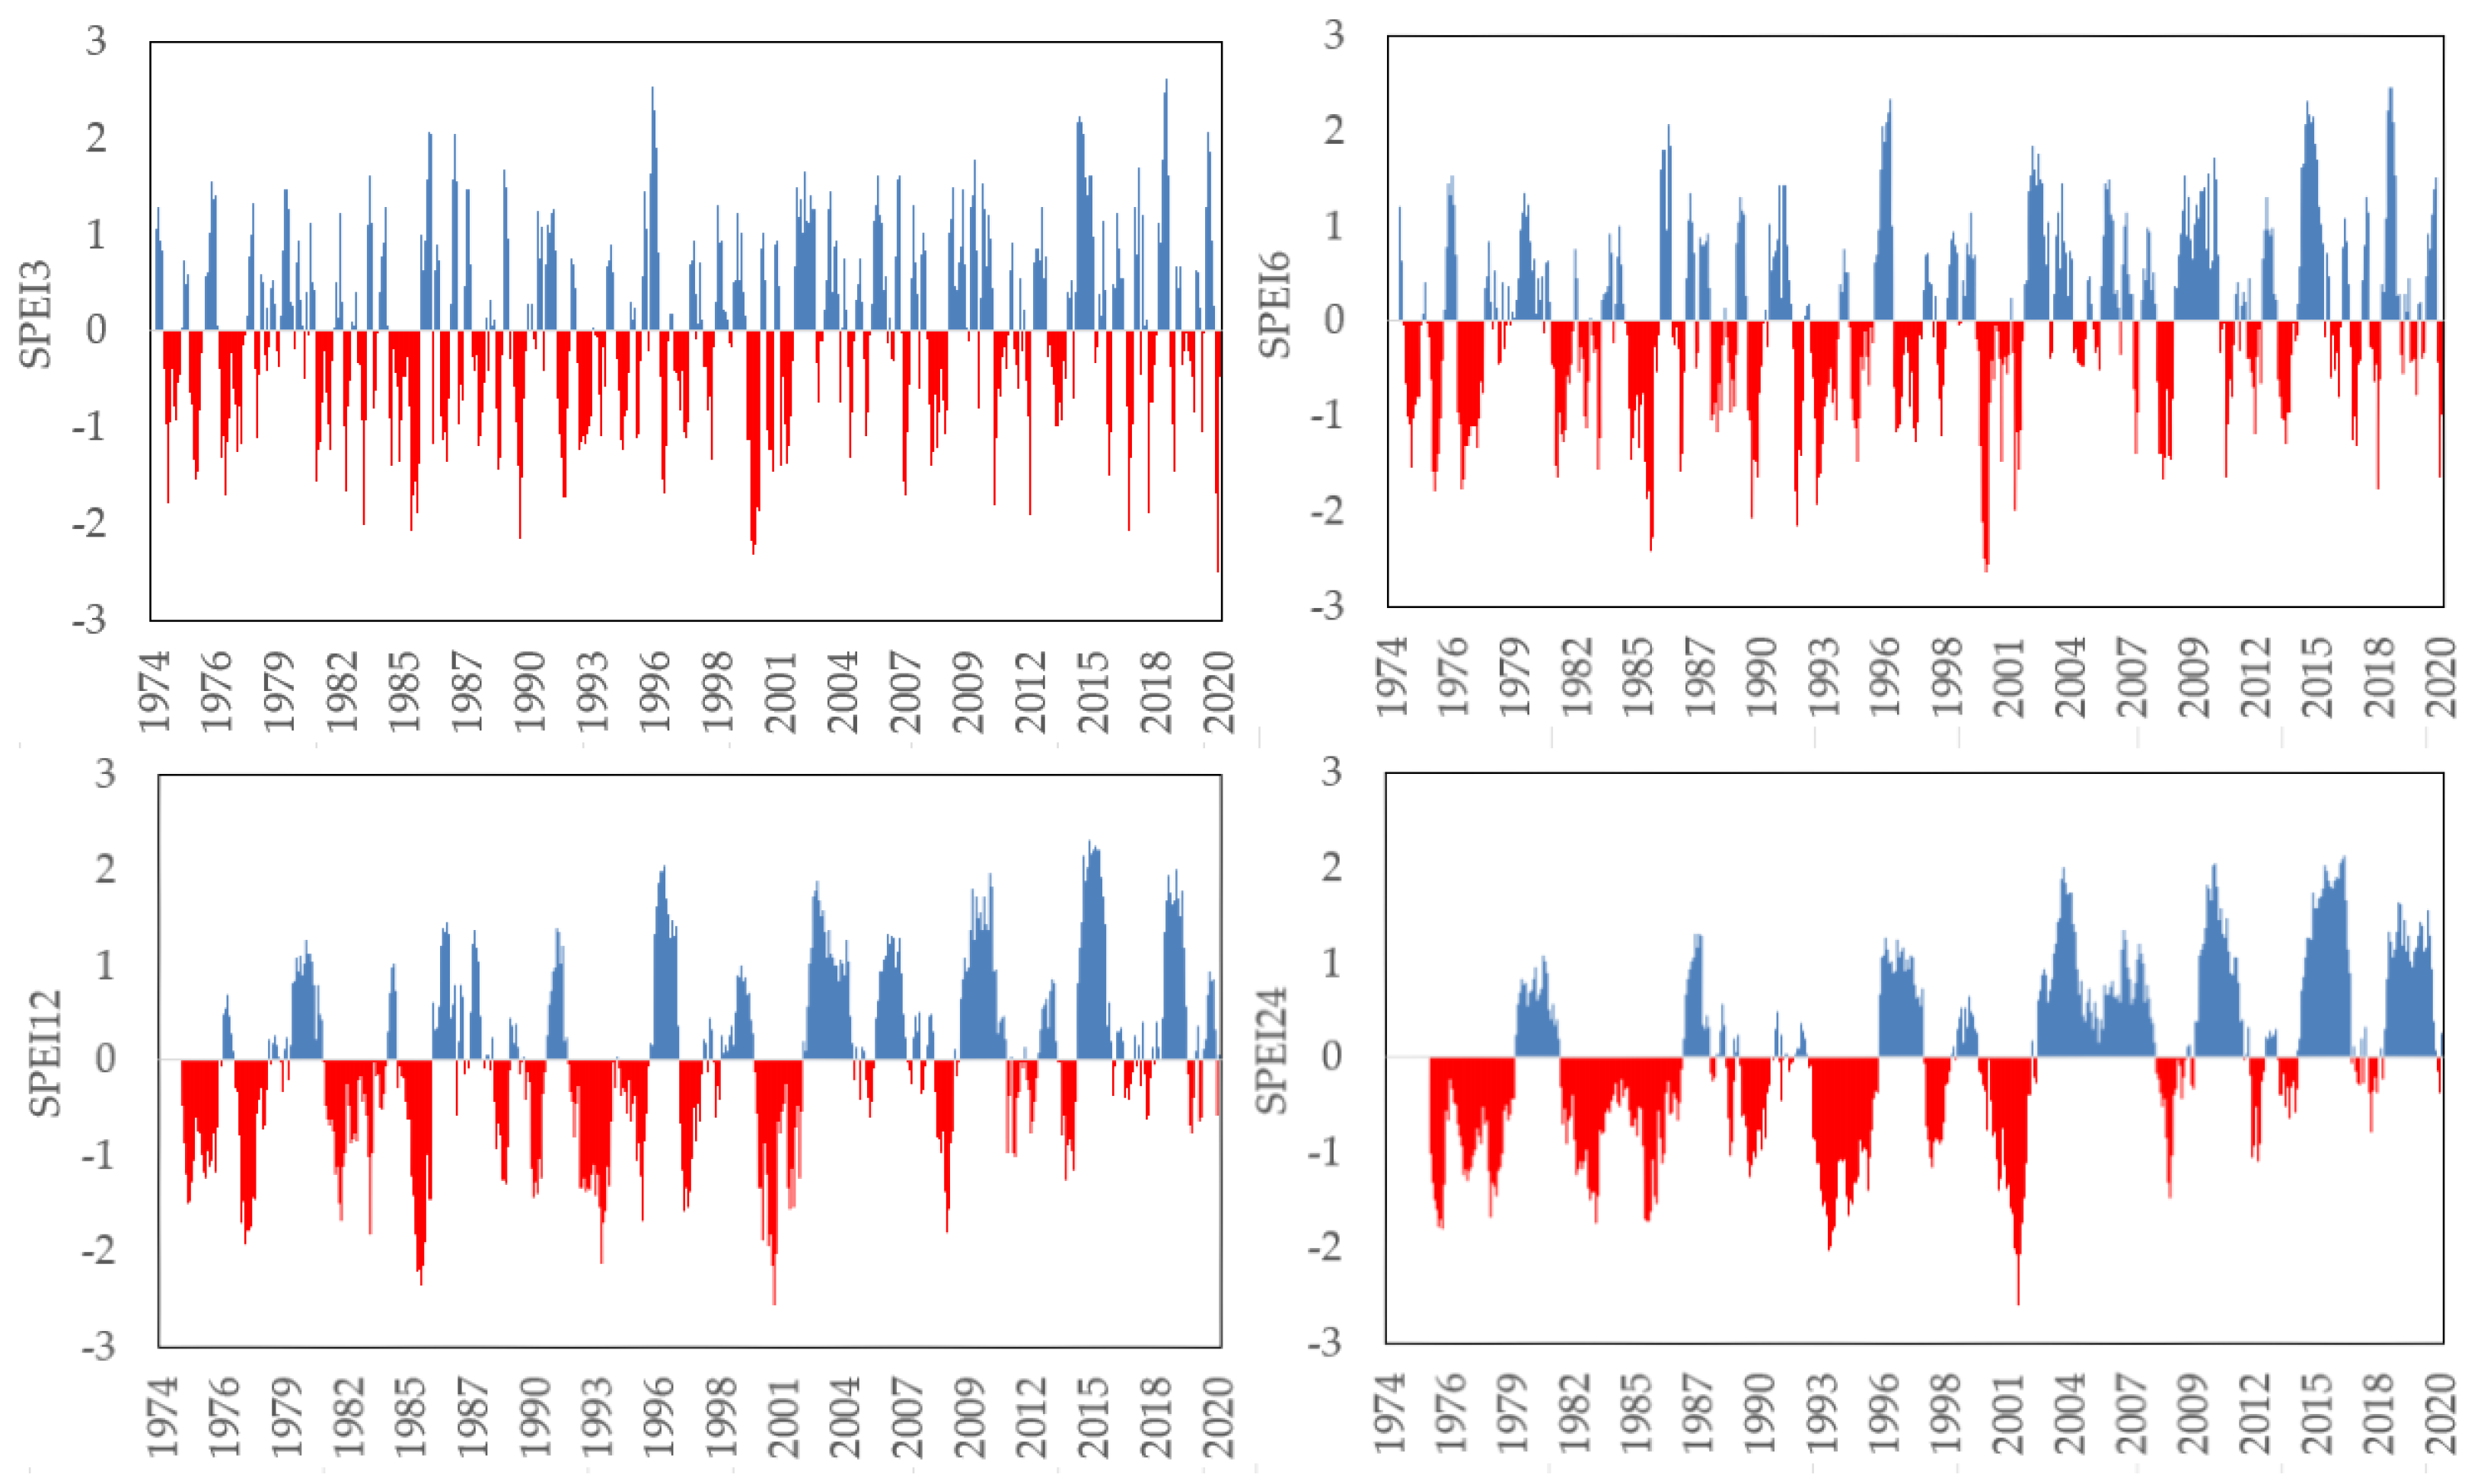
2.2. The Standardized Precipitation Evapotranspiration (SPEI) Drougth Index
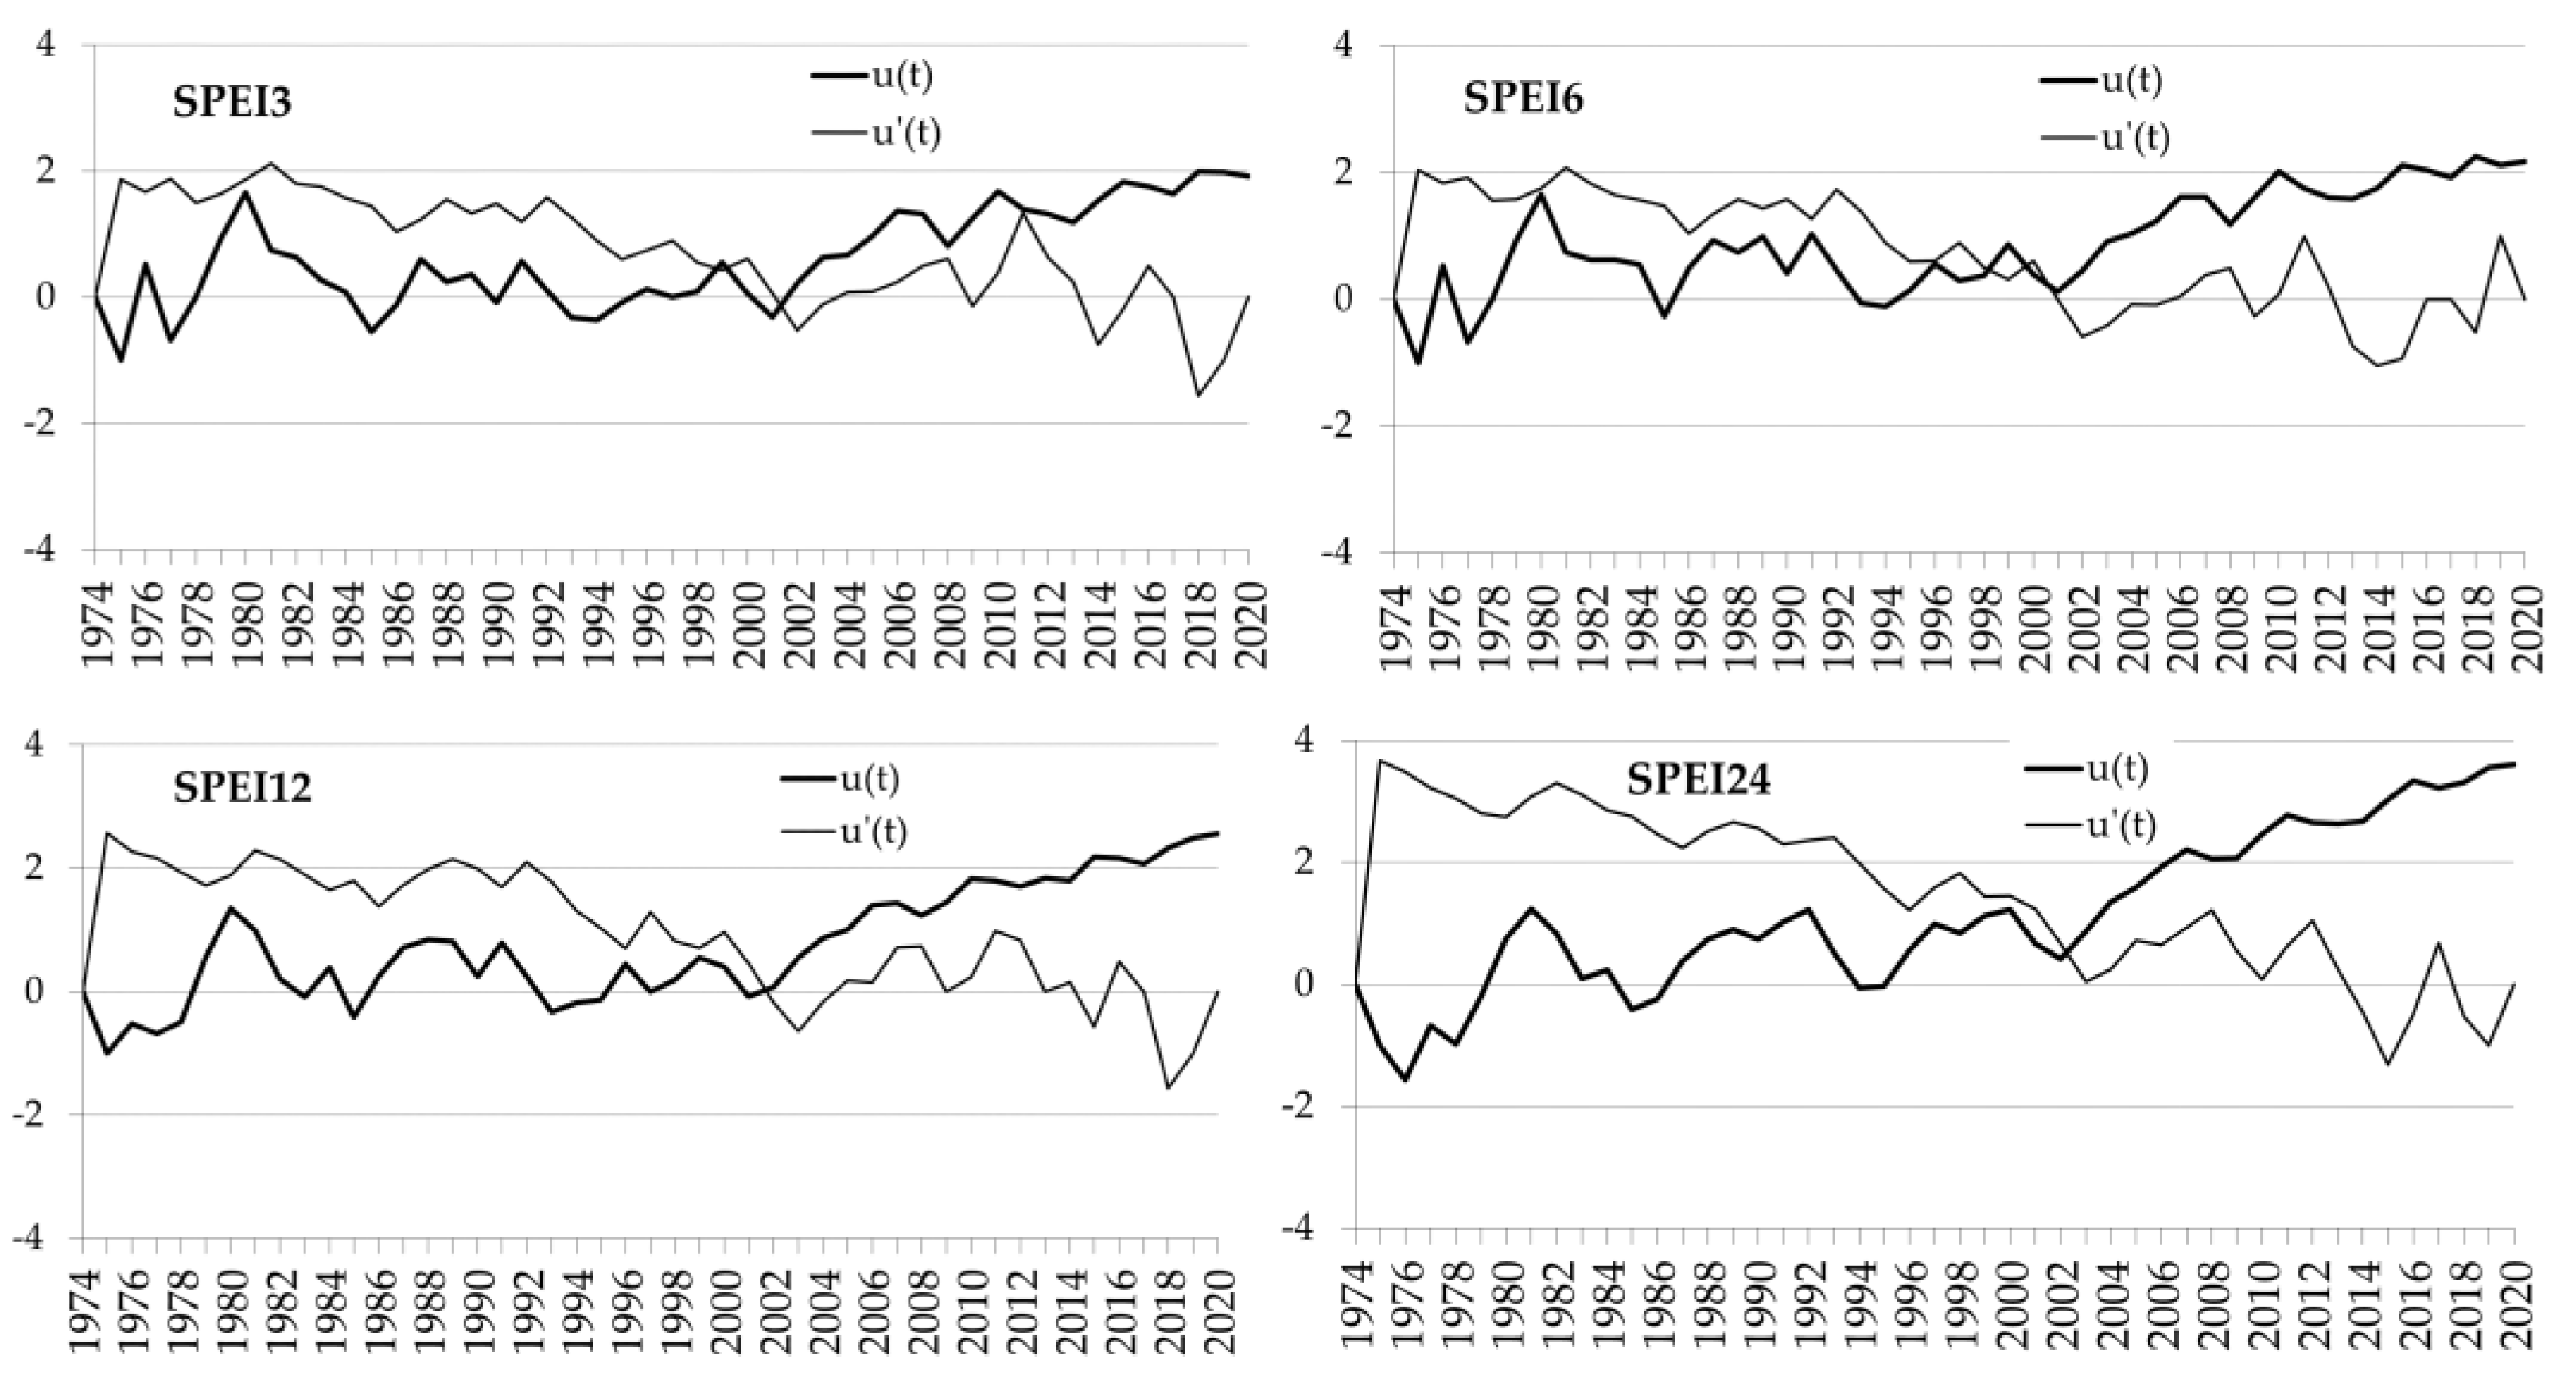
2.3. Trend Analysis of Droughts
3. Results and Discussion
4. Conclusions
Author Contributions
Funding
Institutional Review Board Statement
Informed Consent Statement
Data Availability Statement
Conflicts of Interest
References
- World Meteorological Organization (WMO). Drought; SER-5; WMO: Geneva, Switzerland, 1975. [Google Scholar]
- Centre for Research on the Epidemiology of Disasters (CRED). CRED Disasters in Numbers 2021. Available online: https://cred.be/sites/default/files/2021_EMDAT_report.pdf (accessed on 23 October 2022).
- Singh, C.; Jain, G.; Sukhwani, V.; Shaw, R. Losses and damages associated with slow-onset events: Urban drought and water insecurity in Asia. Curr. Opin. Environ. Sustain. 2021, 50, 72–86. [Google Scholar]
- Wilhite, D.A. (Ed.) Drought as a Natural Hazard: Concepts and Definitions. In Drought: A Global Assessment; Routledge: London, UK, 2000; pp. 3–18. [Google Scholar]
- Naumann, G.; Spinoni, J.; Vogt, J.V.; Barbosa, P. Assessment of drought damages and their uncertainties in Europe. Environ. Res. Lett. 2015, 10, 124013. [Google Scholar] [CrossRef]
- Naumann, G.; Cammalleri, C.; Mentaschi, L.; Feyen, L. Increased economic drought impacts in Europe with anthropogenic warming. Nat. Clim. Chang. 2021, 11, 485–491. [Google Scholar] [CrossRef]
- Bachmair, S.; Stahl, K.; Collins, K.; Hannaford, J.; Acreman, M.; Svoboda, M.; Knutson, C.; Helm Smith, K.; Wall, N.; Fuchs, B.; et al. Drought Indicators Revisited: The Need for a Wider Consideration of Environment and Society. Wiley Interdiscip. Rev. Water 2016, 3, 516–536. [Google Scholar]
- Salvador, C.; Nieto, R.; Linares, C.; Díaz, J.; Gimeno, L. Effects of droughts on health: Diagnosis, repercussion, and adaptation in vulnerable regions under climate change. Challenges for future research. Sci. Total Environ. 2020, 703, 134912. [Google Scholar] [PubMed]
- Shadman, F.; Sadeghipour, S.; Moghavvemi, M.; Saidur, R. Drought and energy security in key ASEAN countries. Renew. Sustain. Energy Rev. 2016, 53, 50–58. [Google Scholar] [CrossRef]
- He, X.; Estes, L.; Konar, M.; Tian, D.; Anghileri, D.; Baylis, K.; Evans, T.P.; Sheffield, J. Integrated approaches to understanding and reducing drought impact on food security across scales. Curr. Opin. Environ. Sustain. 2019, 40, 43–54. [Google Scholar] [CrossRef]
- Myronidis, D.; Stathis, D.; Ioannou, K.; Fotakis, D. An integration of statistics temporal methods to track the effect of drought in a shallow Mediterranean Lake. Water Resour. Manag. 2012, 26, 4587–4605. [Google Scholar] [CrossRef]
- Dimitrakopoulos, A.P.; Vlahou, M.; Anagnostopoulou, C.G.; Mitsopoulos, I.D. Impact of drought on wildland fires in Greece: Implications of climatic change? Clim. Chang. 2011, 109, 331–347. [Google Scholar]
- Derner, J.D.; Augustine, D.J. Adaptive management for drought on rangelands. Rangelands 2016, 38, 211–215. [Google Scholar] [CrossRef] [Green Version]
- Proutsos, N.; Tigkas, D. Growth response of endemic black pine trees to meteorological variations and drought episodes in a Mediterranean region. Atmosphere 2020, 11, 554. [Google Scholar] [CrossRef]
- World Meteorological Organization (WMO). Drought Monitoring and Early Warning: Concepts, Progress and Future Challenges; WMO No. 1006; World Meteorological Organization (WMO): Geneva, Switzerland, 2006; Available online: http://www.wamis.org/agm/pubs/brochures/WMO1006e.pdf (accessed on 25 October 2022).
- Vicente-Serrano, S.M.; Van der Schrier, G.; Beguería, S.; Azorin-Molina, C.; Lopez-Moreno, J.I. Contribution of precipitation and reference evapotranspiration to drought indices under different climates. J. Hydrol. 2015, 526, 42–54. [Google Scholar] [CrossRef] [Green Version]
- Cook, B.I.; Anchukaitis, K.J.; Touchan, R.; Meko, D.M.; Cook, E.R. Spatiotemporal drought variability in the Mediterranean over the last 900 years. J. Geophys. Res. Atmos. 2016, 121, 2060–2074. [Google Scholar] [PubMed]
- Giorgi, F.; Lionello, P. Climate change projections for the Mediterranean region. Glob. Planet. Chang. 2008, 63, 90–104. [Google Scholar] [CrossRef]
- Diffenbaugh, N.S.; Giorgi, F. Climate change hotspots in the CMIP5 global climate model ensemble. Clim. Chang. 2012, 114, 813–822. [Google Scholar] [CrossRef] [PubMed] [Green Version]
- IPCC. Climate Change 2021: The physical science basis. In Contribution of Working Group, I to the Sixth Assessment Report of the Intergovernmental Panel on Climate Change; Cambridge University Press: Cambridge, UK, 2021. [Google Scholar]
- Vicente-Serrano, S.M.; Quiring, S.M.; Pena-Gallardo, M.; Yuan, S.; Dominguez-Castro, F. A review of environmental droughts: Increased risk under global warming? Earth-Sci. Rev. 2020, 201, 102953. [Google Scholar]
- Cammalleri, C.; Naumann, G.; Mentaschi, L.; Formetta, G.; Forzieri, G.; Gosling, S.; Bisselink, B.; de Roo, A.; Feyen, L. Global Warming and Drought Impacts in the EU; Publications Office of the European Union: Luxembourg, 2020; ISBN 978-92-76-12947-9. [Google Scholar]
- Liu, X.; Zhu, X.; Pan, Y.; Li, S.; Liu, Y.; Ma, Y. Agricultural drought monitoring: Progress, challenges, and prospects. J. Geogr. Sci. 2016, 26, 750–767. [Google Scholar]
- Palmer, W.C. Meteorological Drought; US Department of Commerce, Weather Bureau; National Weather Service: Washington, WA, USA, 1965; Volume 30. [Google Scholar]
- Mckee, T.B.; Doesken, N.J.; Kleist, J. The relation of drought frequency and duration to time scales. In Proceedings of the Eighth Conference on Applied Climatology, Anaheim, CA, USA, 17–22 January 1993; Department of Atmospheric Science Colorado State University: Fort Collins, CO, USA, 1993; Volume 17, pp. 179–184. [Google Scholar]
- Vicente-Serrano, S.M.; Beguería, S.; López-Moreno, J.I. A multiscalar drought index sensitive to global warming: The standardized precipitation evapotranspiration index. J. Clim. 2010, 23, 1696–1718. [Google Scholar]
- Tsakiris, G.; Pangalou, D.; Vangelis, H. Regional drought assessment based on the Reconnaissance Drought Index (RDI). Water Resour. Manag. 2007, 21, 821–833. [Google Scholar]
- Aksu, H.; Cavus, Y.; Aksoy, H.; Akgul, M.A.; Turker, S.; Eris, E. Spatiotemporal analysis of drought by CHIRPS precipitation estimates. Theor. Appl. Climatol. 2022, 148, 517–529. [Google Scholar]
- Pyarali, K.; Peng, J.; Disse, M.; Tuo, Y. Development and application of high resolution SPEI drought dataset for Central Asia. Sci. Data 2022, 9, 1–14. [Google Scholar] [CrossRef] [PubMed]
- Shahzaman, M.; Zhu, W.; Ullah, I.; Mustafa, F.; Bilal, M.; Ishfaq, S.; Nisar, S.; Arshad, M.; Iqbal, R.; Aslam, R.W. Comparison of Multi-Year Reanalysis, Models, and Satellite Remote Sensing Products for Agricultural Drought Monitoring over South Asian Countries. Remote Sens. 2021, 13, 3294. [Google Scholar] [CrossRef]
- Ghaleb, F.; Mario, M.; Sandra, A.N. Regional Landsat-based drought monitoring from 1982 to 2014. Climate 2015, 3, 563–577. [Google Scholar] [CrossRef] [Green Version]
- Peters, A.J.; Walter-Shea, E.A.; Ji, L.; Vina, A.; Hayes, M.; Svoboda, M.D. Drought monitoring with NDVI-based standardized vegetation index. Photogramm. Eng. Remote Sens. 2002, 68, 71–75. [Google Scholar]
- Tucker, C.J. Red and photographic infrared linear combinations for monitoring vegetation. Remote Sens. Environ. 1979, 8, 127–150. [Google Scholar] [CrossRef]
- Huete, A.; Didan, K.; Miura, T.; Rodriguez, E.P.; Gao, X.; Ferreira, L.G. Overview of the radiometric and biophysical performance of the MODIS vegetation indices. Remote Sens. Environ. 2002, 83, 195–213. [Google Scholar] [CrossRef]
- Kogan, F.N. Application of vegetation index and brightness temperature for drought detection. Adv. Space Res. 1995, 15, 91–100. [Google Scholar] [CrossRef]
- Gao, B.C. NDWI—A normalized difference water index for Remote Sensing of vegetation liquid water from space. Remote Sens. Environ. 1996, 58, 257–266. [Google Scholar] [CrossRef]
- Xiao, X.; Zhang, Q.; Braswell, B.; Urbanski, S.; Boles, S.; Wofsy, S.; Moore, B., III; Ojima, D. Modeling gross primary production of temperate deciduous broadleaf forest using satellite images and climate data. Remote Sens. Environ. 2004, 91, 256–270. [Google Scholar] [CrossRef]
- Bajgain, R.; Xiao, X.; Wagle, P.; Basara, J.; Zhou, Y. Sensitivity analysis of vegetation indices to drought over two tallgrass prairie sites. ISPRS J. Photogramm. Remote Sens. 2015, 108, 151–160. [Google Scholar] [CrossRef]
- Moreno-Fernandez, D.; Viana-Soto, A.; Camarero, J.J.; Zavala, M.A.; Tijerín, J.; Garcia, M. Using spectral indices as early warning signals of forest dieback: The case of drought-prone Pinus pinaster forests. Sci. Total Environ. 2021, 793, 148578. [Google Scholar] [PubMed]
- Horion, S.; Carrão, H.; Singleton, A.; Barbosa, P.; Vogt, J. JRC Experience on the Development of Drought Information Systems. Europe, Africa and Latin America. EUR, 25235. 2012. Available online: https://publications.jrc.ec.europa.eu/repository/handle/JRC68769 (accessed on 25 October 2022).
- Allen, C.D.; Macalady, A.K.; Chenchouni, H.; Bachelet, D.; McDowell, N.; Vennetier, M.; Kitzberger, T.; Rigling, A.; Breshears, D.D.; Hogg, E.H.; et al. A global overview of drought and heat-induced tree mortality reveals emerging climate change risks for forests. For. Ecol. Manag. 2010, 259, 660–684. [Google Scholar]
- Linares, J.C.; Camarero, J.J.; Carreira, J.A. Competition modulates the adaptation capacity of forests to climatic stress: Insights from recent growth decline and death in relict stands of the Mediterranean fir Abies pinsapo. J. Ecol. 2010, 98, 592–603. [Google Scholar]
- Zhao, M.S.; Running, S.W. Drought-induced reduction in global terrestrial net primary production from 2000 Through 2009. Science 2010, 329, 940–943. [Google Scholar] [CrossRef] [PubMed] [Green Version]
- Hanke, H.; Borjeson, L.; Hylander, K.; Enfors-Kautsky, E. Drought tolerant species dominate as rainfall and tree cover returns in the West African Sahel. Land Use Policy 2016, 59, 111–120. [Google Scholar] [CrossRef] [Green Version]
- Parente, J.; Amraoui, M.; Menezes, I.; Pereira, M.G. Drought in Portugal: Current regime, comparison of indices and impacts on extreme wildfires. Sci. Total Environ. 2019, 685, 150–173. [Google Scholar]
- Vicente-Serrano, S.M.; López-Moreno, J.I. Hydrological response to different time scales of climatological drought: An evaluation of the Standardized Precipitation Index in a mountainous Mediterranean basin. Hydrol. Earth Syst. Sci. 2005, 9, 523–533. [Google Scholar]
- Tsiros, I.X.; Nastos, P.; Proutsos, N.D.; Tsaousidis, A. Variability of the aridity index and related drought parameters in Greece using climatological data over the last century (1900–1997). Atmos. Res. 2020, 240, 104914. [Google Scholar] [CrossRef]
- Stefanidis, S.; Alexandridis, V. Precipitation and potential evapotranspiration temporal variability and their relationship in two forest ecosystems in Greece. Hydrology 2021, 8, 160. [Google Scholar] [CrossRef]
- Proutsos, N.D.; Tsiros, I.X.; Nastos, P.; Tsaousidis, A. A note on some uncertainties associated with Thornthwaite’s aridity index introduced by using different potential evapotranspiration methods. Atmos. Res. 2021, 260, 105727. [Google Scholar] [CrossRef]
- Proutsos, N.; Korakaki, E.; Bourletsikas, A.; Solomou, A.; Avramidou, E.V.; Georgiadis, C.; Kontogianni, A.B.; Tsagari, K. Urban temperature trends in east Mediterranean: The case of Heraklion-Crete. Eur. Water 2020, 69, 3–14. [Google Scholar]
- Cherubini, P.; Battipaglia, G.; Innes, J.L. Tree vitality and forest health: Can tree-ring stable isotopes be used as indicators? Curr. For. Rep. 2021, 7, 69–80. [Google Scholar]
- Anderson-Teixeira, K.J.; Herrmann, V.; Rollinson, C.R.; Gonzalez, B.; Gonzalez-Akre, E.B.; Pederson, N.; Alexander, M.R.; Allen, C.D.; Alfaro-Sánchez, R.; Awada, T.; et al. Joint effects of climate, tree size, and year on annual tree growth derived from tree-ring records of ten globally distributed forests. Glob. Chang. Biol. 2022, 28, 245–266. [Google Scholar] [PubMed]
- Köppen, W. Grundriss der Klimakunde; Walter de Gruyter: Berlin, Germany, 1931. [Google Scholar]
- Proutsos, N.; Liakatas, A.; Alexandris, S.; Tsiros, I. Carbon fluxes above a deciduous forest in Greece. Atmósfera 2017, 30, 311–322. [Google Scholar] [CrossRef] [Green Version]
- Jiang, W.; Wang, L.; Feng, L.; Zhang, M.; Yao, R. Drought characteristics and its impact on changes in surface vegetation from 1981 to 2015 in the Yangtze River Basin, China. Int. J. Climatol. 2020, 40, 3380–3397. [Google Scholar]
- Thornthwaite, C.W. An approach toward a rational classification of climate. Geogr. Rev. 1948, 38, 55–94. [Google Scholar] [CrossRef]
- Xingcai, L.; Zongxue, X.; Bo, L. Spatio-temporal characteristics of standardized precipitation index in the Taihu Basin during 1951–2000. J Nat. Sci. 2009, 14, 518–524. [Google Scholar]
- Mishra, A.K.; Singh, V.P.; Desai, V.R. Drought characterization: A probabilistic approach. Stoch. Environ. Res. Risk Assess. 2009, 23, 41–55. [Google Scholar] [CrossRef]
- Goossens, C.; Berger, A. Annual and seasonal climatic variations over the northern hemisphere and Europe during the last century. Ann. Geophys. 1986, 4, 385–400. [Google Scholar]
- Sneyers, R. Technical Note No 143 on the Statistical Analysis of Series of Observations; World Meteorological Organization: Geneva, Switzerland, 1990. [Google Scholar]
- Bourletsikas, A.; Proutsos, N.; Michopoulos, P.; Argyrokastritis, I. Temporal Variations in Temperature and Moisture Soil Profiles in a Mediterranean Maquis Forest in Greece. Hydrology 2023, 10, 93. [Google Scholar] [CrossRef]
- Proutsos, N.; Tsagari, C.; Tsaousidis, A.; Tsiros, I.X. Water availability changes for natural vegetation development in the mountainous area of Metsovo (N. Greece) for the period 1960–2000. In Proceedings of the 15th International Conference on Meteorology, Climatology and Atmospheric Physics, Ioannina, Greece, 26–29 September 2021; pp. 564–568. [Google Scholar]
- Proutsos, N.D.; Solomou, A.D.; Bourletsikas, A.; Chatzipavlis, N.E.; Petropoulou, M.; Bourazani, K.; Nikolopoulos, J.N.; Georgiadis, C.; Kontogianni, A.B. Assessing drought for the period 1955–2021 in Heraklion-Crete (S. Greece) urban environment. In Proceedings of the 10th International Conference on Information and Communication Technologies in Agriculture, Food and Environment, HAICTA, Athens, Greece, 22–25 September 2022; pp. 464–470. [Google Scholar]
- Proutsos, N.D.; Solomou, A.D.; Koulelis, P.P.; Bourletsikas, A.; Chatzipavlis, N.E.; Tigkas, D. Detecting changes in annual precipitation trends during the last two climatic periods (1955–1984 and 1985–2018) in Nestos River basin, N Greece. In Proceedings of the 10th International Conference on Information and Communication Technologies in Agriculture, Food and Environment, HAICTA, Athens, Greece, 22–25 September 2022; pp. 456–463. [Google Scholar]
- Proutsos, N.D.; Tigkas, D.; Tsevreni, I.; Tsevreni, M. Drought assessment in Nestos river basin (N. Greece) for the period 1955–2018. In Proceedings of the 10th International Conference on Information and Communication Technologies in Agriculture, Food and Environment, HAICTA, Athens, Greece, 22–25 September 2022; pp. 429–437. [Google Scholar]
- Proutsos, N.D.; Solomou, A.D.; Tigkas, D. Decadal variation of aridity and water balance attributes at the urban and peri-urban environment of Attica-Greece. In Proceedings of the 10th International Conference on Information and Communication Technologies in Agriculture, Food and Environment, HAICTA, Athens, Greece, 22–25 September 2022; pp. 472–477. [Google Scholar]
- Myronidis, D.; Nikolaos, T. Changes in climatic patterns and tourism and their concomitant effect on drinking water transfers into the region of South Aegean, Greece. Stoch. Environ. Res. Risk Assess. 2021, 35, 1725–1739. [Google Scholar] [PubMed]
- Feidas, H.; Noulopoulou, C.; Makrogiannis, T.; Bora-Senta, E. Trend analysis of precipitation time series in Greece and their relationship with circulation using surface and satellite data: 1955–2001. Arch. Meteorol. Geophys. Bioclimatol. Ser. B 2006, 87, 155–177. [Google Scholar]
- Philandras, C.M.; Nastos, P.T.; Kapsomenakis, J.; Douvis, K.C.; Tselioudis, G.; Zerefos, C.S. Long term precipitation trends and variability within the Mediterranean region. Nat. Hazards Earth Syst. Sci. 2011, 11, 3235–3250. [Google Scholar] [CrossRef] [Green Version]
- Mavromatis, T.; Stathis, D. Response of the water balance in Greece to temperature and precipitation trends. Theor. Appl. Climatol. 2011, 104, 13–24. [Google Scholar] [CrossRef]
- Varlas, G.; Stefanidis, K.; Papaioannou, G.; Panagopoulos, Y.; Pytharoulis, I.; Katsafados, P.; Papadopoulos, A.; Dimitriou, E. Unravelling precipitation trends in Greece since 1950s using ERA5 climate reanalysis data. Climate 2022, 10, 12. [Google Scholar]
- Tsesmelis, D.E.; Leveidioti, I.; Karavitis, C.A.; Kalogeropoulos, K.; Vasilakou, C.G.; Tsatsaris, A.; Zervas, E. Spatiotemporal Application of the Standardized Precipitation Index (SPI) in the Eastern Mediterranean. Climate 2023, 11, 95. [Google Scholar] [CrossRef]


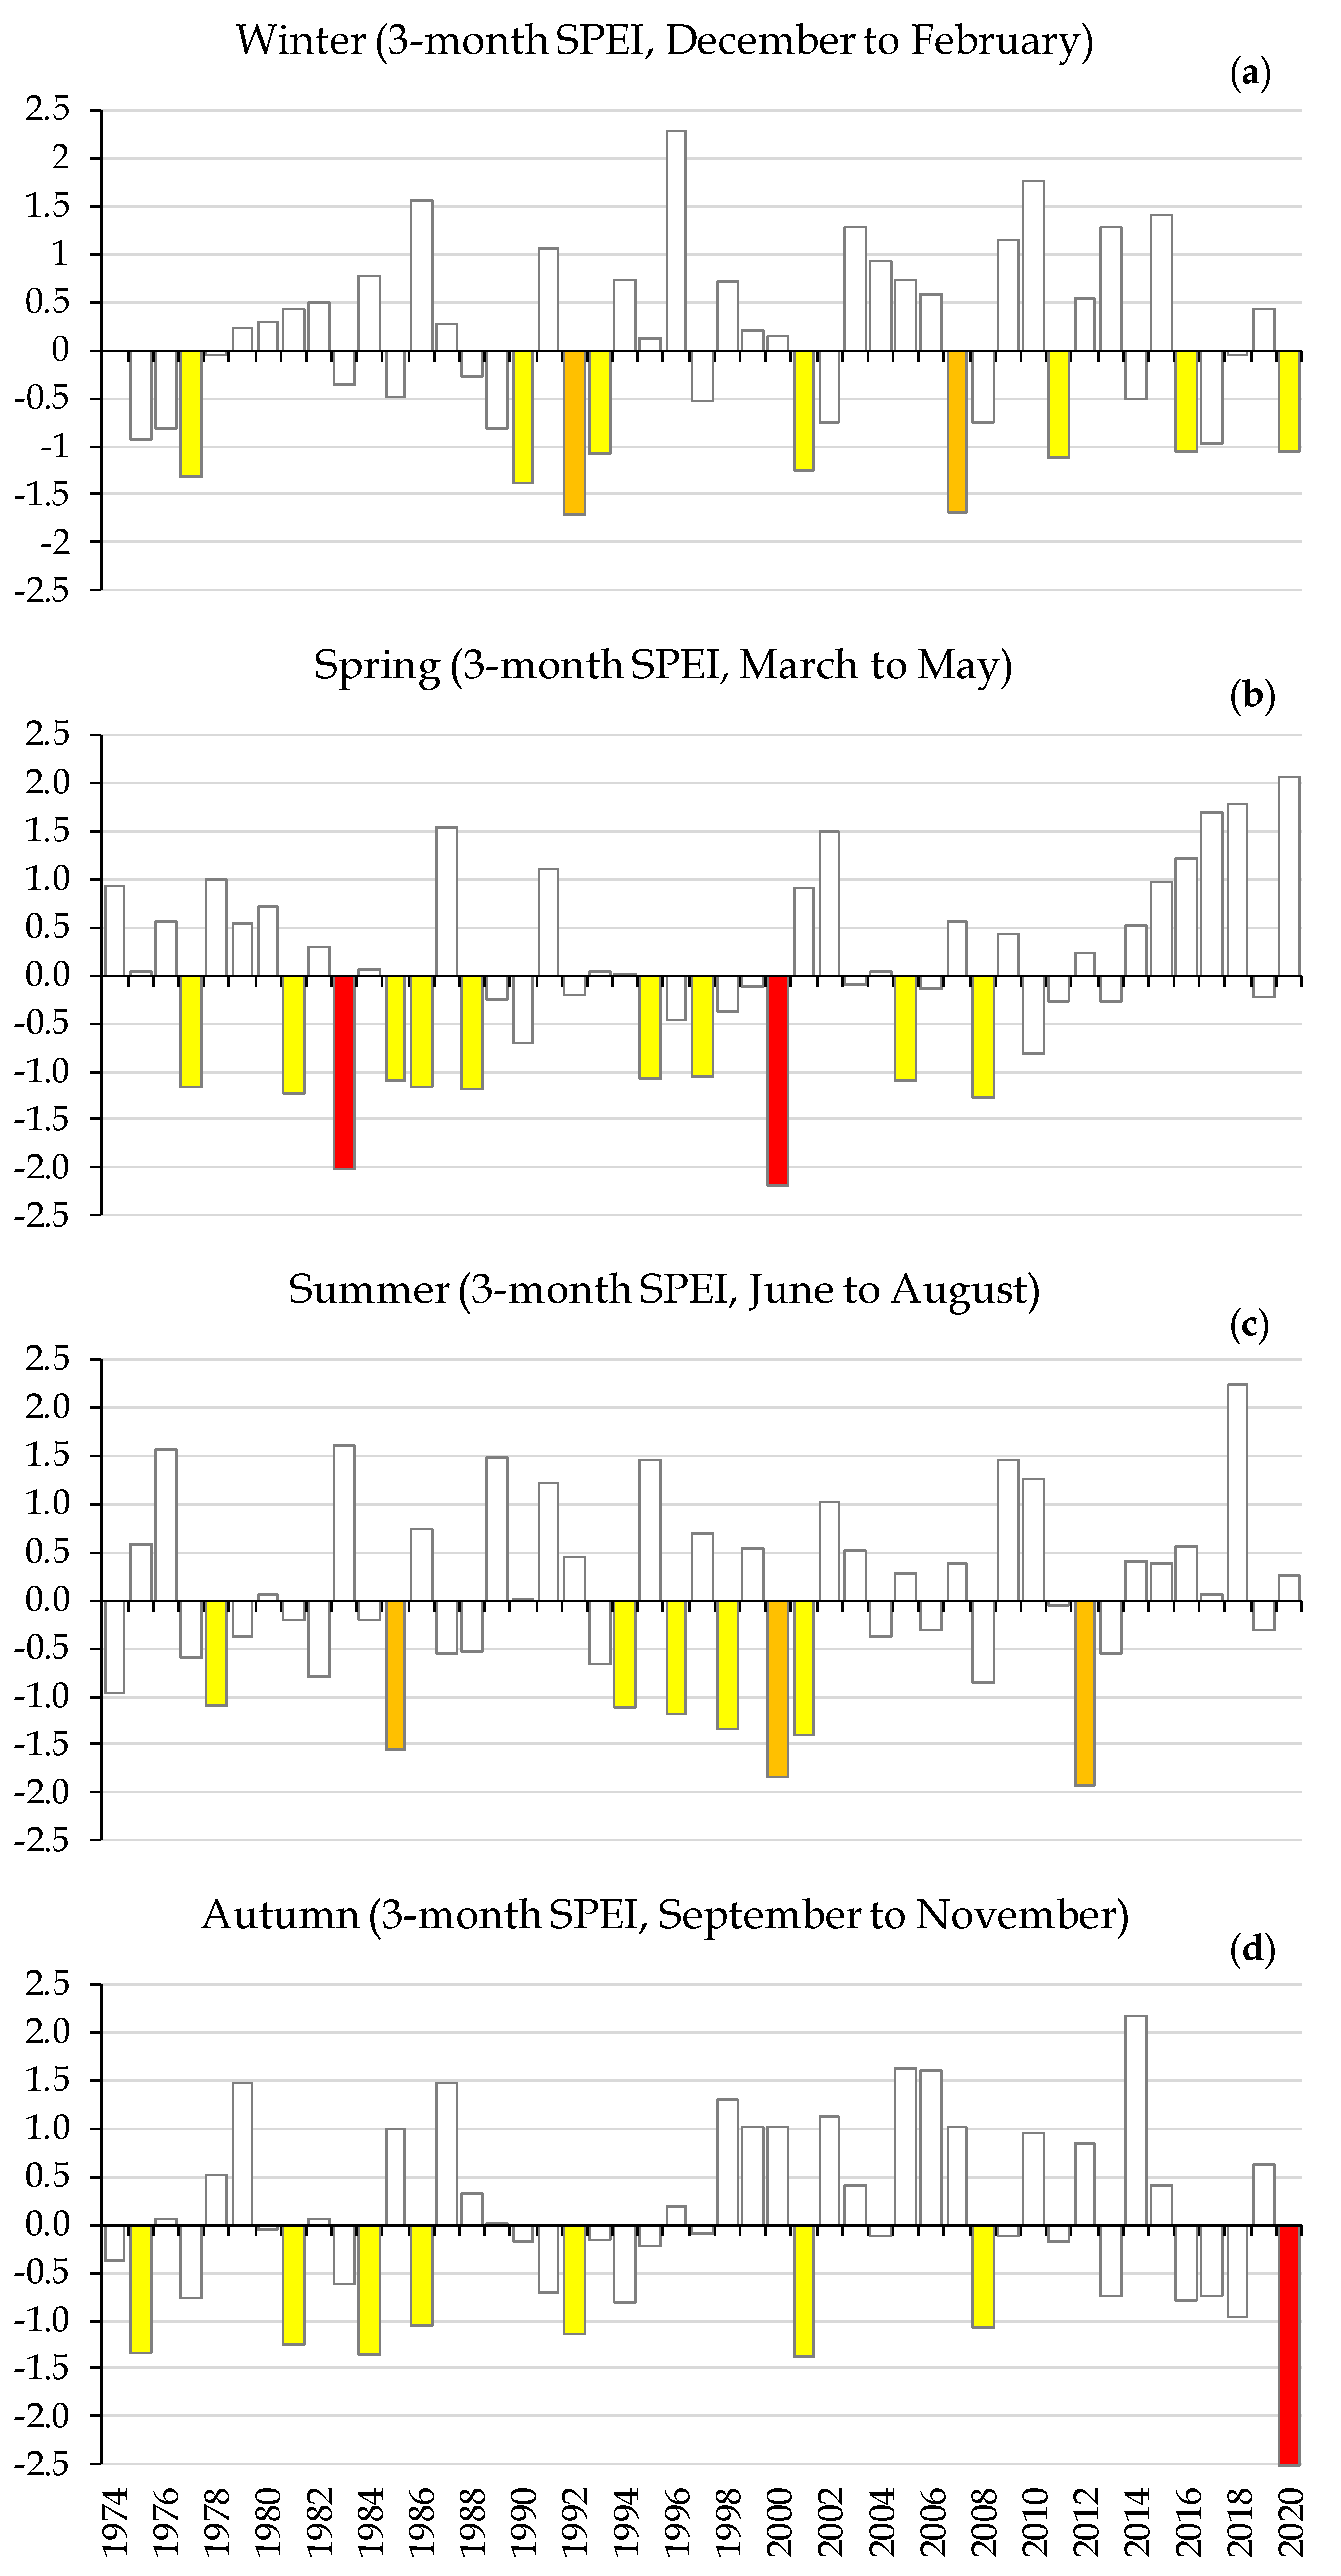
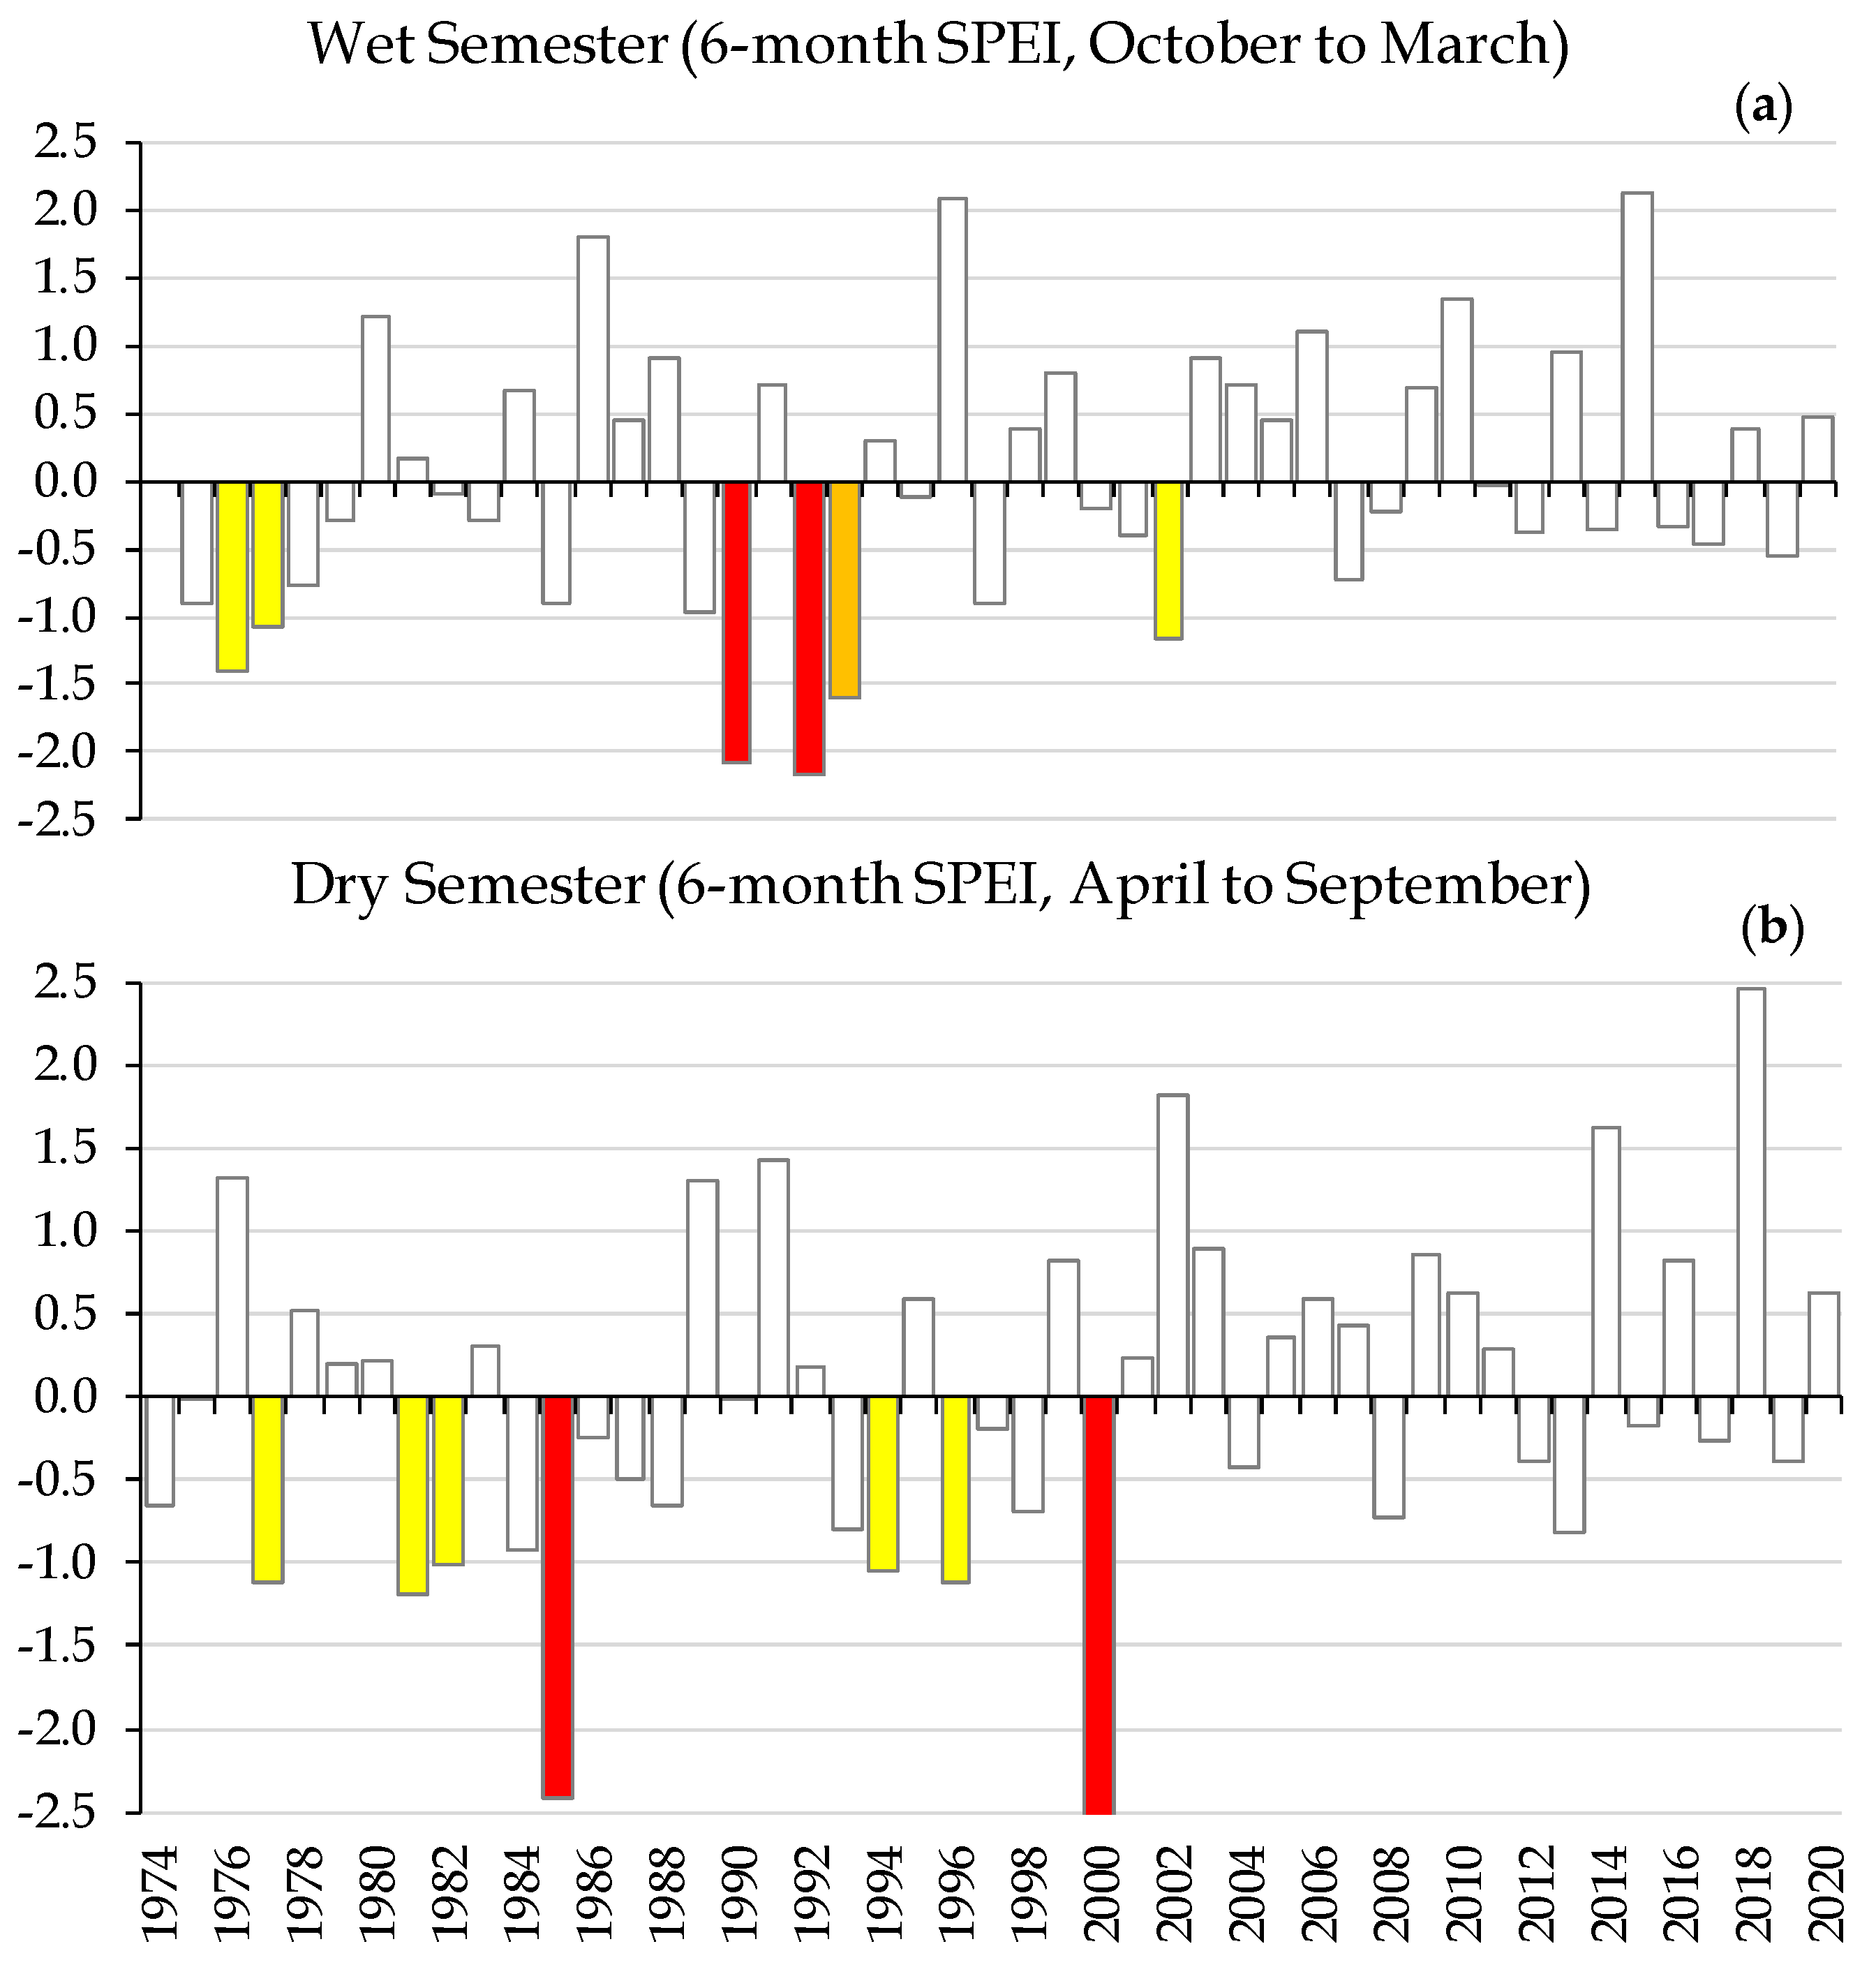
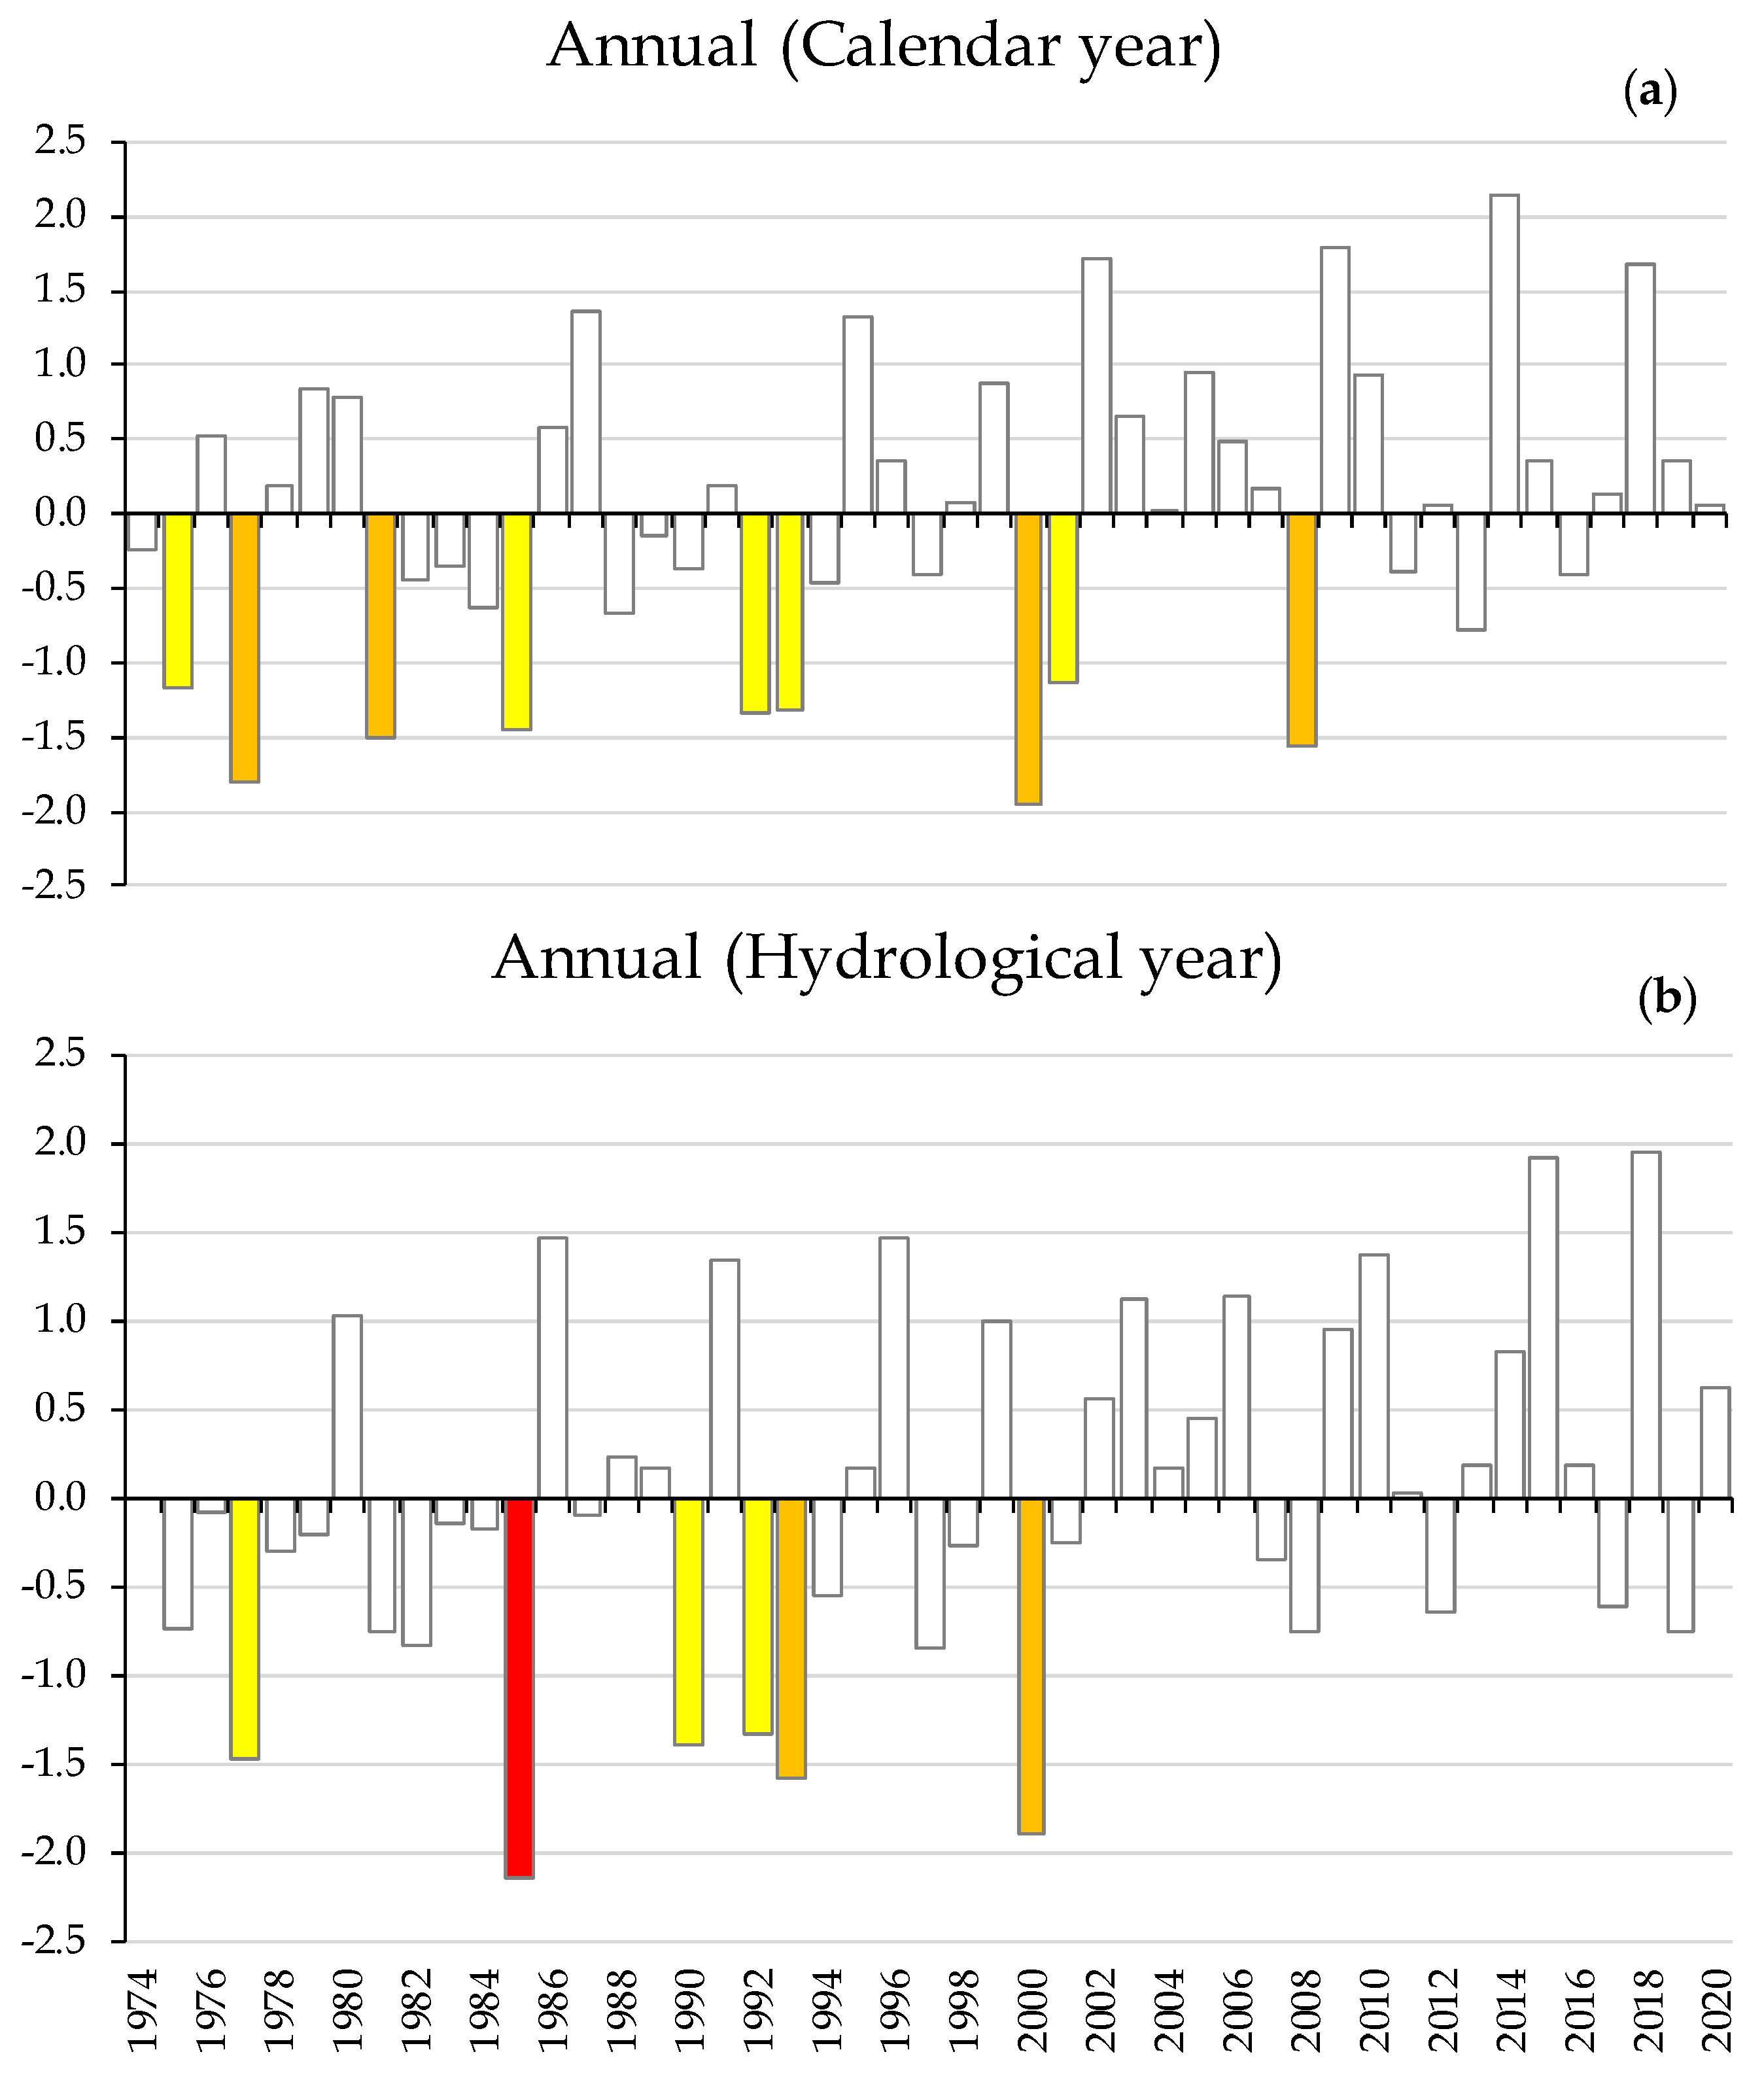
| Categories | SPEI Values |
|---|---|
| Extreme drought | <−2.00 |
| Severe drought | −1.99 to −1.50 |
| Moderate drought | −1.49 to −1.00 |
| Near normal | −0.99 to 0.99 |
| Moderately wet | 1.00 to 1.49 |
| Severely wet | 1.50 to 1.99 |
| Extremely wet | >2.00 |
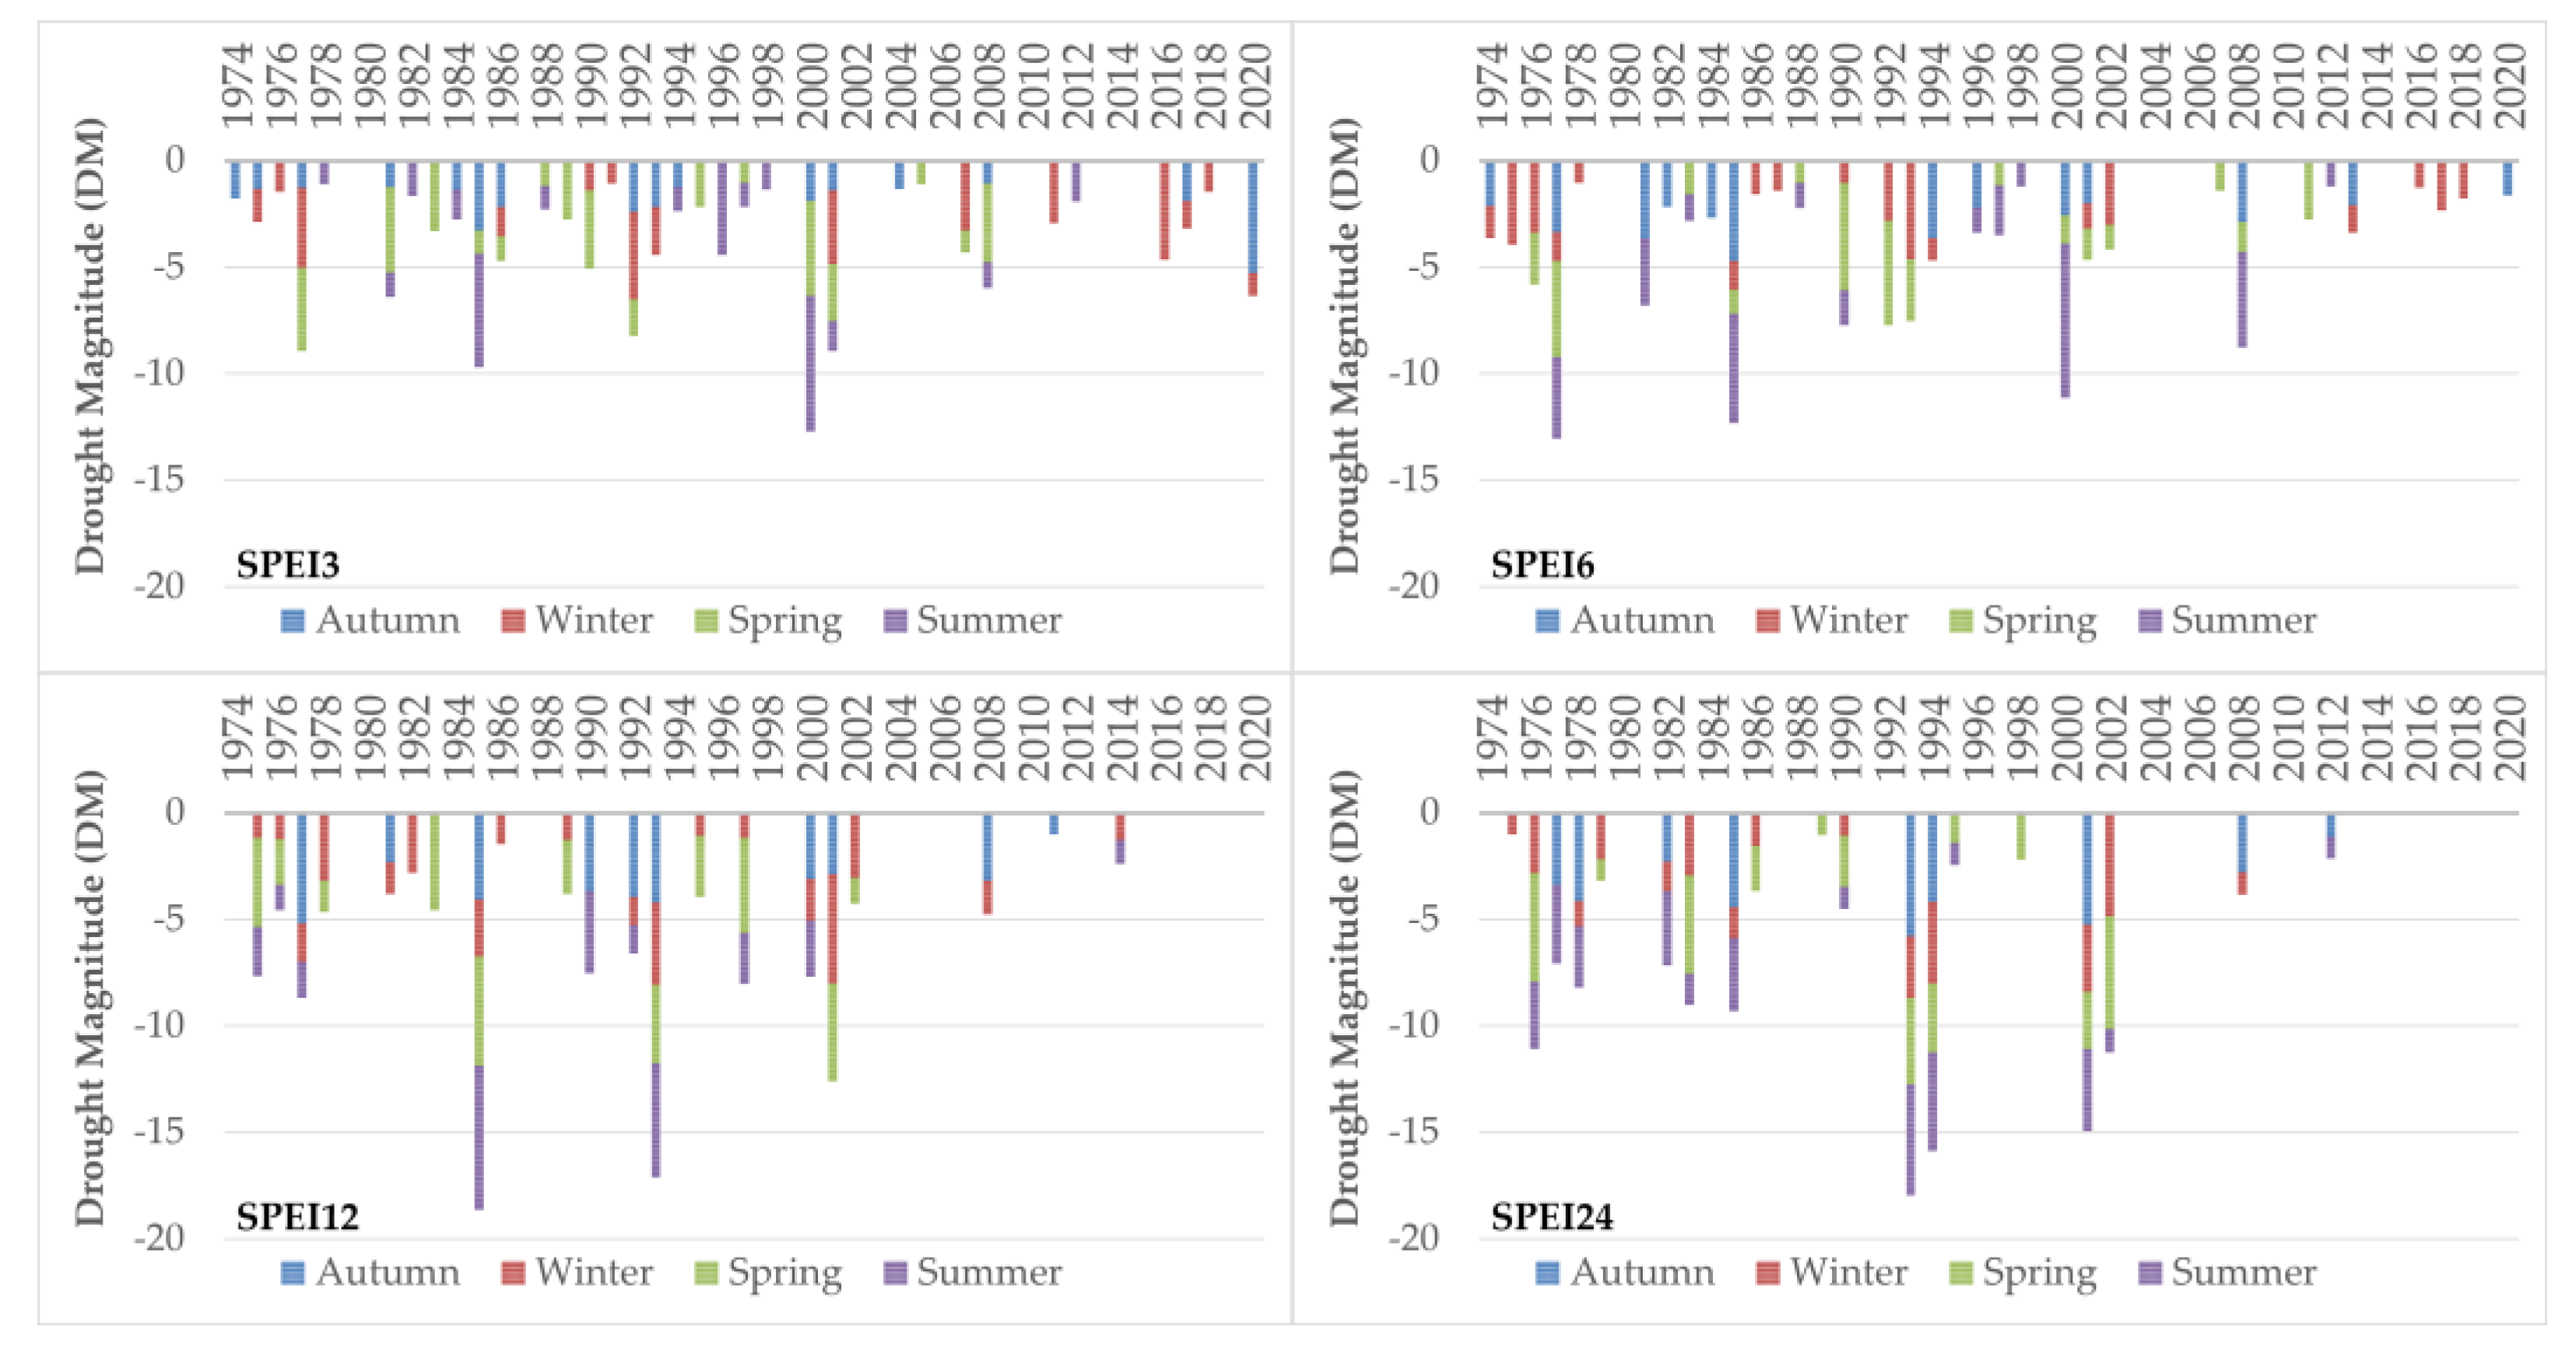
| Drought Index | Drought Characteristics | Moderate Drought | Severe Drought | Extreme Drought | Total |
|---|---|---|---|---|---|
| SPEI3 | Number of episodes | 44 | 16 | 6 | 66 |
| Mean duration | 1.5 | 1.4 | 1.3 | 1.4 | |
| Relative frequency (%) | 7.8 | 2.8 | 1.1 | 11.7 | |
| SPEI6 | Number of episodes | 36 | 16 | 4 | 56 |
| Mean duration | 1.9 | 1.4 | 2 | 1.8 | |
| Relative frequency (%) | 6.4 | 2.9 | 0.7 | 10 | |
| SPEI12 | Number of episodes | 30 | 17 | 3 | 50 |
| Mean duration | 2 | 1.5 | 2.7 | 2.1 | |
| Relative frequency (%) | 5.4 | 3.1 | 0.5 | 9 | |
| SPEI24 | Number of episodes | 26 | 13 | 3 | 42 |
| Mean duration | 2.5 | 1.9 | 2.3 | 2.2 | |
| Relative frequency (%) | 4.8 | 2.4 | 0.6 | 7.8 |
| Annual | Autumn | Winter | Spring | Summer | |
|---|---|---|---|---|---|
| SPEI3 | 1.9 | 1.7 | 1.2 | 1.9 | 0.9 |
| SPEI6 | 2.1 (01) | 1.4 | 1.9 | 1.7 | 1.4 |
| SPEI12 | 2.5 (02) | 1.8 | 2.9 (97) | 2.3 (03) | 2.3 (00) |
| SPEI24 | 3.5 (02) | 2.5 (01) | 3.7 (02) | 3.2 (02) | 3.8 (03) |
Disclaimer/Publisher’s Note: The statements, opinions and data contained in all publications are solely those of the individual author(s) and contributor(s) and not of MDPI and/or the editor(s). MDPI and/or the editor(s) disclaim responsibility for any injury to people or property resulting from any ideas, methods, instructions or products referred to in the content. |
© 2023 by the authors. Licensee MDPI, Basel, Switzerland. This article is an open access article distributed under the terms and conditions of the Creative Commons Attribution (CC BY) license (https://creativecommons.org/licenses/by/4.0/).
Share and Cite
Stefanidis, S.; Rossiou, D.; Proutsos, N. Drought Severity and Trends in a Mediterranean Oak Forest. Hydrology 2023, 10, 167. https://doi.org/10.3390/hydrology10080167
Stefanidis S, Rossiou D, Proutsos N. Drought Severity and Trends in a Mediterranean Oak Forest. Hydrology. 2023; 10(8):167. https://doi.org/10.3390/hydrology10080167
Chicago/Turabian StyleStefanidis, Stefanos, Dimitra Rossiou, and Nikolaos Proutsos. 2023. "Drought Severity and Trends in a Mediterranean Oak Forest" Hydrology 10, no. 8: 167. https://doi.org/10.3390/hydrology10080167