
Monitoring Scour at Bridge Piers in Rivers with Supercritical Flows


Abstract
:1. Introduction
1.1. Numbered Bricks
1.2. Distance Sensors for Scour Measurement
2. Materials and Methods
2.1. Study Site
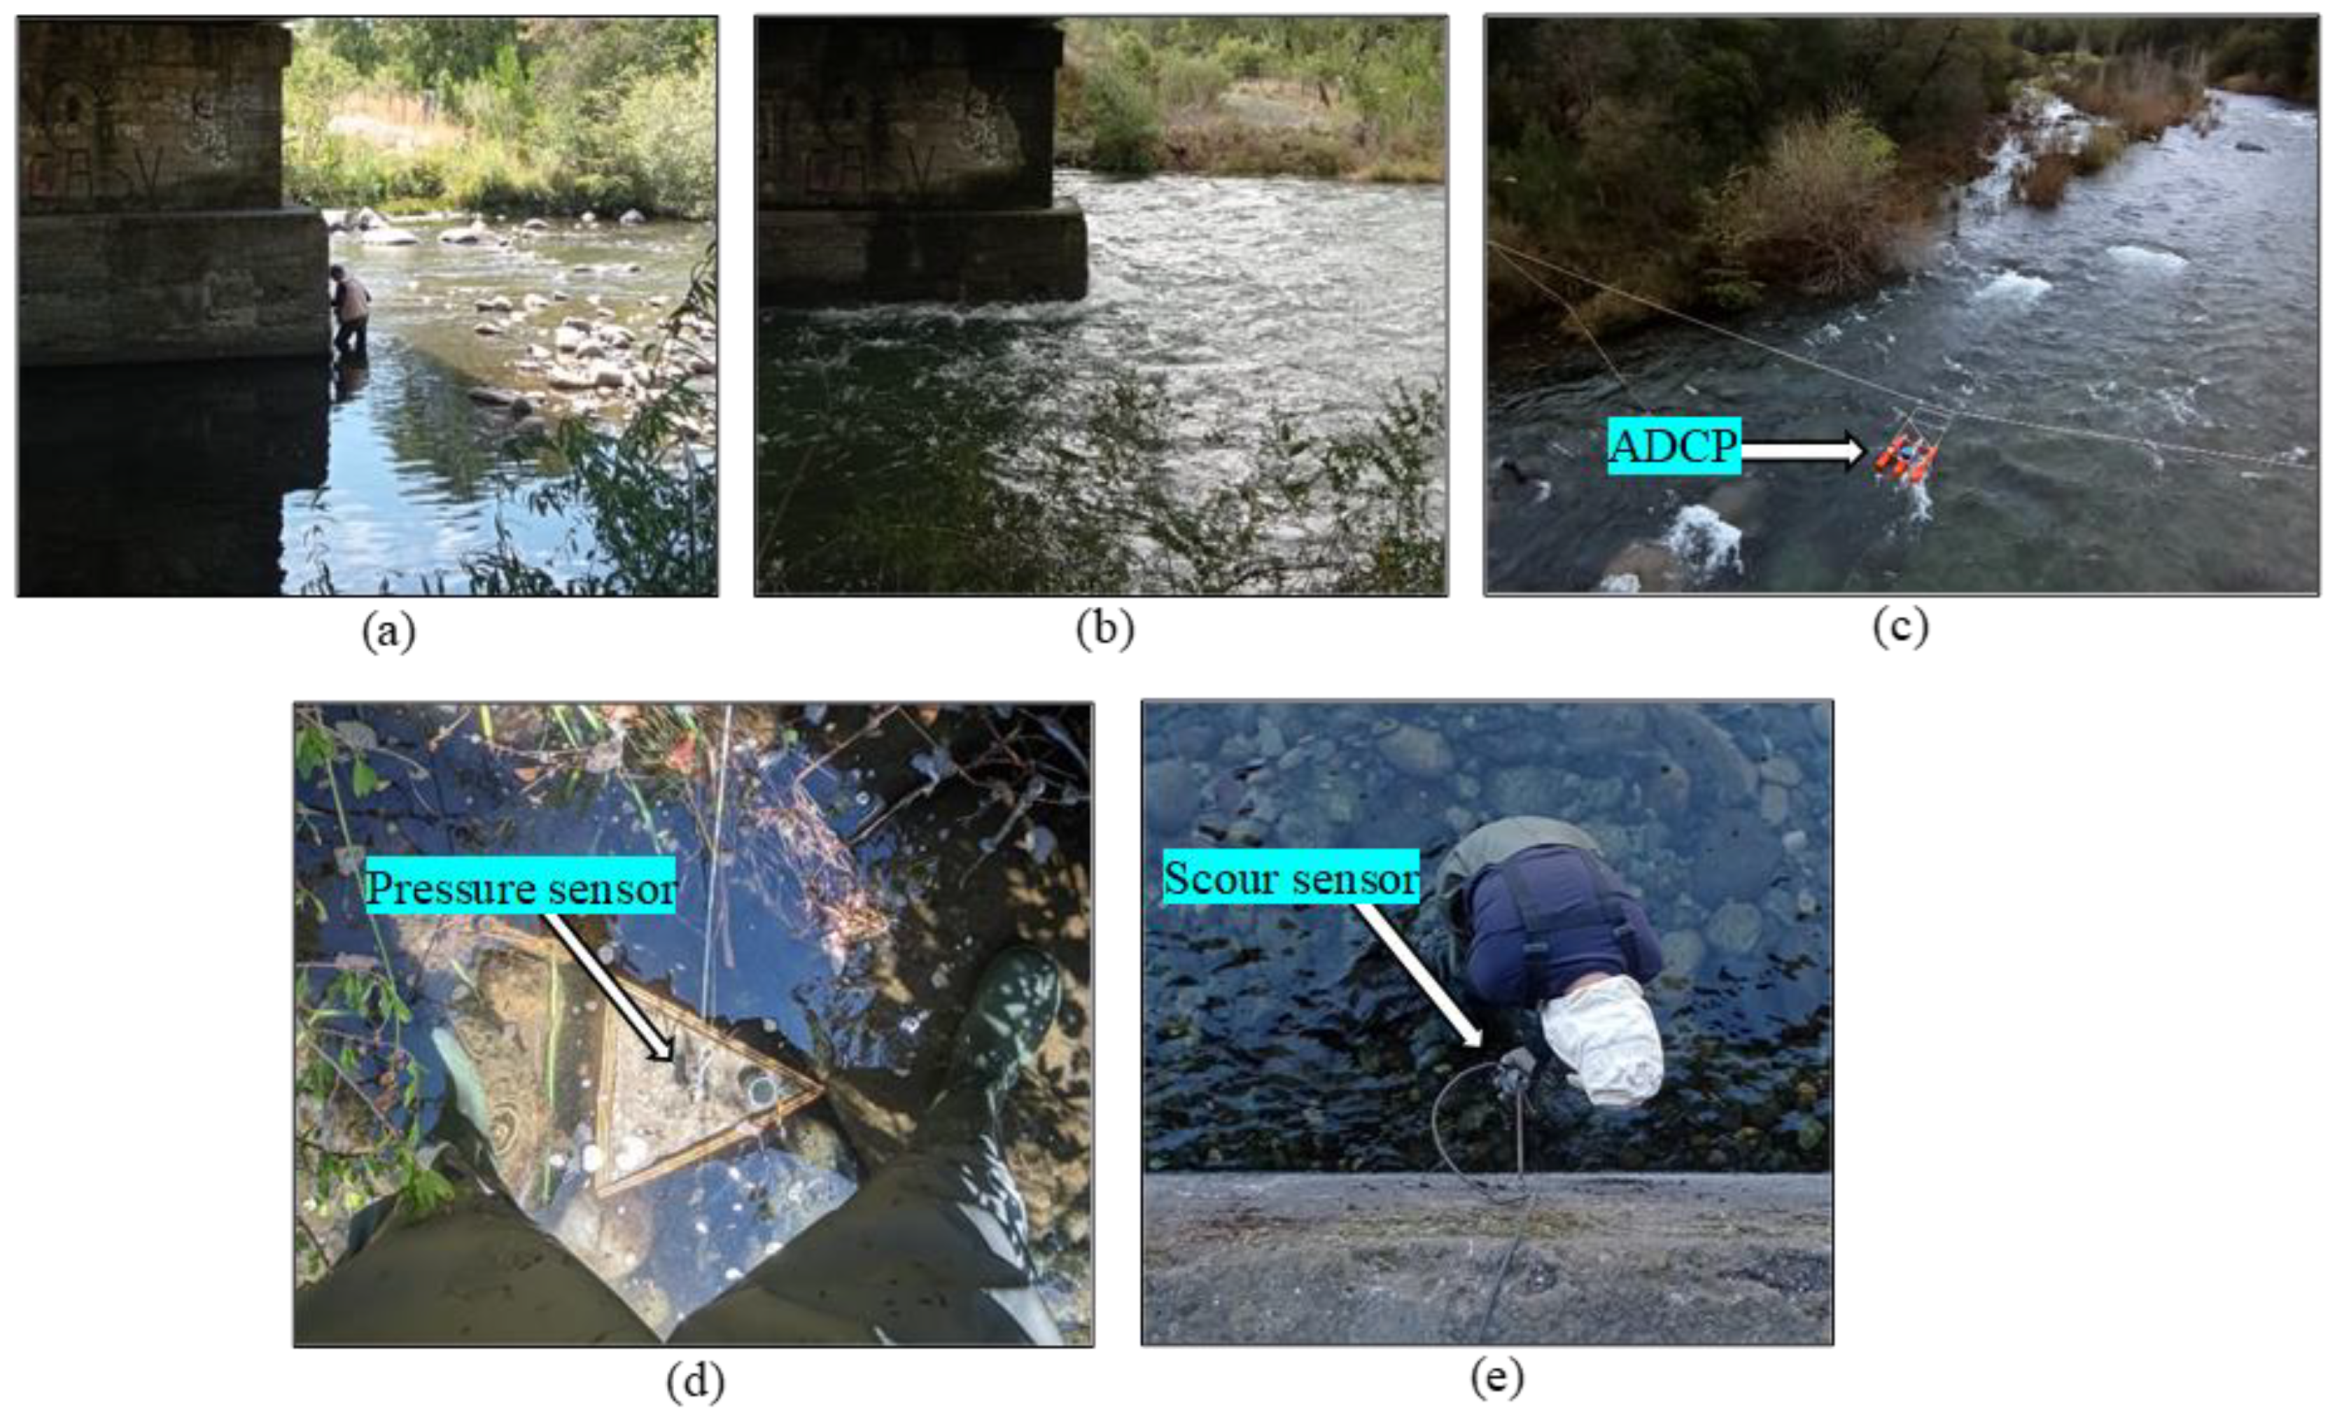
2.2. Data Collection
2.2.1. Streamflow
2.2.2. Scour Measurements
3. Results
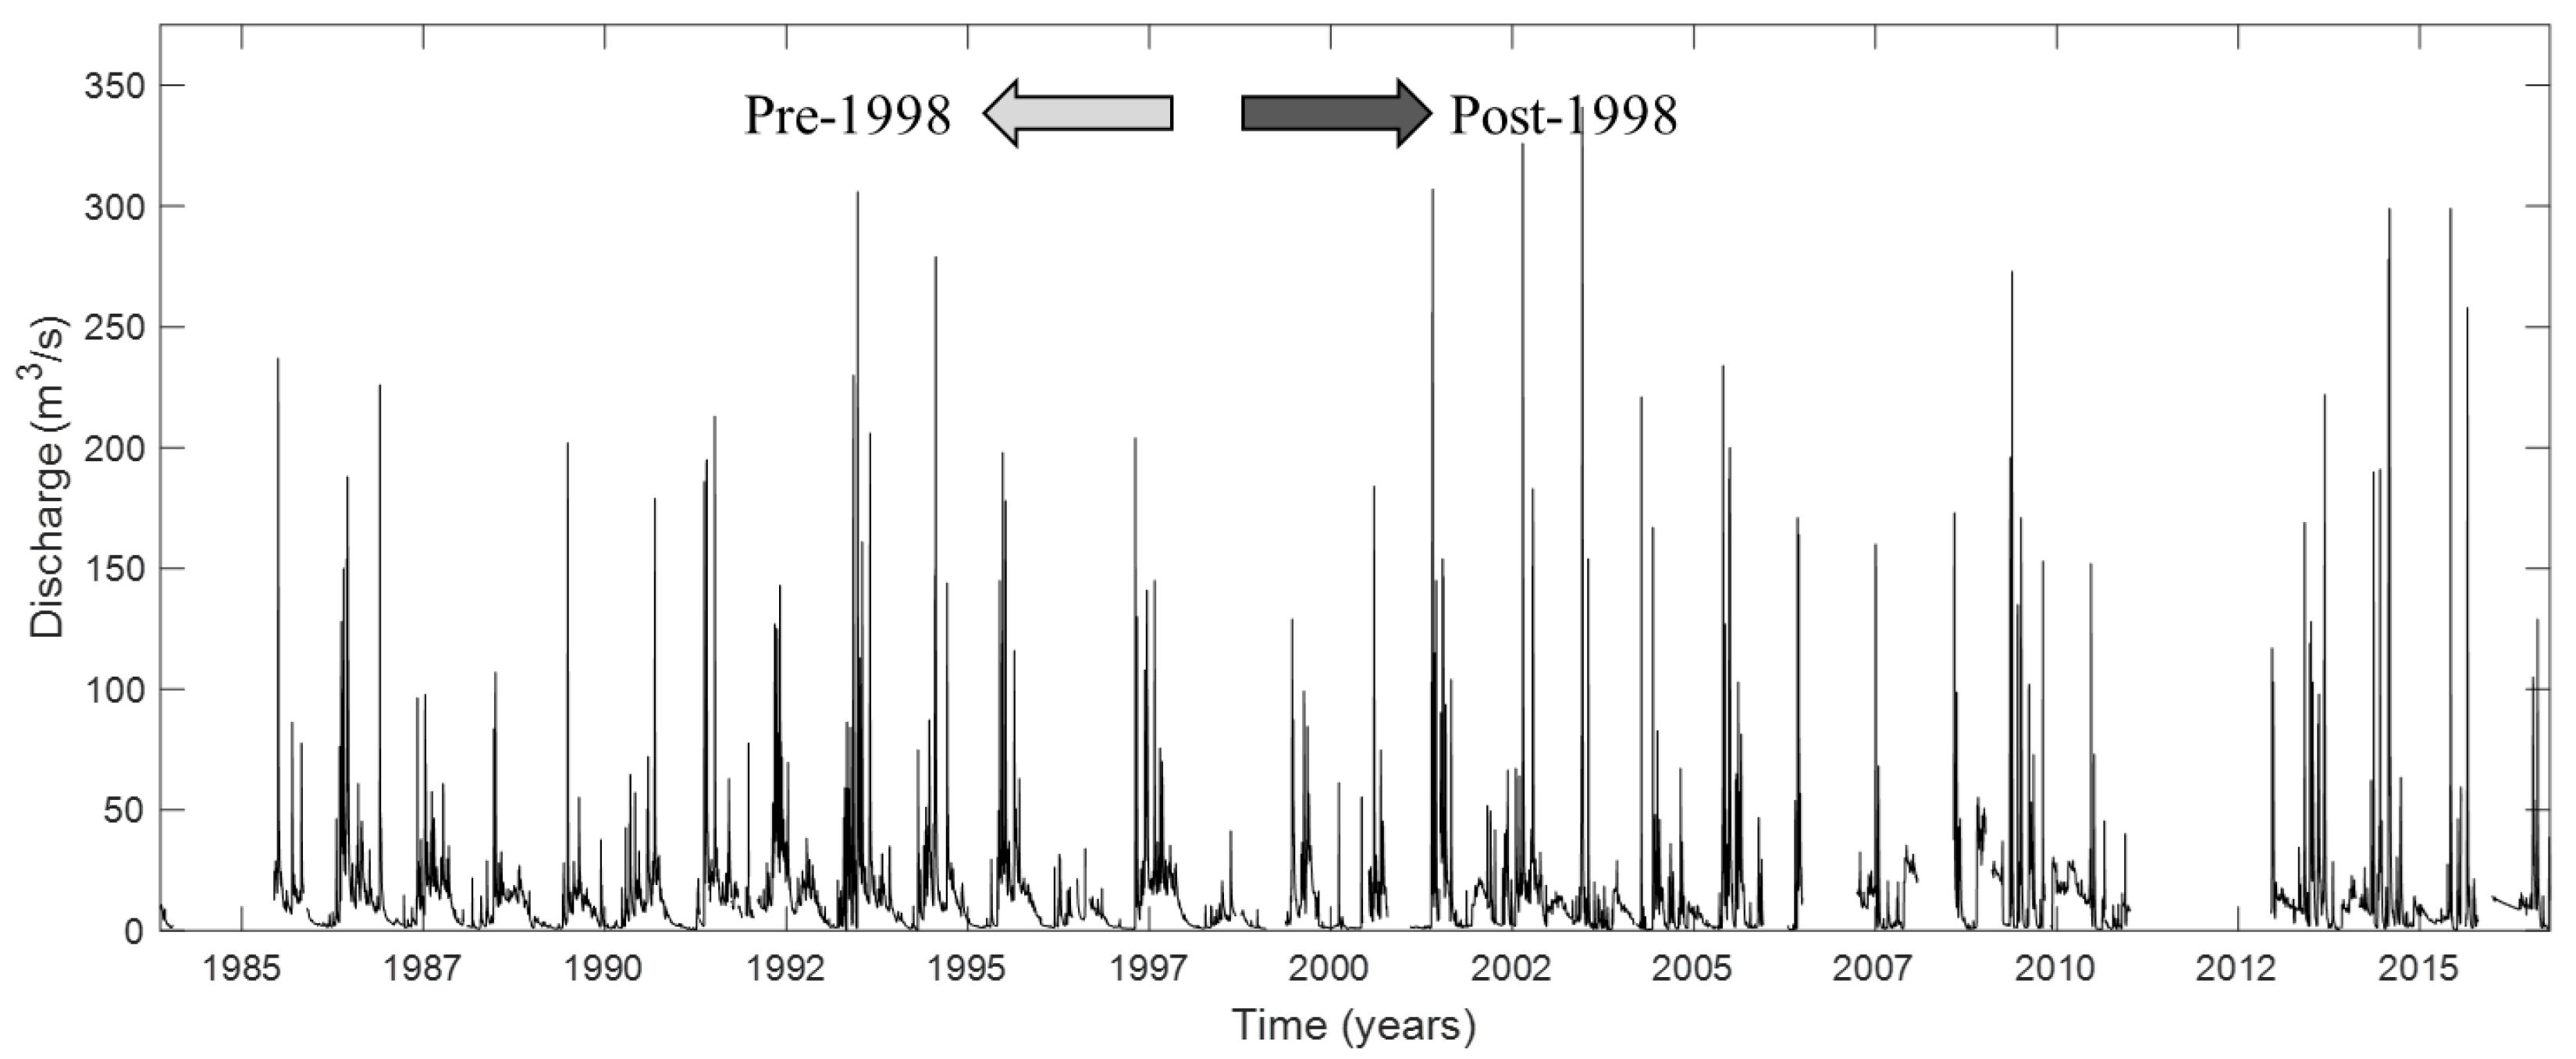
3.1. Flow Regime
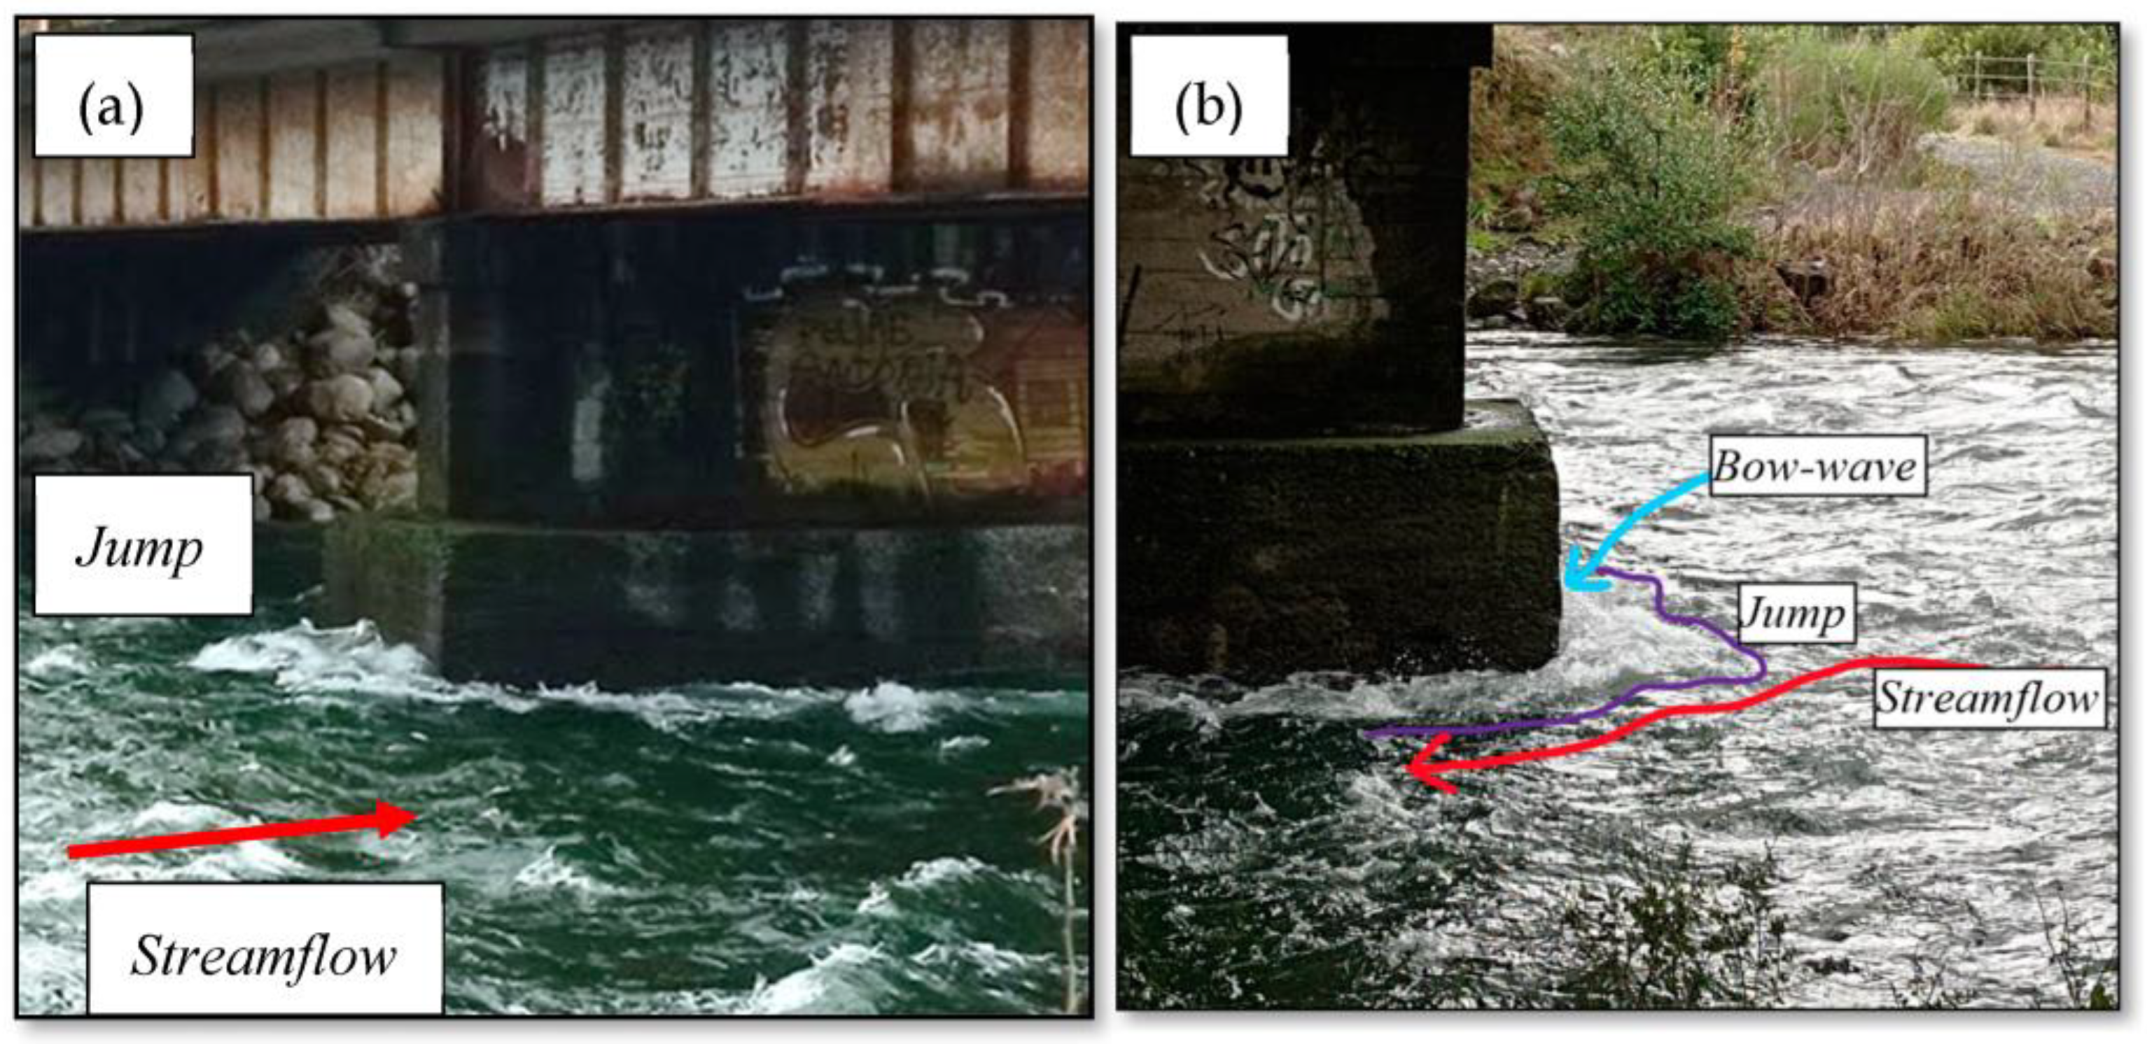
3.2. Supercritical Flow Patterns
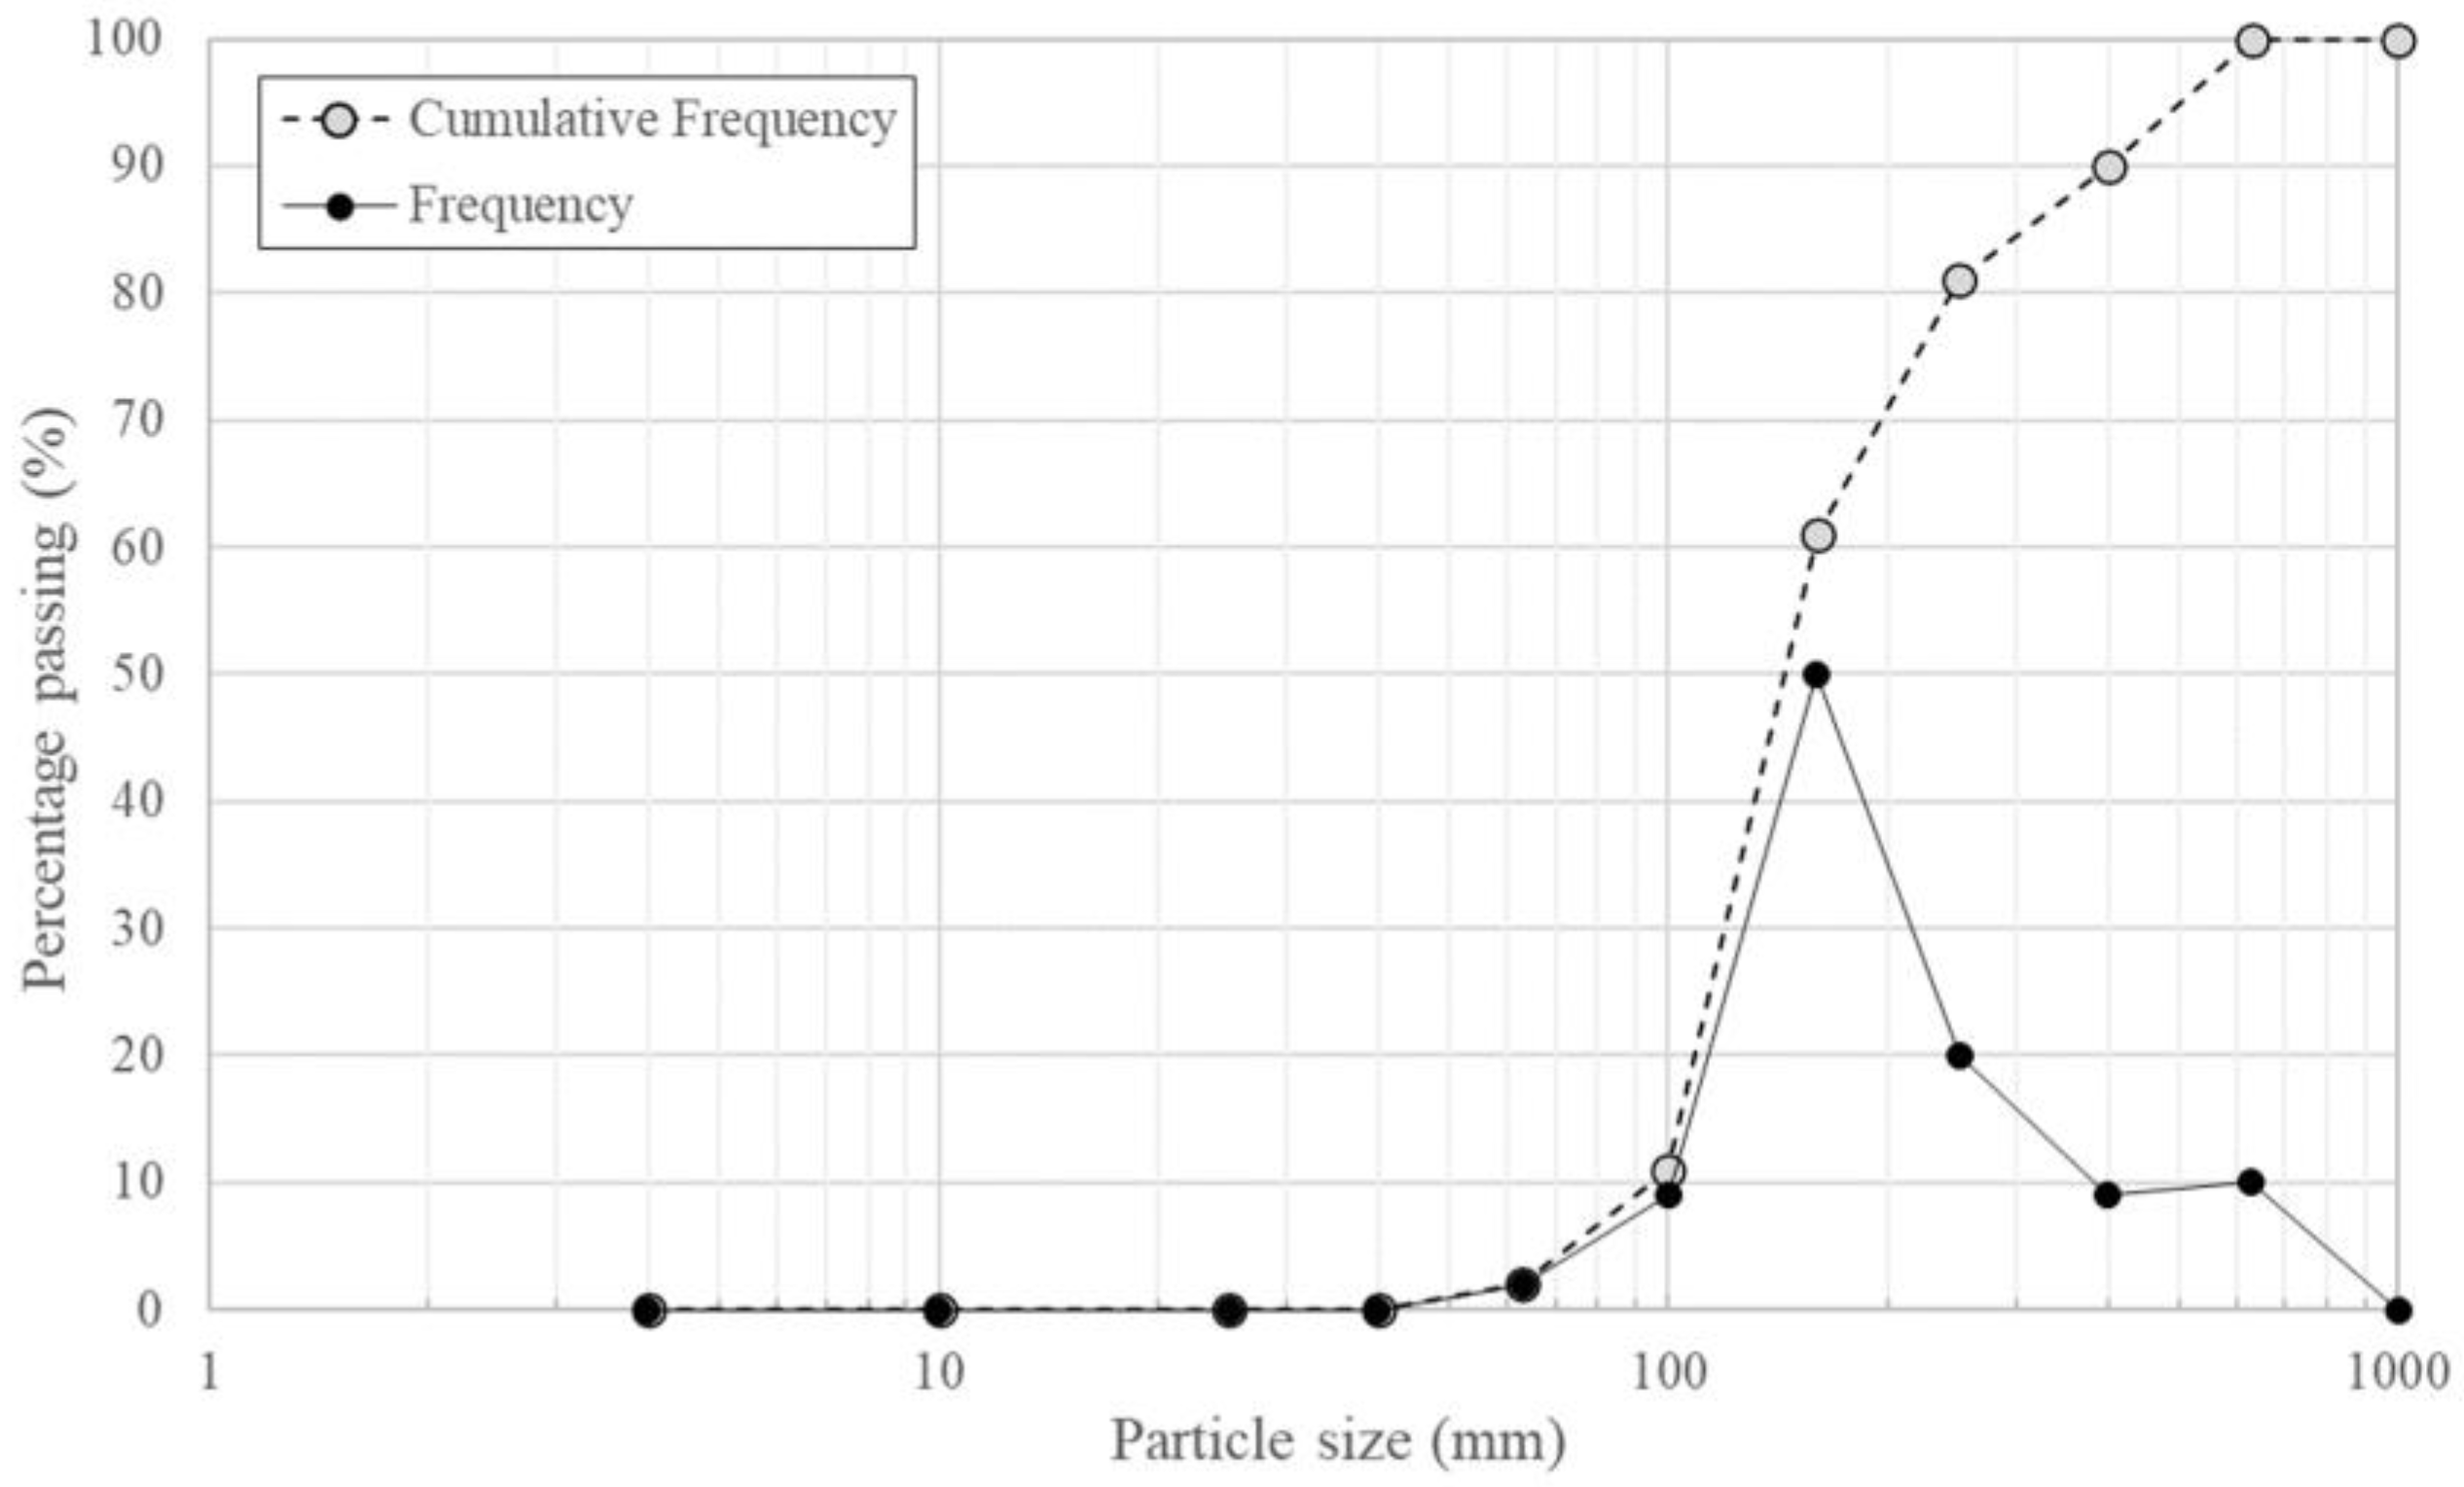
3.3. Existing Scour
4. Discussion
5. Conclusions
Author Contributions
Funding
Data Availability Statement
Acknowledgments
Conflicts of Interest
References
- Fitzgerald, P.C.; Malekjafarian, A.; Cantero, D.; OBrien, E.J.; Prendergast, L.J. Drive-by Scour Monitoring of Railway Bridges Using a Wavelet-Based Approach. Eng. Struct. 2019, 191, 1–11. [Google Scholar] [CrossRef]
- Melville, B.W.; Coleman, S.E. Bridge Scour; Water Resources Publications: Littleton, CO, USA, 2000; ISBN 9781887201186. [Google Scholar]
- Pizarro, A.; Manfreda, S.; Tubaldi, E. The Science behind Scour at Bridge Foundations: A Review. Water 2020, 12, 374. [Google Scholar] [CrossRef] [Green Version]
- Apsilidis, N.; Diplas, P.; Dancey, C.L.; Bouratsis, P. Time-Resolved Flow Dynamics and Reynolds Number Effects at a Wall-Cylinder Junction. J. Fluid Mech. 2015, 776, 475–511. [Google Scholar] [CrossRef]
- Dargahi, B. Controlling Mechanism of Local Scouring. J. Hydraul. Eng. 1990, 116, 1197–1214. [Google Scholar] [CrossRef]
- Chen, Q.; Qi, M.; Zhong, Q.; Li, D. Experimental Study on the Multimodal Dynamics of the Turbulent Horseshoe Vortex System around a Circular Cylinder. Phys. Fluids 2017, 29, 15106. [Google Scholar] [CrossRef]
- Soto, J.; Link, O.; Brevis, W. Elucidating the Importance of Sediment Avalanches in Scour at Obstacles. J. Hydraul. Res. 2022, 60, 62–73. [Google Scholar] [CrossRef]
- Arneson, L.A.; Zevenbergen, L.W.; Lagasse, P.F.; Clopper, P.E. Evaluating Scour at Bridges, 5th ed.; Associates, A., Ed.; U.S. Department of Transportation: Washington, DC, USA, 2012. Available online: https://rosap.ntl.bts.gov/view/dot/42053 (accessed on 10 June 2023).
- Sheppard, D.M.; Melville, B.; Demir, H. Evaluation of Existing Equations for Local Scour at Bridge Piers. J. Hydraul. Eng. 2014, 140, 14–23. [Google Scholar] [CrossRef]
- Qi, W.G.; Gao, F.P.; Randolph, M.F.; Lehane, B.M. Scour Effects on p–y Curves for Shallowly Embedded Piles in Sand. Géotecnique 2016, 66, 648–660. [Google Scholar] [CrossRef] [Green Version]
- Link, O.; Castillo, C.; Pizarro, A.; Rojas, A.; Ettmer, B.; Escauriaza, C.; Manfreda, S. A Model of Bridge Pier Scour during Flood Waves. J. Hydraul. Res. 2017, 55, 310–323. [Google Scholar] [CrossRef]
- Pizarro, A.; Ettmer, B.; Link, O. Relative Importance of Parameters Controlling Scour at Bridge Piers Using the New Toolbox ScourAPP. Comput. Geosci. 2022, 163, 105117. [Google Scholar] [CrossRef]
- Paik, J.; Escauriaza, C.; Sotiropoulos, F. On the Bimodal Dynamics of the Turbulent Horseshoe Vortex System in a Wing-Body Junction. Phys. Fluids 2007, 19, 45107. [Google Scholar] [CrossRef]
- Paik, J.; Escauriaza, C.; Sotiropoulos, F. Coherent Structure Dynamics in Turbulent Flows Past In-Stream Structures: Some Insights Gained via Numerical Simulation. J. Hydraul. Eng. 2010, 136, 981–993. [Google Scholar] [CrossRef]
- Escauriaza, C.; Sotiropoulos, F. Initial Stages of Erosion and Bed Form Development in a Turbulent Flow around a Cylindrical Pier. J. Geophys. Res. Earth Surf. 2011, 116. [Google Scholar] [CrossRef]
- Link, O.; González, C.; Maldonado, M.; Escauriaza, C. Coherent Structure Dynamics and Sediment Particle Motion around a Cylindrical Pier in Developing Scour Holes. Acta Geophys. 2012, 60, 1689–1719. [Google Scholar] [CrossRef]
- Schanderl, W.; Manhart, M. Reliability of Wall Shear Stress Estimations of the Flow around a Wall-Mounted Cylinder. Comput. Fluids 2016, 128, 16–29. [Google Scholar] [CrossRef]
- Schanderl, W.; Jenssen, U.; Manhart, M. Near-Wall Stress Balance in Front of a Wall-Mounted Cylinder. Flow Turbul. Combust. 2017, 99, 665–684. [Google Scholar] [CrossRef]
- Quezada, M.; Tamburrino, A.; Niño, Y. Numerical Simulation of Scour around Circular Piles Due to Unsteady Currents and Oscillatory Flows. Eng. Appl. Comput. Fluid Mech. 2018, 12, 354–374. [Google Scholar] [CrossRef] [Green Version]
- Quezada, M.; Tamburrino, A.; Niño, Y. Numerical Study of the Hydrodynamics of Waves and Currents and Their Effects in Pier Scouring. Water 2019, 11, 2256. [Google Scholar] [CrossRef] [Green Version]
- Ettema, R.; Melville, B.W.; Barkdoll, B. Scale Effect in Pier-Scour Experiments. J. Hydraul. Eng. 1998, 124, 639–642. [Google Scholar] [CrossRef]
- Ettema, R.; Kirkil, G.; Muste, M. Similitude of Large-Scale Turbulence in Experiments on Local Scour at Cylinders. J. Hydraul. Eng. 2006, 132, 33–40. [Google Scholar] [CrossRef]
- Lee, S.O.; Sturm, T.W. Effect of Sediment Size Scaling on Physical Modeling of Bridge Pier Scour. J. Hydraul. Eng. 2009, 135, 793–802. [Google Scholar] [CrossRef]
- Link, O.; Henríquez, S.; Ettmer, B. Physical Scale Modelling of Scour around Bridge Piers. J. Hydraul. Res. 2019, 57, 227–237. [Google Scholar] [CrossRef]
- Tao, J.; Li, J.; Wang, X.; Bao, R. Nature-Inspired Bridge Scour Countermeasures: Streamlining and Biocementation. J. Test. Eval. 2018, 46, 1376–1390. [Google Scholar] [CrossRef]
- Singh, R.K.; Pandey, M.; Pu, J.H.; Pasupuleti, S.; Villuri, V.G.K. Experimental Study of Clear-Water Contraction Scour. Water Supply 2020, 20, 943–952. [Google Scholar] [CrossRef]
- Mignot, E.; Moyne, T.; Doppler, D.; Rivière, N. Clear-Water Scouring Process in a Flow in Supercritical Regime. J. Hydraul. Eng. 2016, 142, 4015063. [Google Scholar] [CrossRef] [Green Version]
- Link, O.; Mignot, E.; Roux, S.; Camenen, B.; Escauriaza, C.; Chauchat, J.; Brevis, W.; Manfreda, S. Scour at Bridge Foundations in Supercritical Flows: An Analysis of Knowledge Gaps. Water 2019, 11, 1656. [Google Scholar] [CrossRef] [Green Version]
- Roux, S.; Link, O.; Riviere, N.; Mignot, E. Live-Bed Pier Scour in Supercritical Open-Channel Flows. J. Hydraul. Res. 2022, 60, 675–685. [Google Scholar] [CrossRef]
- Quetelard, H.; Bessemoulin, P.; Cerveny, R.S.; Peterson, T.C.; Burton, A.; Boodhoo, Y. Extreme Weather: World-Record Rainfalls during Tropical Cyclone Gamede. Bull. Am. Meteorol. Soc. 2009, 90, 603–608. [Google Scholar] [CrossRef]
- Roux, S.; Misset, C.; Romieu, P. Construction of a New Bridge over the Rivière des Galets; Study on Physical Model; Phase 1—Tests on Abutment Scour; CNR: Lyon, France, 2015. [Google Scholar]
- Rifo, C.; Arriagada, P.; Ettmer, B.; Link, O. Frequency Analysis of Extreme Scour Depths at Bridge Piers and Their Contribution to Bridge Collapse Risk. Hydrol. Sci. J. 2022, 67, 2029–2041. [Google Scholar] [CrossRef]
- Deng, L.; Cai, C.S. Bridge Scour: Prediction, Modeling, Monitoring, and Countermeasures—Review. Pract. Period. Struct. Des. Constr. 2010, 15, 125–134. [Google Scholar] [CrossRef] [Green Version]
- Prendergast, L.J.; Gavin, K. A Review of Bridge Scour Monitoring Techniques. J. Rock Mech. Geotech. Eng. 2014, 6, 138–149. [Google Scholar] [CrossRef]
- Kazemian, A.; Yee, T.; Oguzmert, M.; Amirgholy, M.; Yang, J.; Goff, D. A Review of Bridge Scour Monitoring Techniques and Developments in Vibration Based Scour Monitoring for Bridge Foundations. Adv. Bridge Eng. 2023, 4, 2. [Google Scholar] [CrossRef]
- Sohn, H.; Farrar, C.R.; Hemez, F.M.; Shunk, D.D.; Stinemates, D.W.; Nadler, B.R.; Czarnecki, J.J. A Review of Structural Health Monitoring Literature: 1996–2001; Los Alamos National Laboratory: Los Alamos, NM, USA, 2003; Volume 1, p. 16. [Google Scholar]
- Malekjafarian, A.; Kim, C.-W.; OBrien, E.J.; Prendergast, L.J.; Fitzgerald, P.C.; Nakajima, S. Experimental Demonstration of a Mode Shape-Based Scour-Monitoring Method for Multispan Bridges with Shallow Foundations. J. Bridge Eng. 2020, 25, 4020050. [Google Scholar] [CrossRef]
- Prendergast, L.J.; Hester, D.; Gavin, K. Determining the Presence of Scour around Bridge Foundations Using Vehicle-Induced Vibrations. J. Bridge Eng. 2016, 21, 4016065. [Google Scholar] [CrossRef] [Green Version]
- Xiong, W.; Cai, C.S.; Kong, B.; Zhang, X.; Tang, P. Bridge Scour Identification and Field Application Based on Ambient Vibration Measurements of Superstructures. J. Mar. Sci. Eng. 2019, 7, 121. [Google Scholar] [CrossRef] [Green Version]
- Zhang, F.; Zang, Z.; Zhao, M.; Zhang, J.; Xie, B.; Zou, X. Numerical Investigations on Scour and Flow around Two Crossing Pipelines on a Sandy Seabed. J. Mar. Sci. Eng. 2022, 10, 2019. [Google Scholar] [CrossRef]
- Tubaldi, E.; Antonopoulos, C.; Mitoulis, S.A.; Argyroudis, S.; Gara, F.; Ragni, L.; Carbonari, S.; Dezi, F.; Vratsikidis, A.; Pitilakis, D.; et al. Field Tests and Numerical Analysis of the Effects of Scour on a Full-Scale Soil–Foundation–Structural System. J. Civ. Struct. Health Monit. 2022. [Google Scholar] [CrossRef]
- Hong, J.H.; Guo, W.D.; Chiew, Y.M.; Chen, C.H. A New Practical Method to Simulate Flood-Induced Bridge Pier Scour-A Case Study of Mingchu Bridge Piers on the Cho-Shui River. Water 2016, 8, 238. [Google Scholar] [CrossRef] [Green Version]
- Lu, J.-Y.; Hong, J.-H.; Su, C.-C.; Wang, C.-Y.; Lai, J.-S. Field Measurements and Simulation of Bridge Scour Depth Variations during Floods. J. Hydraul. Eng. 2008, 134, 810–821. [Google Scholar] [CrossRef] [Green Version]
- Su, C.C.; Lu, J.Y. Measurements and Prediction of Typhoon-Induced Short-Term General Scours in Intermittent Rivers. Nat. Hazards 2013, 66, 671–687. [Google Scholar] [CrossRef]
- Yang, H.C.; Su, C.C. Real-Time River Bed Scour Monitoring and Synchronous Maximum Depth Data Collected during Typhoon Soulik in 2013. Hydrol. Process. 2015, 29, 1056–1068. [Google Scholar] [CrossRef]
- Hurther, D.; Thorne, P.D. Suspension and Near-bed Load Sediment Transport Processes above a Migrating, Sand-rippled Bed under Shoaling Waves. J. Geophys. Res. Oceans 2011, 116. [Google Scholar] [CrossRef] [Green Version]
- Fromant, G.; Mieras, R.S.; Revil-Baudard, T.; Puleo, J.A.; Hurther, D.; Chauchat, J. On Bedload and Suspended Load Measurement Performances in Sheet Flows Using Acoustic and Conductivity Profilers. J. Geophys. Res. Earth Surf. 2018, 123, 2546–2562. [Google Scholar] [CrossRef]
- Sturm, T.; Sotiropoulos, F.; Landers, M.; Gotvald, T.; Lee, S.; Ge, L.; Navarro, R.; Escauriaza, C. Laboratory and 3D Numerical Modeling with Field Monitoring of Regional Bridge Scour in Georgia; Georgia Department of Transportation Final Project; Georgia Department of Transportation: Atlanta, GA, USA, 2004.
- Yu, X.; Yu, X. Laboratory Evaluation of Time-Domain Reflectometry for Bridge Scour Measurement: Comparison with the Ultrasonic Method. Adv. Civ. Eng. 2010, 2010, 508172. [Google Scholar] [CrossRef] [Green Version]
- Wu, B.; Chen, W.; Li, H. Real-Time Monitoring of Bridge Scouring Using Ultrasonic Sensing Technology. In Sensors and Smart Structures Technologies for Civil, Mechanical, and Aerospace Systems; SPIE: Bellingham, WA, USA, 2012; Volume 8345, pp. 891–899. [Google Scholar] [CrossRef]
- Link, O.; García, M.; Pizarro, A.; Alcayaga, H.; Palma, S. Local Scour and Sediment Deposition at Bridge Piers during Floods. J. Hydraul. Eng. 2020, 146, 4020003. [Google Scholar] [CrossRef]
- Rivière, N.; Vouaillat, G.; Launay, G.; Mignot, E. Emerging Obstacles in Supercritical Open-Channel Flows: Detached Hydraulic Jump versus Wall-Jet-like Bow Wave. J. Hydraul. Eng. 2017, 143, 4017011. [Google Scholar] [CrossRef] [Green Version]
- Mignot, E.; Riviere, N. Bow-Wave-like Hydraulic Jump and Horseshoe Vortex around an Obstacle in a Supercritical Open Channel Flow. Phys. Fluids 2010, 22, 117105. [Google Scholar] [CrossRef] [Green Version]
- Link, O.; Pfleger, F.; Zanke, U. Characteristics of Developing Scour-Holes at a Sand-Embedded Cylinder. Int. J. Sediment Res. 2008, 23, 258–266. [Google Scholar] [CrossRef]
- Diab, R.; Link, O.; Zanke, U. Geometry of Developing and Equilibrium Scour Holes at Bridge Piers in Gravel. Can. J. Civ. Eng. 2010, 37, 544–552. [Google Scholar] [CrossRef]
- Hoffmans, G.; Verheij, H.J. Scour Manual; Routledge Balkema: London, UK, 1997. [Google Scholar]
- Ettmer, B.; Orth, F.; Link, O. Live-Bed Scour at Bridge Piers in a Lightweight Polystyrene Bed. J. Hydraul. Eng. 2015, 141, 4015017. [Google Scholar] [CrossRef]


| Property | Value |
|---|---|
| Bridge geometry | Rectangular |
| Bridge length (m) | 51 |
| Number of piers | 2 |
| Bridge span (m) | 21 |
| Pier #1 width (m) | 2.9 |
| Drainage area (km2) | 211.73 |
| Channel slope | ~1.2% |
| Bed material | pebbles |
Disclaimer/Publisher’s Note: The statements, opinions and data contained in all publications are solely those of the individual author(s) and contributor(s) and not of MDPI and/or the editor(s). MDPI and/or the editor(s) disclaim responsibility for any injury to people or property resulting from any ideas, methods, instructions or products referred to in the content. |
© 2023 by the authors. Licensee MDPI, Basel, Switzerland. This article is an open access article distributed under the terms and conditions of the Creative Commons Attribution (CC BY) license (https://creativecommons.org/licenses/by/4.0/).
Share and Cite
San Martin, C.; Rifo, C.; Guerra, M.; Ettmer, B.; Link, O. Monitoring Scour at Bridge Piers in Rivers with Supercritical Flows. Hydrology 2023, 10, 147. https://doi.org/10.3390/hydrology10070147
San Martin C, Rifo C, Guerra M, Ettmer B, Link O. Monitoring Scour at Bridge Piers in Rivers with Supercritical Flows. Hydrology. 2023; 10(7):147. https://doi.org/10.3390/hydrology10070147
Chicago/Turabian StyleSan Martin, Camilo, Cristian Rifo, Maricarmen Guerra, Bernd Ettmer, and Oscar Link. 2023. "Monitoring Scour at Bridge Piers in Rivers with Supercritical Flows" Hydrology 10, no. 7: 147. https://doi.org/10.3390/hydrology10070147