2.1. The Cantareira System
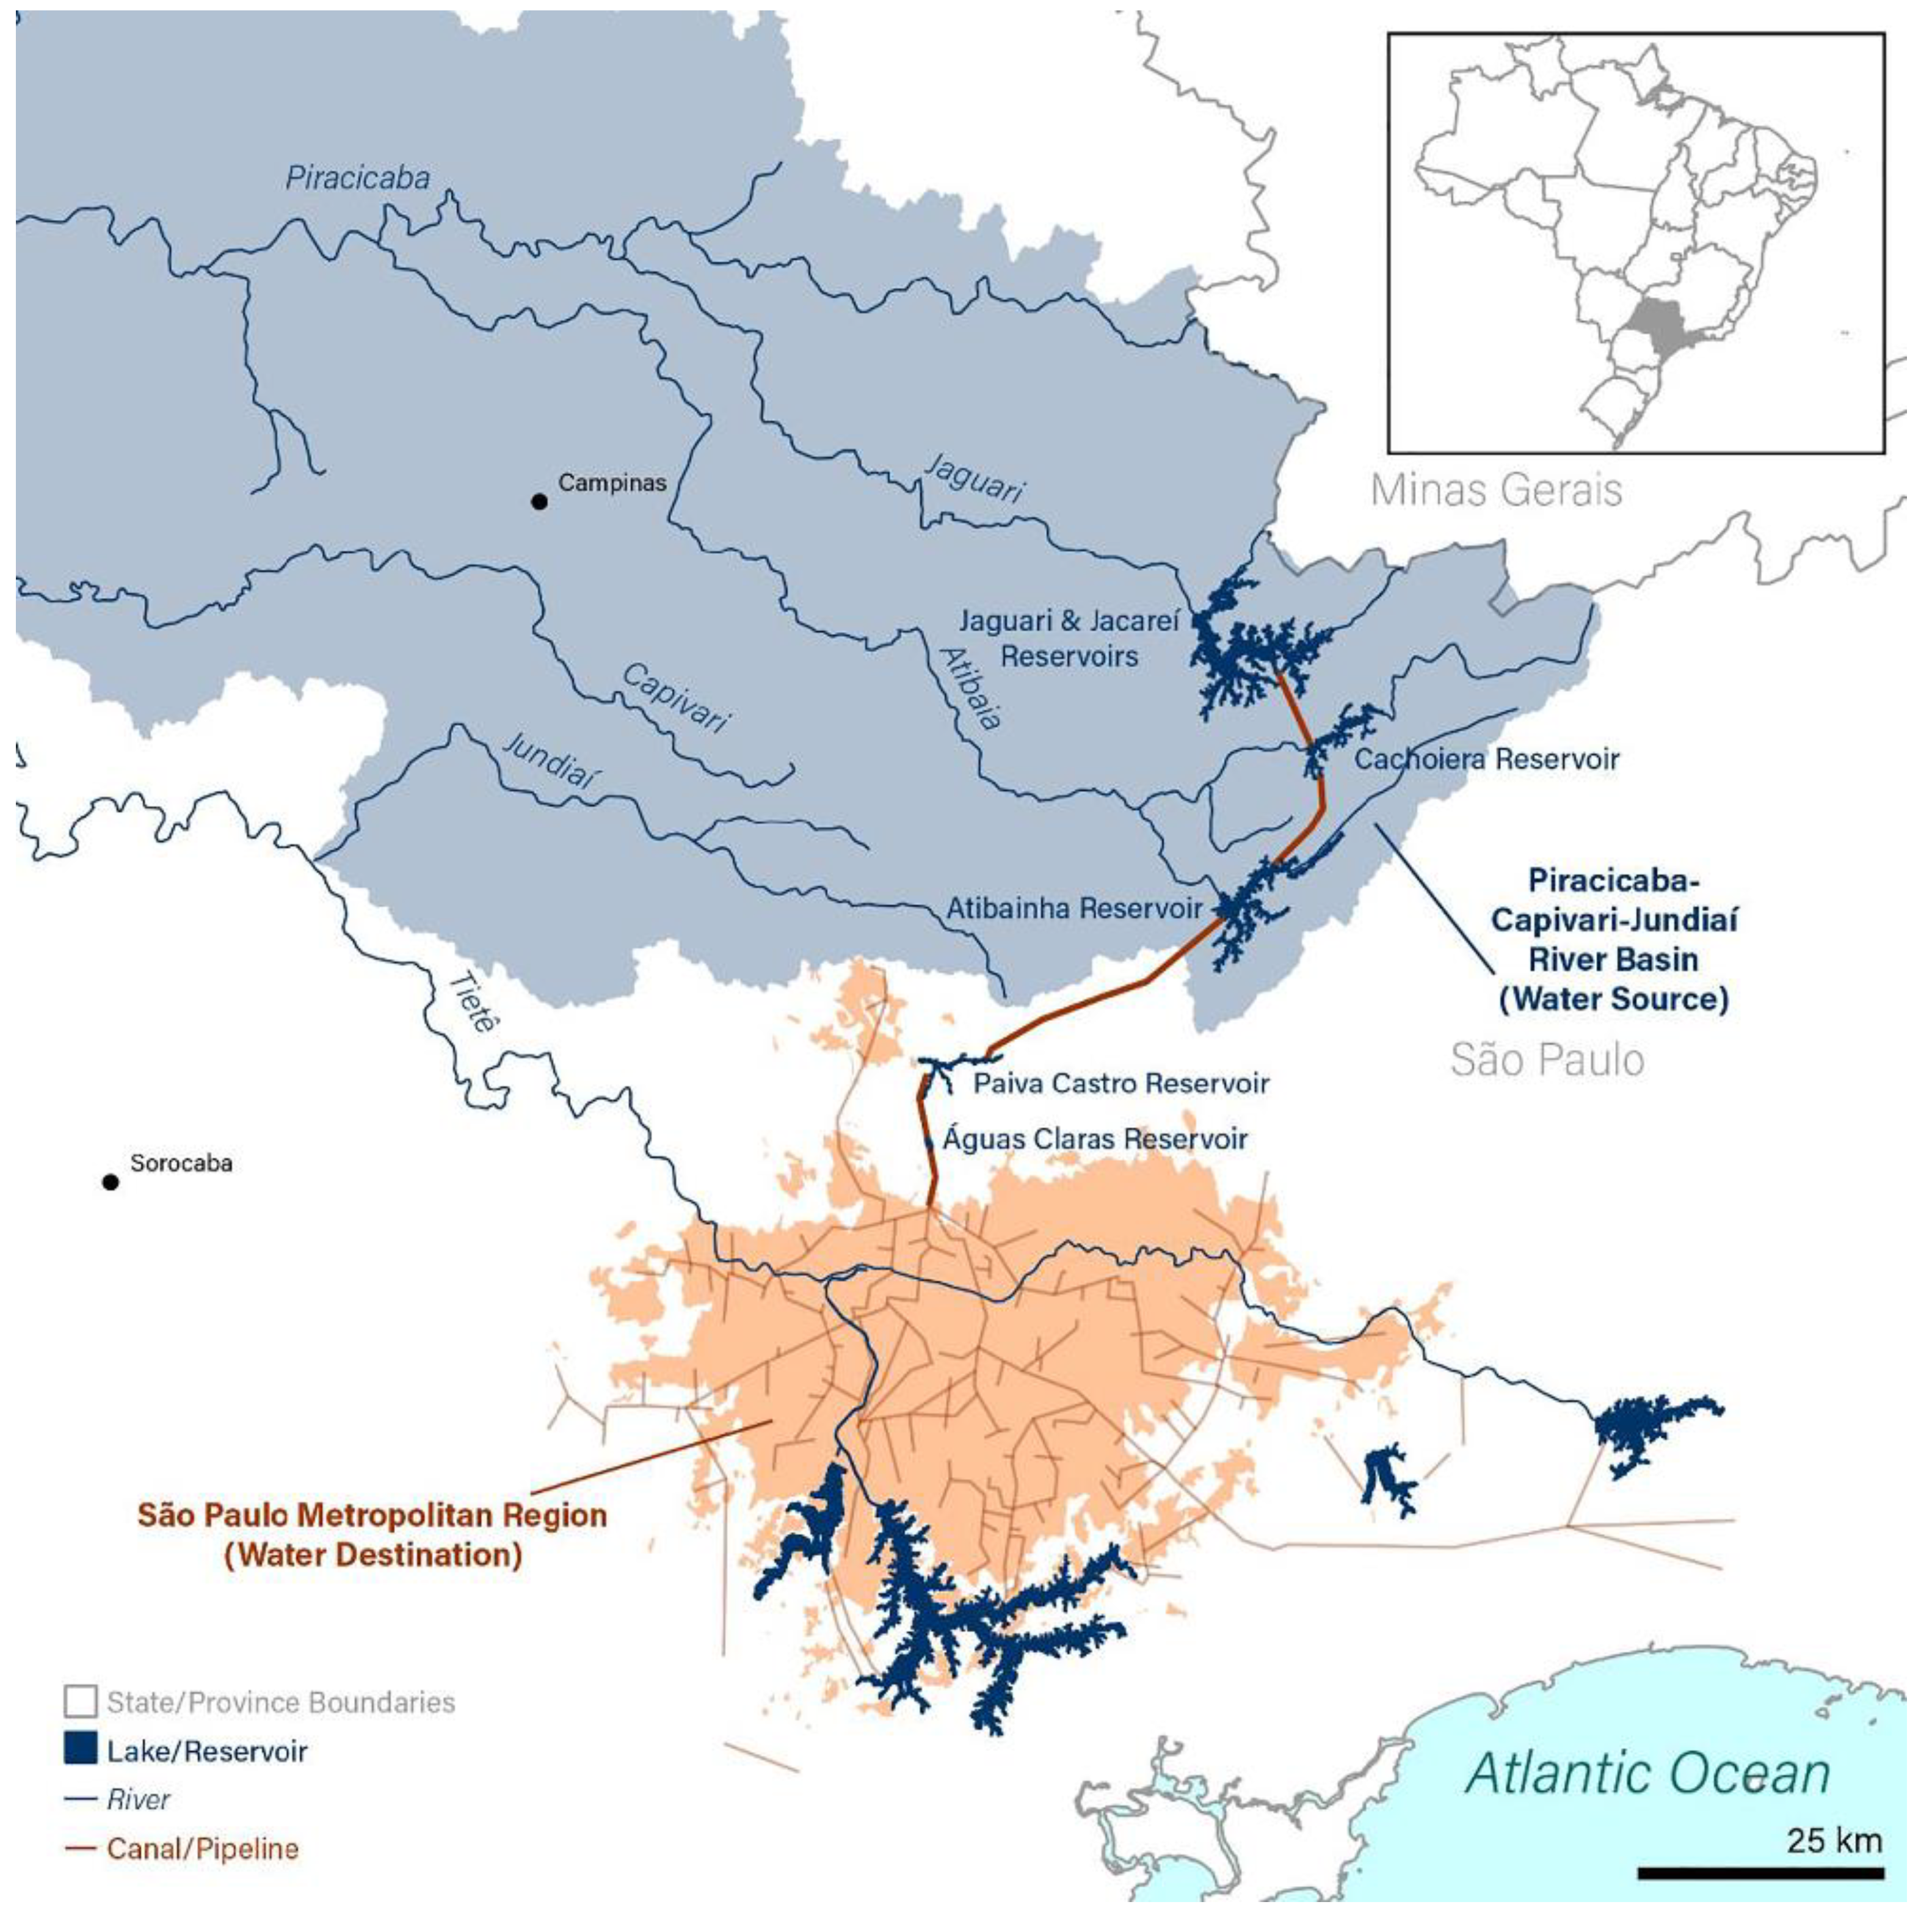
The Cantareira System is an ensemble of six water reservoirs connected by channels and tunnels in the basins of the Jaguari and Atibaia rivers, which flow into the Piracicaba River (
Figure 1). The location of the Cantareira system makes it strategic to two important metropolitan regions in the state of São Paulo: the Campinas Metropolitan Region (CMR) in the upstream portion of the Piracicaba River basin, which has more than 3.3 million inhabitants, and the SPMR, the largest in Brazil, with more than 22 million inhabitants, and—consequently—with a higher demand for water supply.
The system consists of six reservoirs: Jaguari, Jacareí, Cachoeira, Atibainha, Paiva Castro, and Águas Claras, all of which are in the state of São Paulo. The first four are located in the Piracicaba River basin and the other two in the Medio and Alto Tiete river basins, respectively, from where they connect to the Guaraú Water Treatment Plant to provide about 33 m3·s−1 of water to supply the SPMR. The Piracicaba, Capivari, and Jundiaí (PCJ) rivers are tributaries of the right side of the Tiete River, in its mid portion, and are, therefore, contiguous basins. Thus, a single committee is responsible for the PCJ basins. The Capivari and Jundiai rivers are not donor basins for the water to the SPMR; only the Piracicaba River performs this function.
The PCJ river basins (i.e., the donor region) have the challenge of supplying more than 14 million people: 5.8 million locally and 9 million in the SPMR. The PCJ basins cover an area of 15,377 km
2 and are home to about 6 million people across 76 municipalities in the states of São Paulo and Minas Gerais, of which over 96% live in urban areas and produce about 7% of the country’s GDP [
2]. Domestic supply is the largest water use (64.31%), while industrial use represents 26.45% of use and irrigation 5.05% of use [
5]. According to the PCJ River Basin Plan, the region has its annual rainfall distributed in the wet (October to March, 959 mm) and dry (April to September, 293 mm) seasons.
The SPMR, the receiving region, has 47% of its water demand, coming from about 9 million inhabitants, supplied by the Cantareira System. In the municipality of São Paulo, the most populous in the SPMR, 65% of the water is supplied by the Cantareira System. This system is one of eight systems that provide water to the SPMR, which has a total water demand of more than 70 m
3·s
−1 [
6].
2.2. Design and the First 30 Years of Cantareira System Operation
As mentioned before, the SPMR had a rapid population growth from the second half of the 20th century on and did not have enough water available for its population since it is located in a headwater region with poor water quality, thus resulting in the need to bring water from contiguous basins.
The event that occurred between 2014 and 2015, the largest water crisis faced by the system, can be attributed to, among other reasons, factors related to its dimensioning. The first studies that conceptualized the idea of the Cantareira System occurred in the late 1960s when hydrological and populational monitoring in Brazil was only being started.
Brazil is a country of continental dimensions, and for four centuries, it was colonized only in the coastal areas; thus, building connections with inland regions was difficult for a long time. Only in 1872, the first general census of the Brazilian Empire took place; this was conducted by the so-called General Statistical Office. This census was considered inaugural for historical purposes but was not used due to the supervision to which it was subjected. In 1940, a major transformation occurred in Brazil’s statistical services, which is why the previously existing data is now considered unreliable. This transformation made it very difficult to plan governmental actions in the country until the early 1940s. The Brazilian Geography and Statistics Institute (IBGE), responsible for conducting Brazilian demographic censuses, was only created in 1938. The studies for the projection of the Cantareira System started in the 1960s, and so, one can infer that the data available for carrying out studies of population growth and used for planning and building the supply systems of the SPMR were not very robust.
Despite giving great importance to the dimensioning of water supply systems, the Brazilian government showed a late recognition of the importance of creating and maintaining an extensive hydrometric and/or hydro-meteorological network. This need became evident only during the processing of the “Water Code”, the first legislation about water use, which was enacted only in 1934 by Law no. 24.643/34.
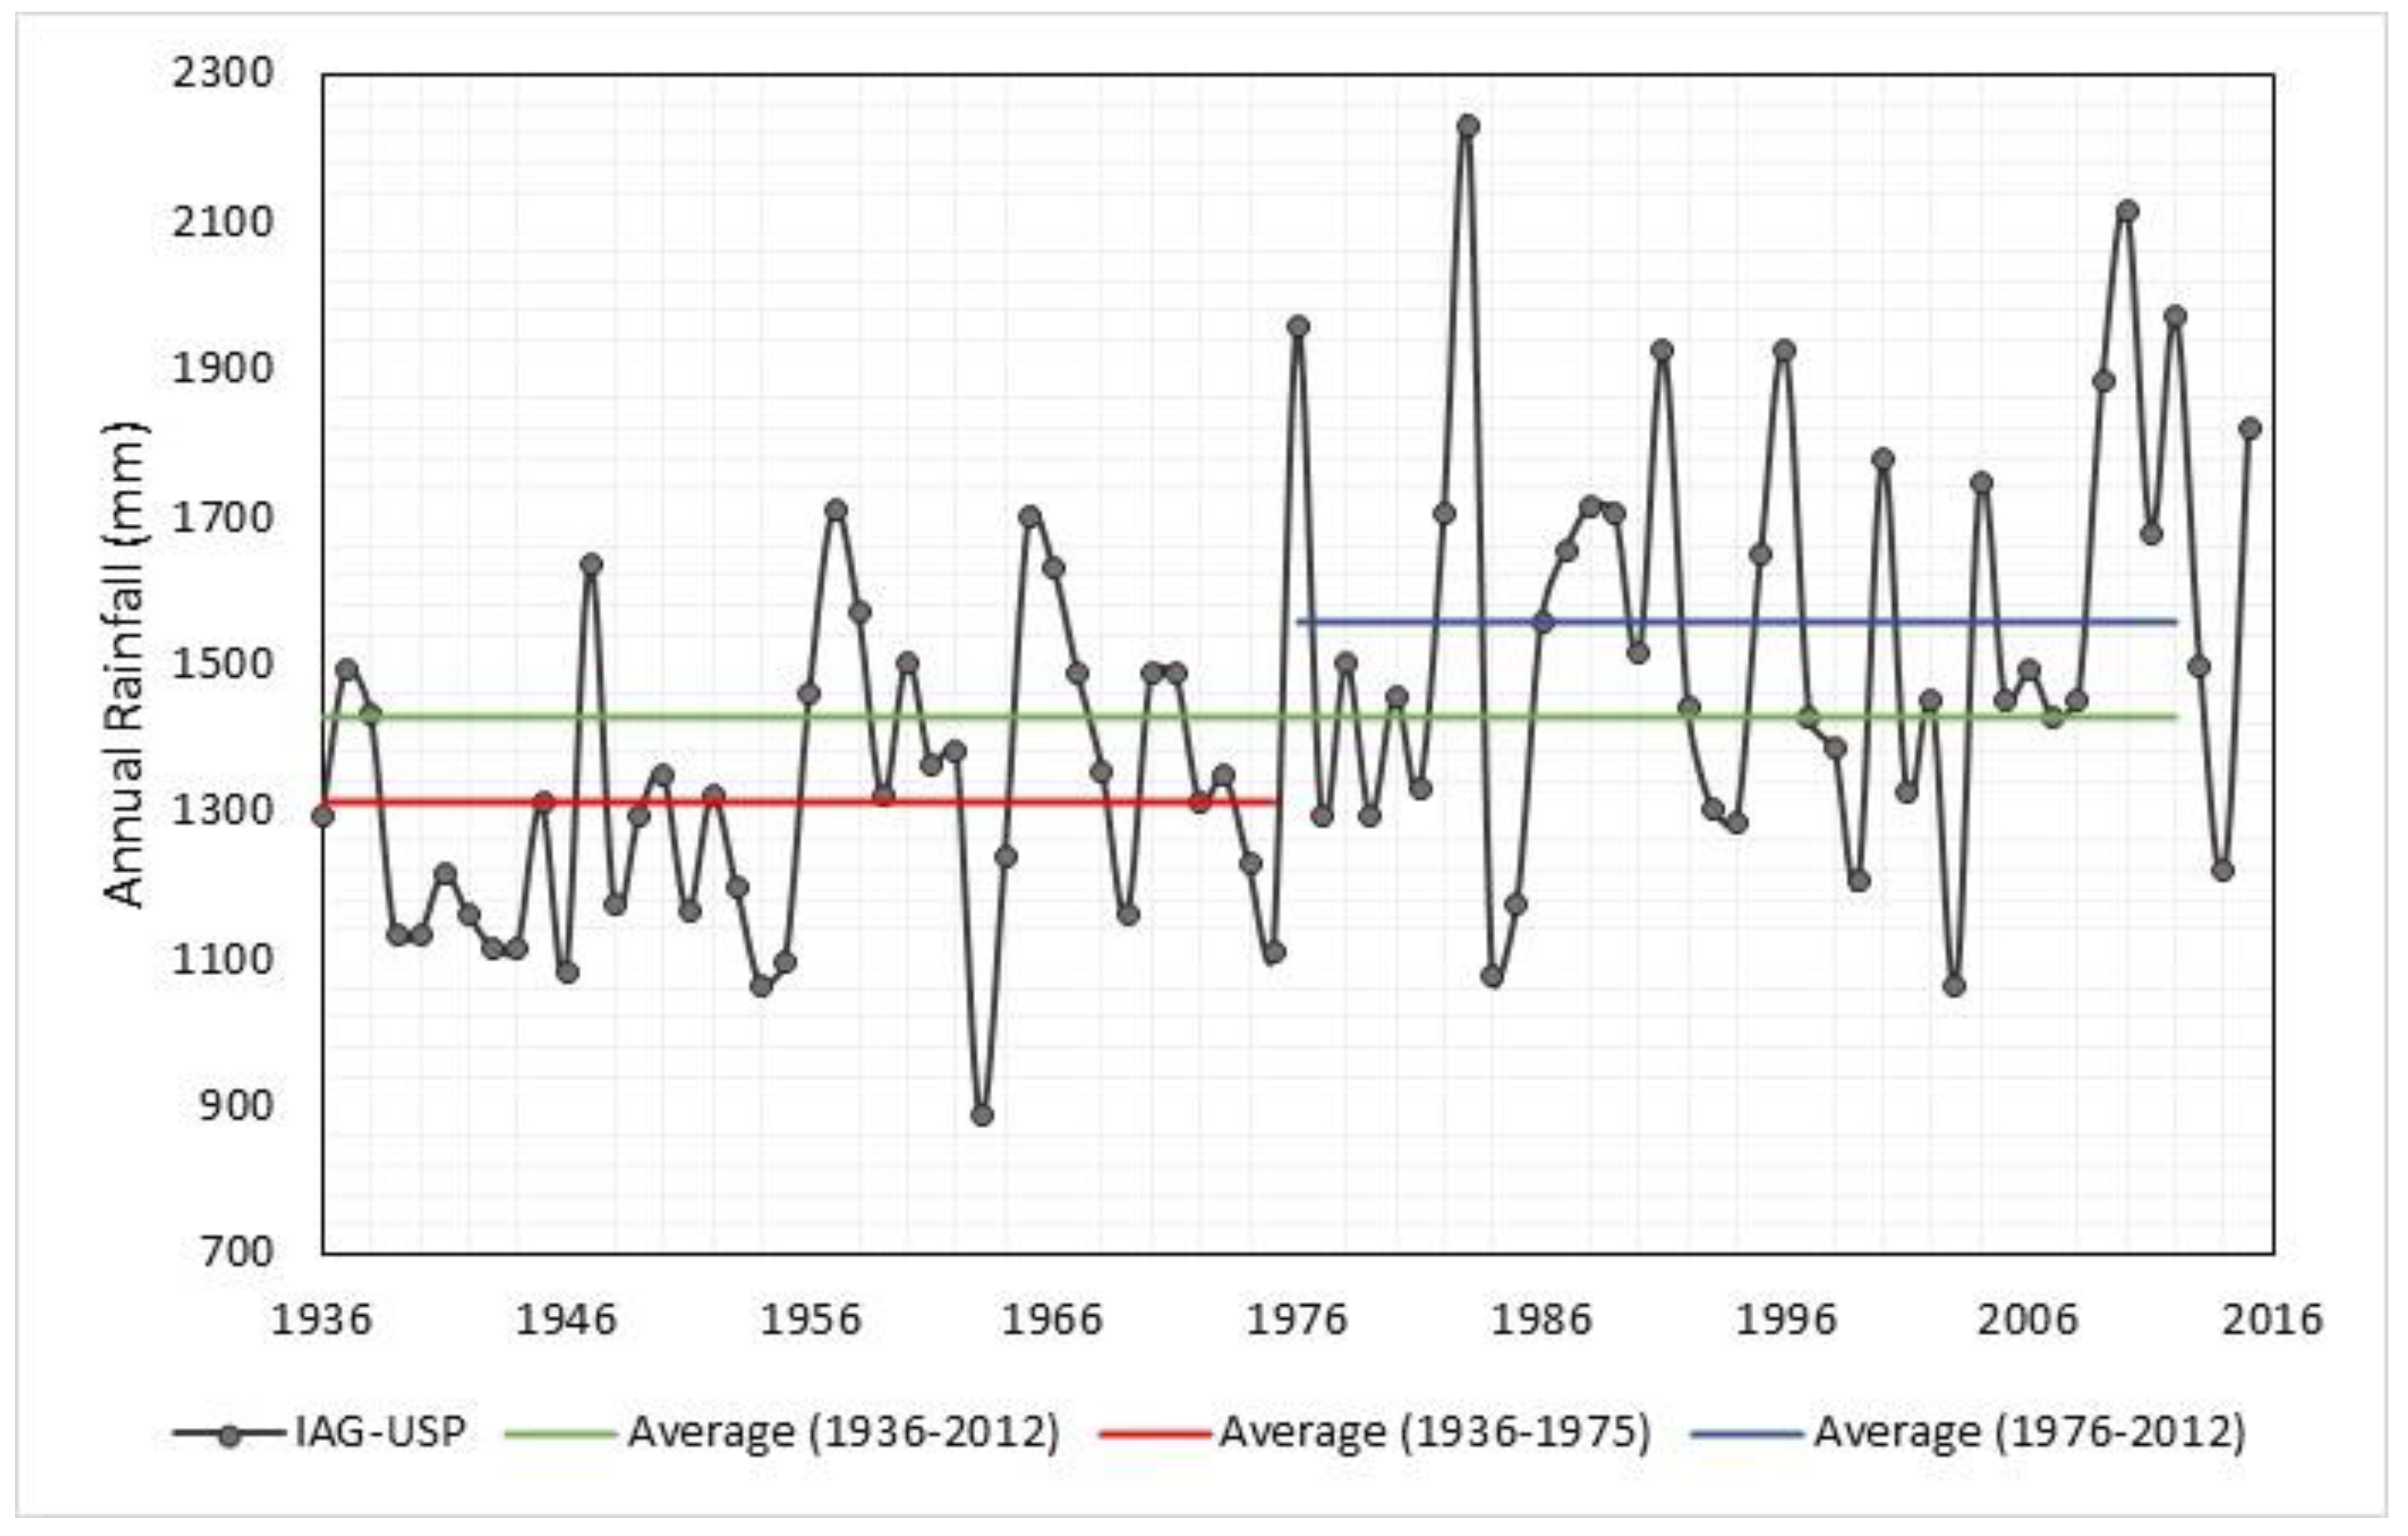
The oldest hydrological monitoring points of the Brazilian official network started to be implemented in the mid-1920s, and gradually, more were installed all over the country, mostly after the 1940s. Thus, the initial studies for the sizing and construction of the Cantareira System were based on the network of hydrometric points available at the time, accumulating between 22 and 27 years of a small series of hydrological records. Additionally, it is noteworthy that as illustrated in
Figure 2, the mean annual rainfall now measured by the rain gauge of the Astronomy and Geophysics Institute of the University of São Paulo (IAG-USP) is 1430 mm. However, the mean annual rainfall of the period between 1936 and 1975 was 1310 mm and, after 1976, 1556 mm. Thus, the Cantareira System was designed with data from a drier period (i.e., data available at the time) and operated in a wetter period until 2012 (1976–2012).
After 12 years of construction, the system started operating in 1974, and the first legal document that managed the use of Cantareira System volume was the Ordinance 750/1974 [
8], issued by the Ministry of Mines and Energy. This process is now considered monocratic since it was carried out without discussion or the broad participation of society [
9]. This document authorized the Company of Basic Sanitation of the state of São Paulo (Sabesp) to collect up to 33 m
3.s
−1 from the Cantareira System to supply the SPMR for 30 years.
During the validity period of Ordinance 750/1974, the Cantareira System experienced two hydrological extremes: the floods of 1982/1983 and the drought of 2001–2003. The first of these was linked to an intense El-Niño that helped to fill the reservoirs to their maximum capacity in six months: four years before the situation foreseen in the original Cantareira System project [
4]. The second hydrological extreme affected Brazil’s southeast and southern regions, resulting in water shortage and electricity rationing [
10]. In the Cantareira System, the persistence of the impacts of the 2001 drought reduced the reservoir to 1.6% of its active storage capacity in 2003 (1 December 2003), one year before the ordinance renewal, leading to a situation of supply crisis in the SPMR.
To solve this problem, Sabesp modified the Cantareira System water levels, artificially increasing the Cantareira System active storage capacity by almost 30% from 765.71 hm
3 to 978.57 hm
3 and allowing the raising of the system’s total withdrawal from 33 m
3/s to 36 m
3/s [
4]. This was only possible because there was an area of about 283 hm
3 between the minimum operational level and the height at which water flowed in, of which 75% was incorporated into the new active storage plan. The existence of this volume was only made public when the volume of the Cantareira System reached 3% of its storage capacity. In the first 30 years of operation, the Cantareira System met its main goal of supplying water to the SPMR, including in adverse climate events such as the 1982/1983 floods as well as droughts in 1984 and the 2000s [
11]. The end of Ordinance MME 750/1974 was approaching, but the renewal process would be different from the 1974 process given the new institutional situation of water resource regulation in the State of São Paulo and Brazil.
The São Paulo State Water Law (State Law 7663/1991) and Brazil’s National Water Law (Federal Law 9433/1997) were approved in 1991 and 1997, respectively. This defined new roles, principles, instruments, and institutional organization, acknowledging the need to integrate multiple uses of water, and decentralized the decision-making process by designating river basins as the territorial units for water management. Moreover, it established river basin committees as venues for discussion and deliberation about projects planned in the basin [
2,
12]. The process of establishing river basin committees triggered by the water resources policies endorsed institutions that had already acted in this way before the São Paulo Water Resources Policies, as well as before the New Water Resources Policies, such as the PCJ Committee.
In 1982, after the Cantareira System started operating, a study group (Special Committee for Integrated Studies of the Jaguari and Piracicaba River Basins—CEEIJAPI) was created to bring together the state and federal agencies with attributions in water management, and this had advisory functions.
Thereafter, a series of events would result in the creation of the PCJ committees, with study groups to discuss quality and quantity problems related to water resources in the region, and the State Council of Water Resources, which had a specialized technical group to discuss priority programs for the PCJ river basin. In 1989, an inter-municipal consortium of water users (i.e., the PCJ Consortium) was established to support governmental institutions for water affairs in the basins. It was financially supported by the municipalities and intended to increase awareness and discuss solutions to the problem of poor water quality [
2,
12].
The approval of the São Paulo State Water Law, and State Decree 34.530/1991, led to the creation of a Work Group between the State and the PCJ Consortium to study and propose forms of integrated action, as well as the creation of a financing program with international agents and the federal government. This started a process that, two years later, would become the committee for the hydrographic basin of the Piracicaba, Capivari, and Jundiai rivers (i.e., the PCJ Committee). Later, the Federal PCJ Committee and the Minas Gerais State Committee (CBH-PJ) were also formed: in 2002 and 2008, respectively.
This path of greater social organization and the institutionalization of the basin strengthened the basin committee and allowed a process of concession renewal, in 2004, that was very different from the process that had taken place in 1974. The role played by civil society was essential at this moment since it demanded shared management of the Alto Tiete and PCJ regions to replace centralized management [
9]. As an example of this strengthening: the renewal of Ordinance MME 750/1974 for 30 more years was initially considered and supported by Sabesp and the Brazilian Water Agency (ANA). However, representatives of the PCJ committee advocated for a 10-year concession, which was approved [
9,
13]. The objection to the renewal of the concession for another 30 years by the PCJ Committee was due to the near-emptying of the reservoir in December 2003, which demanded hydrological studies to prevent a future collapse of the system.
2.3. The Operation during the Ordinance DAEE 1.213/2004
With the expiration of Ordinance MME 750/1974 approaching, the ANA and the Department of Water and Electricity of the State of São Paulo (DAEE) started joint studies to devise a new legal document that would assist in the management of the Cantareira System through simple and robust operational rules. These studies resulted in Ordinance DAEE 1213/2004 [
14], which presented three major operational changes: (1) the validation of changes in the water levels of the Cantareira System made by Sabesp, (2) the creation of a methodology of Risk Aversion Curves (RAC) and the definition of primary and secondary uses, and (3) the proposition of a water bank.
The first operational change validated the Sabesp operational maneuver of the 2001–2003 drought. However, this operation exposed the Cantareira System to flooding and drought risks, as will be observed further on.
The second rule refers to the adoption of the RAC methodology, in which the total rate of withdrawal flow of the Cantareira System, referred to as “X”, is determined as a function of the “State of the Equivalent System”: that is, the percentage of the current volume (in the current month) to the useful operational volume.
The RAC methodology was created to discipline the withdrawal of the Cantareira System volume. Until 2004, the most critical hydrological scenarios that had been observed were the droughts of the biennium 1953/54. Thus, adopting this scenario, the withdrawal of the Cantareira System volume was estimated by a function of its volume, considering that after two years there would be a strategic reserve of 5%. Thus, Ordinance 1213/2004 defined the primary and secondary uses for the water in the Cantareira System: primary uses were 100% ensured, and secondary uses would depend on the volume of the Cantareira System.
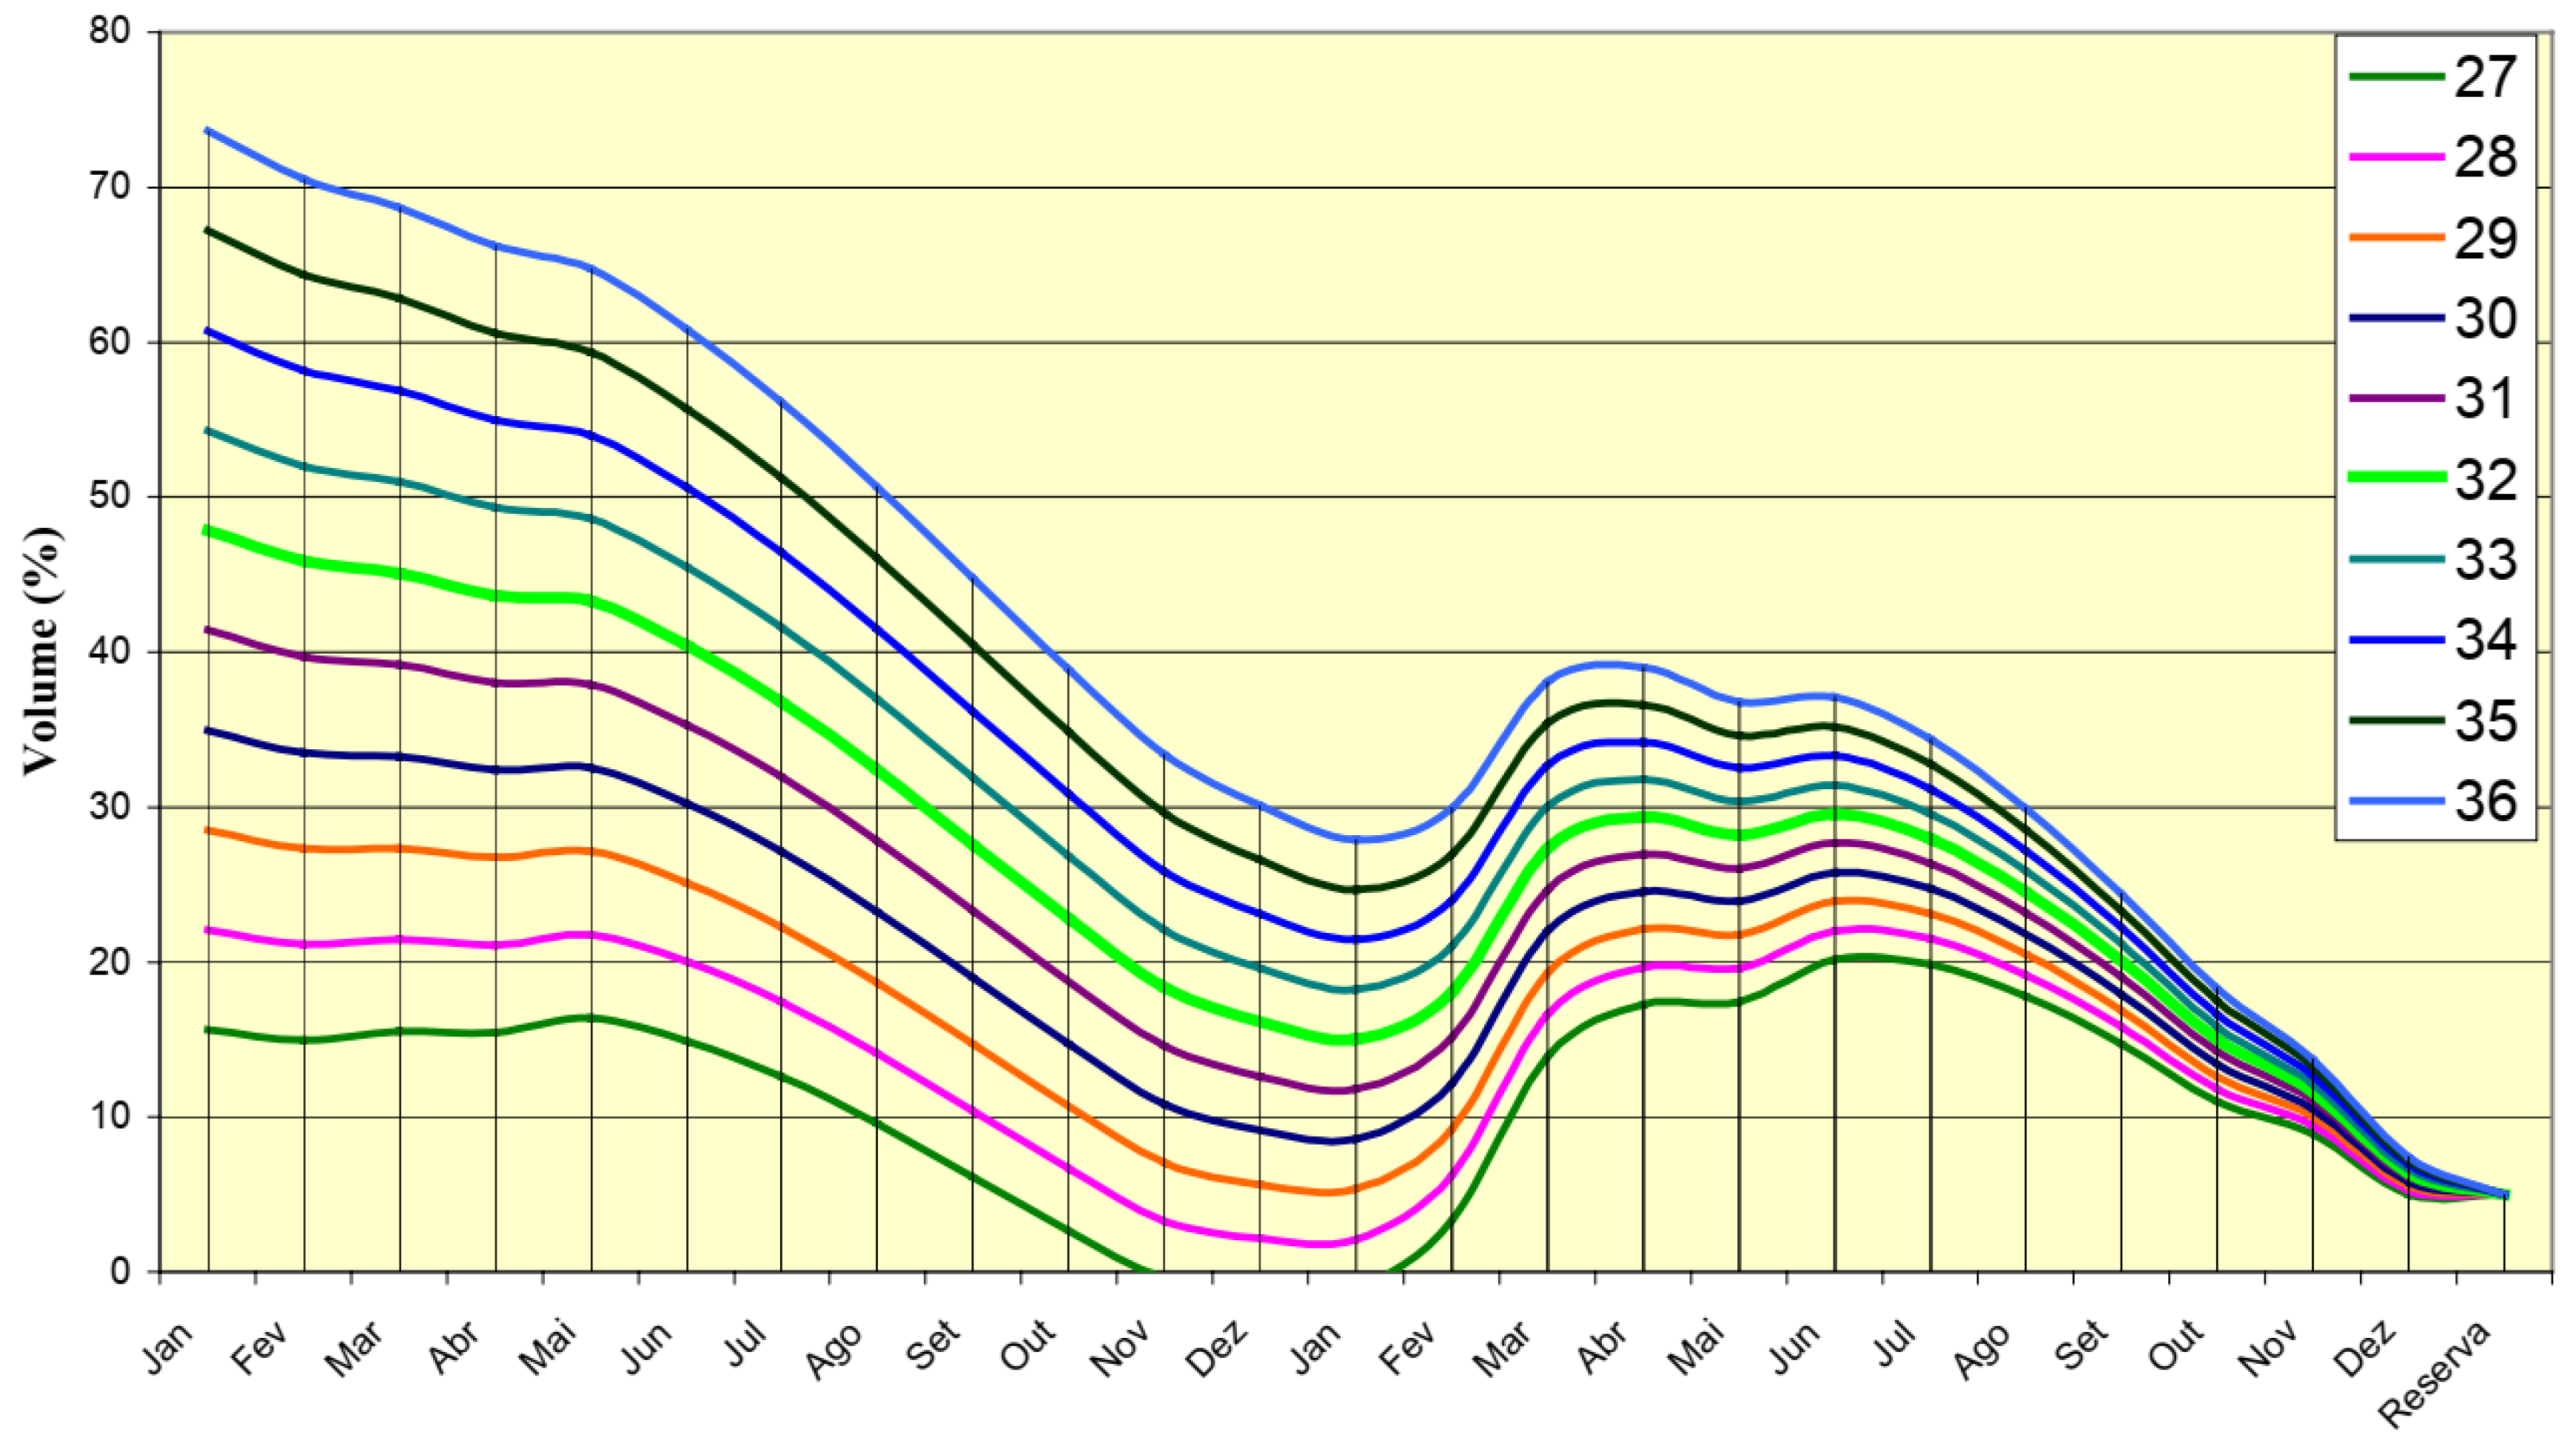
Table 1 presents the allowed withdrawal flows according to priority and
Figure 3 illustrates the application flowchart of this rule. The main purpose of the RAC methodology was to extend the use of the Cantareira System volume in case of longer droughts through the analysis of hydrological balance, defining the reduction of derivation according to priorities and monthly volumes.
From the joint analysis of ANA and DAEE [
15] it can be concluded that the adoption of the RAC methodology, considering the hydrological scenario of the years 1953/1954, would have been a robust tool as a variable operating rule, ensuring the preservation of the reservoirs until the stipulated minimum volume.
However, it must be noted that the simulations had been prepared for the historical series up to 2013 and ensured operation by the RAC for drought events equal to or “less severe” than the 1953/1954 biennium. The inflow series used in these hydrological simulations contains the long wet post-1975 period, and after 2000, there are indications of a new long dry period [
4] whose low inflows tend to be persistent, causing less regularization by reservoirs, and this indication is presented in the sections ahead.
The third operational rule was the creation of a water bank, which created a water balance resulting from the saved volume [
14,
15]. Every time the volume used was less than the amount granted, the user had a water credit. However, as mentioned in the previous section, the rainfall regime changed. A drier period had occurred between 1936 to 1975, which was the period of the data used in the system conception and reservoir sizing studies, and a wetter one occurred from 1976 to 2012, when the system started to operate. Thus, in this new climatic reality, the available useful volumes were no longer sufficient to maintain the same regularization flow. Although the annual totals had increased by about 10 to 15%, the length of the rainy period reduced and that of the dry period increased.
Ordinance 1213/2004 proposed a balanced use of the Cantareira System volume until its renovation, which would occur in 2014. However, between 2013 and 2015, the occurrence of an extreme drought provoked conflicts between Sabesp and the PCJ Committee. This drought would be later known as the Water Crisis.
2.4. The 2014–2015 Water Crisis
Although the basin committees of PCJ rivers are among the best structured and organized cases in Brazil due to the high technical and management capacities of its municipalities in the Intermunicipal Consortium of the PCJ basin (involving municipal governments and companies) and at the Regulatory Agency [
16], from 2013 to 2015 the southeastern region of Brazil experienced the most severe and intense recorded drought, and thus the region was under constant pressure and risk of water insecurity.
The three main rainfall sources of this region are (1) the South Atlantic Convergence Zone, (2) the South Cold Fronts, and (3) the Low-Level Jets [
17]. When those three mechanisms act together, the average rainy season over Brazil’s southeastern regions extends from October to April [
17]. However, an intense, persistent, and anomalous high-pressure system occurred in the southeast region in the summer of 2013/2014, not allowing the action of those mechanisms, thus resulting in low rainfall levels [
11].
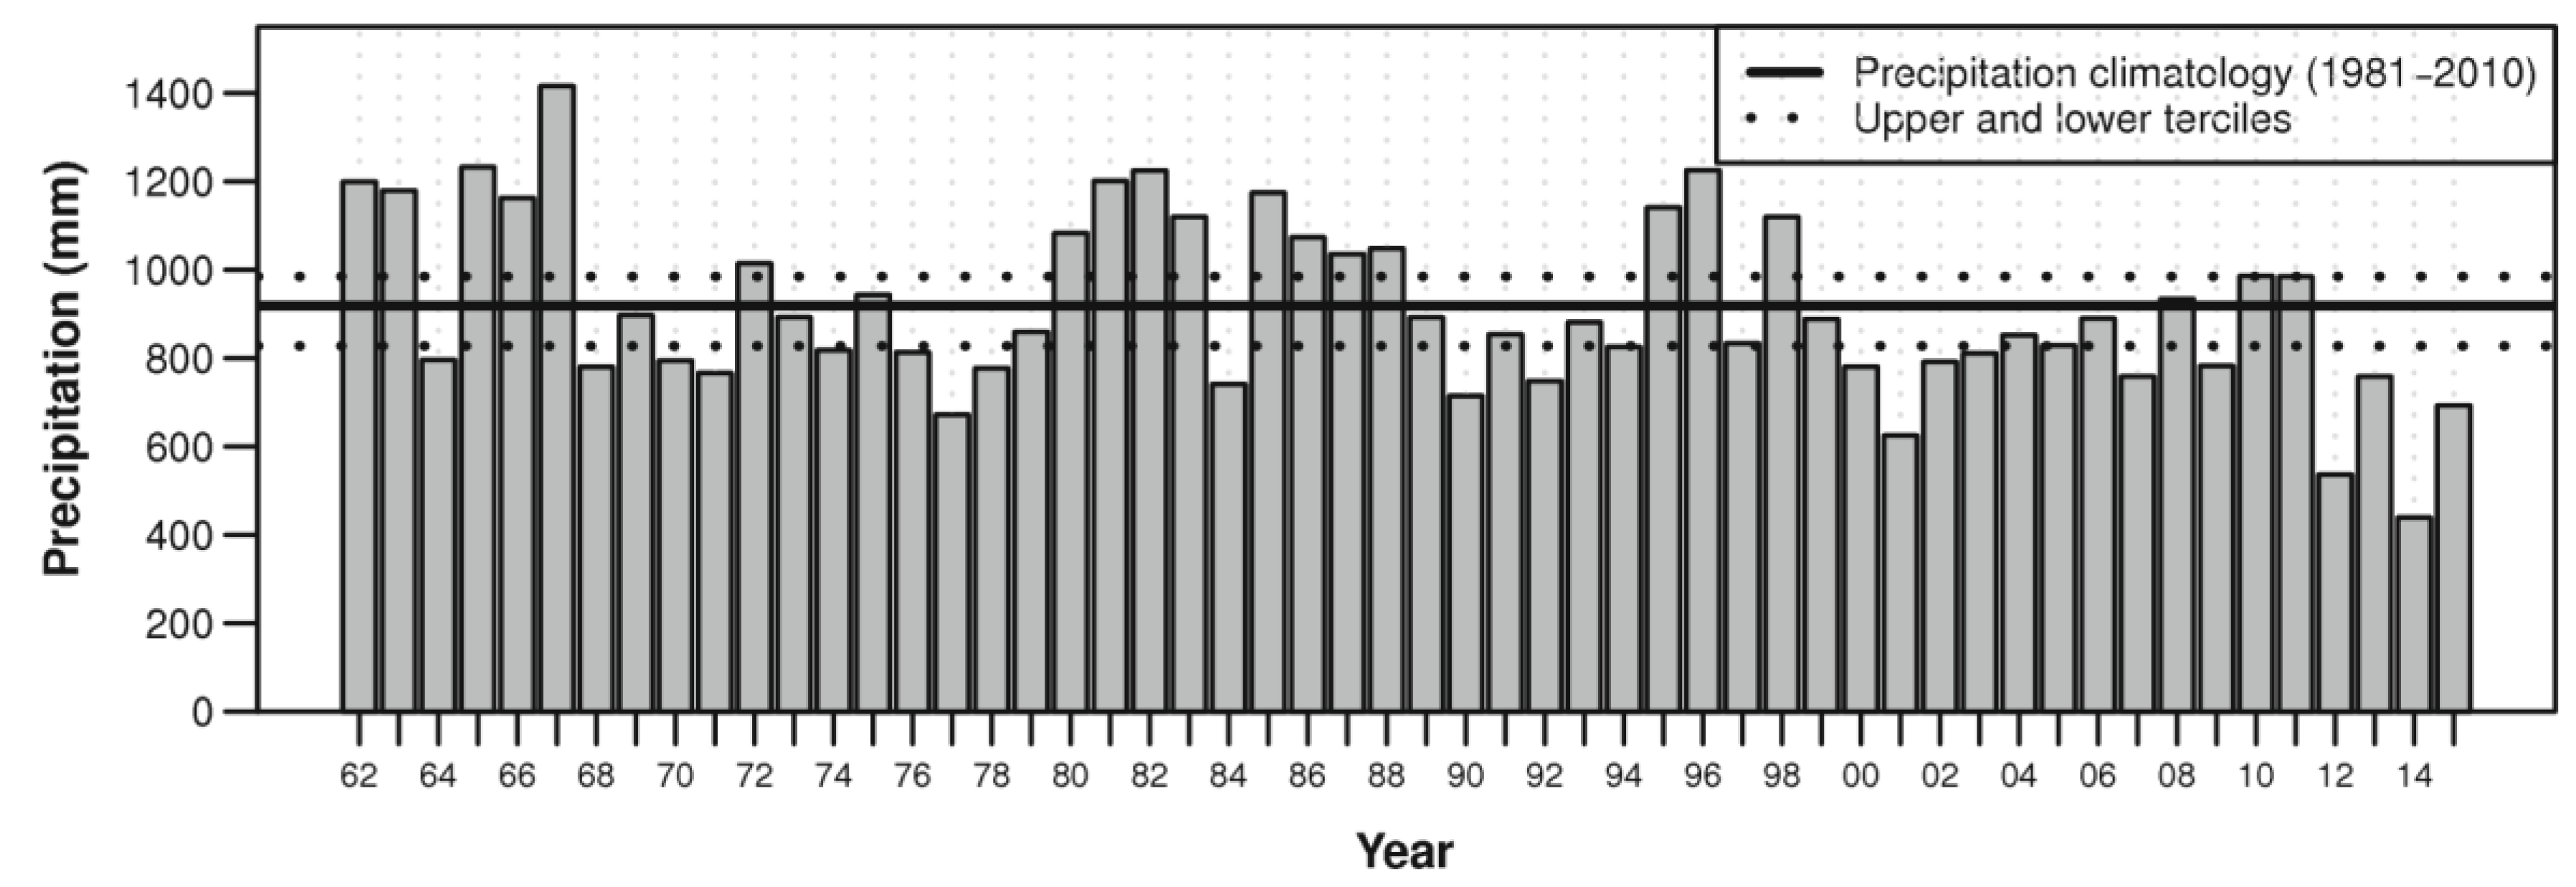
In the SPMR, the rainy season is between December and March. From 1981 to 2014, the average accumulated rainfall between these months was 918.7 mm, with the lower and upper terciles being equal to 827.6 mm and 984.8 mm [
18], respectively, as illustrated in
Figure 4. During the rainy seasons of 2013/2014 and 2014/2015, the total precipitations were equal to 439.0 mm and 692.8 mm, respectively [
18]. The probability of observing total precipitation lower or equal to the former value during a rainy season is 0.01%, whereas that of observing total precipitation lower or equal to the latter is 7.13% [
18]. These probabilities show how extreme and rare this drought was.
In October 2013, the volume of the Cantareira System was considered normal, reaching almost 40% of its capacity. In normal years, a rainfall volume of 1.187 hm
3 (
Table 2), which is enough to fill the Cantareira System until it overflows, is expected. However, low rainfall indices resulted in only 385 hm
3, causing a deficit of 802 hm
3 in relation to the average.
Table 2 presents a summary of expected and observed volumes for the biennia 2013/2014 and 1953/1954, wherein the deficit of the former can be seen to have been 40% greater than that observed in the latter. As a result, the Cantareira System lost 28% of its volume at a constant rate of 4% per month, reaching 12.5% of its volume capacity in April 2014: less than the minimum expected for this month by the RAC methodology [
19]. The fast depletion of the Cantareira System that was caused by this unprecedented drought has been popularly called the Water Crisis.
By analyzing the data of the rainy season presented in
Figure 4, we can see that the volume of rainfall in the rainy season after the 2010 and 2011 floods was below the lower tercile. Thus, the water deficit had been occurring at least for two years before the Water Crisis. Extending the analysis for the period between 1998/1999 and 2014/2015, in which two droughts and one flood occurred, we observe that only three rainy seasons had rainfall volumes above the average, highlighting that the season of 2009/2010 was above the upper tercile. However, the remaining 14 rainy seasons presented rainfall volumes lower than the average, highlighting the fact that during ten seasons, the rainfall volumes were below the lower tercile. Similar results were found when analyzing data obtained by satellite [
20]. These findings indicate that the Brazilian southeastern region has been suffering from a continuous water deficit that has raised the probability of water shortages in the Cantareira System. In addition, several authors have pointed out external factors that contributed to the worsening of the Water Crisis, which are summarized in
Table 3.
2.5. Impacts of the 2014/2015 Water Crisis
The negative impacts of the Water Crisis were enormous for the different productive sectors of society and resulted in a loss of USD 5 billion for Brazil, which particularly affected the agricultural sector [
24]. It is worth noticing a 20% reduction in the production of the 2014 sugarcane crop compared to that in 2013: from 40 to 32 million tons [
25].
Hydroelectric production was also severely affected, and it was necessary to turn on thermoelectric plants to maintain electricity production. This decision led to a constant readjustment of the red and yellow electricity tariff flags during 2013 and 2014, culminating in increases of 83% and 67%, respectively, at the beginning of 2015, and this raised electricity bills by 15%. This increase contributed to a 0.25 percentage-point increase in inflation for the period [
26,
27] and affected the mining sector, causing a 20% drop in aluminum production [
28].
In the SPMR, the Water Crisis was responsible for the implementation of rationing measures by Sabesp such as the reduction of pressure in the water distribution networks and the interruption of the water supply. Before the 2013/2014 water crisis, water from the Cantareira System had supplied about 47% of the SPMR’s demand and 65% of the demand of the municipality of São Paulo. After the beginning of the crisis, it was necessary to transfer about 2.7 m
3/s (in 2014) from the Alto Tiete System to supply the eastern part of the SPMR [
6]; it required intensive infrastructure work to ensure the supply of the region.
The economic consequences of these measures were an average increase of 6.11% in water tariffs and 14.6% in the value of bottled water between 2014 and 2015 [
27]. The social consequences included the sporadic interruption of activities in 45 schools located on the outskirts of the city of São Paulo, some of which did not have enough water to operate toilets or prepare food, and an increase of more than 50% in cases of diarrhea and outbreaks of hepatitis A [
29,
30]. The legal consequence, in turn, was the revision of the contracts signed between Sabesp and large water consumers by the Public Ministry of the State of São Paulo and the Sanitation and Energy Regulatory Agency of the State of São Paulo in order to reduce the number of customers benefiting from lower tariffs due to high consumption [
31,
32].
In the PCJ basins, due to the Water Crisis, more than three thousand jobs were lost and, for the first time in history, a withdrawal restriction of 20% for domestic and agricultural uses and 30% for industrial uses had to be implemented in the Camanducaia and Atibaia rivers in early 2015 [
33,
34].
In Campinas, the Water Crisis caused a lack of supply in some areas of the city, affecting 261,000 people, interrupting commercial activities such as the operation of bars and restaurants, and causing a 15.30% increase in the price of horticultural products by the end of 2014 [
35]. Regarding the Atibaia River: the low flow reduced the capacity for dilution and self-depuration of pollutants in the CMR, increasing by 60% the cost of water treatment by the Campinas Water Supply and Sanitation Company (SANASA) in 2014 and 2015 [
36]. Another consequence of the low flow was the release of foul odors in some stretches of the Atibaia River and its tributaries due to the decrease in their capacity to dilute pollutants [
36].
2.6. Coping with the Water Crisis
Several measures were taken to address the water crisis. Noteworthy among these was the adoption of environmentally sustainable habits by the population, which led to a 30% increase in the sales of more efficient bathroom fixtures, such as automatic taps, in 2015 compared to 2014 [
37]. In the SPMR, another incentive factor was the policy adopted by Sabesp to grant its consumers discounts proportional to the volumes of water saved and to impose fines on those who increased consumption during the period [
38].
To increase the resilience of the SPMR in the face of new extreme events, several structural measures have since been implemented, such as the transfer of up to 5.15 m
3·s
−1 from the Paraiba do Sul River Basin to the Atibainha Reservoir, one of the Cantareira reservoirs, thus increasing the water security of the SPMR and the Piracicaba River Basin. In the opposite direction, this transfer can also increase the water security for the inhabitants of the Paraiba do Sul River Basin Region and the Metropolitan Region of Rio de Janeiro by transferring up to 12.20 m
3·s
−1 from the Atibainha Reservoir [
39].
In the PCJ basins, in addition to adopting rationing measures and habit changes by the population, several measures related to reforestation and soil conservation that had been proposed in the Master Plan for Forest Recovery of the PCJ basins were approved [
40]. Among these measures, the reforestation of 360 hectares of permanent conservation areas of the riparian forests of the main rivers in the basins between 2018 and 2028, and the implementation of the Payment for Environmental Services program, stand out [
41].
In Campinas, besides the adoption of traditional measures to face the Water Crisis, such as rationing and rotation in water distribution, the municipal government of Campinas and SANASA announced, at that time, a plan for the implementation of planning, management, and incentive instruments for the protection of water resources in Campinas [
42]. The proposed measures included a technical feasibility study to build a reservoir for the municipality and the elaboration of Campinas’ Municipal Water Resources Plan.
The first action resulted in the preparation of the “Nosso Cantareira” reservoir and Pedreira Dam projects. The “Nosso Cantareira” project consists of the implementation of a reservoir at the Atibaia River with a water mirror area of 1.63 km2 and a volume of 17.45 hm3, increasing the water availability by 2 m3·s−1. To date, this project has not been implemented. The Pedreira Dam, located between the municipalities of Pedreira and Campinas, is a rockfill dam in the Jaguari River with a water surface area of 1.81 km2 and a volume of 26.31 m3. The construction of this reservoir is in progress.
These projects are characterized by the fact that their floodplains lie in the Campinas Environmental Protection Area (APA Campinas), becoming the subject of discussions among different sectors of society—especially those related to environmental issues [
17]. Regarding the actions of the basin committee: we can mention a prompt response to the drought, at the beginning of 2014, by the creation of the Drought Working Group (DWG), which is a technical group that is part of the PCJ Committee, with an advisory core consisting of the Executive Branch of the Committee from the drought season period; this group operated in 2014 and 2015 [
12].
The actions by the DWG included the development of public advertising campaigns about the drought, the increase in municipal laws to encourage the reduction of water consumption, the sharing of knowledge between actors and in social networks about municipal experiences in dealing with water scarcity, the monitoring of the Cantareira system with the incorporation of data from public and private users, and the guidance of municipalities in the preparation of contingency plans.
2.7. The Renewal of the Grant after the 2014–2015 Water Crisis and New Operating Rules
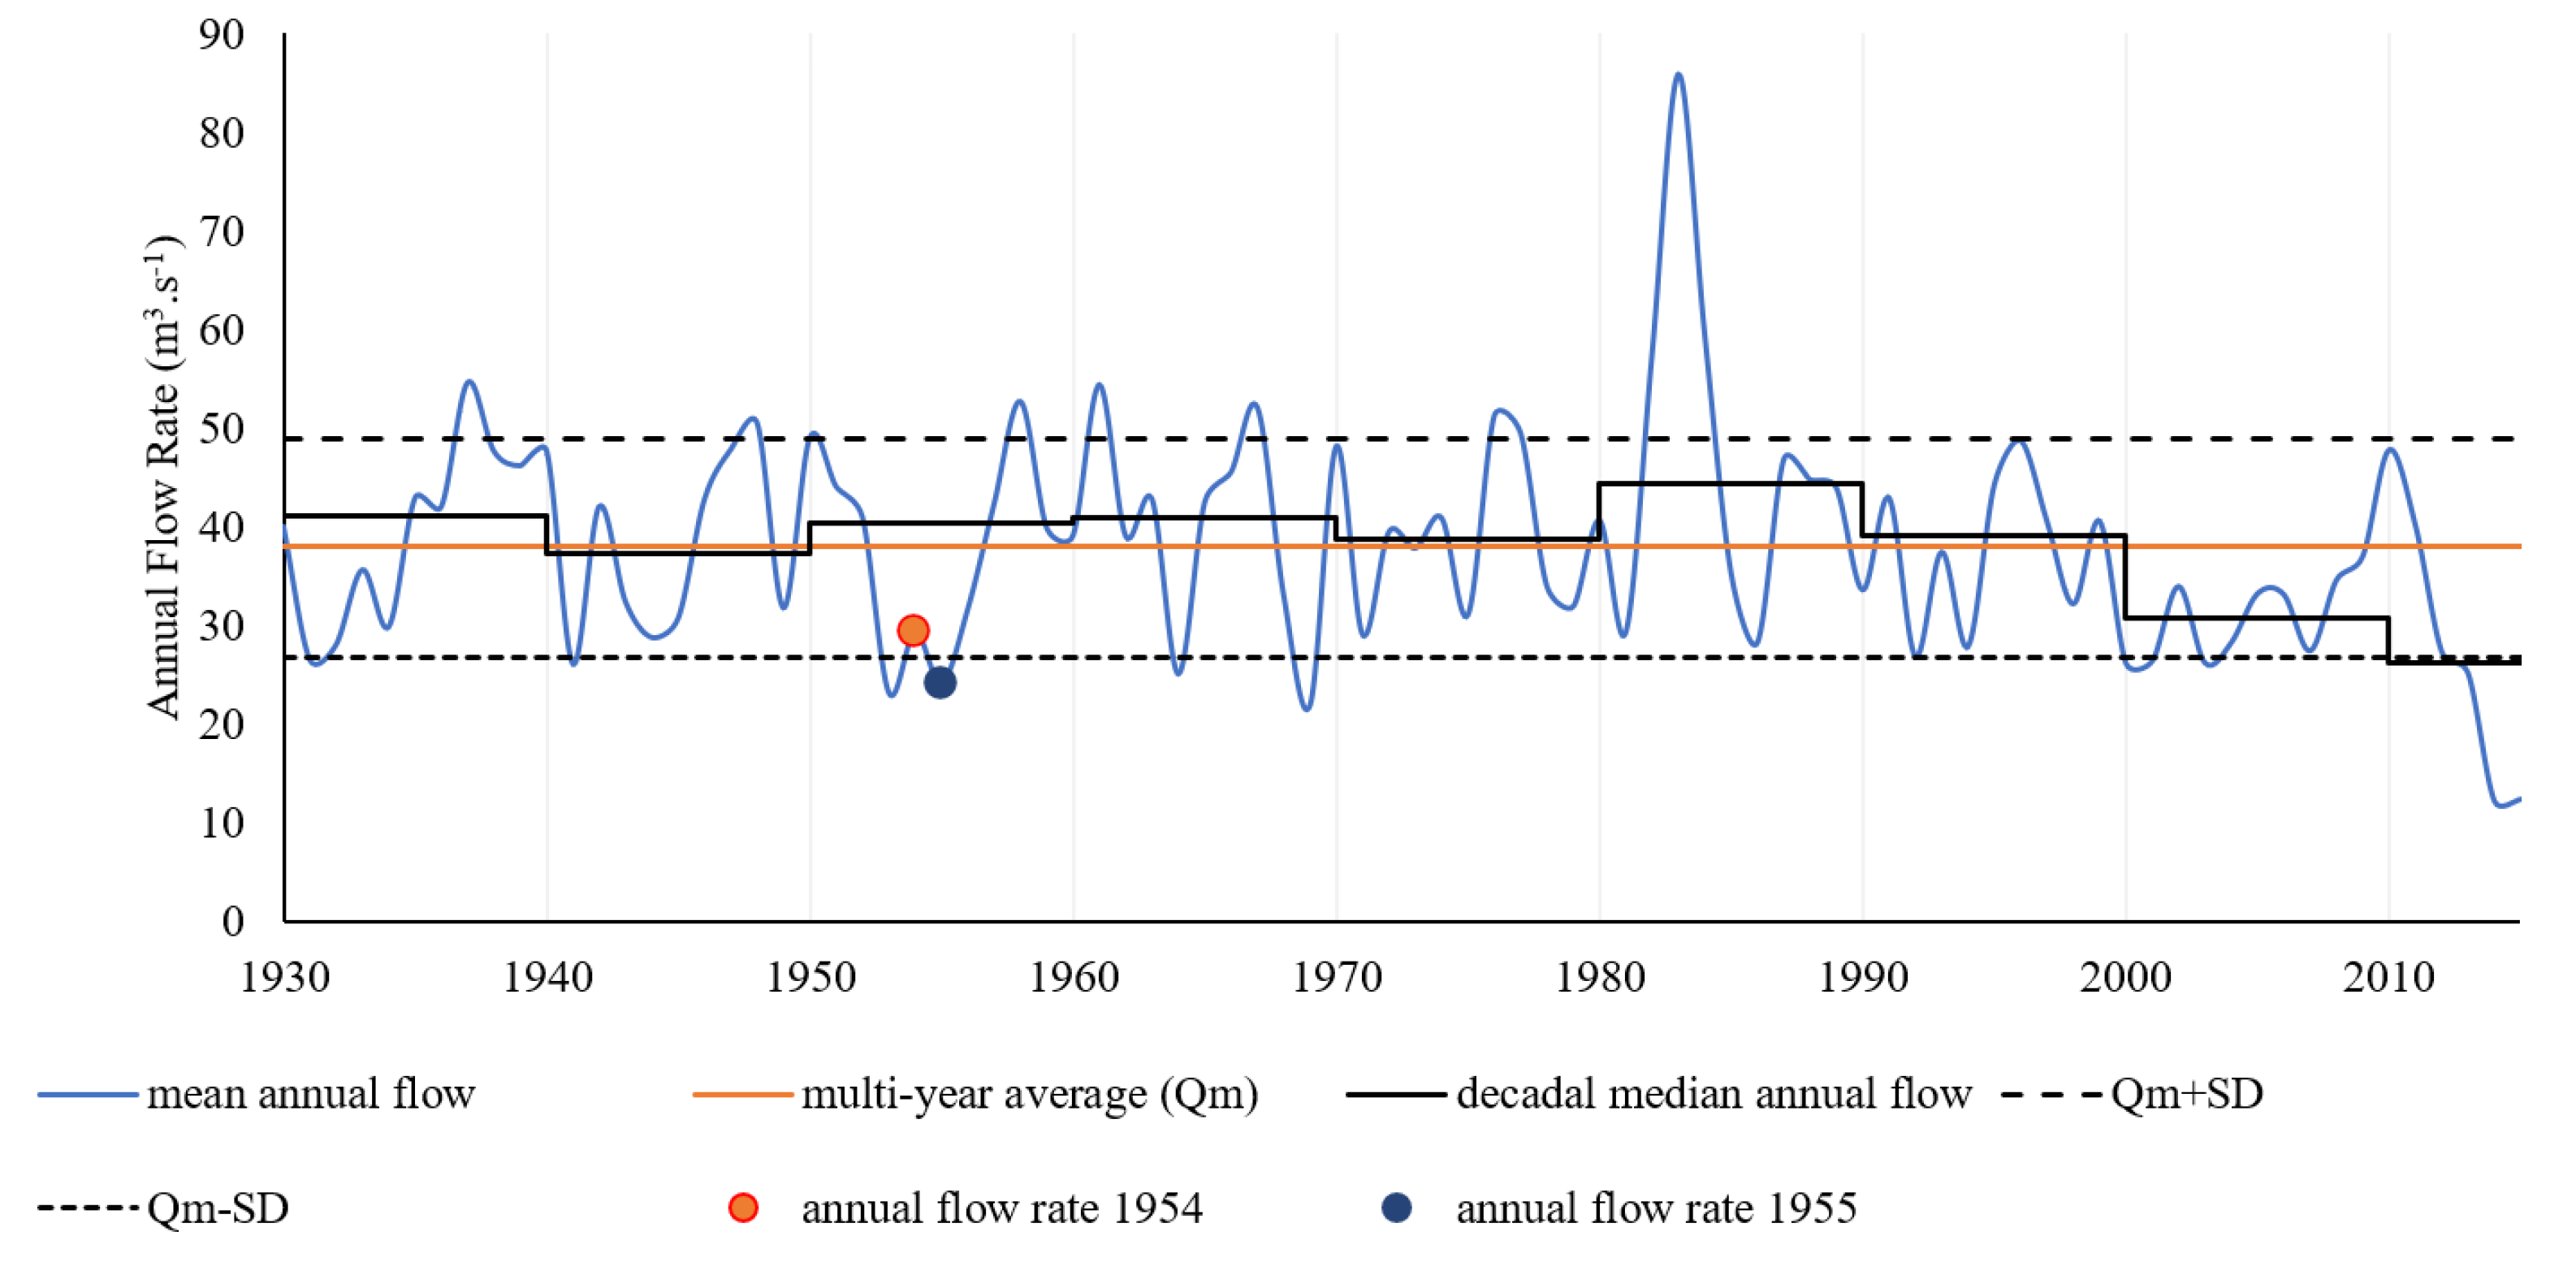
The fluviogram in
Figure 5 represents the historical series of average flows (Qm) of hydrological years for the Cantareira System from October 1930 to September 2015. The multi-year long average (Qmlp = 38.15 m
3·s
−1) is represented by the red line, and the dashed and dotted lines are, respectively, the average (Qmlp) added and subtracted by the standard deviation (SD). The line segments in black are the decadal averages. In this figure, the historical series called “Equivalent System” comprises the sum of the inflows into the reservoirs, i.e., the inflows through the Jaguari-Jacarei, Cachoeira, and Atibainha reservoirs.
Until around the time of the first renewal of the Cantareira ordinance, the annual water levels flowing into the system varied around the multi-year average; in the long period from the late-1950s to the late-1990s, the water levels were generally higher than the average and, until 1975, there were several observations of annual water levels being higher than the upper limit represented by the dashed line (mean plus standard deviation).
Starting in 2000, the annual inflows gradually decreased.
Figure 5 shows that there was a clear decrease in the average flows from the hydrological years 1999/2000 to 2006/2007 and, even more prominently, from the hydrological years 2011/2012 to 2014/2015. It also shows that the flows of the hydrological years 2013/2014 and 2014/2015 had lower values than the hydrological years 1953/1954 and 1954/1955, which had been the driest until 2012.
Table 4 shows the average, maximum and minimum annual flows for the period from 1931 to 1975 (before the construction of Cantareira System reservoirs) and the period from 1975 to 2015, with the average flows grouped by decades.
As shown in
Table 4, for the Equivalent System and all the reservoirs, the maximum flows occurred in the hydrological year 1982/1983 and the minimum flows occurred in the hydrological year 2013/2014, except for the Cachoeira Reservoir, which had its minimum flows in the hydrological year 2014/2015.
Upon analyzing the variation of the average annual flows in the Equivalent System (Qm) between the two highlighted periods, the averages (Qm) up to 2014/2015 were found to be slightly lower than the historical records, in which the interference of the reservoirs had not yet been recorded (from 1930/1931 to 1974/1975) in the Cantareira System tributaries.
The third Ordinance renewal should have occurred in 2014. However, the 2014/2015 drought caused a reduction of the water volume in the waterbodies, and so the 2004 permit was extended by ANA and DAEE to 2017 when the concession was issued with a 10-year validity [
43]. The water shortage and the resulting conflicts between different actors had strong influences on the new terms of the current concession [
2].
Hydrological studies on the regularization of flow by the Cantareira System were prepared by the Hydrologic Laboratory of the Campinas State University (LADSEA) and are contained in Consolidated Report VII, titled “Technical Report in Support of the Water Monitoring Program with a Focus on Hydrological Studies on Improvements in the Operation of Reservoirs, with Emphasis on the Cantareira System, to Study Operating Rules and the Bases for Renewal of the Transposition Grant for the Upper Tiete Basin,” which was prepared in July 2014.
The recent extraordinary scarcity with low affluence, as of 2013, showed that the RAC operating model elaborated for the 1953/54 biennium was insufficient to maintain the integrity of the reservoir and the regularity of withdrawals and downstream derivations during this period. Given the inefficiency of these operating rules in the face of the acute adverse condition, the operation by RAC 53/54 was abandoned in early 2014, with the withdrawals being defined according to a contingency regime.
During the discussion on the renewal of the Cantareira Grant Ordinance in 2014, the RAC was suggested to be reissued using, as a reference, the drier 2014/2015 biennium. The use of operating rules based on the critical 2014/2015 scenario would lead to the under-utilization of the Cantareira System, since it would prioritize water sustainability, with a low risk of supply failure.
The operation of the reservoirs under normal scarcity conditions (as predicted until mid-2013) using the RAC for the 2014/2015 scenario would keep the reservoirs frequently high, resulting in low operational efficiency.
The discussions about the renewal of the Cantareira concession indicated a demand to improve the operating rules modeled by the RAC that would guarantee the high operational efficiency of the reservoirs, robustness in the operation of the Equivalent System, and the flexibility to change in the face of hydrological scenarios of extreme scarcity or high inflows with the risk of spillages through the safety overflow devices. Given this, ANA and DAEE proposed the Cantareira System model of operating ranges, which is a more flexible approach to the RAC. This model simplifies the system’s operation since it defines the limited withdrawal flows on the basis of reservoir operation zones [
44], as shown in
Table 5.
According to the description of the proposed model, except for the wet zone (Band 1), the withdrawal limits will be established only as functions of the state of the Equivalent System, regardless of the period of the year, as predicted in the RAC methodology.
Band 1, called the wet zone, which foresees the allocation and use of the reservoirs’ waiting volume, allows high withdrawal and tries to minimize and control extreme events of maxima downstream.
From Bands 2 to 4, the withdrawal flows decrease linearly both for the PCJ and the Alto Tiete, with intentions that go from (i) meeting the average annual demands of Sabesp and releases to the PCJ (Band 2) to (ii) restricting the water use to replace the volume of the Equivalent System (Band 4).
The special operation zone (Band 5) foresees the occurrence of extraordinary periods of drought, such as the current scarcity of 2014/2015, with withdrawals defined according to (i) the forecast of inflows, (ii) a contingency plan for scarcity, and (iii) the sustainability of the system (avoiding the full exhaustion of the technical reserve of the reservoirs).
Although this zone is defined from the state of 20% of the useful volume, the technical reserve is expected to be used up to the limit extracted by pumping from the dead volume. Besides its operational simplification, the model’s gain in operational sustainability comes from its incorporation of a forecast of severe drought events as in the 2014/2015 biennium.
Considering the total withdrawal of Bands 1 to 4, an average capture of 35.5 m3.s−1 is calculated for the Equivalent System; the proposal of a special operating range (5) displays an evolution of the previous model since it incorporates, into the management model, the risk of the non-predictability of long events of critical drought that have not yet been observed in the simulated hydrological series.
According to the justification provided for the new model, the operation by bands is expected to provide a better use of the useful volume, with a higher level of compliance with the target withdrawal because, as we can observe in
Table 6, one of its main features is its lack of operational rules.
On the other hand, the striping model presents advantages over the RAC because (i) it would simplify decision-making regarding withdrawal flows and (ii) it has clear rules for critical periods of prolonged, severe drought.
It is worth highlighting that the desired operational efficiency will only be achieved if the operating rules are adjusted to the hydrological period of the historical series, i.e., it would be necessary to make these rules more flexible in addition to conditioning the system’s withdrawal based on the levels of the reservoirs.
When adopting a set of fixed operating rules for a multiannual regularization system, it should be decided whether (i) the reservoirs’ hydric sustainability will be privileged, assuming more restrictive flows for distribution, or (ii) there will be a focus on the system’s operational efficiency by allowing a high frequency of peak reductions in reservoir levels and withdrawal flows.
A possible alternative that combines both objectives would include making the model’s operating rules more flexible, thus conditioning it to the relevant hydrological period, i.e., a long wet period alternating with a long dry period.
For this purpose, it is suggested that, besides submitting the withdrawal to the state of the Equivalent System, the limits of the withdrawal flows should be defined according to whether the historical series would be in a period of high or low inflows.
To identify the “hydrological period”, it is necessary to establish a consistent and easily monitored estimate that enables the adoption of this conditioning factor and, thus, the evolution of the reservoir’s operation model, thereby modernizing the management of the Cantareira Equivalent System.

 ,
, 


