Article

Applying Floodplain Inundation Modeling to Estimate Suitable Spawning Habitat and Recruitment Success for Alligator Gar in the Guadalupe River, Texas

by
Kimberly M. Meitzen
1,*,
Clinton R. Robertson
2,
Jennifer L. Jensen
1,
Daniel J. Daugherty
2,
Thomas B. Hardy
3 and
Kevin B. Mayes
2
1
Department of Geography and Environmental Studies, Texas State University, San Marcos, TX 78666, USA
2
Texas Parks and Wildlife Department, Inland Fisheries, Austin, TX 78744, USA
3
Meadows Center for Water and the Environment, Texas State University, San Marcos, TX 78666, USA
*
Author to whom correspondence should be addressed.
Hydrology 2023, 10(6), 123; https://doi.org/10.3390/hydrology10060123
Submission received: 31 March 2023 / Revised: 5 May 2023 / Accepted: 26 May 2023 / Published: 31 May 2023
(This article belongs to the Special Issue Flood Inundation Mapping in Hydrological Systems)

Abstract

:
We developed a floodplain inundation model to extract specific flood extent and depth parameters and combined these with vegetation land cover and historic flow data to quantify spatial habitat suitability and temporal hydrologic metrics that support Alligator Gar Atractosteus spatula spawning within a 257 km segment of the lower Guadalupe River, Texas, USA. We modeled nine flows across a range of flood frequency recurrence intervals from 257 m3s−1 to ~4997 m3s−1 and estimated the availability of suitable spawning water depths (0.2 to 2 m) and lateral connectedness between the river and suitable floodplain landcover types. We estimated the ages via otoliths of 95 Alligator Gar collected in the reach to determine the year that they were recruited into the system. We analyzed a total of 30 Indicators of Hydrologic Alteration flow metrics to examine how the spatially derived suitable habitats related to the temporal aspects of flow occurrence during the spawning season for the period of flow record April–July (1935–2020) and to the years spanning the recruitment data of the Alligator Gar (1981–2010). A non-linear relationship existed between suitable spawning habitat area and the flow regime, with the most habitat availability corresponding to the 10–20-year flood recurrence interval frequency with peak flows of 2057–3108 m3s−1, respectively. The Alligator Gar recruitment data indicated that six years provided high recruitment, which correlated with peak flows of ~5-year frequency with an available spawning area of ~9000 Ha, moderate recruitment years related to peak flows with ~3-year frequency with an available spawning area of 6000 Ha, and low recruitment years where spawning was likely to occur at least every other year with at least 2500 Ha of available spawning area. The results of this model support the development of legislatively mandated environmental flow standards for the Guadalupe River Basin, inform field-based efforts for collecting empirical and observational data on the species’ reproduction, and provide spatial and temporal information for designing conservation strategies for Alligator Gar.

1. Introduction

Traditional hydraulic flood inundation models, originally developed for societal flood risk and hazard mitigation applications, are increasingly being used for research on flow-ecology relationships involving flood processes [1,2,3] and wetland management [4]. Ecological functions and species life-history adaptations in riverine systems occur in response to different spatial and temporal dimensions of longitudinal, lateral, vertical, and temporal hydrologic connectivity that vary with flood dynamics [5,6,7]. For example, lateral flood processes in large, lowland alluvial river systems facilitate the movement of water, sediments, nutrients, organisms, and other matter between river and floodplain environments [8]. Flood pulse dynamics related to the magnitude, frequency, duration, and timing of flows that characterize these dimensions of river-floodplain connectivity and exchanges can be quantified using geospatial and statistical models to better understand the flow-ecology of floodplain-dependent species.
Flood inundation modeling and mapping of laterally connected flood extents and depths combined with other ecologically relevant variables facilitate quantifying the conditions related to spatial and temporal availability of suitable spawning habitats and successful recruitment of floodplain-dependent fishes including the Alligator Gar Atractosteus spatula [3,9,10]. Our study contributes to a growing body of research on this species by developing a 2D floodplain inundation model as the base layer in a spawning habitat suitability model to better understand hydrologic and hydraulic factors contributing to Alligator Gar recruitment success in the lower Guadalupe River floodplain, Texas, USA. Specifically, we seek to answer the following research questions: (1) how much suitable spawning area can be estimated for Alligator Gar under discharge scenarios that range from high pulse flows to very large floods, and (2) can we correlate results of the spatial modeling with historic flow events and fish age data to identify hydrologic metrics of magnitude, frequency, duration, and timing that contribute to successful population recruitment? This study is a practical application intended to inform a legislatively mandated process for developing and recommending environmental flows for the Guadalupe River in Texas [11].
Alligator Gar are the largest and one of the oldest-living freshwater fish species in the Gulf Coastal Plain region, growing to greater than 2 m in length and 100 kg in weight, with longevity of greater than 60 years for males and females [12,13]. Daugherty et al. [13] examined over 500 individuals from multiple Texas river systems, including the Guadalupe River, and reported a higher overall abundance of males within the population; however, by a majority, the male population was younger and smaller, compared to the number of females in the larger and older size classes. Their current Gulf Coast range extends from Mexico to Florida, including both freshwater/riverine and estuarine habitats [14]. Alligator Gar can survive in low water quality conditions with warm water temperatures and low dissolved oxygen [15] and tolerate high levels of ammonia [16] and salinity [17].
Numerous studies on Alligator Gar movement provide evidence of their preferential use of different habitats relative to seasonal patterns and flow conditions [8,10,15,18,19,20,21,22,23]. Allen et al. [15], Buckmeier et al. [20], and Kluender et al. [22] reported the least amount of movement during the cooler winter season and increased movement relative to warmer temperatures and higher water levels associated with their spawning season. In riverine settings, reproductive migrations of Alligator Gar included two distinct macrohabitats off the main channel, inundated floodplains [10,15,20,22,23] and tributaries [18,22,23]. Data from these studies, and others, help constrain known factors that influence floodplain spawning behavior. Allen et al. [10] and Buckmeier et al. [24] provide comprehensive reviews of previous studies that indicate that Alligator Gar spawning and successful population recruitment in floodplain settings occurs during favorable conditions that correspond to four synchronous environmental criteria: (1) floods and high flow pulse (HFP) events during the warmer months of April–July with water temperatures of 20–31 °C, (2) hydrologically connected inundation depths sufficient to enable fish movement between the river and suitable spawning vegetation cover types on the floodplain, (3) presence of suitable vegetation cover types including grasses, herbaceous, and/or shrubby, low woody vegetation in low velocity inundated areas, and (4) flood durations within suitable vegetation cover types exceeding five days to allow for egg hatching, larval development, and swimming access to rearing environments including permanently wetted floodplain water bodies (e.g., oxbows), tributaries (floodplain or otherwise), or the main stem river. During a floodplain spawning event, female and male Alligator Gar migrate into inundated areas and release and fertilize eggs that attach to vegetation. The eggs incubate over 2–3 days, and within ~5 days the young have consumed their yolk sac and are free swimming [25]. Growth and development rates vary across the species range and between laboratory and field observations [24].
Because of the infrequent occurrence of successful reproductive conditions, Alligator Gar population growth is temporally sporadic, characterizing them as periodic life history strategists [26]. Threats to their population resilience include overharvesting, dam-altered flow magnitudes and water temperatures, land use changes and physical barriers that disconnect river-floodplain lateral movement, and loss of suitable spawning cover. Recreational fishing preferences tend toward the larger, older females amplifying the other challenges to their population dynamics [27], especially given that these size classes represent a very small portion of the population [13]. For these reasons, Alligator Gar are classified as vulnerable and a species with the greatest conservation need in Texas [28]. Recent concerns for the conservation of the species have led to numerous studies examining populations in rivers throughout the Gulf Coast region [14], with floodplain spawning habitat inundation analyses emerging as a valuable contribution to this growing body of research [3,9,10]. Existing studies focused on mapping flood extents and depths vary based on their predominant use of either remote sensing satellite imagery of previous flood events [10], hydraulic modeling using stage-discharge relationships [3], or comparisons using remote-sensed imagery, stage-dependent digital elevation models (DEM), and topologic hydrography data [9]. While each has its advantages and disadvantages, each approach provides valuable river-landscape scale results applicable for evaluating suitable Alligator Gar spawning habitats over large areas that encompass the higher end of home ranges >100 km [20]. A primary advantage of remote sensing applications includes the ability to use temperature-detecting sensors, such as the Landsat thermal band, used by Allen et al. [10], to detect warm-water thermal refuges within inundated floodplains. A benefit of using stage-discharge hydraulic models is the rapid production of model outputs for different flood event scenarios, and the ability to model spatial flood depths [3]. Regardless, both approaches provide valuable flood map outputs that can be integrated with long-term temporal gaging data to develop frequency and duration relationships for various flood extents. Van der Most et al. [9] concluded that using a combination of remote-sensed imagery and hydraulic-based modeling represents the ideal approach for mapping suitable floodplain habitats.
The range occupied by the species requires investigations focused on multiple river basins to better understand how each provides a suitable spawning habitat. Van der Most et al. [9] focused on a 404.9 km2 area (41.25 km valley length) of the embanked floodplain of the lower Mississippi between Louisiana and Mississippi near Natchez, Mississippi. Allen et al. [10] advanced knowledge in a much larger area of the Mississippi River spanning 93 km length of floodplain valley from Kentucky to Louisiana with a more focused case study also near Natchez, Mississippi on the floodplain of the protected St. Catherine Creek National Wildlife Refuge (SCCNWR), a site studied extensively by Allen et al. [15] via field-surveyed Alligator Gar movement and water quality patterns. Within Texas, Hoeinghaus et al. [29] focused on a 120 km reach of the lower Trinity River, Robertson et al. [3] examined a 334 km reach of the middle Trinity River, and Roberts et al. [23] assessed the movement to spawning habitats on a 200 km reach of the lower to middle Brazos River and 147 km of large tributaries (Little River, Navasota River, and Yegua Creek). While the use of tributaries is previously documented [18,22], Roberts et al. [23] made an important contribution by documenting the movement of Alligator Gar into unregulated tributaries of the regulated Trinity Rivers in response to flood pulses and floodplain access in these less flow-altered networks of the river system.
Our case study complements Robertson et al. [3] by illustrating the use of a hydraulic model combined with similar vegetation types, historic discharge, and otolith-aged Alligator Gar to quantify suitable spawning habitats and successful recruitment for a range of flood discharges. This present study and Robertson et al. [3] represent practical applications for using a hydraulic flood model as a fundamental input within a set of decision-making tools for developing basin-specific environmental flow recommendations mandated by the Texas legislature [11]. The present study does not evaluate hydrodynamics of wetting and drying, antecedent wetted/inundated conditions, or changes to flood depth during a high pulse or flood event. This limitation is a commonly recognized challenge when using flood models for ecological analyses [4]. Our study does not incorporate aspects of fish movement during inundation [10,23], intra-species competition for spawning habitats, predation pressures on juveniles following successful spawning, or persistence of inundated off-channel nursery habitat and forage resources for rearing juvenile Alligator Gar [8]. Results of our suitable spawning habitat model and recruitment analyses can be used to inform future studies designed to evaluate field-based behavioral and ecological interactions and are therefore critical to the conservation and management of the species.

2. Materials and Methods
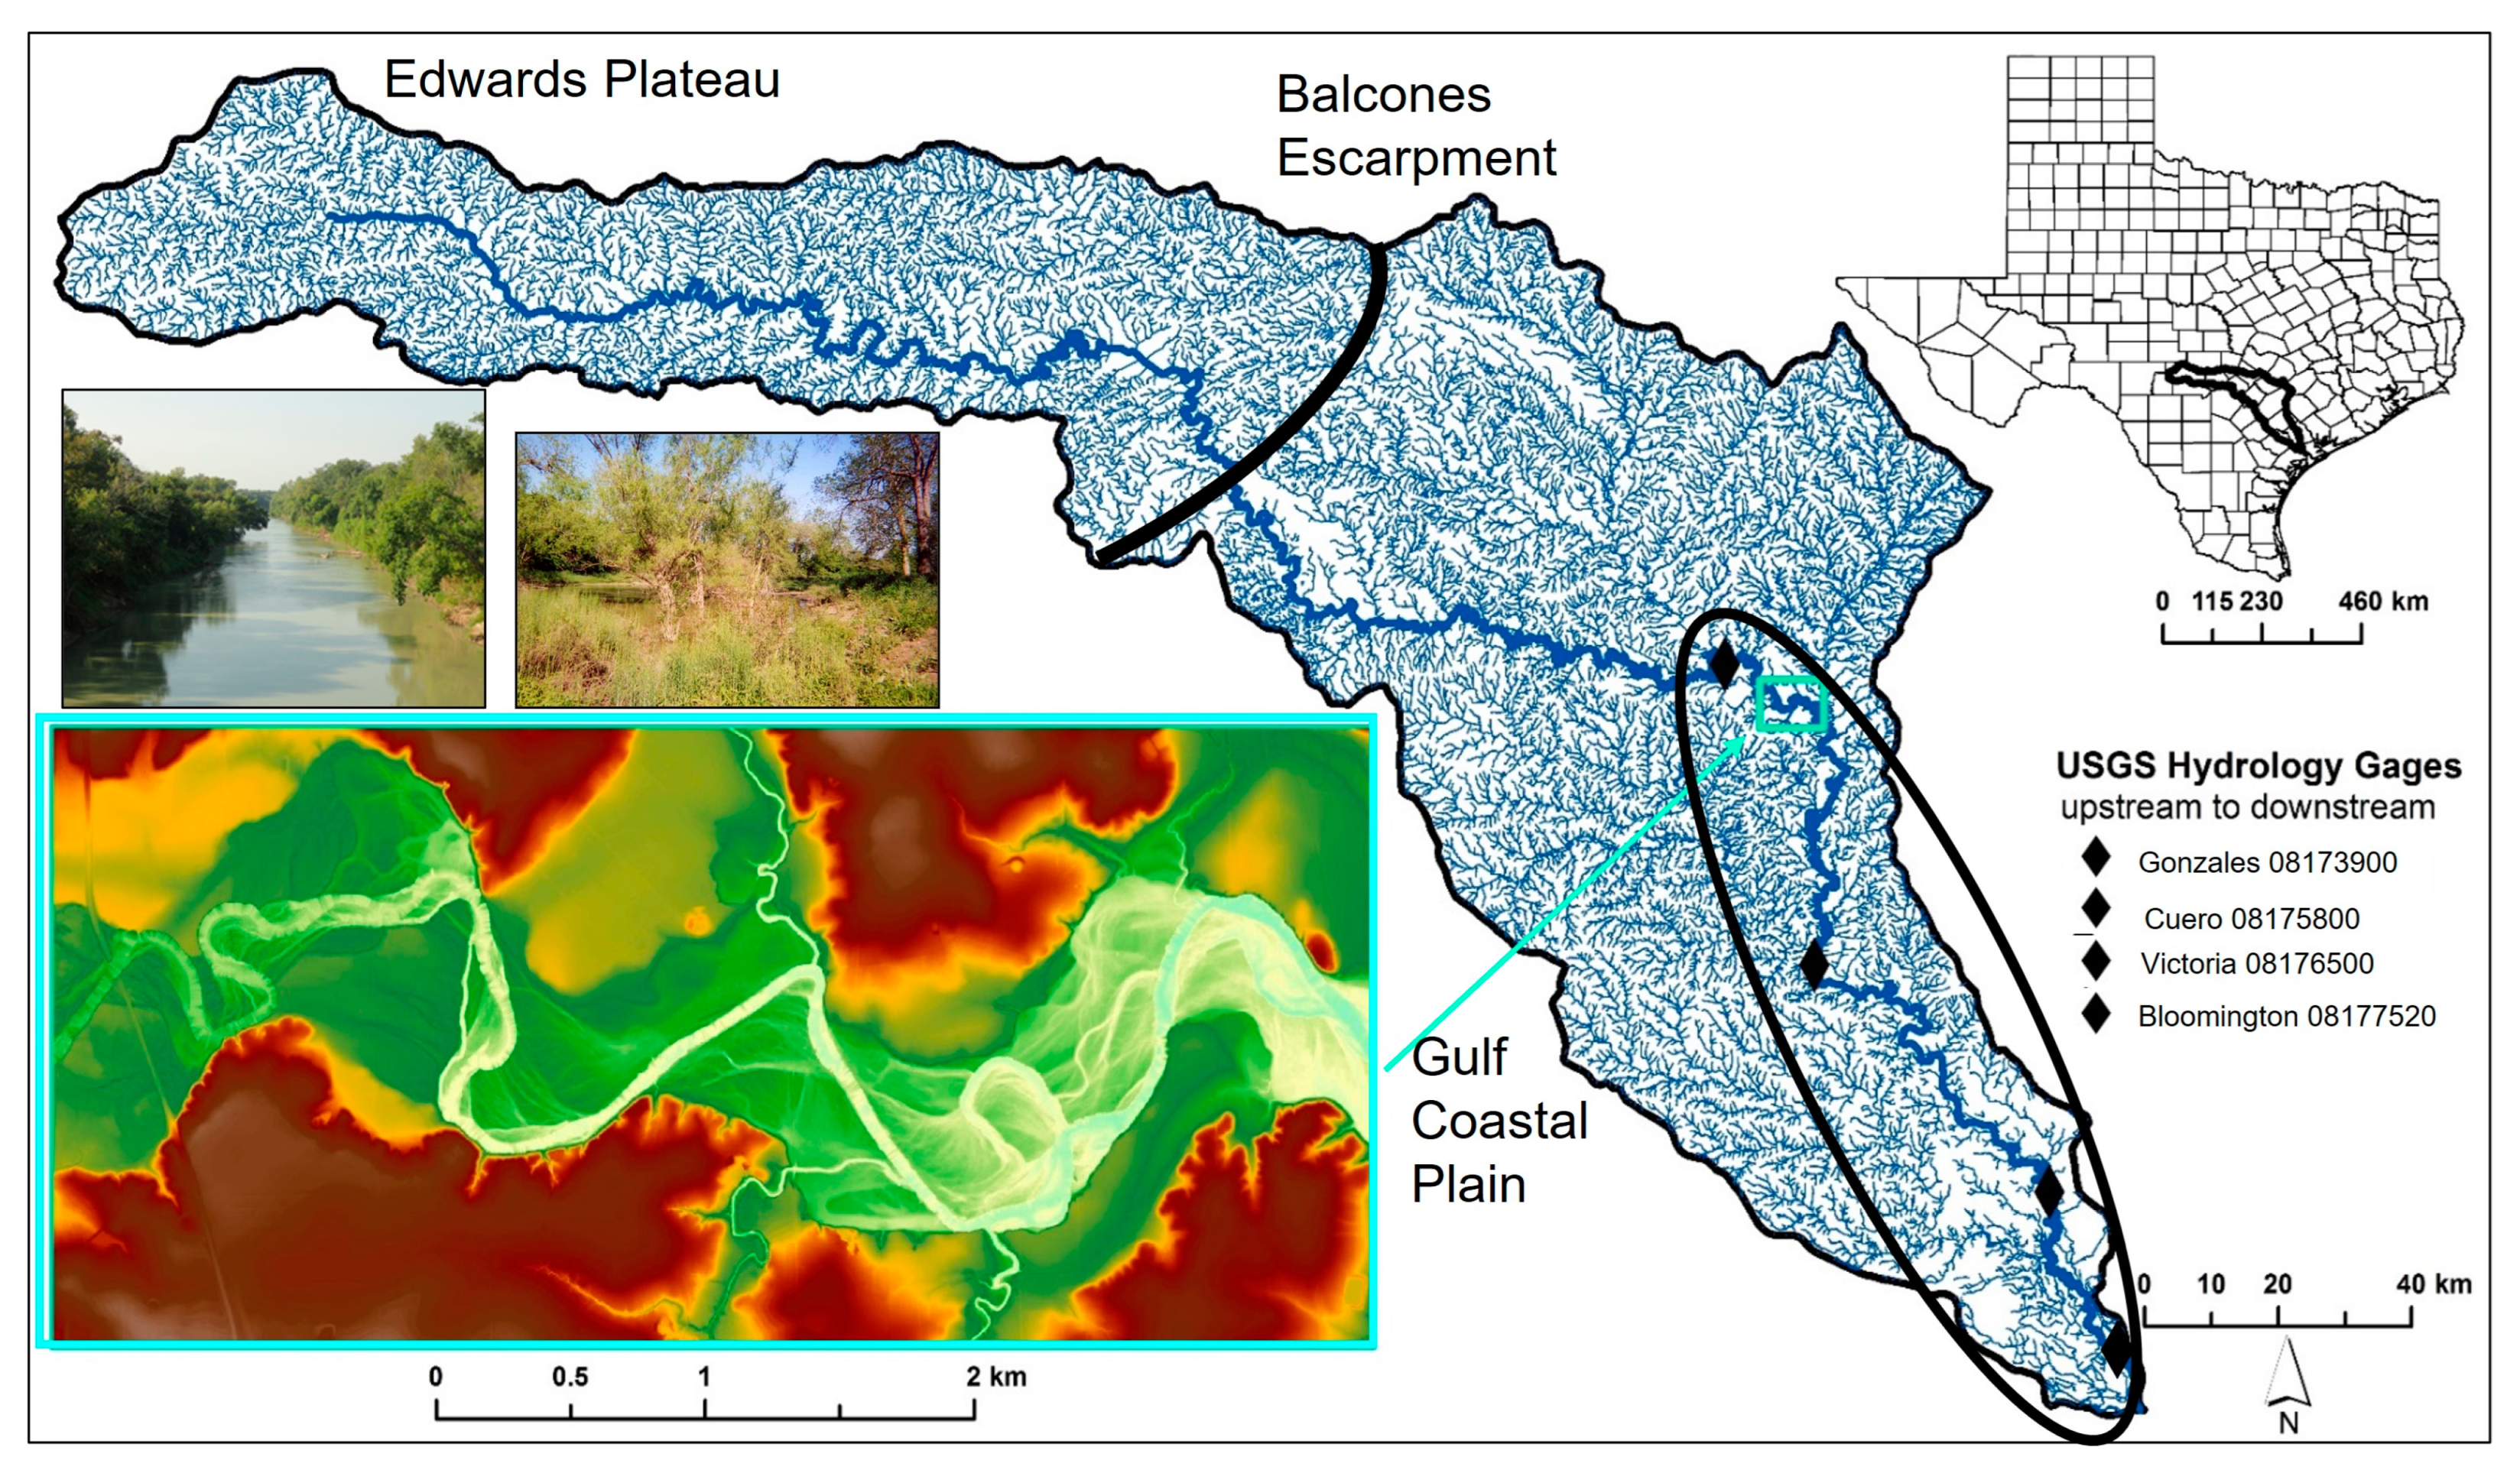
2.1. Study Area

The Guadalupe River arises in the Edwards Plateau where it is spring-fed from the Trinity and Edwards aquifer, with a total drainage area of 15,063 m2 upstream of the lower study area. Surface water runoff contributions drain highly dissected Cretaceous limestone in a regional landscape referred to as “flash-flood alley” due to the parallel drainage orientation with storm tracks, thin soils, confined valleys, and rapid accumulation of surface runoff [30,31]. From here, the river crosses the Balcones Escarpment into the Gulf Coastal Plain. A major flood control reservoir, Canyon Lake, disrupts the basin-scale hydrology at the Escarpment. Downstream from the dam, the Guadalupe drains tertiary and quaternary coastal plain sedimentary units and flows through a wide floodplain where it eventually drains into San Antonio Bay and the Gulf of Mexico (Figure 1).
A sub-humid to humid west-to-east gradient spans the basin with a mean annual precipitation range of ~650–1350 mm [32]. Wetter seasons are typically early to mid-summer and early fall, with drier late-summer and winter patterns. The basin experiences extreme inter-annual variability among El Niño (wet), neutral (normal), and La Niña (dry) cyclic climate patterns resulting from Pacific trade winds; mid-latitude and tropical cyclones frequently cross this region, collectively contributing to the unpredictable nature of flooding throughout the basin during the summer and fall [31].
Our study focuses on the lower Guadalupe River and spans the 257 km segment of the river between Gonzales, Texas, and San Antonio Bay (Figure 1). This alluvial, meandering segment is characterized by a low-gradient longitudinal profile that decreases in slope from 0.0003 upstream near Gonzales to 0.0001 downstream near Victoria and flows within a topographically complex, unconfined floodplain that spans a 0.2–0.4 km valley width. The floodplain contains Pleistocene to Holocene-age geomorphic units, including terrace complexes, abandoned channels (single meanders and reach-scale avulsions), natural levee deposits, incised cutbanks, and point-bar meander scroll features. Tributaries drain the adjacent landscape, dissecting the floodplain, and can back-flood with rising river stages. Depending on the geographic pattern of rainfall intensity and duration, floods may originate anywhere in the basin. Within the lower study reach, the mean annual flood is ~500 m3s−1 with historic peak floods exceeding 10,000 m3s−1, which was calculated for this study using the United States Geological Survey (USGS) gage 08176500 on the Guadalupe River in Victoria, Texas [33], and HEC-SSP v.2.1.1 [34].
The Texas Ecological Mapping Systems indicate that six major landcover types comprise the lower basin: barren, urban, forest, cultivated, grassland, shrubland, wetland, and water [35]. This landcover platform also provides higher resolution landcover classes that incorporate ecoregional information, aerial imagery, soils, and wetland inventory data to provide stand-level vegetation assemblages for the lower floodplain, including subclass vegetation types for floodplain, riparian, terrace, wetland, and marsh environments used as part of this study.

2.2. Data and Analyses

The criteria required for successful spawning and recruitment of Alligator Gar lend themselves well to geospatial modeling methods and techniques. The necessary topography (e.g., lidar-derived DEMs) and landcover (vegetation type and structure) variables can be obtained from various sources and processed within a Geographic Information System (GIS) to meet the data requirements of cross-platform integration with hydraulic modeling software. Post-processing of inundation modeling layers enables the creation of habitat suitability models by defining specific variable thresholds. These models can provide a useful estimate of the Alligator Gar spawning habitat available relative to discharge, and this data, used in conjunction with historic flows, and field-sampled Alligator Gar age data allow us to correlate the hydrologic characteristics of flow magnitude, frequency, duration, and timing that support Alligator Gar recruitment.

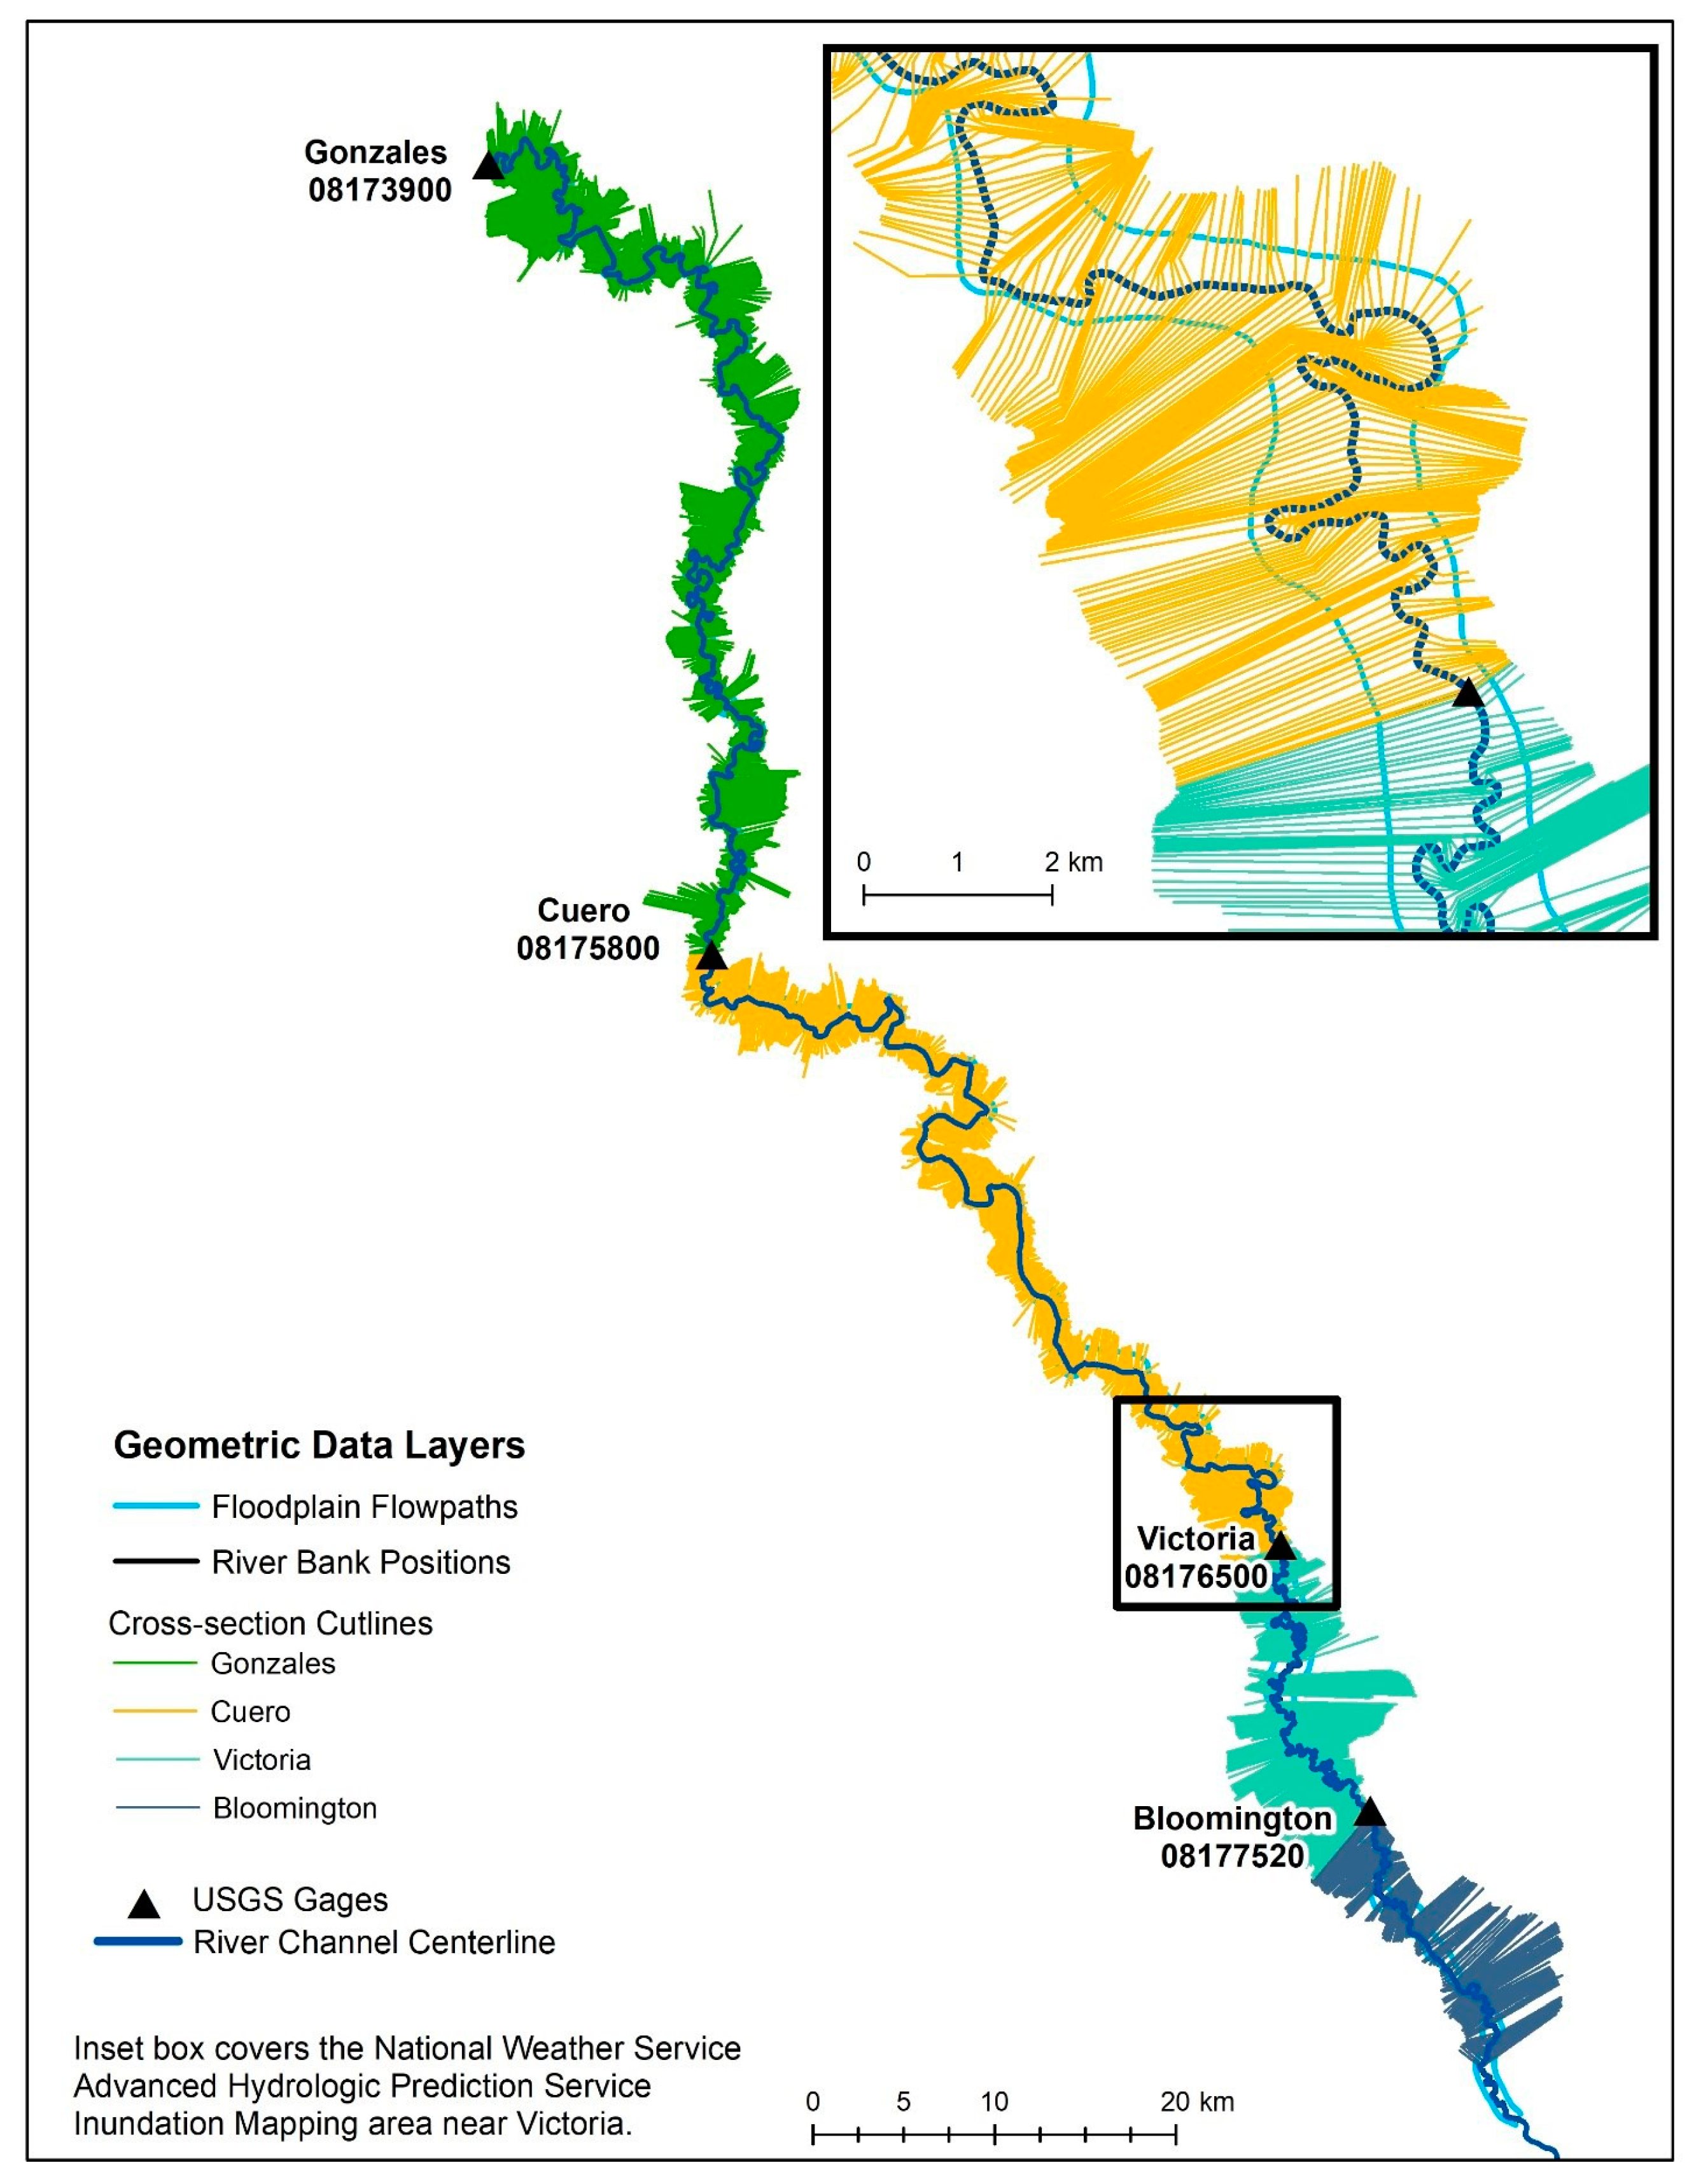
2.2.1. Digital Terrain Modeling

Light Detection and Ranging (lidar) data for the study area were acquired from the Texas Natural Resource Information System (TNRIS) from multiple county-level acquisition projects from 2006–2016. As a result, the full data set included various formats, including .dem or .img hydro-enforced rasters and classified lidar point clouds. Hydrologic enforcement is the process of altering the elevation values in a digital elevation model (DEM) to ensure the continuous flow of water downstream by filling sinks and assigning flow direction. The topo to raster interpolation method in ArcMap was used to create digital terrain models (DTM) from the classified lidar points for those tiles. All tiles (.dem, .img, and processed DTMs) were projected to WGS 84, UTM Zone 14N, and NAVD88 and mosaicked at 3 m spatial resolution. This scale allowed us to capture the geomorphic variability and minimal mapping area to evaluate laterally hydrologically connected pathways for Alligator Gar movement, yet reasonably model this 257 km segment of river–floodplain area. Small gaps and negative errors in the LiDAR data warranted gap filling with USGS DEM 10-m products. The USGS DEMs were projected to UTM Zone 14N, resampled to 3 m, and merged with the lidar DTMs to create a continuous raster surface for the project. After gap-filling, the DTM product was hydro-conditioned to fill spurious sinks in the dataset and reprocessed for hydro-enforcement.

2.2.2. Floodplain Inundation Modeling

The floodplain inundation modeling used the USACE 1D/2D HEC-RAS v. 5.0.1 [36] and HEC-GeoRAS model v. 10.2 [37], HEC-SSP v.2.1.1 [34], and ArcGIS 10.2 [38]. The primary inputs for floodplain modeling include a DTM, discharge and stage data, flow resistance parameters, and boundary conditions relating to the terrain model and stage-discharge relationships. Initial conditions are single-time step, stage-discharge-based flood events. We subdivided the full 257 km study reach into four reaches bound by USGS streamflow gages. Reach-1 is between Gonzales and Cuero (111 km, gage ID 081739000), Reach-2 is between Cuero and Victoria (83 km, gage ID 08175800), Reach-3 is between Victoria and Bloomington (40 km, gage ID 08176500), and Reach-4 is the remaining 23 km below Bloomington (gage ID 08177520) to just above the confluence with the Kuy Creek tributary (Figure 2).
We delineated and extracted the geometric data (stream centerline, right and left bank lines, floodplain flow path lines, cross-section cut lines, and land cover resistance polygons) from the DTM using the HEC-GeoRAS toolbox (Figure 2). The stream centerline aids with the flow direction calculations and calculating the distance between each cross-section. The optional right and left bank lines enable delineation between the channel and floodplain for assigning different resistance parameters. The optional floodplain flow paths assist with digitizing geometric cross-sections to ensure they cross the stream centerline at a perpendicular orientation. The land cover resistance polygons contain the resistance values for different vegetation assemblages. All cross-section lines spanned the 500-year Federal Emergency Management Agency (FEMA) floodplain boundary. A total of 2508 cross-sections were generated, with an average spacing of about 100 m, and distributed as Reach-1 (1101 lines), Reach-2 (832), Reach-3 (685 lines), and Reach-4 (200 lines). Flow resistance parameters were defined using Manning’s n roughness coefficients assigned relative to the land use code classes from the Ecological Mapping Systems of Texas data layer [21]: barren (0.040), cultivated (0.075), forest (0.120), grassland 0.0750), shrubland (0.085), urban, (0.060), water/mainstem river (0.030), and wetland (0.035). After importing the data to HEC-RAS, we adjusted the left and right bank stations for more accurate placement with bank-full elevations, filtered cross-sections to the 500-point minimum, and edited roughness values affected by these changes. Only 20 values are allowed per cross-section; thus, we prioritized maintaining the difference between high and low values and preserving Manning’s n values within the mainstem channel.
We performed steady-state flow modeling based on two different types of boundary conditions. Water surface elevations from discharge and stage heights were used for the upstream and downstream boundary conditions, and at the absolute lower end of the model we used the estimated normal depth for a measured channel slope of 0.0001. Where results produced divided flow for a cross-section, the volume of flow removed from the mainstem channel was added back into the boundary conditions for the modeled profile. This occurred frequently in the lower portion of the model domain between Reach-3 and Reach-4, where there were many abandoned channels in the floodplain. Without this adjustment, abrupt changes in water slope occurred between cross-sections; this helped smooth the longitudinal water surface profile for post-processing the 2D maps.
All hydrologic modeling was completed using the Guadalupe Rv. at Victoria TX gage (08176500) as a reference. This gage included 82 annual peak flow events over the period 1935–2016. In total, we modeled nine discharge events. Three events were selected from the National Weather Service (NWS) Advanced Hydrologic Prediction Service Inundation Mapping for the categories designated by minor (258 m3s−1), moderate (453 m3s−1), and major (885 m3s−1) flooding for the Victoria gage [39]. These three flows were selected because inundation extent maps exist for these flows, which are modeled by the West Gulf River Forecast Center, and they could be used as validation against our model results. The other six were selected from a flood frequency analysis for the Victoria gage using a Bulletin 17B flow frequency analysis for 1 in 2-, 5-, 10-, 15-, 20-, and 50-year flood recurrence interval flood events. This initial analysis produced one-dimensional (1D) water surface profiles for all 2508 cross-sections for all nine modeled flows.
This data was attributed back to the cross-sections, imported back into ArcMap, and then merged into one shapefile for the study area. Using this layer, we generated a spatially explicit 2D water surface elevation Triangular Irregular Network (TIN) layer and converted the TIN layer to a 3 m water surface elevation grid. We subtracted the the DTM from this grid to create 3 m flood inundation depth rasters for the full study area. Flood depth rasters were processed to include only the inundated areas that were structurally connected to the mainstem river channel. We used the ‘region group’ tool in ArcMap Spatial Analyst and set parameters to include all inundated cells that were adjacent to, shared a side boundary, or were linked by a diagonal corner. All other cells were excluded and removed from the final raster. This step ensured that water bodies not hydraulically connected to the mainstem as an artifact of topography were removed. This post-processing was completed for all nine discharge events.

2.2.3. Habitat Suitability Modeling

Habitat suitability modeling used the floodplain inundation model outputs and the Texas Ecological Mapping Systems vegetation data that met the criteria specific to Alligator Gar spawning for the Coastal Plain region of Texas, similar to Robertson et al. [3]. We processed the flood inundation rasters to only include areas with hydrologically connected depth values of 0.2–2 m. Brinkman [40] observed spawning in areas with an average inundated depth of 0.3 m (the full range was published) and some of the fish were not even fully submerged; therefore, we selected 0.2 m as a slightly shallower buffer for these observations. Robertson et al. [3] also applied this same lower limit and an upper limit of 0.2 m from personal observations of spawning activity, thus we chose the same value. Forty-six vegetation types within the designated floodplain study area met conditional criteria similar to that used by Robertson et al. [3] for representing grasses/prairie, herbaceous cover, shrublands, wetlands, marsh, flats, ponds, and row-crop (Table 1). The consistency of using the same parameters from Robertson et al. [3] in the present study will also allow for future comparisons in suitable spawning areas between the Guadalupe and Trinity River systems. Raster datasets were reclassified to binary conditions to assign suitable and non-suitable conditions for the flood depths and vegetation for four conditions: (1) suitable for flood depth and vegetation land cover, (2) suitable for flood depth and unsuitable for vegetation land cover, (3) unsuitable for flood depth and suitable for vegetation land cover, and (4) unsuitable flood depth and unsuitable land cover. This information may be useful for future analysis involving a different land cover dataset or during field reconnaissance for spawning fish. The mainstem river channel was removed from the final layers to include only floodplain areas.

2.2.4. Alligator Gar Sampling and Year Class Strength Assessment

To assess year class strength, we used 95 Alligator Gar collected from the lower Guadalupe River previously aged from their otoliths by Daugherty et al. [41] to determine the year they were recruited (i.e., year of the hatch, observed year class) using methods established by Buckmeier et al. [42]. Age was estimated for each fish by a minimum of two independent readers (twice per reader) without knowledge of the fish’s total length, sex, or prior estimates of age. Disagreements between readers were reconciled with a concert read. To compare recruitment strength between years from this empirical data, we applied a relative year class strength (RYCS) index utilized by Buckmeier et al. [24], which is calculated by dividing the number of Alligator Gar observed in a year class by the expected number derived from a model assuming constant recruitment and survival. Buckmeier et al. [24] modeled expected values for each year class by iteratively adjusting the n1 = (number of fish expected for the most recent year class) until the following conditions were met using the following two equations:
ni + 1 = ni × S
Σ ni = N
S = an annual survival rate (0.915)
N = the total number of fish collected (95)
An RYCS value greater than one is considered a high recruitment year class (i.e., better than expected recruitment), and a value ≥0.75 is considered a moderate recruitment year class. RYCS values less than 0.75 were considered low recruitment year classes. Knowing which year classes produced high recruitment years and having each year class assigned a relative recruitment strength value allows for the ability to correlate relative year class strength to hydrologic variables and available spawning area (i.e., floodplain depth and vegetation type) to determine which variables are important determinants of strong year class production.

2.2.5. Flow-Ecology Analysis

Indicators of Hydrologic Alteration (IHA) software [43,44] was used in two complementary applications. Both applications used hydrologic data from the Guadalupe Rv. at Victoria, TX gage (08176500), and filtered the data to include only the spawning season (April–July), but each used different hydrologic time periods and user modified flow metrics (Table 2). One analysis spanned the period related to the Alligator Gar year class data (1981–2010) and a subset of 27 hydrologic metrics related to high flow pulse characteristics (e.g., magnitude, duration, frequency, timing, etc.) that are known to be associated with Alligator Gar spawning events [24] that were normalized (z-score transformed) following Robertson et al. [3]. Flow variables were converted to spawning habitat availability (km2) using a piecewise, conditional non-linear regression analysis obtained from the habitat suitability modeling results. Maximum cumulative duration (Max CD), total duration (Total D), monthly maximum flow (Max Q), and monthly high flow pulse count (Pulse #) variables were manually calculated using the IHA daily environmental flow components tab in the analysis output. Using the compiled hydrologic variables and RYCS indices, we also performed a principal component analysis (PCA) to assess the accuracy of our year class data. This reduces the potential error of concert reads misassigning a year class within one year on these difficult-to-age, long-lived fish that confound assessing flow-ecology relationships [42]. Hydrologic metrics were then assessed for multicollinearity (correlation coefficients ≥ 0.80 or ≤−0.80) and relationships between the hydrologic variables and RYCS utilizing Spearman’s rank correlation analysis. The second hydrologic analysis focused on a longer hydrologic period of record (1934–2020) and only three environmental flow components that included user-modified values bracketing ranges for high flow pulses (250–499 m3s−1), small floods (500–1999 m3s−1), and large floods (2000–5000 m3s−1); these three ranges were selected to cover the modeled discharges after interpreting the results of the flood model. The stakeholder committee and science team input for the Texas environmental flow process identified four types of flows (subsistence, base, high pulse, and overbanking), the high pulse and overbanking flows typically include a set of recommendations, over a range of flows, that include specific magnitude, duration, frequency, and seasonal timing characteristics [11]. We selected the three ranges because they span the geospatial modeled flows and within each range, specific flows can be identified to make recommendations, for high flow pulses and over-banking flows that included small and large floods. Flows within these categories align with the standardized environmental flow components recognized by Mathews et al. [44] for evaluating environmental flows using IHA.

3. Results

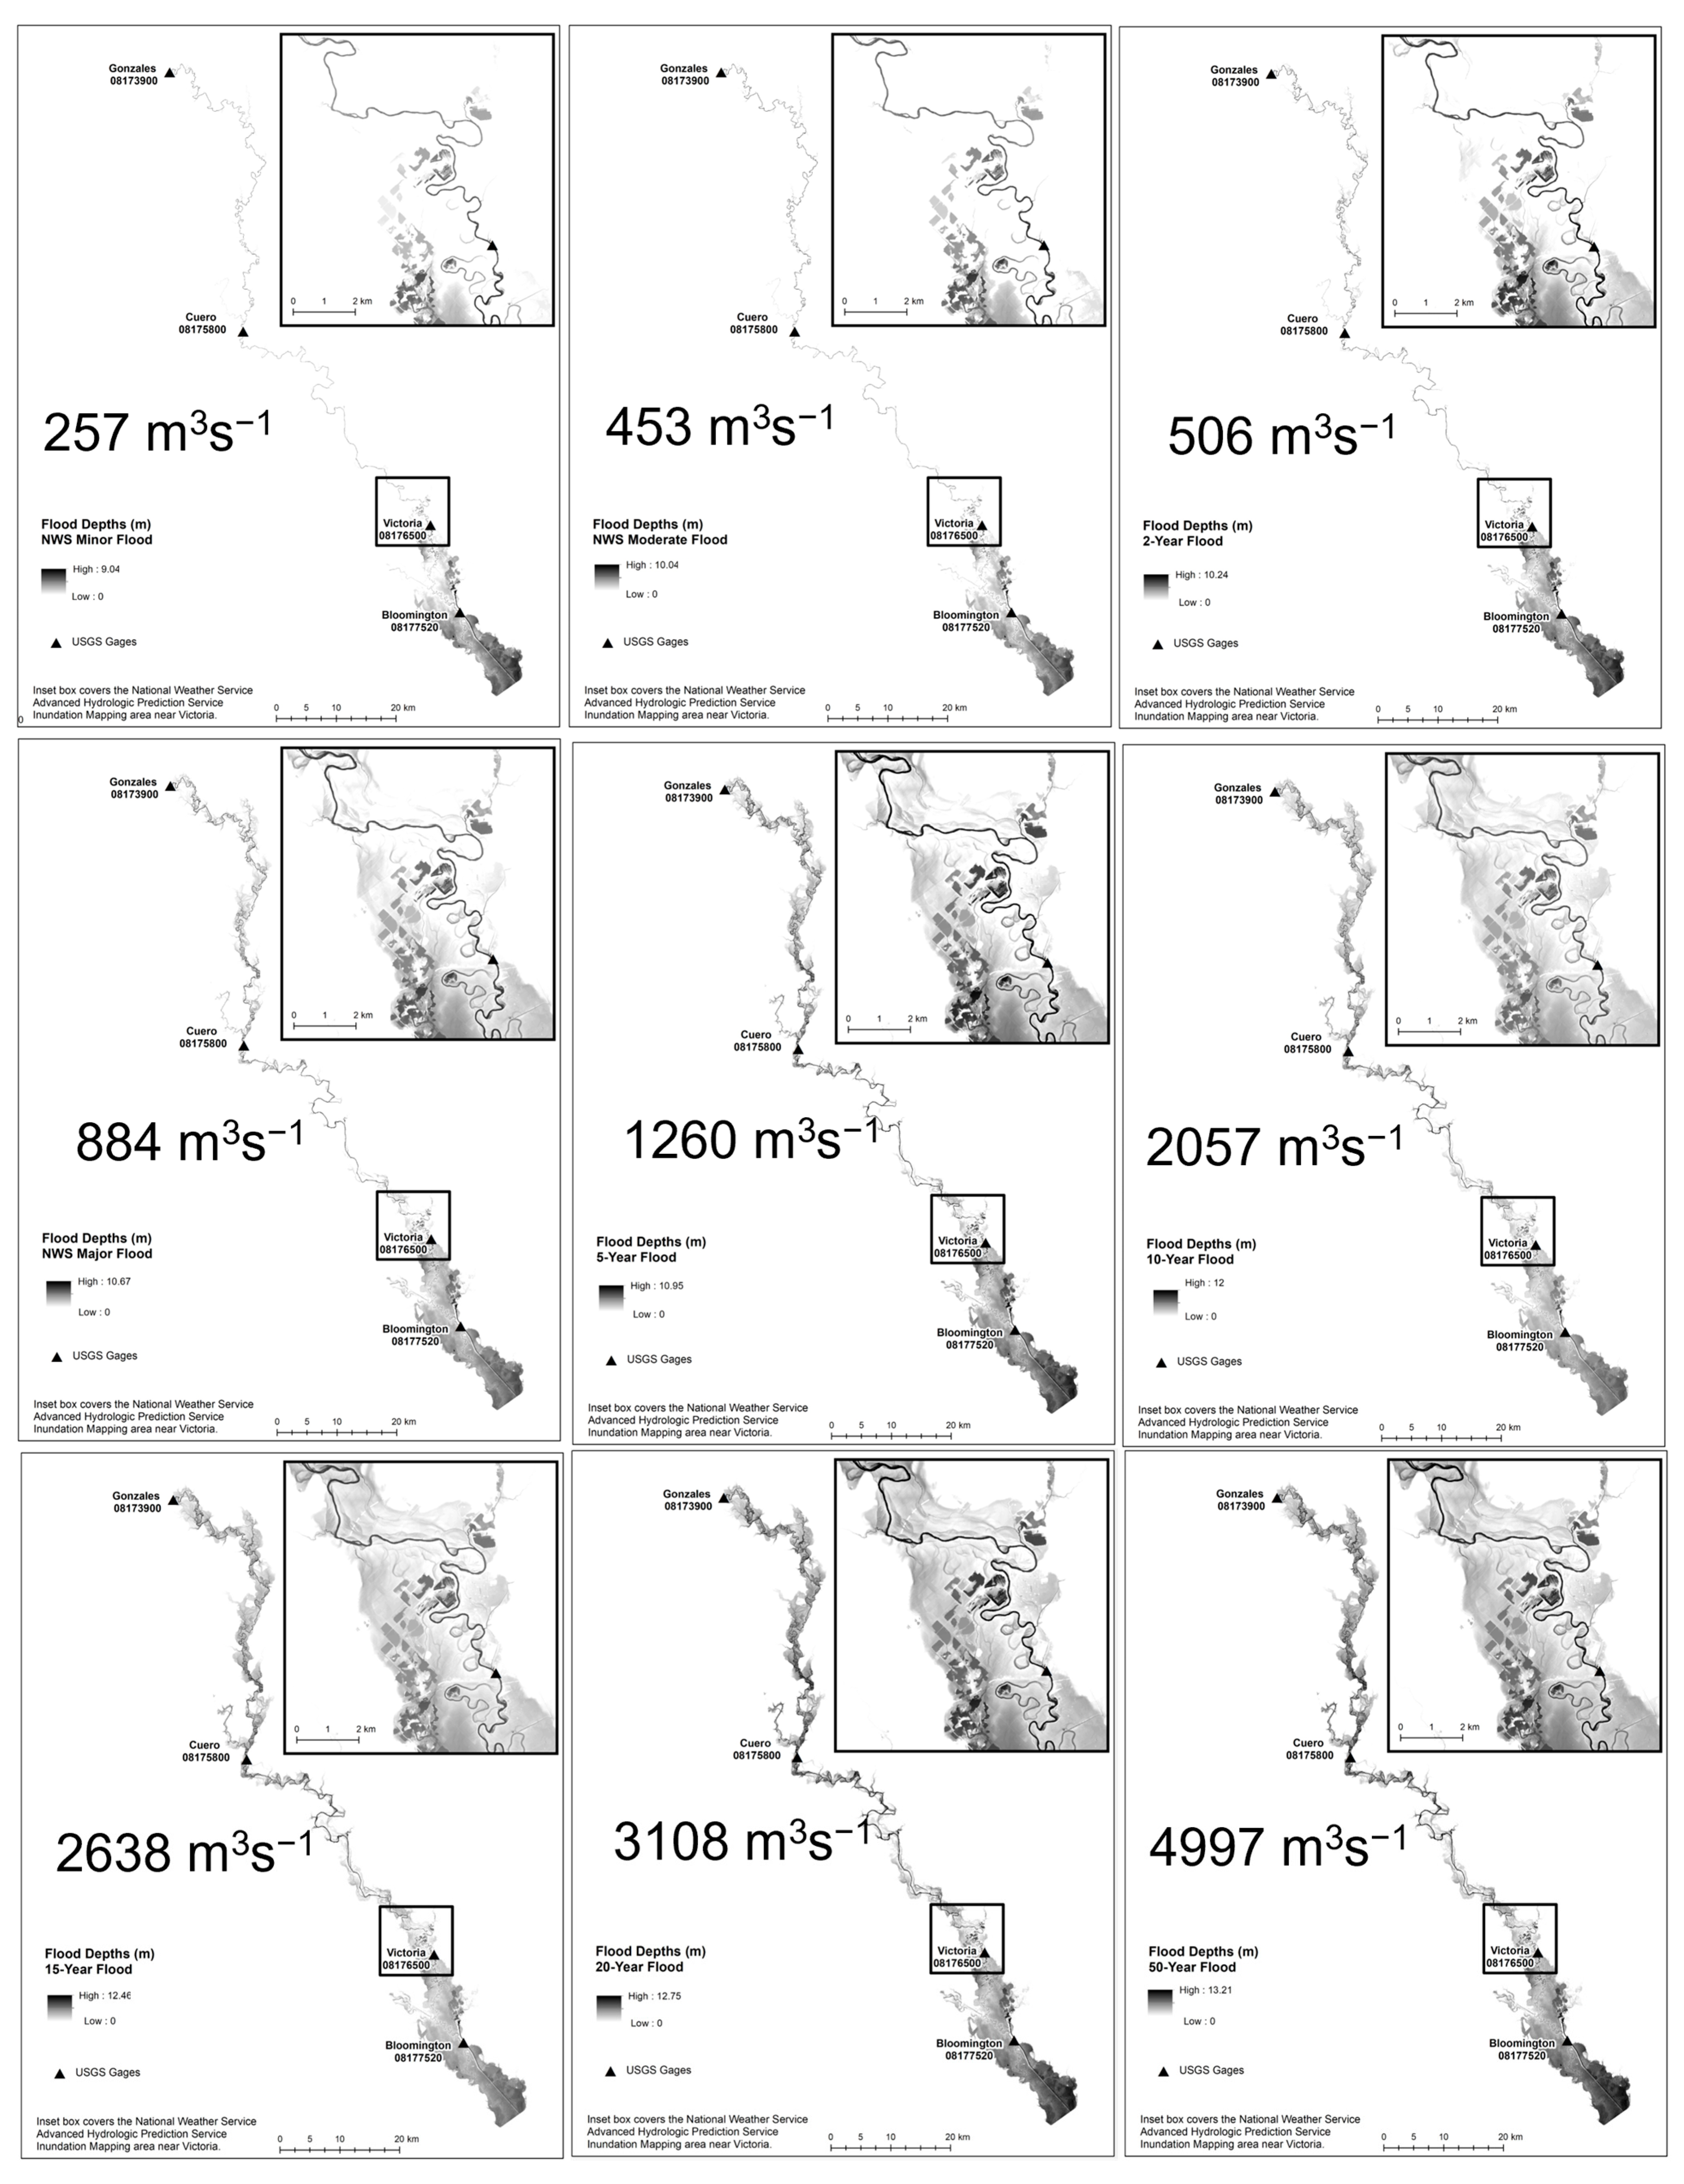
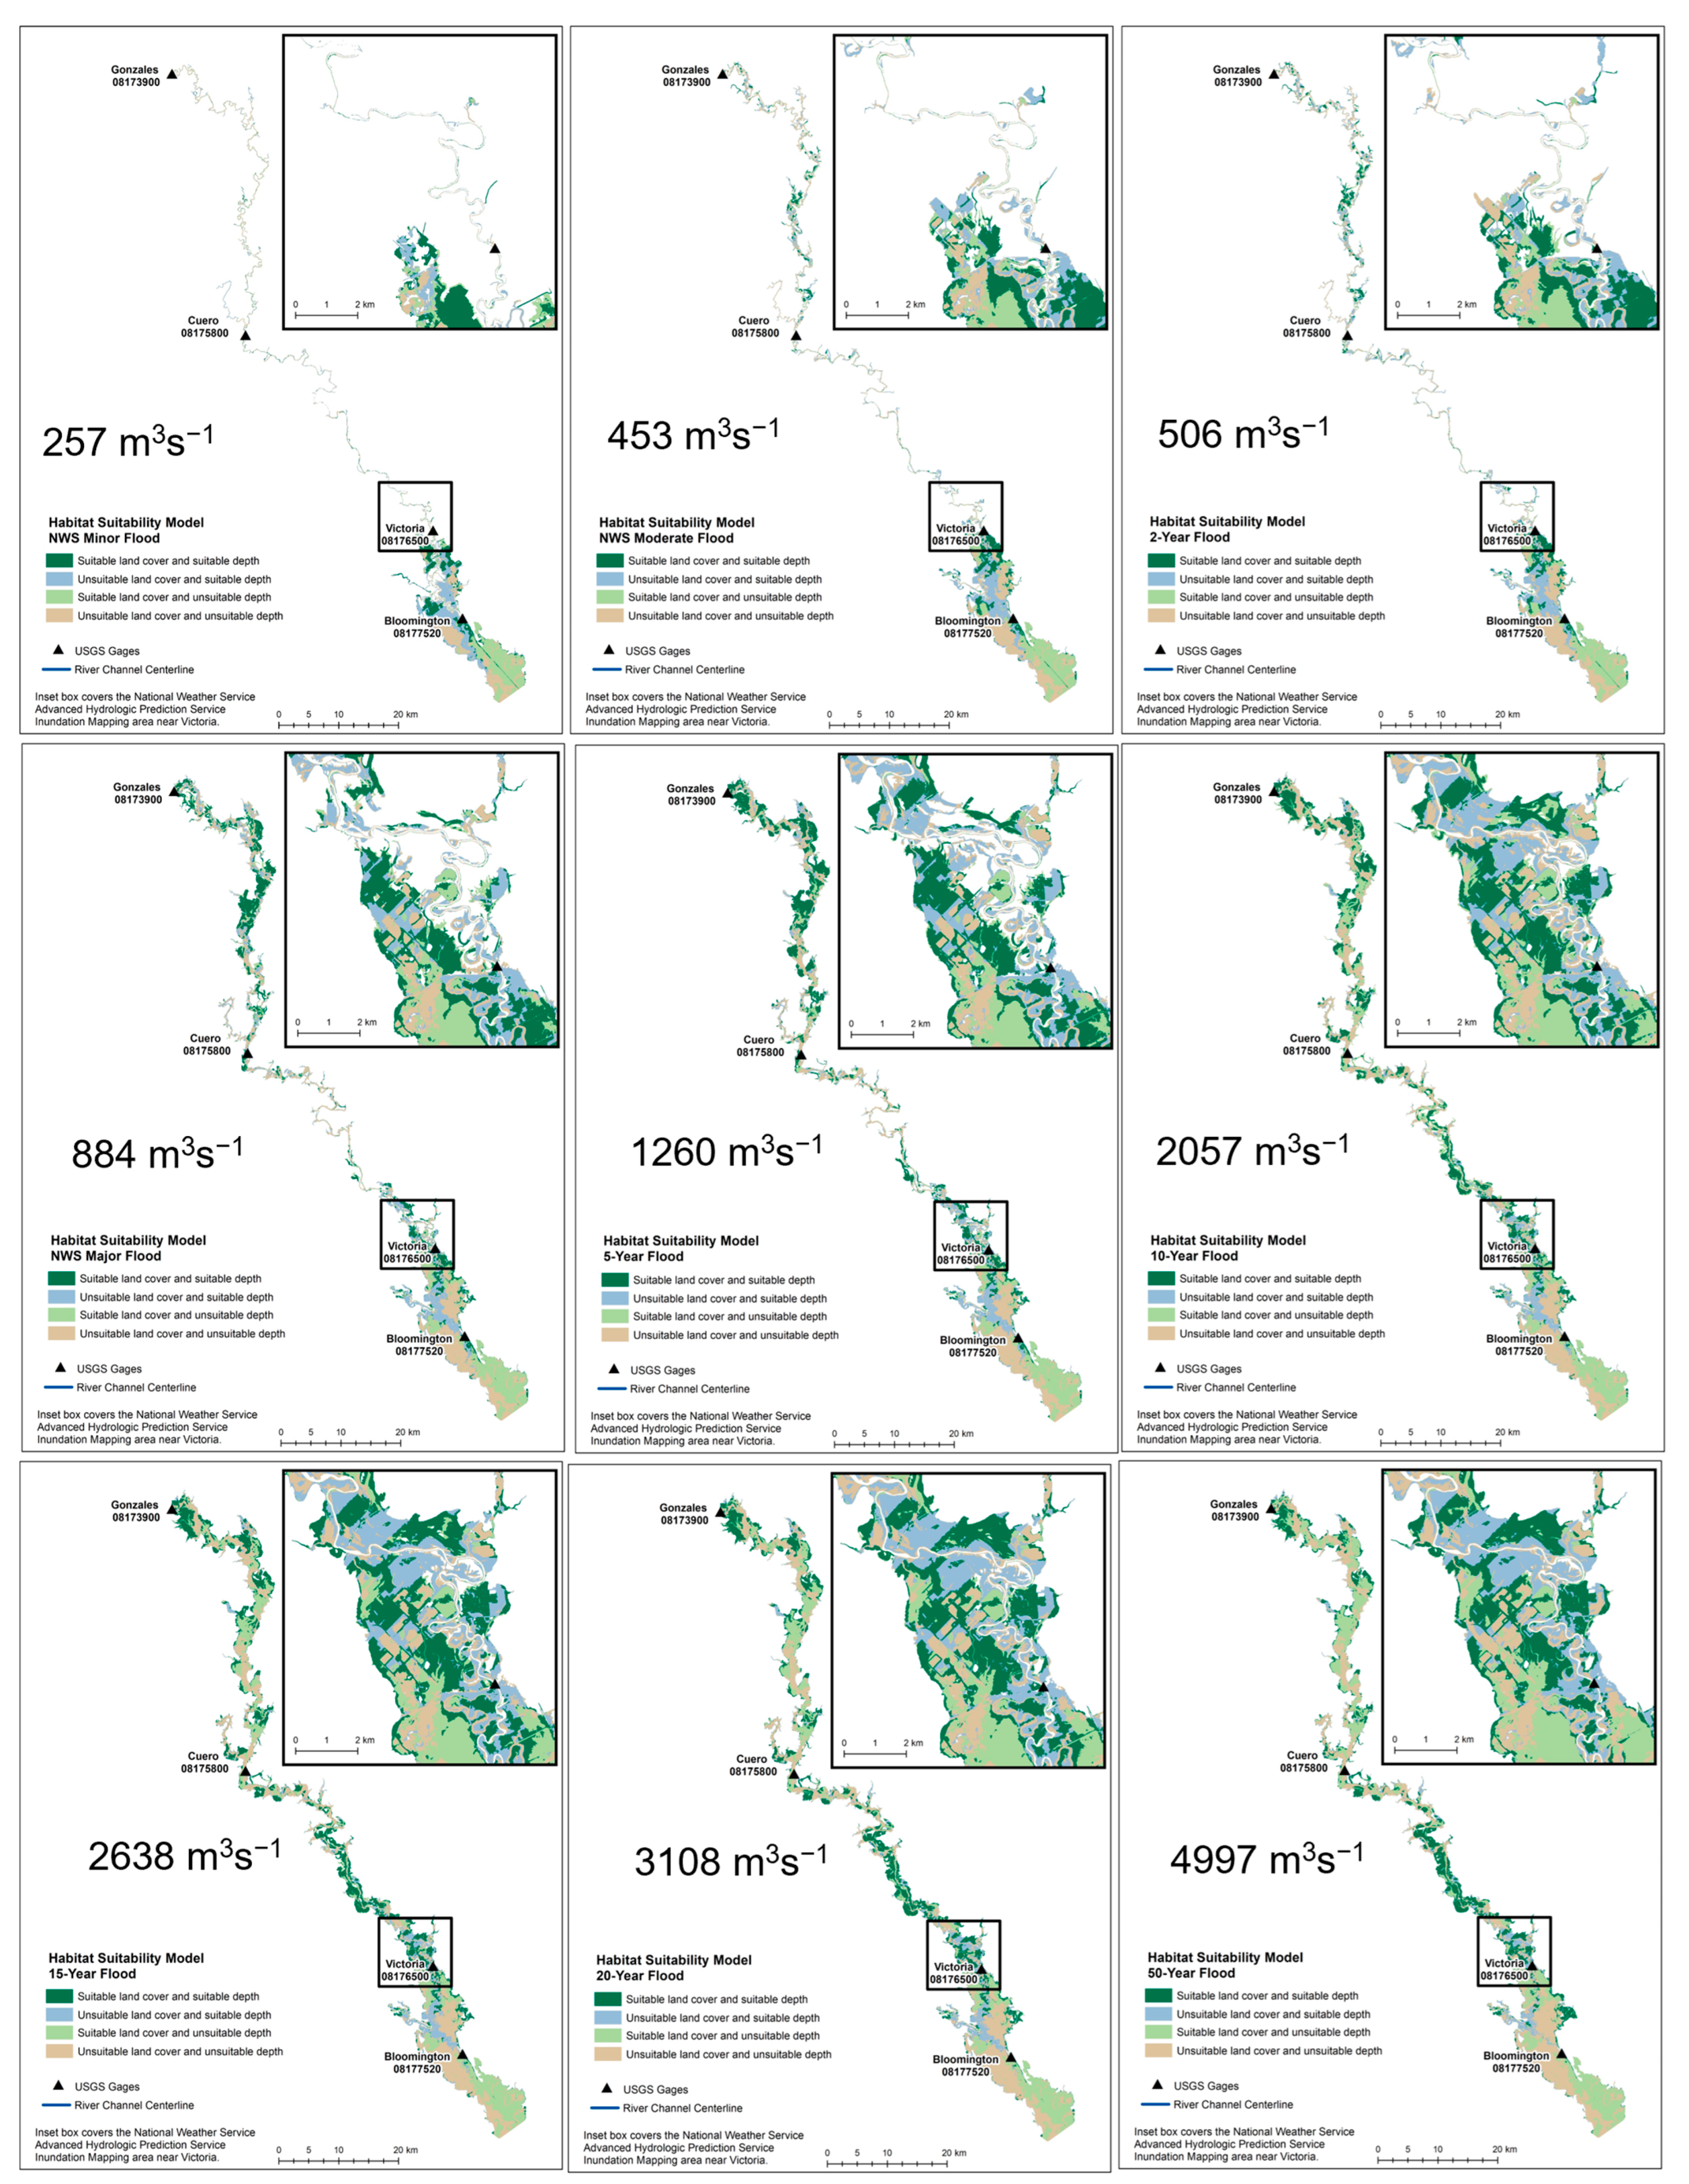
3.1. Flood Inundation Modeling

An error analysis comparing the modeled water surface elevations with NWS and USGS stage-discharge water surface elevations for the channel yielded minimal errors in over- and under-estimating flood depths (Table 3). Errors were greatest through Reaches 1 and 2 (mean error < 0.05 m), and lowest in Reaches 3 and 4 (mean error < 0.04 m). Spatial variation in flood extent and depth occurs across all flood discharges (Figure 3). The 2-year flood inundates low lying areas of the floodplain and has the greatest overbank extent in the lower study reaches. The 5-year flood inundates more extensively into the floodplain and low-lying areas throughout the upper and lower reaches. The 10-year flood produces more extensive overbank inundation but does not completely inundate the entire floodplain. There is minimal change in the extent of inundation between the 15- and 20-year flood; however, there are differences in flood depths. The 50-year flood is associated with the greatest inundation extent and deepest inundation depths.

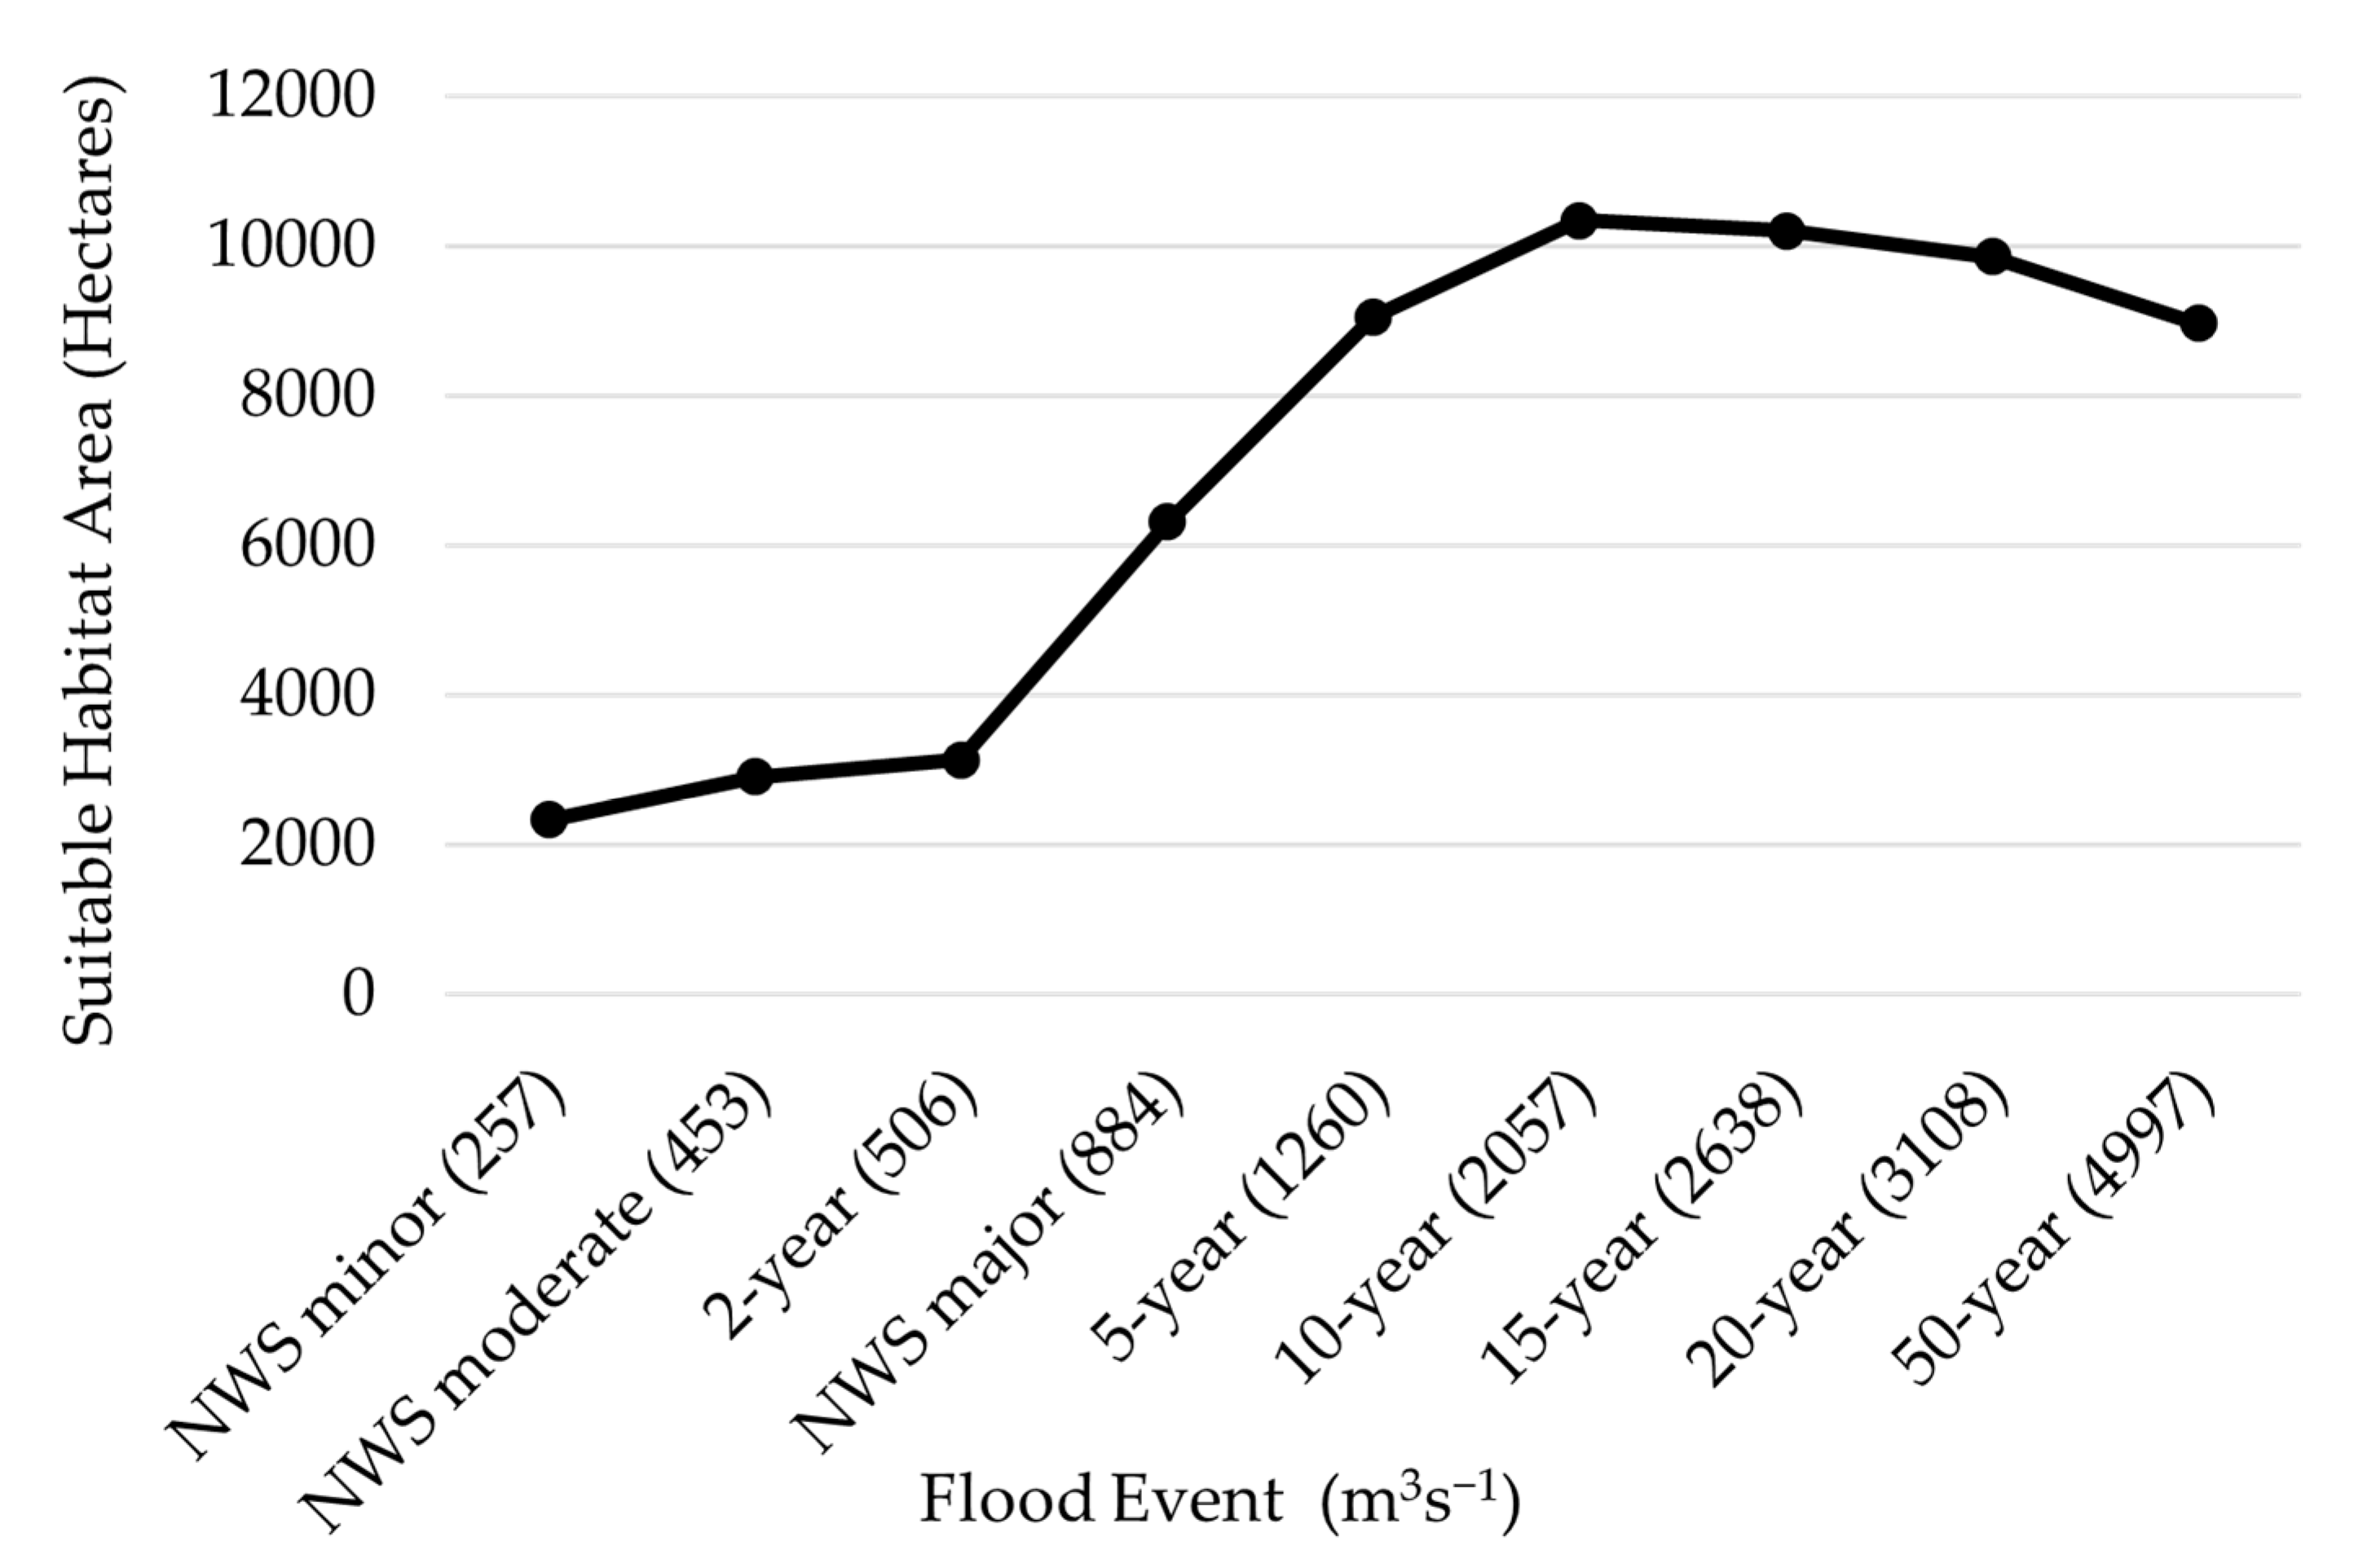
3.2. Suitable Spawning Habitat Modeling

A summary of suitable spawning habitats for floodplain depths and vegetation land cover for Alligator Gar spawning as a dependent variable against discharge yields a non-linear relationship (Figure 4). Suitable spawning area increases only 33% over the first three flows from 257 m3s (2339 Ha) to 506 m3s−1 (3132 Ha). A threshold is crossed at the 2-year flood recurrence and the spawning area increases by 101% between 506 m3s−1 and 884 m3s−1 to 6317 Ha. The suitable spawning area continues to increase to a peak habitat availability of 10,300 Ha, occurring with 2057 m3s−1 and corresponding to the 10-year flood recurrence interval frequency. Suitable spawning area gradually declines for the 15-year, 20-year, and 50-year recurrence floods. With the non-linear relationship, roughly the same amount of spawning habitat is available at the 5-year flood (9059 Ha), as occurs at the 50-year flood (8969 Ha) (Figure 4). Mapped outputs for the four conditional criteria provide spatially explicit examples of the suitable habitat relative to flood magnitude (Figure 5).

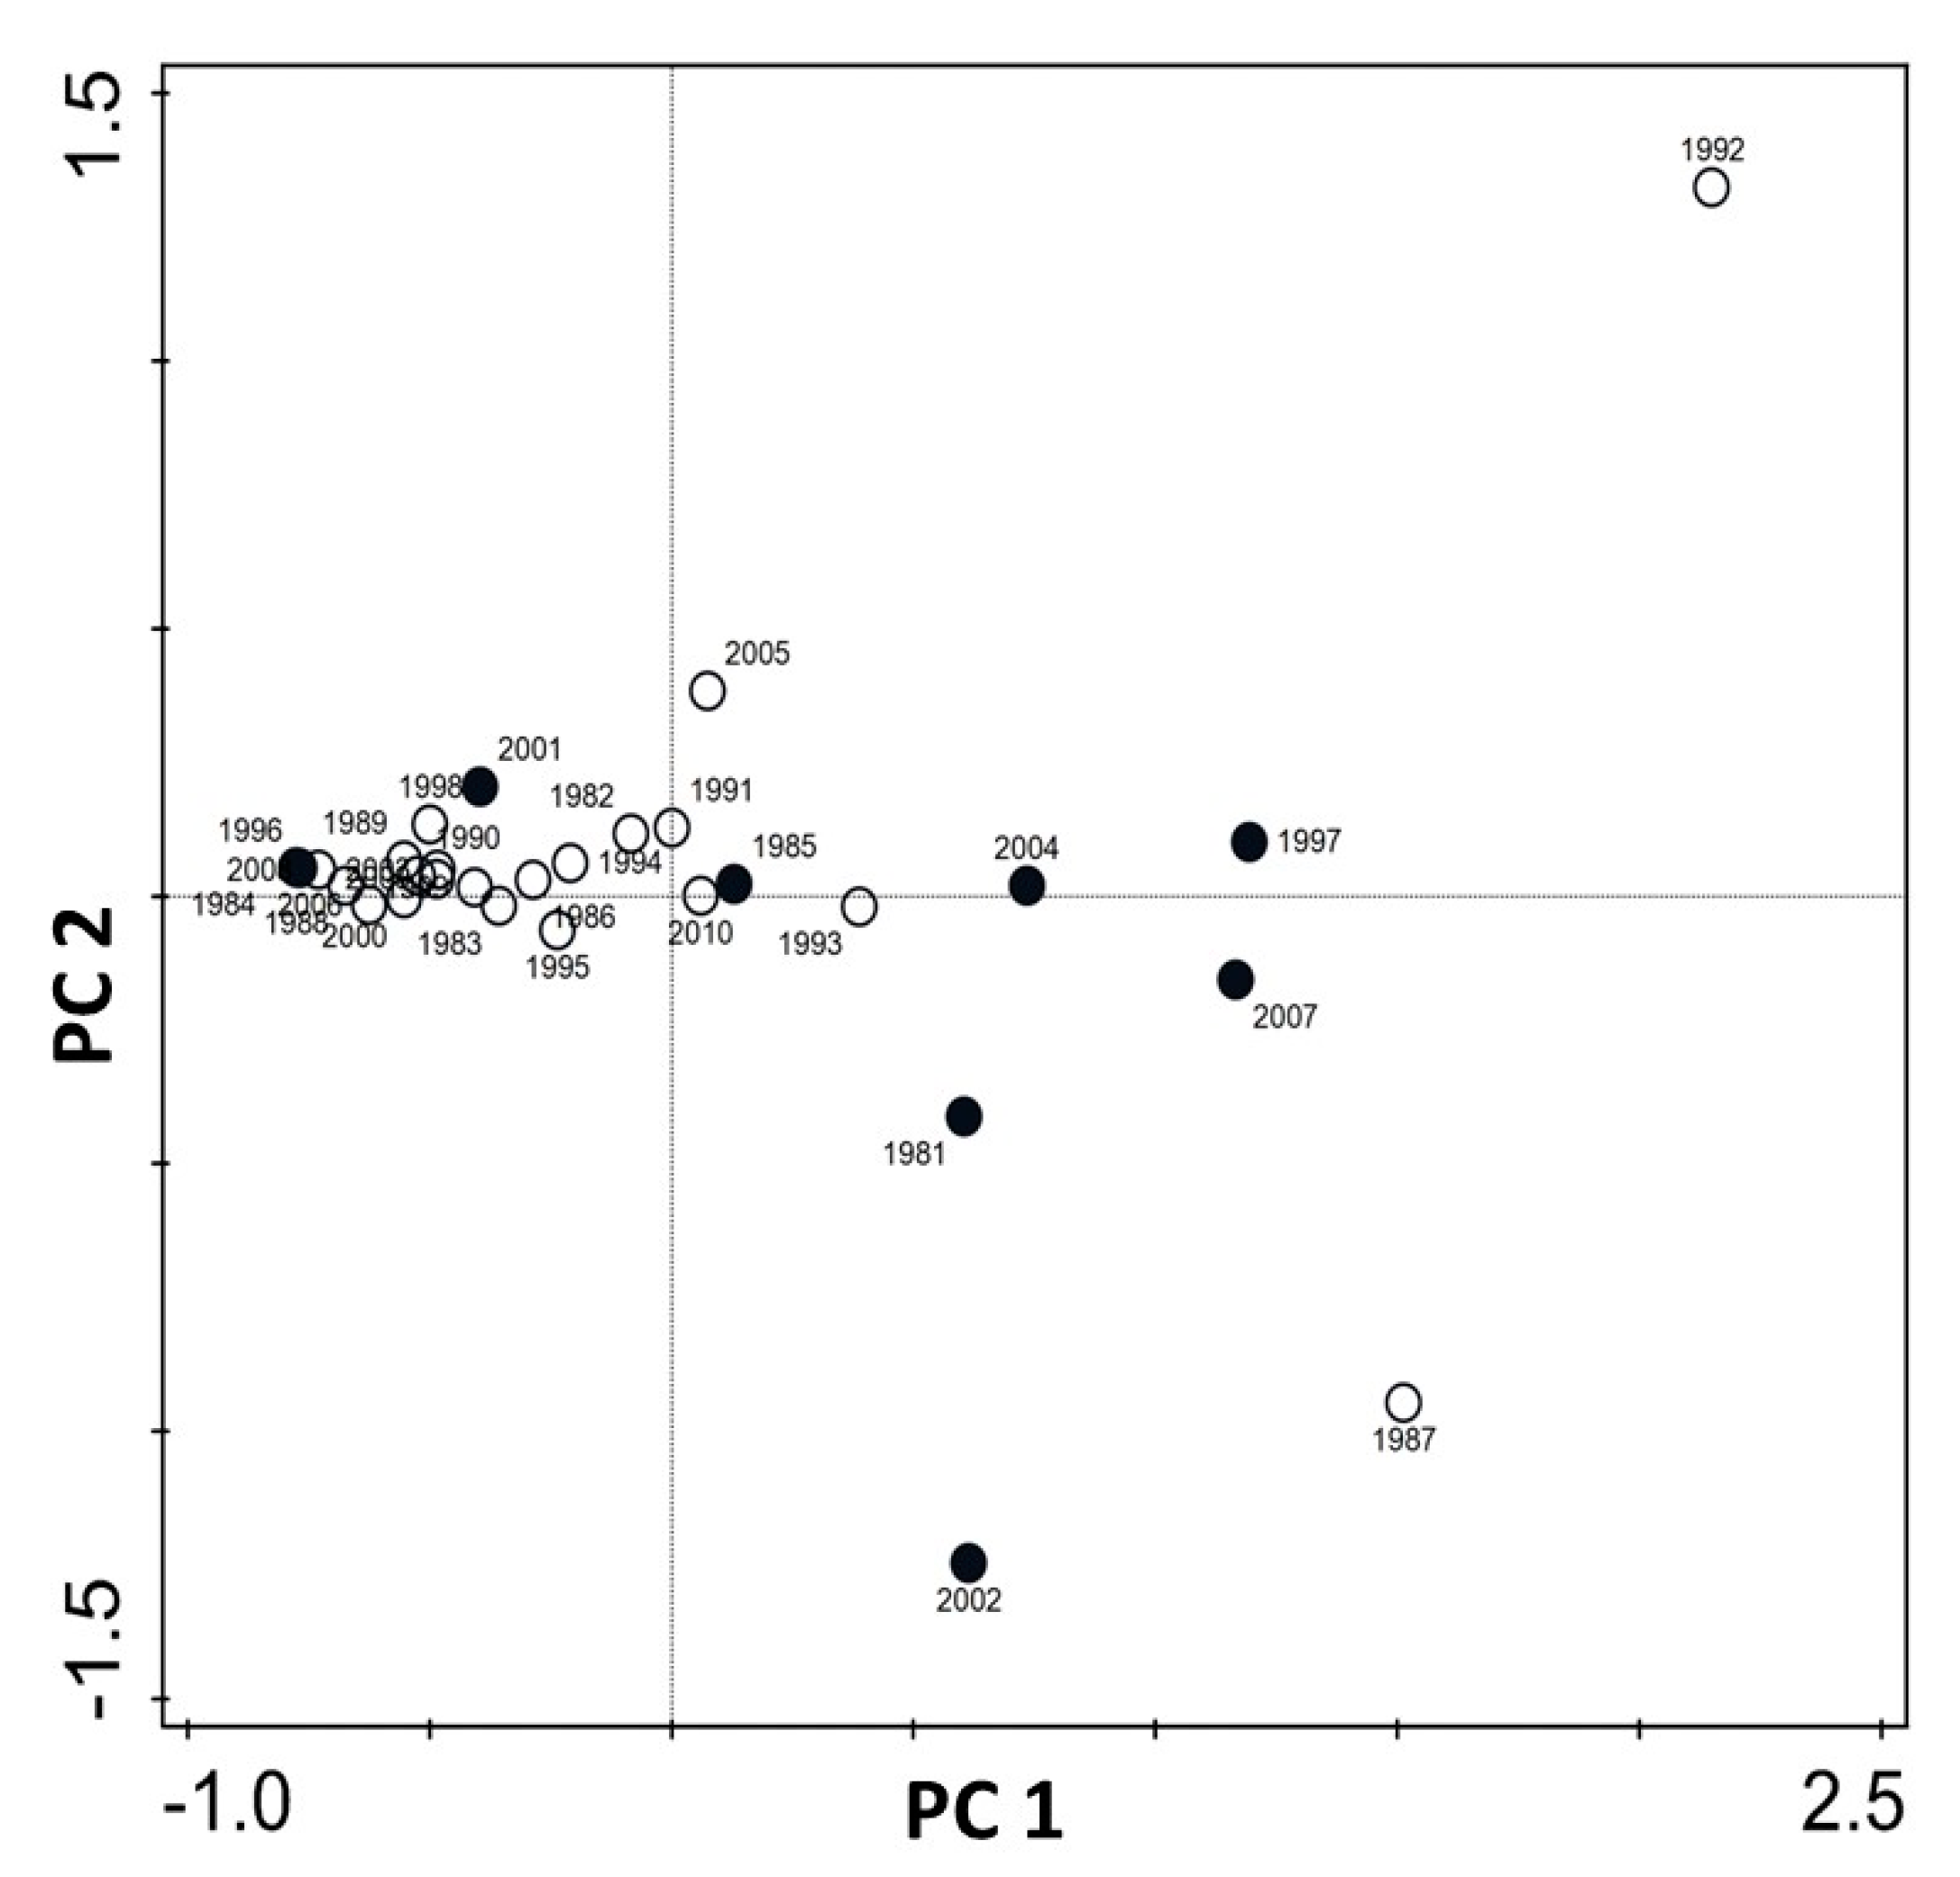
3.3. Flow-Ecology Analysis

The results of the RYCS analysis yielded recruitment data from 1981–2010. Of the 20 years that indicated recruitment success, eight years represented high RYCS (1981, 1985, 1996, 1997, 2001, 2002, 2004, 2007), three years represented moderate RYCS (1986, 1987, 2006), and six years had low RYCS (1990, 1992, 2005, 2008, 2009, 2010) (Table 4). The PCA analysis (68.8% of the variance explained by principal components PC 1 and PC 2) revealed that two years (1996 and 2001) classified as high recruitment years did not group with the other high recruitment year classes (Figure 6). Principle component (PC) 1 explained 53.23% of the variation and all hydrologic variables loaded positively on PC 1, as did all high RYCS years except 1996 and 2001. These may have been the result of mis-aged fish, given that they were within one year of other high-year class strength years (1997 and 2002). Because of the likelihood that these were mis-aged fish, they were removed from further analysis.
Assessing multicollinearity, five variables (1-day max, 3-day max, 7-day max, 30-day max, 90-day max, and Spawn Season High Flow Pulse Total D) were found to be highly correlated with one another and multiple other variables (Spearman’s rho ≥ 0.8; full tables in the Supplementary Materials as Table S1). The 1-day, 3-day, 7-day, 30-day, and 90-day max flow variables were highly correlated with one other, so we only retained the 7-day max for further analysis as seven days are approximately the minimum amount of time for Alligator Gar eggs to hatch and for the larva to be free-swimming [24]. The variable for Spawn Season High Flow Pulse Total D was highly correlated with 12 of the other 26 variables and was excluded from further analysis. In addition, there were other variables that were found to be highly correlated (e.g., monthly mean flow and max flow variables) but were retained for further analysis, given that they describe different components of high flow pulses that needed to be evaluated. We reanalyzed the correlation analysis on the reduced set of hydrologic metrics and found 14 of the 22 variables were significantly (p ≤ 0.05) positively correlated to RYCS (Table 5). The first five most important hydrologic metrics (p ≤ 0.001) included four from July related to discharge and duration, as well as the maximum cumulative duration of high flow pulse events during the spawning season. The July maximum discharge indicated that high RYCS occurred with peak flows of ~5-year frequency with an available spawning area of ~9000 Ha, moderate RYCS related to peak flows with ~3-year frequency with an available spawning area of 6000 Ha, and spawning was likely to occur at least every other year (low RYCS) with 2500 Ha of available spawning area. July high flow pulse durations of 28 days contributed to high recruitment years, 23 days contributed to moderate recruitment years, and low recruitment years averaged 16 days.
Duration statistics tended toward a pattern of longer monthly high pulse consecutive days, longer spawning season consecutive days associated with high recruitment spawning years, and lower durations for moderate and low recruitment years. This pattern is generally consistent with the remaining significantly correlated variables except for the high flow pulse maximum cumulative duration in April, which had the shortest duration for high recruitment years and the longest duration for the low recruitment year class.
The secondary analysis for the longer flow period, examining the frequency and duration of three flow ranges for high flow pulses, small floods, and large floods, yielded additional results supporting the habitat suitability modeling and RYCS results. The three environmental flow component ranges were selected after interpreting the results of the geospatial model (Figure 4) to include a high flow pulse range for flows below the 50% chance annual probability, small floods that ranged from the 2-year to the 10-year flood recurrence, and large floods that ranged from the 10-year up to the 50-year event, because these statistics were calculated from the full period of record and cover a range of discharges, and not just annual peak flows, and provide a more meaningful understanding of their expected occurrence. The high flow pulses ranged from 250–499 m3s−1 and occurred on average every 1.5 years for a 20-day duration, corresponding to a spawning event that is likely to occur at least every other year; meanwhile, small floods that related to the greatest increases in suitable habitat area between 500 and 2000 m3s−1 occurred on average every 5 years and had an average duration of 7.25 days. The large floods in the range of 2000–5000 m3s−1, which corresponded to reductions in suitable habitat area, occurred on average every 42 years with a duration of 12 days.

4. Discussion

The habitat suitability model and flow-ecology statistics reveal important relationships among the area available for suitable spawning, seasonal hydrologic variables, and Alligator Gar recruitment success. An elucidating result revealed a threshold jump in the amount of suitable spawning area that increases after 500 m3s−1, which corresponded to flow magnitudes correlated with a high recruitment year of spawning success. As a 2-year flood frequency recurrence interval, this 500 m3s−1 magnitude closely relates to what would be recognized as the mean annual flood (2.33-year RI), which is fundamentally recognized as a geomorphically effective flow for overland flood processes that correlate to physical factors including drainage basin area, annual runoff statistics, channel storage, and area of floodplain water storage (lakes, wetlands, etc.). The significant correlation between high recruitment years and the large increase in suitable habitat area after the two-year flood frequency supported additional validation of the geospatial model’s usefulness in flow-ecology applications.
Increasing the spatial area of flood inundation depths > 2 m likely contributes to the non-linear relationship between suitable spawning areas and increasing discharge, where the available habitat begins to decline. Robertson et al. (2018) [3] eliminated flows with an annual exceedance probability of less than 0.5%, and their results revealed a linear relationship between increasing flow and suitable spawning areas. We found that the non-linear relationship began to occur with flows of a 10% annual exceedance probability, enabling more constraints on determining thresholds of ecologically functioning flows for recruitment success. Van der Most et al. [9] reported that inundation depths associated with abandoned meander oxbow lakes often created unsuitable spawning habitats. The lower Guadalupe River contains numerous abandoned channel features that increase in flood depth with increasing discharge, and, similar to van der Most et al. [9], this may contribute to a reduction of suitable spawning areas with larger floods. The use of oxbow lakes by juvenile Alligator Gar, however, may be important to their earlier life stages; Robertson et al. [45] reported 19 juveniles in an oxbow of the middle Brazos River during a wet year with multiple flood pulses. While the oxbows may not provide ideal spawning conditions, access to these features following successful spawning events could be important. Future analysis could include modeling hydrodynamic and hydraulic connectivity between suitable spawning sites and oxbow lakes during the waning flood limbs.
The similar amount of spawning area available for the significantly correlated hydrologic metrics representing the magnitude of flows across high, moderate, and low recruitment years and the longer high pulse flow durations associated with high recruitment years suggest that longer duration flows contribute significantly to more successful spawning than just area alone. Robertson et al. [3] showed similar results in the Trinity River, Texas, where hydrologic metrics associated with high flow pulse durations in July were significantly correlated with high recruitment year classes. This supports the findings of Buckmeier et al. [24] and Smith et al. [46] in contending the importance of considering the interactions of multiple variables related to spawning criteria. Although we did not include a temperature variable like Allen et al. [10], the high correlation of five July flow metrics (Table 5) to excellent RYCS provides proxy observations supporting the role of warmer, late-season temperatures and spawning success [46]. Temperature has been shown to be an important factor for Alligator Gar movements into floodplain habitats during the spawning months [3,10,22]. Longer access to floodplain habitats during warmer spawning months as shown in this study most likely allows for quicker growth in larval [47] and juvenile [48] Alligator Gar to escape predation and successfully recruit. In addition to the analyses performed here, the spatial modeling products derived from this study have multiple uses. While the present study does not evaluate hydrodynamic processes of specific flood events or incorporate biological aspects of fish movement, fisheries scientists can use the suitability maps as field references for surveying flooded habitats for validating in situ spawning events during high water conditions, as was applied with Allen et al. [10]. Using the significantly correlated hydrologic variables, stakeholder committees and science teams contributing to the legislatively mandated Texas 2007 Senate Bill 3 [11] environmental flow process can develop, refine, and validate high flow pulse and overbank flow recommendations that consist of timing, magnitude, duration, and frequency components to ensure Alligator Gar recruitment success. Study results and methodologies can also assist water planners, water managers, and conservation managers in designing restoration and protection strategies that minimize or avoid impacts to imperiled Alligator Gar populations and other floodplain-dependent fish and wildlife resources.
The suitability maps can also be used to help prioritize land conservation to prevent the loss of site-specific spawning and recruiting habitats. Future analyses could examine how the spatial patterns of suitable habitats change under the various flood conditions of specific flood events to help prioritize and direct conservation efforts to the areas that provide the most persistent habitat available over the greatest range of flow scenarios. Such analysis could also be useful for identifying and protecting rearing habitats for juvenile Alligator Gar. Allen et al. [10,15] document the importance of the protected St. Catherine Creek National Wildlife Refuge in Natchez, Mississippi, for providing an Alligator Gar spawning habitat and show the benefit that such a site can have on advancing the scientific understanding of this species. Texas is ~96% privately owned, with less than 5% public lands; the lower Guadalupe Basin mirrors this statistic [49], with minimal spawning habitat protected in perpetuity for Alligator Gar. Working with private agriculture, livestock, and ranching interests through the establishment of conservation easements on floodplain areas and managing for preferred land cover and access to spawning sites could help reduce habitat loss and support Alligator Gar population resilience in Texas.

5. Conclusions

Traditional flood modeling approaches for developing 2D flood extents and depth maps provide valuable input layers for quantifying flow-ecology relationships of floodplain-dependent species across large spatial areas, and the results can be used in a variety of applications. In the present case study, we illustrated how to develop and post-process floodplain inundation maps by preserving only river-floodplain hydrologically connected areas of user-specified depths to be used as a primary input with specific vegetation cover types to model and quantify suitable spawning habitats and hydrologic conditions for supporting Alligator Gar recruitment. The results produced useful information for better understanding the spatial and temporal flow-ecology dynamics of this vulnerable species. Suitable inundation depths for spawning constrained a linear increase of available habitat with increasing flood discharge, producing a non-linear response. This result highlighted the importance of lower magnitude, higher frequency, and longer duration high pulse flows and small floods for sustaining Alligator Gar recruitment. The statistical results examining suitable spawning areas and recruitment data indicate that successful spawning has occurred over a wide range of flows, with the best conditions strongly correlating to the magnitude of the July discharge and the duration of high flow pulse events. Applications such as these could be improved by using dynamic models that capture wetting and drying and the associated spatial and temporal changes in flood depth over an event. A coupled approach with relating the inundation maps to real-time temperature and depth sensors and fish tracking would improve the identification of key habitats for protection. The management and conservation of these species depend on the collaboration of multiple stakeholders including private floodplain landowners. Spatially and temporally informed floodplain inundation modeling applications, such as this example, can provide valuable tools for designing conservation strategies for floodplain-dependent species. This example provides a framework for developing spatially explicit flood models for applications focused on the spatial and temporal dynamics of suitable habitat availability and species-specific flow-ecology relationships.

Supplementary Materials

The following supporting information can be downloaded at: https://www.mdpi.com/article/10.3390/hydrology10060123/s1. Table S1: Spearman rank order correlation matrix.

Author Contributions

Conceptualization, K.M.M., C.R.R., J.LJ., D.J.D., T.B.H. and K.B.M.; methodology, K.M.M., C.R.R., J.LJ. and D.J.D.; software, K.M.M., C.R.R., J.L.J. and D.J.D.; validation, K.M.M. and C.R.R.; formal analysis, K.M.M., C.R.R., J.L.J. and D.J.D.; investigation, K.M.M., C.R.R., J.L.J. and D.J.D.; resources, K.M.M., C.R.R., J.L.J. and D.J.D.; data curation, K.M.M., C.R.R., J.L.J. and D.J.D.; writing—original draft preparation, K.M.M.; writing—review and editing, K.M.M., C.R.R., J.L.J., D.J.D., T.B.H. and K.B.M.; visualization, K.M.M. and C.R.R.; funding acquisition, K.M.M., J.L.J., T.B.H. and K.B.M.; supervision K.M.M.; project administration, K.M.M., T.B.H. and K.B.M. All authors have read and agreed to the published version of the manuscript.

Funding

This research was funded by the Texas Water Development Board, contract number 1448311791, and the Texas Parks and Wildlife Department, contract number 474120, in cooperation with the U.S. Fish and Wildlife Service, Wildlife, and Sport Fish Restoration Program.

Institutional Review Board Statement

Not applicable.

Informed Consent Statement

Not applicable.

Data Availability Statement

The data presented in this study are available on request from the corresponding author.

Acknowledgments

We acknowledge the Texas State University students Mason McGee and Keagan McNew for their assistance with data preparation, and Texas Water Development Board collaborators Nolan Raphelt and Mark Wentzel for helpful discussions on floodplain inundation model improvements. We thank three anonymous reviewers for suggestions to improve the manuscript.

Conflicts of Interest

The authors declare no conflict of interest.

References

  1. Kupfer, J.A.; Meitzen, K.M.; Gao, P. Flooding and surface connectivity of Taxodium-Nyssa stands in a southern floodplain forest ecosystem. River Res. Appl. 2015, 31, 1299–1310. [Google Scholar] [CrossRef]
  2. Meitzen, K.M.; Kupfer, J.A.; Gao, P. Modeling hydrologic connectivity and virtual fish movement across a large southeastern floodplain. Aquat. Sci. 2018, 80, 1–15. [Google Scholar] [CrossRef]
  3. Robertson, C.R.; Aziz, K.; Buckmeier, D.L.; Smith, N.G.; Raphelt, N. Development of a flow specific floodplain inundation model to assess alligator gar recruitment success. Trans. Am. Fish. Soc. 2018, 147, 674–686. [Google Scholar] [CrossRef]
  4. Chomba, I.C.; Banda, K.E.; Winsemius, H.C.; Eunice, M.; Sichingabula, H.M.; Nyambe, I.A. Integrated hydrologic-hydrodynamic inundation modeling in a groundwater dependent tropical floodplain. J. Hum. Earth Future. 2022, 3, 237–246. [Google Scholar] [CrossRef]
  5. Junk, W.J.; Bayley, P.B.; Sparks, R.E. The flood pulse concept in river-floodplain systems. Can. J. Fish. Aquat. Sci. 1989, 106, 110–127. [Google Scholar]
  6. Ward, J. Riverine landscapes: Biodiversity patterns, disturbance regimes, and aquatic conservation. Biol. Conserv. 1998, 83, 269–278. [Google Scholar] [CrossRef]
  7. Lytle, D.H.; Poff, N.L. Adaptation to natural flow regimes. Trends Ecol. Evol. 2004, 19, 94–100. [Google Scholar] [CrossRef]
  8. Walker, R.H.; Naus, C.J.; Adams, S.R. Should I stay or should I go: Hydrologic characteristics and body size influence fish emigration from the floodplain following an atypical summer flood. Ecol. Freshw. Fish. 2021, 31, 607–621. [Google Scholar] [CrossRef]
  9. van der Most, M.; Hudson, P.F. The influence of floodplain geomorphology and hydrologic connectivity on Alligator Gar (Atractosteus spatula) habitat along the embanked floodplain of the lower Mississippi River. Geomorphology 2017, 302, 62–75. [Google Scholar] [CrossRef]
  10. Allen, Y.; Kimmel, K.; Constant, G. Using remote sensing to assess Alligator Gar spawning habitat suitability in the lower Mississippi River. N. Am. J. Fish. Manag. 2020, 40, 580–594. [Google Scholar] [CrossRef]
  11. Opdyke, D.R.; Oborny, E.L.; Vaugh, S.K.; Mayes, K.B. Texas Environmental flow standards and the hydrology-based environmental flow regime methodology. Hydrol. Sci. J. 2014, 59, 820–830. [Google Scholar] [CrossRef]
  12. Daugherty, D.J.; Andrews, A.; Smith, N.G. Otolith-based age estimates of Alligator Gar assessed using bomb radiocarbon dating to greater than 60 years. N. Am. J. Fish. Manag. 2020, 40, 613–621. [Google Scholar] [CrossRef]
  13. Daugherty, D.J.; Buckmeier, D.L.; Smith, N.G. Sex-specific dynamic rates in the Alligator Gar: Implications for stock assessment and management. N. Am. J. Fish. Manag. 2019, 39, 535–542. [Google Scholar] [CrossRef]
  14. Smith, N.G.; Daugherty, D.J.; Brinkman, E.L.; Wegener, M.G.; Kreiser, B.R.; Ferrara, A.M.; Kimmel, K.D.; David, S.R. Advances in conservation and management of the alligator gar: A synthesis of current knowledge and introduction to a special section. N. Am. J. Fish. Manag. 2020, 40, 527–543. [Google Scholar] [CrossRef]
  15. Allen, Y.C.; Kimmel, K.M.; Constant, G.C. Alligator Gar Movement and Water Quality Patterns on the St. Catherine Creek National Wildlife Refuge Floodplain; Baton Rouge Fish and Wildlife Conservation Office Report; U.S. Fish and Wildlife Service: Washington, DC, USA, 2014.
  16. Boudreaux, P.J.; Ferrara, A. Acute toxicity of ammonia to Spotted Gar, Lepisosteus oculatus, Alligator Gar, Atractosteus spatula, and Paddlefish, Polyodon spathula. J. World Aquac. Soc. 2007, 38, 322–325. [Google Scholar] [CrossRef]
  17. Schwarz, D.E.; Allen, P.J. Effects of salinity on growth and ion regulation of juvenile Alligator Gar Atractosteus spatula. Comp. Biochem. Phys. A 2014, 169, 44–50. [Google Scholar] [CrossRef] [PubMed]
  18. Sakaris, P.C.; Ferrara, A.M.; Kleiner, K.J.; Irwin, E.R. Movements and home ranges of Alligator Gar in the Mobile-Tensaw delta, Alabama. Proc. Annu. Conf. Southeast Assoc. Fish. Wildl. Agencies 2005, 57, 102–111. [Google Scholar]
  19. Inebnit, T.E., III. Aspects of the Reproductive and Juvenile Ecology of Alligator Gar in the Fourche LaFave River, Arkansas. Master’s Thesis, University of Central Arkansas, Conway, AR, USA, 2009. [Google Scholar]
  20. Buckmeier, D.L.; Smith, N.G.; Daugherty, D.J. Alligator Gar Movement and Macrohabitat Use in the Lower Trinity River, Texas. Trans. Am. Fish. Soc. 2013, 142, 1025–1035. [Google Scholar] [CrossRef]
  21. Wegener, M.G.; Harriger, K.M.; Knight, J.R.; Barrett, M.A. Movement and Habitat Use of Alligator Gars in the Escambia River, Florida. N. Am. J. Fish. Manag. 2017, 37, 1028–1038. [Google Scholar] [CrossRef]
  22. Kluender, E.R.; Adams, R.; Lewis, L. Seasonal habitat use of alligator gar in a river-floodplain ecosystem at multiple spatial scales. Ecol. Freshw. Fish. 2016, 26, 233–246. [Google Scholar] [CrossRef]
  23. Roberts, H.C.; Acre, M.R.; Claus, M.P.; Kappen, F.J.; Winemiller, K.O.; Daugherty, D.J.; Perkin, J.S. Tributary streams provide migratory fish with access to floodplain habitats in a regulated river: Evidence from Alligator Gar, Atractosteus spatula. Can. J. Fish. Aquat. Sci. 2023, 80, 393–407. [Google Scholar] [CrossRef]
  24. Buckmeier, D.L.; Smith, N.G.; Daugherty, D.J.; Bennett, D.L. Reproductive ecology of alligator gar: Identification of environmental drivers of recruitment success. J. South Assoc. Fish. Wild. Agency 2017, 4, 8–17. [Google Scholar]
  25. Mendoza, R.; Aguilera, C.; Rodriguez, G.; Gonzalez, M.; Castro, R. Morphophysiological studies on alligator gar (Atractosteus spatula) larval development as a basis for their culture and repopulation of their natural habitats. Rev. Fish. Biol. Fish. 2002, 12, 133–142. [Google Scholar] [CrossRef]
  26. Winemiller, K.O.; Rose, K.A. Patterns of life-history diversification in North American fishes: Implications for population regulation. Can. J. Fish. Aquat. Sci. 1992, 49, 2196–2218. [Google Scholar] [CrossRef]
  27. Ferrara, A.M. Life History Strategy of Lepisosteidae: Implications for the Conservation and Management of Alligator Gar. Ph.D. Thesis, Auburn University, Auburn, AL, USA, 2001. [Google Scholar]
  28. Birdsong, T.; Garrett, G.; Bean, M.; Bean, P.; Curtis, S.; Fleming, P.; Grubh, A.; Lutz-Carrillo, D.; Mayes, K.; Robertson, C.; et al. Conservation of Texas Freshwater Fish Diversity: Selection of Species of Greatest Conservation Need; TPWD RP T3200-2780 (10/20); Texas Parks and Wildlife Department: Austin, TX, USA, 2020. [Google Scholar]
  29. Hoeinghaus, D.; Jensen, J.L.; Hardy, T.B.; Winemiller, K.O.; Pease, A.A.; Allen, Y. Quantification of Alligator Gar Recruitment Dynamics Using a River-Stage Specific Floodplain Inundation Model; Gulf Coast Prairie Landscape Conservation Cooperative Report; U.S. Fish and Wildlife Service: Washington, DC, USA, 2018; pp. 1–46.
  30. Baker, V.R. Flood Hazards along the Balcones Escarpment in Central Texas: Alternative Approach to Their Recognition, Mapping, and Management; Bureau of Economic Geology; Geological Circular 75-5; The University of Texas at Austin: Austin, TX, USA, 1975. [Google Scholar]
  31. Slade, R.M., Jr.; Patton, J. Major and Catastrophic Storms and Floods in Texas; U.S. Geological Survey Open-File Report 03-193; U.S. Geological Survey: Baltimore, MD, USA, 2003; pp. 1–26.
  32. NOAA. National Ocean and Atmospheric Agency, National Center for Environmental Information. 2023. Available online: https://www.ncei.noaa.gov/cdo-web/ (accessed on 10 March 2023).
  33. USGS. United States Geological Survey, National Water Information System. 2023. Available online: https://waterdata.usgs.gov/monitoring-location/08176500/#parameterCode=00065&period=P7D (accessed on 26 April 2023).
  34. USACE. HEC-SSP, v.2.1.1; US Army Corps of Engineers: Washington, DC, USA, 2016.
  35. Elliott, L.F.; Treuer-Kuehn, A.; Blodgett, C.F.; True, C.D.; German, D.; Diamond, D.D. Ecological Systems of Texas: 391 Mapped Types. Phase 1–6, 10-Meter Resolution Geodatabase, Interpretive Guides, and Technical Type Descriptions; Texas Parks & Wildlife Department and Texas Water Development Board: Austin, TX, USA, 2014. [Google Scholar]
  36. USACE. HEC-RAS 1D/2D, v.5.0.1; US Army Corps of Engineers: Washington, DC, USA, 2016.
  37. USACE. HEC-GeoRAS, v. 10.2 for ArcGIS 10.2; US Army Corps of Engineers: Washington, DC, USA, 2016.
  38. ESRI. ArcGIS Desktop, Software v.10.2 and v.10.4.1; Environmental Systems Research Institute: Redlands, CA, USA, 2016. [Google Scholar]
  39. NWS. National Weather Service Advanced Hydrologic Prediction Service. 2023. Available online: https://water.weather.gov/ahps2/inundation/index.php?gage=vict2 (accessed on 26 April 2023).
  40. Brinkman, E.L. Contributions to the Life History of Alligator Gar Atractosteus spatula in Oklahoma. Master’s Thesis, Oklahoma State University, Stillwater, OK, USA, 2008. [Google Scholar]
  41. Daugherty, D.J.; Pangle, K.L.; Karel, W.; Baker, F.; Robertson, C.R.; Buckmeier, D.L.; Smith, N.G.; Boyd, N. Population Structure of Alligator Gar in a Gulf Coast River: Insights from Otolith Microchemistry and Genetic Analyses. N. Am. J. Fish. Manag. 2017, 37, 337–348. [Google Scholar] [CrossRef]
  42. Buckmeier, D.L.; Smith, N.G.; Reeves, K.S. Utility of Alligator Gar Age Estimates from Otoliths, Pectoral Fin Rays, and Scales. Trans. Am. Fish. Soc. 2012, 141, 1510–1519. [Google Scholar] [CrossRef]
  43. Indicators of Hydrological Alteration (IHA) Software. Available online: https://www.conservationgateway.org/ConservationPractices/Freshwater/EnvironmentalFlows/MethodsandTools/IndicatorsofHydrologicAlteration/Pages/IHA-Software-Download.aspx (accessed on 3 March 2023).
  44. Mathews, R.; Richter, B.D. Application of the Indicators of Hydrologic Alteration Software in Environmental Flow Setting. J. Am. Water Resour. Assoc. 2007, 43, 1400–1413. [Google Scholar] [CrossRef]
  45. Robertson, C.R.; Zeug, S.C.; Winemiller, K.O. Associations between hydrologic connectivity and resource partitioning among sympatric gar species (Lepisosteidae) in a Texas river and associated oxbows. Ecol. Freshw. Fish. 2008, 17, 119–129. [Google Scholar] [CrossRef]
  46. Smith, N.G.; Buckmeier, D.L.; Daugherty, D.J.; Bennett, D.L.; Sakaris, P.C.; Robertson, C.R. Hydrologic correlates of reproductive success in the Alligator Gar. N. Am. J. Fish. Manag. 2020, 40, 595–606. [Google Scholar] [CrossRef]
  47. Long, J.M.; Snow, R.A.; Porta, M.J. Effects of temperature on hatching rate and early development of Alligator Gar and Spotted Gar in a laboratory setting. N. Am. J. Fish. Manag. 2020, 40, 661–668. [Google Scholar] [CrossRef]
  48. Snow, R.A.; Porta, M.J.; Simmons, R.W., Jr.; Bartnicki, J.B. Early life history characteristics and contribution of stocked juvenile Alligator Gar in Lake Texoma, Oklahoma. Proc. Okla. Acad. Sci. 2018, 98, 46–54. [Google Scholar]
  49. Todd, D.; Ogren, J. The Texas Landscape Project: Nature and People; Texas A&M University Press: College Station, TX, USA, 2016; pp. 1–96. [Google Scholar]
Figure 1. Guadalupe River Basin with lower study area designated by black oval and stream flow gage locations ordered and identified from upstream to downstream. The inset digital elevation model (DEM) provides context for floodplain topography.
Hydrology 10 00123 g001
Figure 2. Geometry layers created for the four modeled reaches with bounding stream flow data.
Hydrology 10 00123 g002
Figure 3. Flood inundation extent and depth maps for nine modeled events. The inset box overlaps the area of NWS flood mapping used in the validation and error analysis.
Hydrology 10 00123 g003
Figure 4. Suitable spawning habitat for flood depth and vegetation criteria for Alligator Gar relative to discharge.
Hydrology 10 00123 g004
Figure 5. Habitat suitability maps for the nine discharges. Dark green indicates suitable for land cover and depth, blue indicates suitable depth and unsuitable land cover, light green indicates suitable for land cover and unsuitable for depth, and tan indicates unsuitable for depth and land cover.
Hydrology 10 00123 g005
Figure 6. Principal component analysis of hydrologic variables by year. PC 1 explains 53.23% of the variance, and PC 2 explains 15.57% of the variance. Filled in circles are years of high Alligator Gar recruitment. The two years 2001 and 1996 are dissimilar to other high Alligator Gar recruitment years and are most likely mis-aged fish and were excluded from further analysis.
Hydrology 10 00123 g006
Table 1. Vegetation communities derived from the Texas Ecological Mapping Systems data that were classified as suitable for Alligator Gar spawning.
Vegetation Community Common Names
Central Texas: Floodplain Deciduous ShrublandBlackland Prairie: Disturbance or Tame Grassland
Central Texas: Floodplain Evergreen ShrublandGulf Coast: Coastal Prairie
Central Texas: Floodplain Herbaceous VegetationGulf Coast: Coastal Prairie Pondshore
Central Texas: Floodplain Herbaceous WetlandGulf Coast: Salty Prairie
Central Texas: Riparian Deciduous ShrublandGulf Coast: Salty Prairie Shrubland
Central Texas: Riparian Evergreen ShrublandInland: Salty Prairie
Central Texas: Riparian Herbaceous VegetationInland: Salty Prairie Shrubland
Central Texas: Riparian Herbaceous WetlandInvasive: Evergreen Shrubland
Coastal and Sandsheet: Deep Sand GrasslandMarsh
Coastal and Sandsheet: Deep Sand ShrublandNative Invasive: Baccharis Shrubland
Coastal Bend: Floodplain Deciduous ShrublandNative Invasive: Common Reed
Coastal Bend: Floodplain Evergreen ShrublandNative Invasive: Juniper Shrubland
Coastal Bend: Floodplain GrasslandNative Invasive: Mesquite Shrubland
Coastal Bend: Floodplain Herbaceous WetlandNon-native Invasive: Saltcedar Shrubland
Coastal Bend: Riparian Deciduous ShrublandPost Oak Savanna: Live Oak Shrubland
Coastal Bend: Riparian Evergreen ShrublandPost Oak Savanna: Sandyland Grassland
Coastal Bend: Riparian GrasslandPost Oak Savanna: Savanna Grassland
Coastal Bend: Riparian Herbaceous WetlandRow Crops
Coastal Plain: Terrace Sandyland GrasslandSouth Texas: Clayey Blackbrush Mixed Shrubland
Coastal: Salt and Brackish High Tidal MarshSouth Texas: Clayey Mesquite Mixed Shrubland
Coastal: Salt and Brackish High Tidal Shrub WetlandSouth Texas: Shallow Dense Shrubland
Coastal: Salt and Brackish Low Tidal MarshSouth Texas: Shallow Shrubland
Coastal: Sea Ox-eye Daisy FlatsSouth Texas: Shallow Sparse Shrubland
Table 2. List of hydrologic variables derived from IHA software assessed for correlation to year class strength. All variables were constrained to spawning season (April–July) and compiled for each year (1981–2010) from the Guadalupe Rv. at Victoria, TX gage (08176500). Variables in italics were manually calculated using the IHA environmental flow components tab in the analysis output.
Magnitude DurationFrequency
April_Mean QApril High Flow Pulse Max CDApril High Flow Pulse count
May_Mean QApril High Flow Pulse Total DMay High Flow Pulse count
June_Mean QMay High Flow Pulse Max CDJune High Flow Pulse count
July_Mean QMay High Flow Pulse Total DJuly High Flow Pulse count
1-day maxJune High Flow Pulse Max CD
3-day maxJune High Flow Pulse Total D
7-day maxJuly High Flow Pulse Max CD
30-day maxJuly High Flow Pulse Total D
90-day maxSpawn Season High Flow Pulse Total D
April Max QSpawn Season High Flow Pulse Max CD
May Max Q
June Max Q
July Max Q
Table 3. Error analysis showing the difference between the USGS water surface elevations for each gage and the modeled water surface elevations. USGS water surface elevations were measured by adding the stage for the corresponding discharge to the gage datum.
Gonzales 08173900Cuero 08175800
Event (m3s−1)Model (m)USGSDiff (m)Model (m)USGSDiff (m)
NWS minor (257)78.2378.27−0.0444.9144.96−0.05
NWS moderate (453)80.6580.71−0.0646.6846.630.05
2-year (506)81.0881.020.0647.2647.240.02
NWS major (884)82.8782.840.0348.8848.92−0.04
5-year (1260)83.5083.450.0549.7849.83−0.05
10-year (2057)84.0784.060.0150.8550.90−0.05
15-year (2638)84.3184.37−0.0651.3051.36−0.06
20-year (3108)84.4584.52−0.0751.5151.510.00
50-year (4997)84.6684.67−0.0151.7151.660.05
Victoria 08176500Bloomington 08188800
Event (m3s−1)Model (m)USGSDiff (m)Model (m)USGSDiff (m)
NWS minor (257)15.3015.280.027.507.500.00
NWS moderate (453)17.0117.03−0.027.917.900.01
2-year (506)17.3017.200.108.028.000.02
NWS major (884)17.8317.800.038.188.100.08
5-year (1260)17.9317.900.038.268.250.01
10-year (2057)18.0418.000.048.588.60−0.02
15-year (2638)18.1318.100.038.728.700.02
20-year (3108)18.2218.200.028.908.900.00
50-year (4997)18.5818.500.089.559.500.05
Table 4. Observed, expected, and RYCS year classes from 95 Alligator Gar.
Year ClassObservedExpectedRYCS
198110.6602091.51
198200.721540
198300.7885680
198400.8618230
198510.9418831.06
198611.0293810.97
198711.1250060.89
198801.2295150
198901.3437320
199011.468560.68
199101.6049830
199211.754080.57
199301.9170270
199402.0951120
199502.289740
199632.5024481.20
199742.7349151.46
199812.9889790.33
199903.2666430
200013.5701020.28
200153.9017511.28
2002374.2642098.68
200334.6603370.64
200495.0932651.77
200545.566410.72
200656.0835080.82
2007106.6486421.50
200817.2662760.14
200927.9412850.25
201048.6790.46
Table 5. Hydrologic variables found to be statistically significantly (p ≤ 0.05) correlated to the relative year class strength (RYCS) of the Alligator Gar. Variables are ordered by descending level of significance as shown by their p-value. Hydrologic variable values represent average values (1981–2010) computed for RYCS representing high, moderate, and low recruitment years and all years.
Spearman’s Rho
p-Value
High
Recruitment
Years
Moderate
Recruitment
Years
Low
Recruitment
Years
All Years
July Mean Q (m3s−1)0.612 (0.0005)222.57175.29119.3672.25
July HFP Total D (days)0.606 (0.0006)28.3322.5616.078.57
Spawn Season HFP Max CD (days)0.592 (0.0009)48.5042.5647.6029.67
July HFP Max CD (days)0.587 (0.001)46.6738.2238.2720.07
July Max Q (m3s−1)0.587 (0.001)626.32456.47299.75184.47
April High Flow Pulse Total D (days)0.504 (0.0062)17.6714.2213.138.60
April Mean Q (m3s−1)0.498 (0.0072)95.6675.6179.0459.62
April High Flow Pulse Max CD (days)0.466 (0.0127)14.8317.1126.0716.57
April Max Q (m3s−1)0.456 (0.015)305.44217.53215.33143.75
July High Flow Pulse # (count)0.434 (0.0212)1.000.890.800.57
June Mean Q (m3s−1)0.413 (0.0289)158.34192.15143.1893.26
April High Flow Pulse Count (m3s−1)0.399 (0.0354)1.831.331.401.07
June High Flow Pulse Total D (days)0.395 (0.0374)20.6720.0015.339.50
7-day max (m3s−1)0.378 (0.047)534.93532.22385.39264.42
Disclaimer/Publisher’s Note: The statements, opinions and data contained in all publications are solely those of the individual author(s) and contributor(s) and not of MDPI and/or the editor(s). MDPI and/or the editor(s) disclaim responsibility for any injury to people or property resulting from any ideas, methods, instructions or products referred to in the content.

