
Mapping Projected Variations of Temperature and Precipitation Due to Climate Change in Venezuela

 ,
, 
Abstract
:1. Introduction
2. Materials and Methods
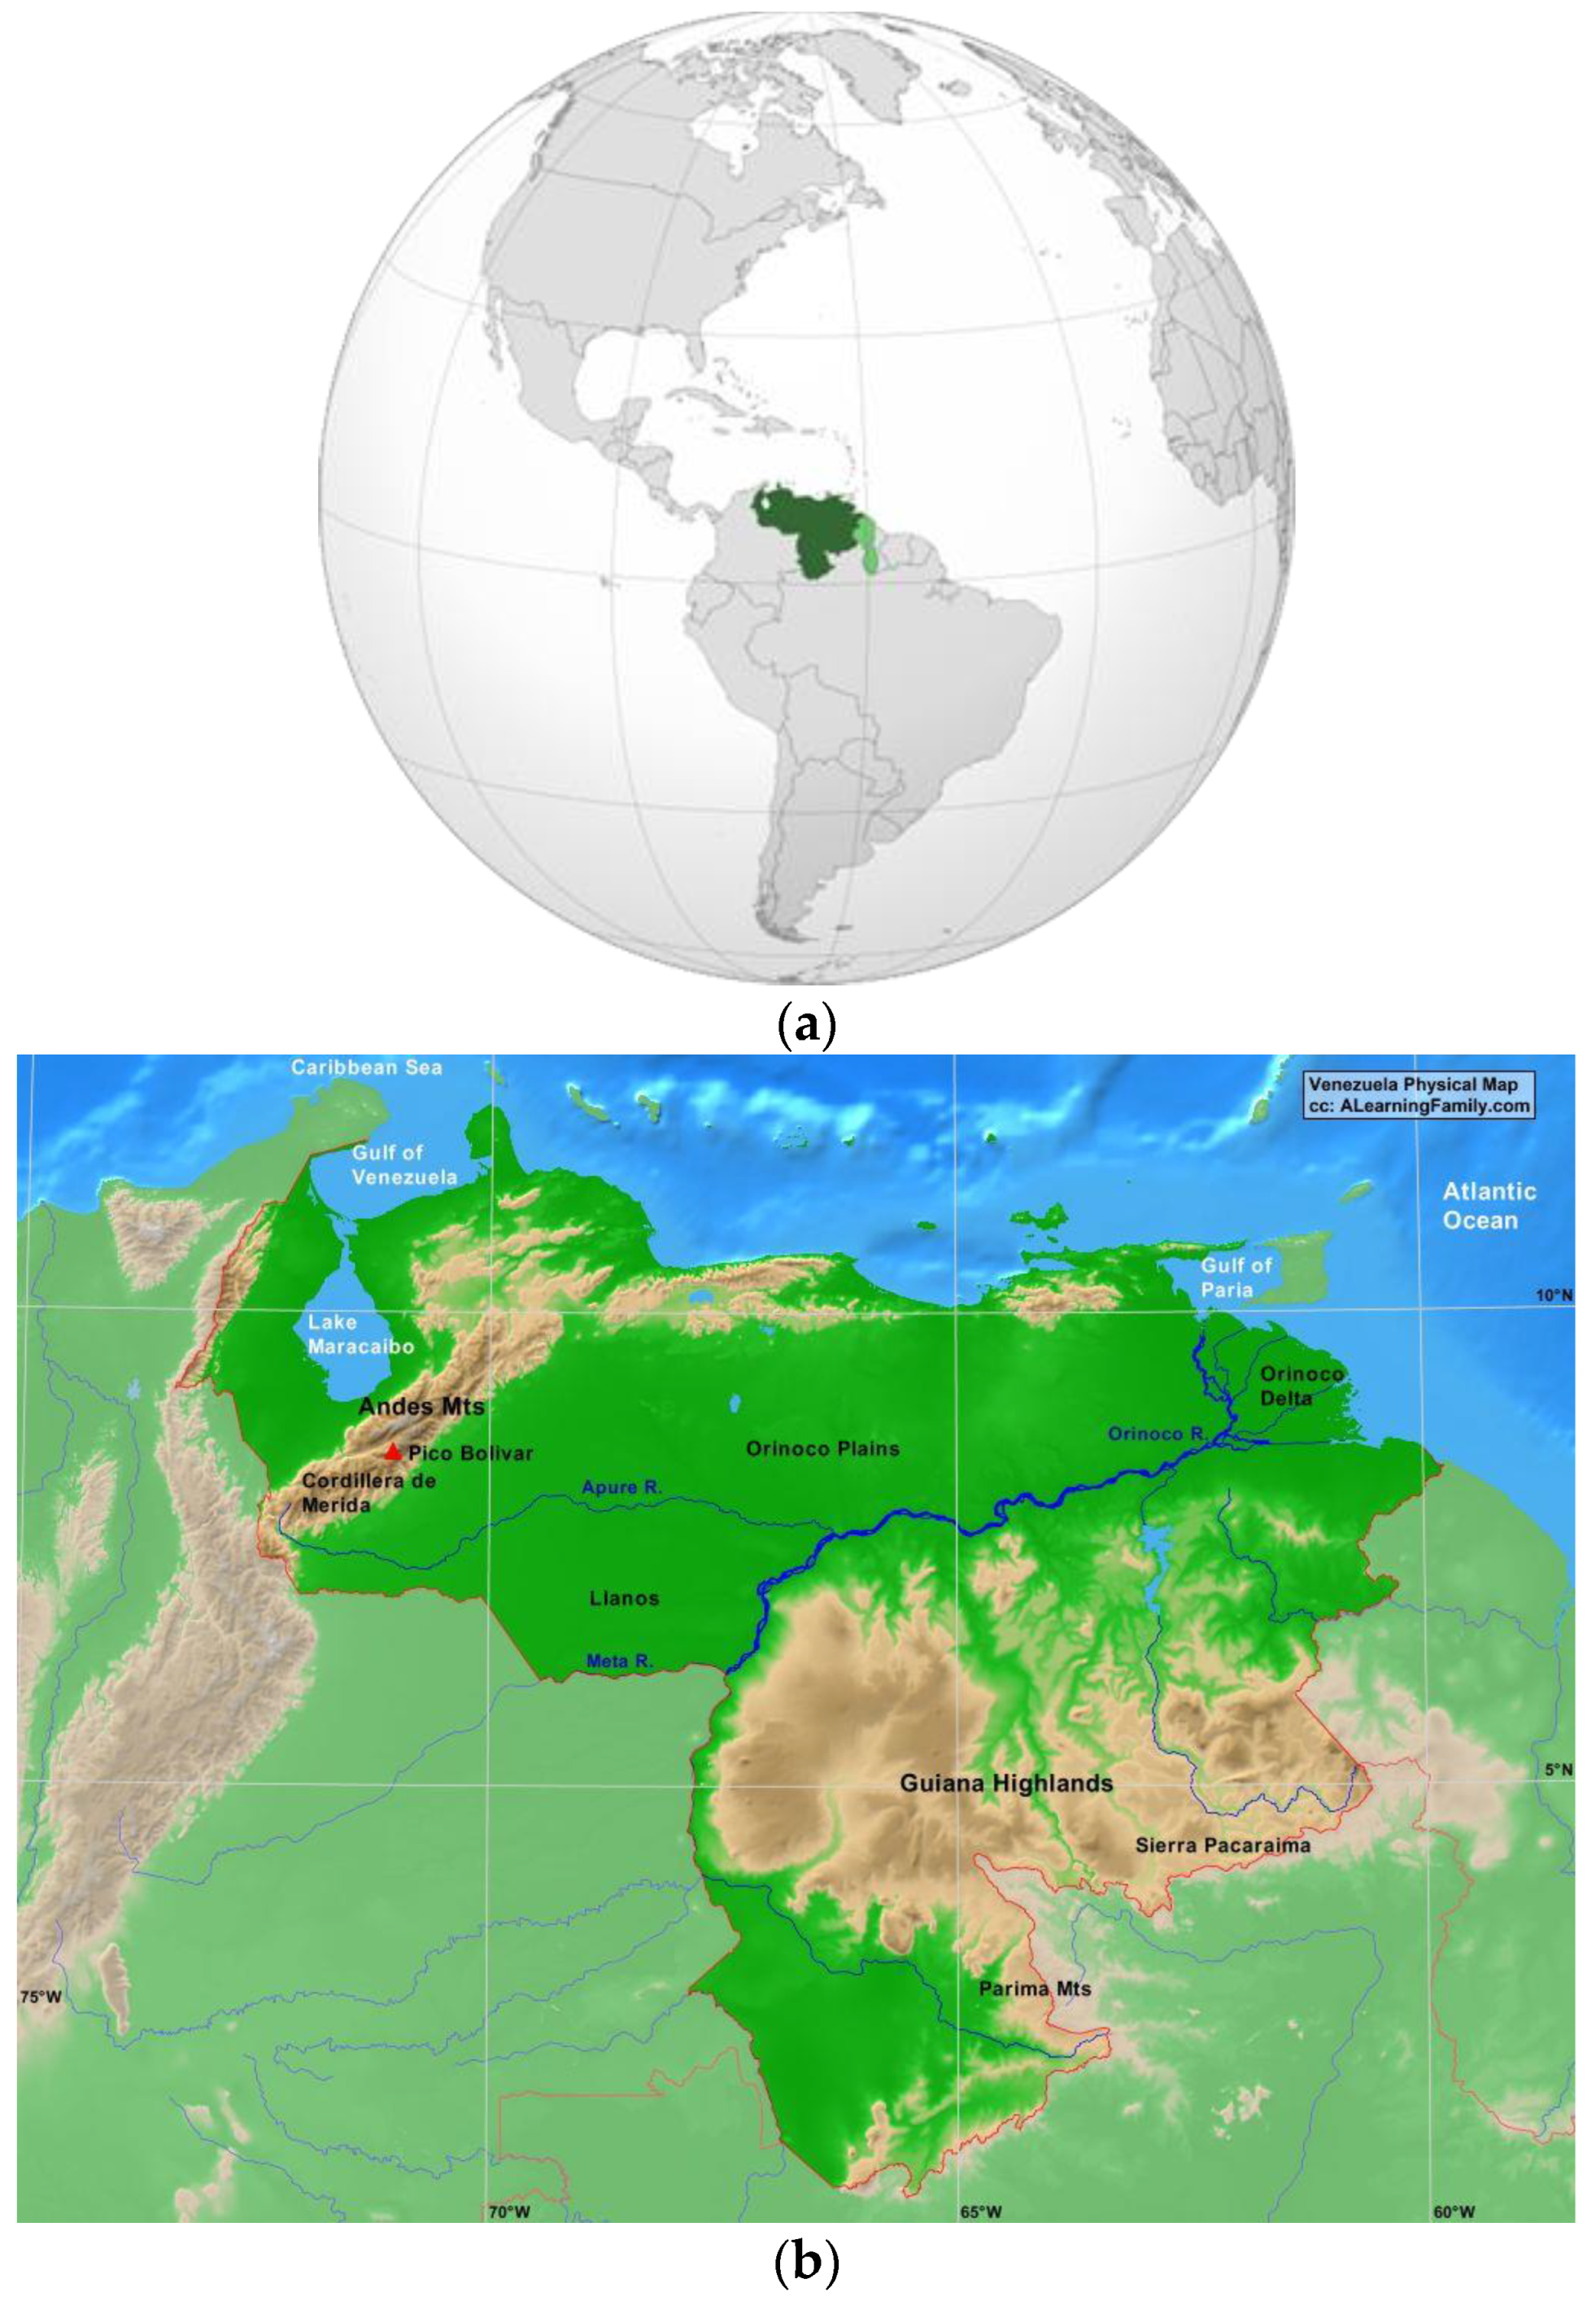
2.1. Study Area
2.2. Climatic Data
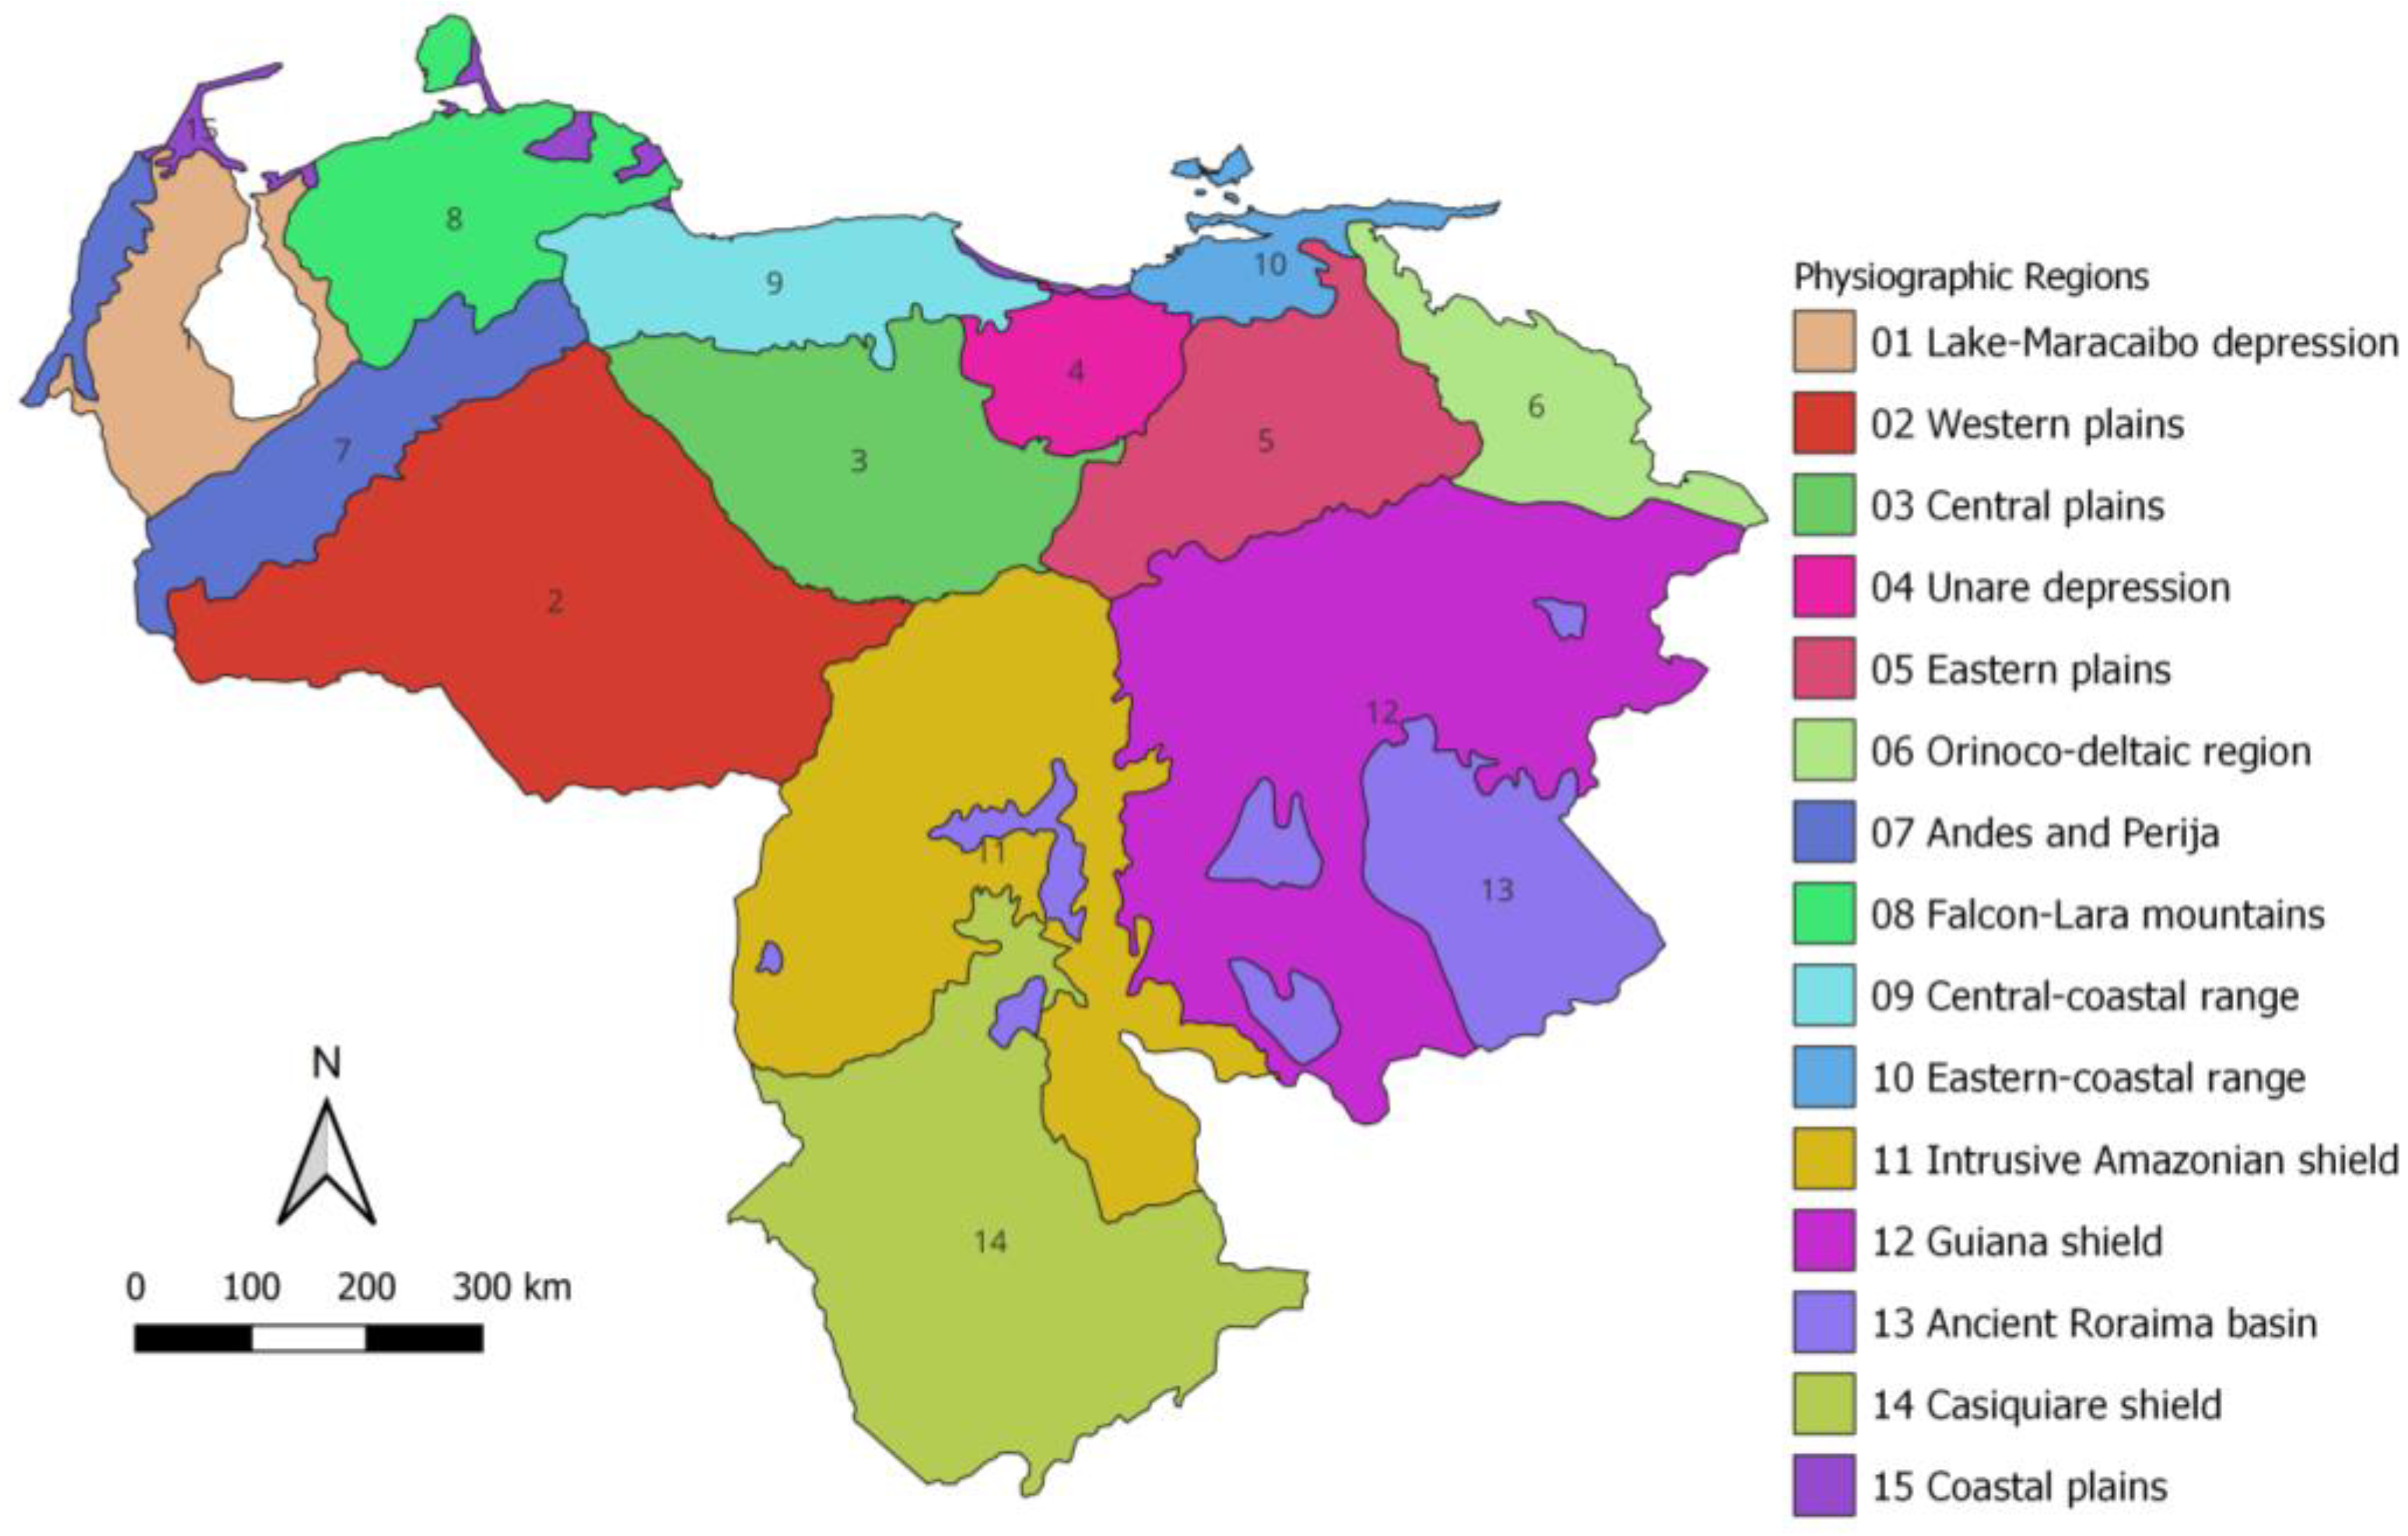
2.3. Regionalization
2.4. Data Analysis
3. Results
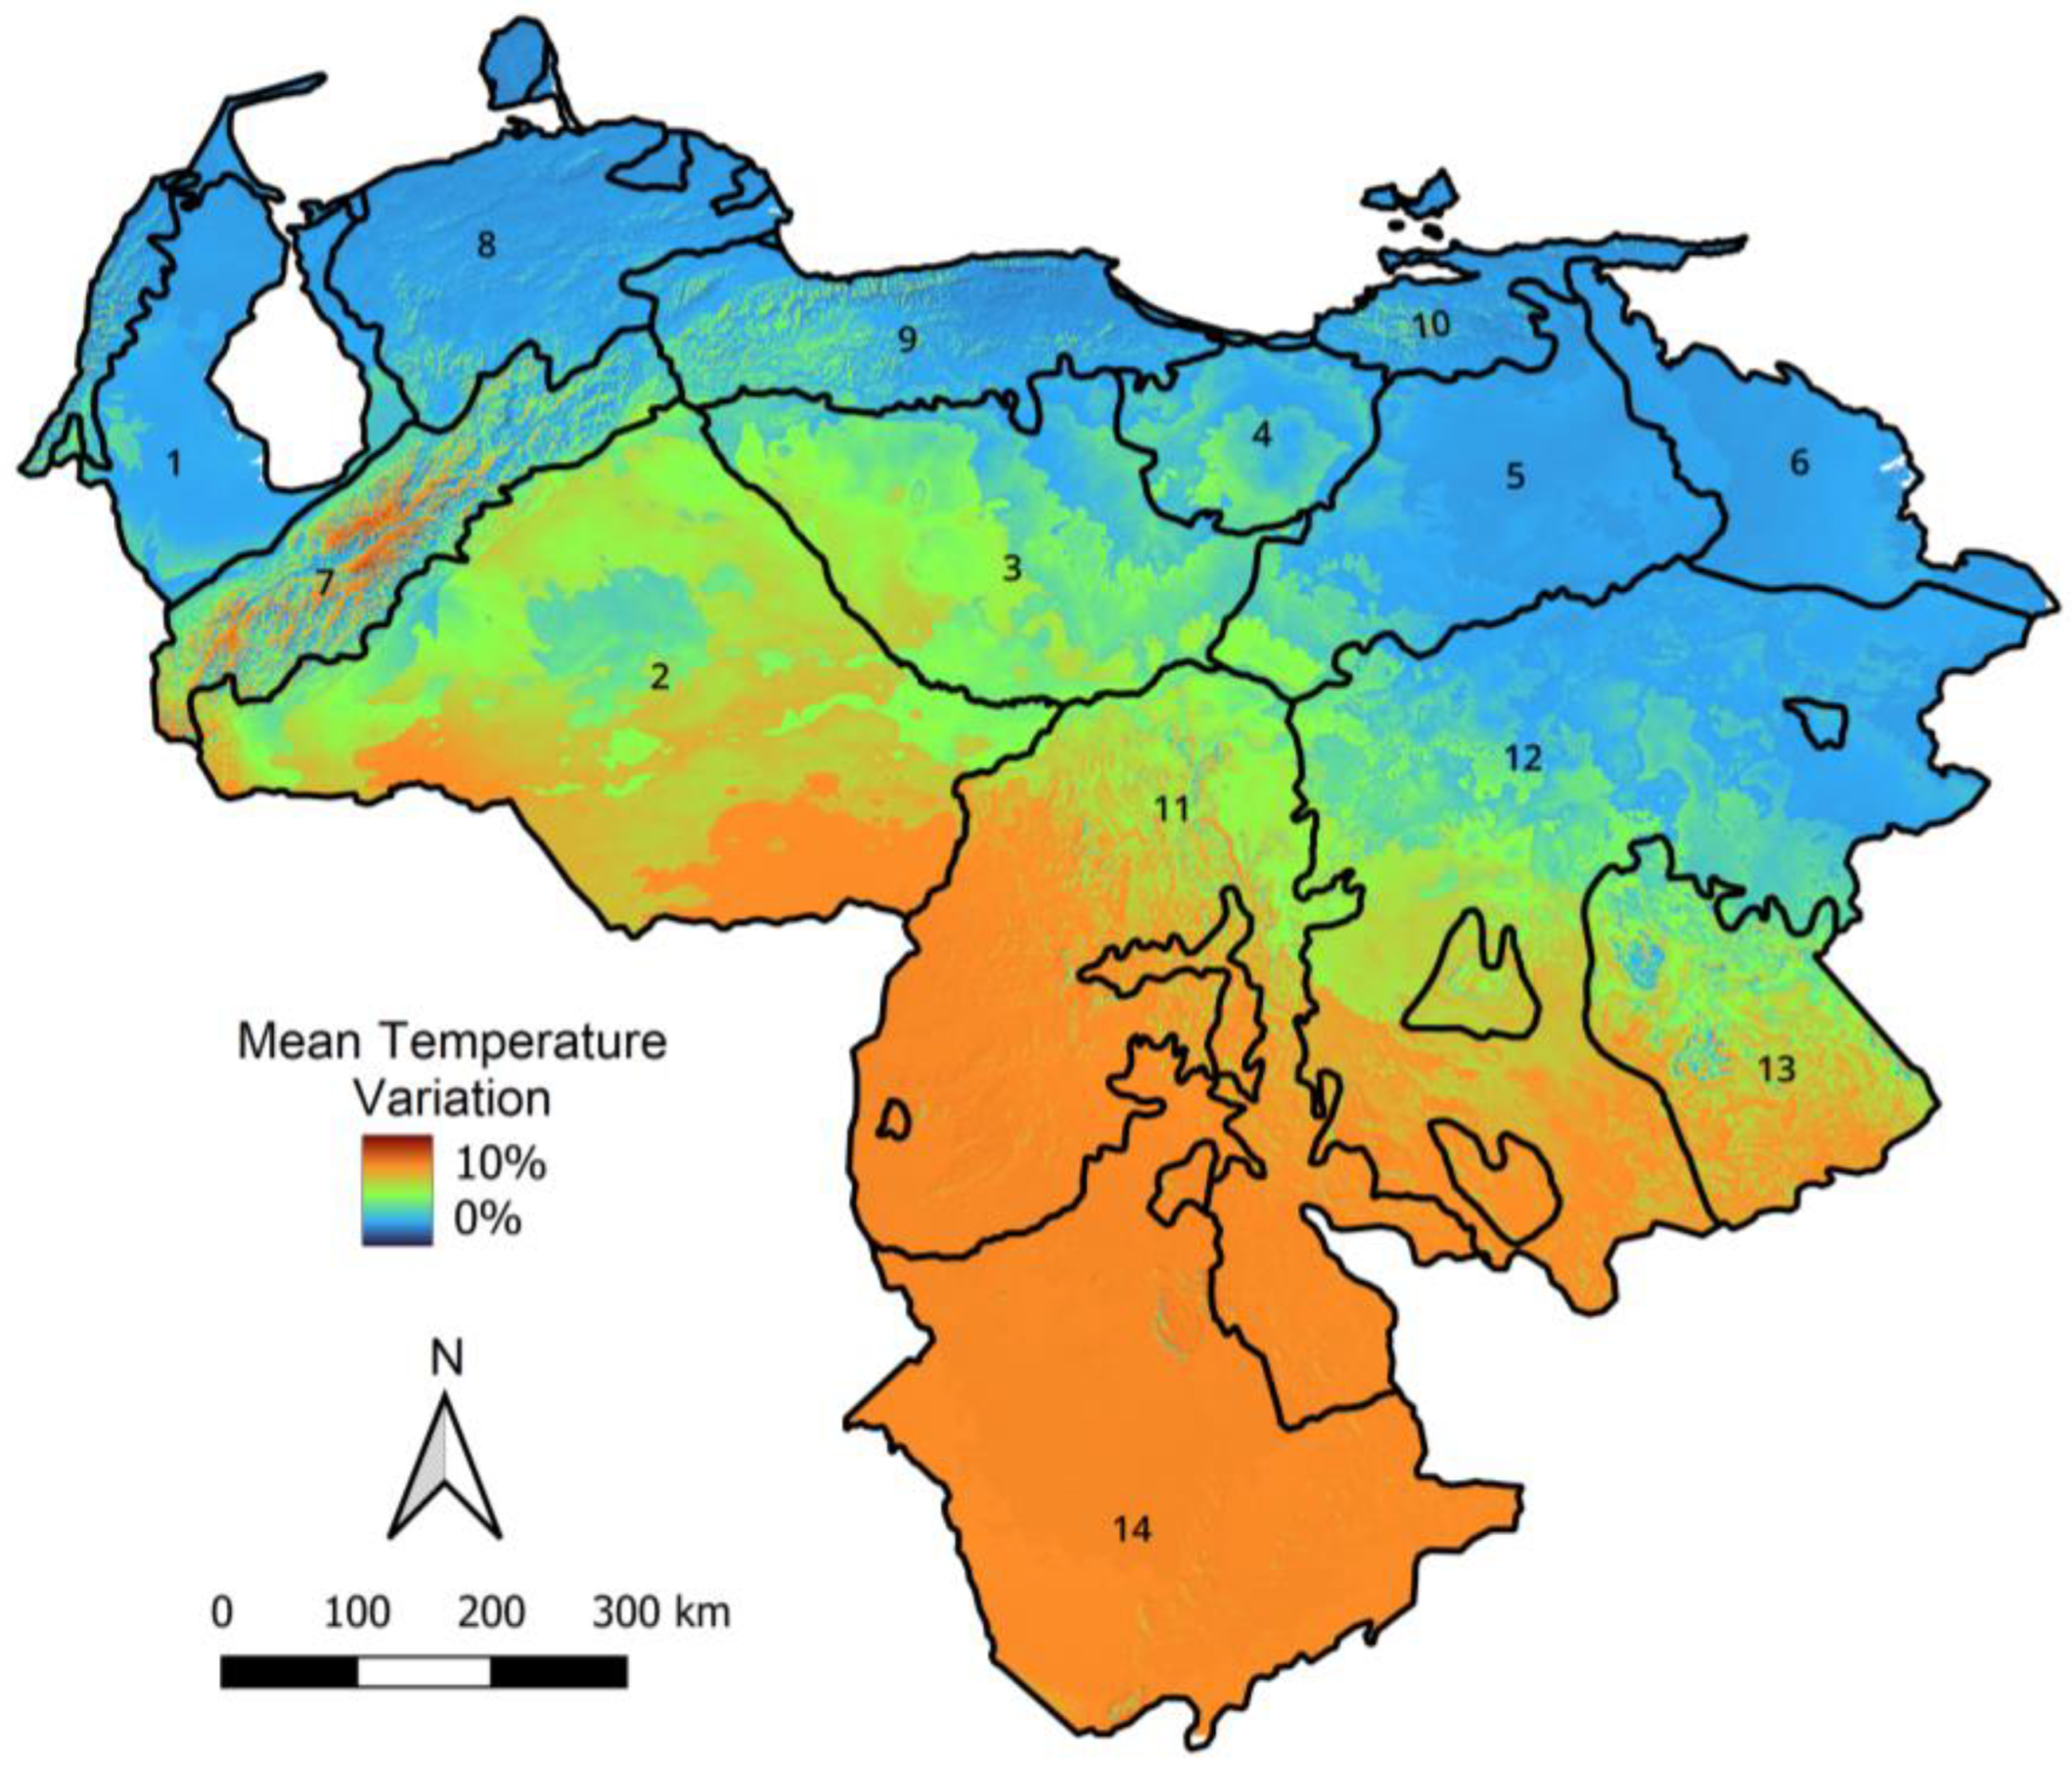
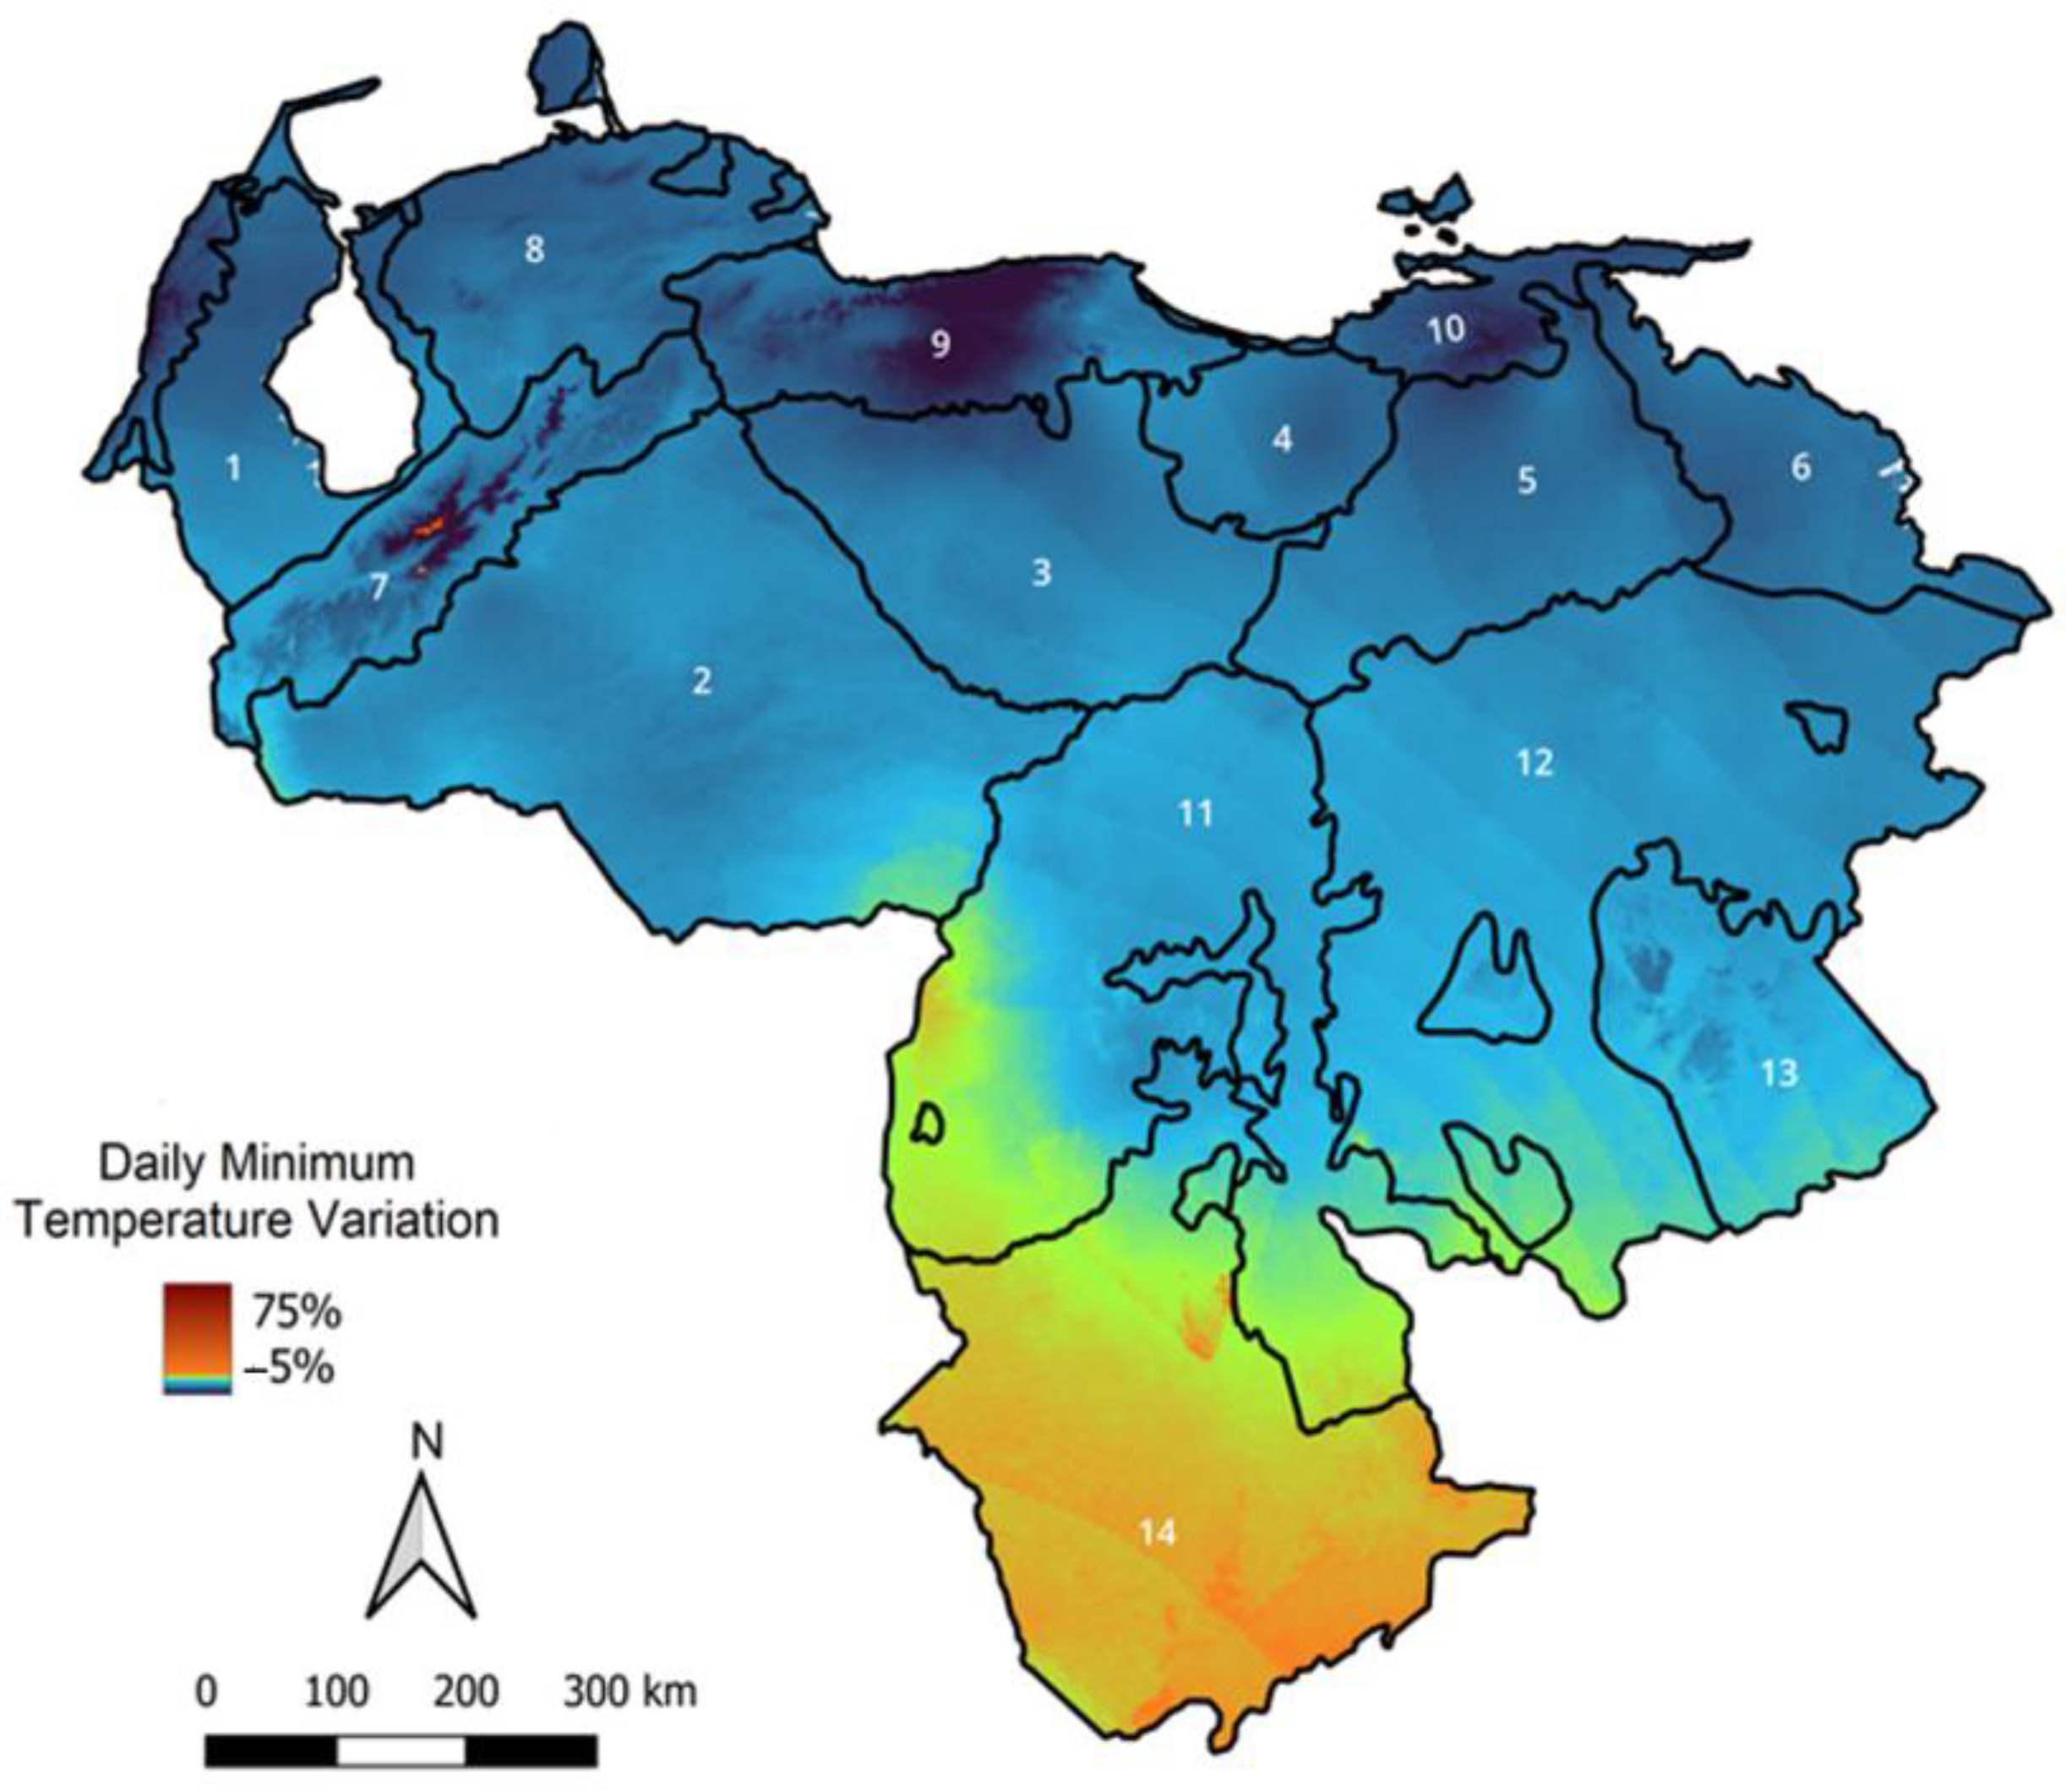
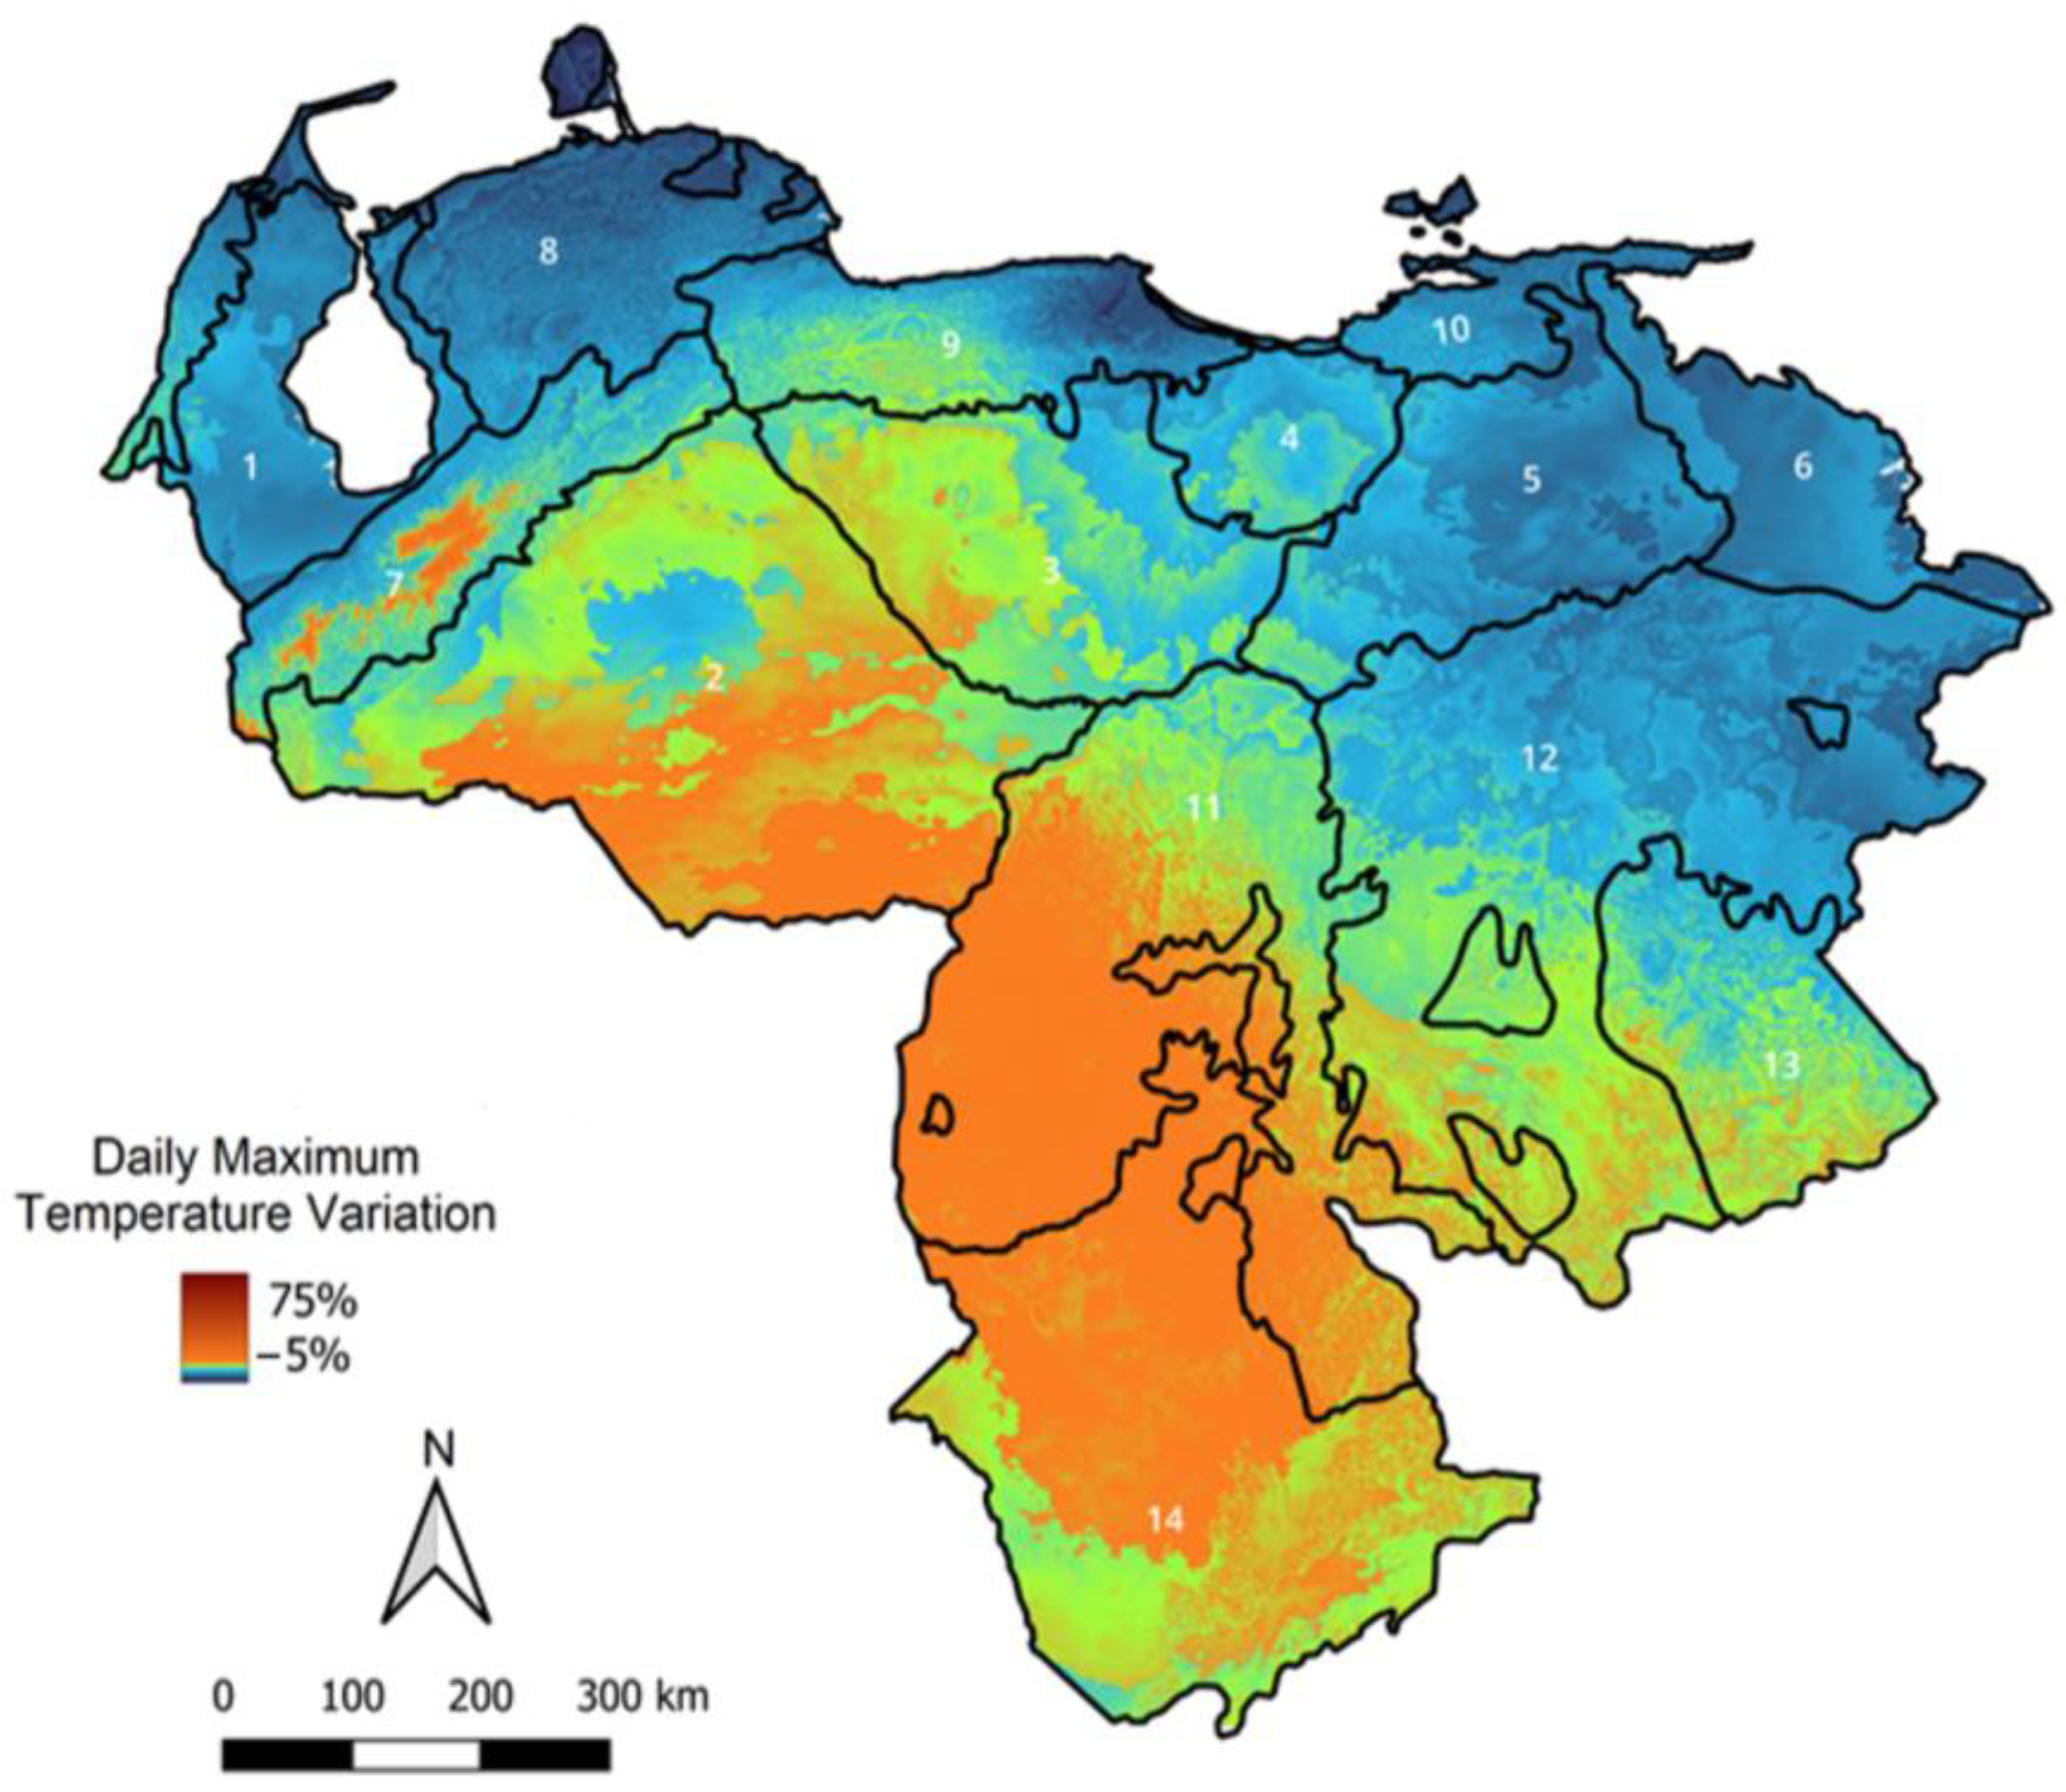
3.1. Temperature
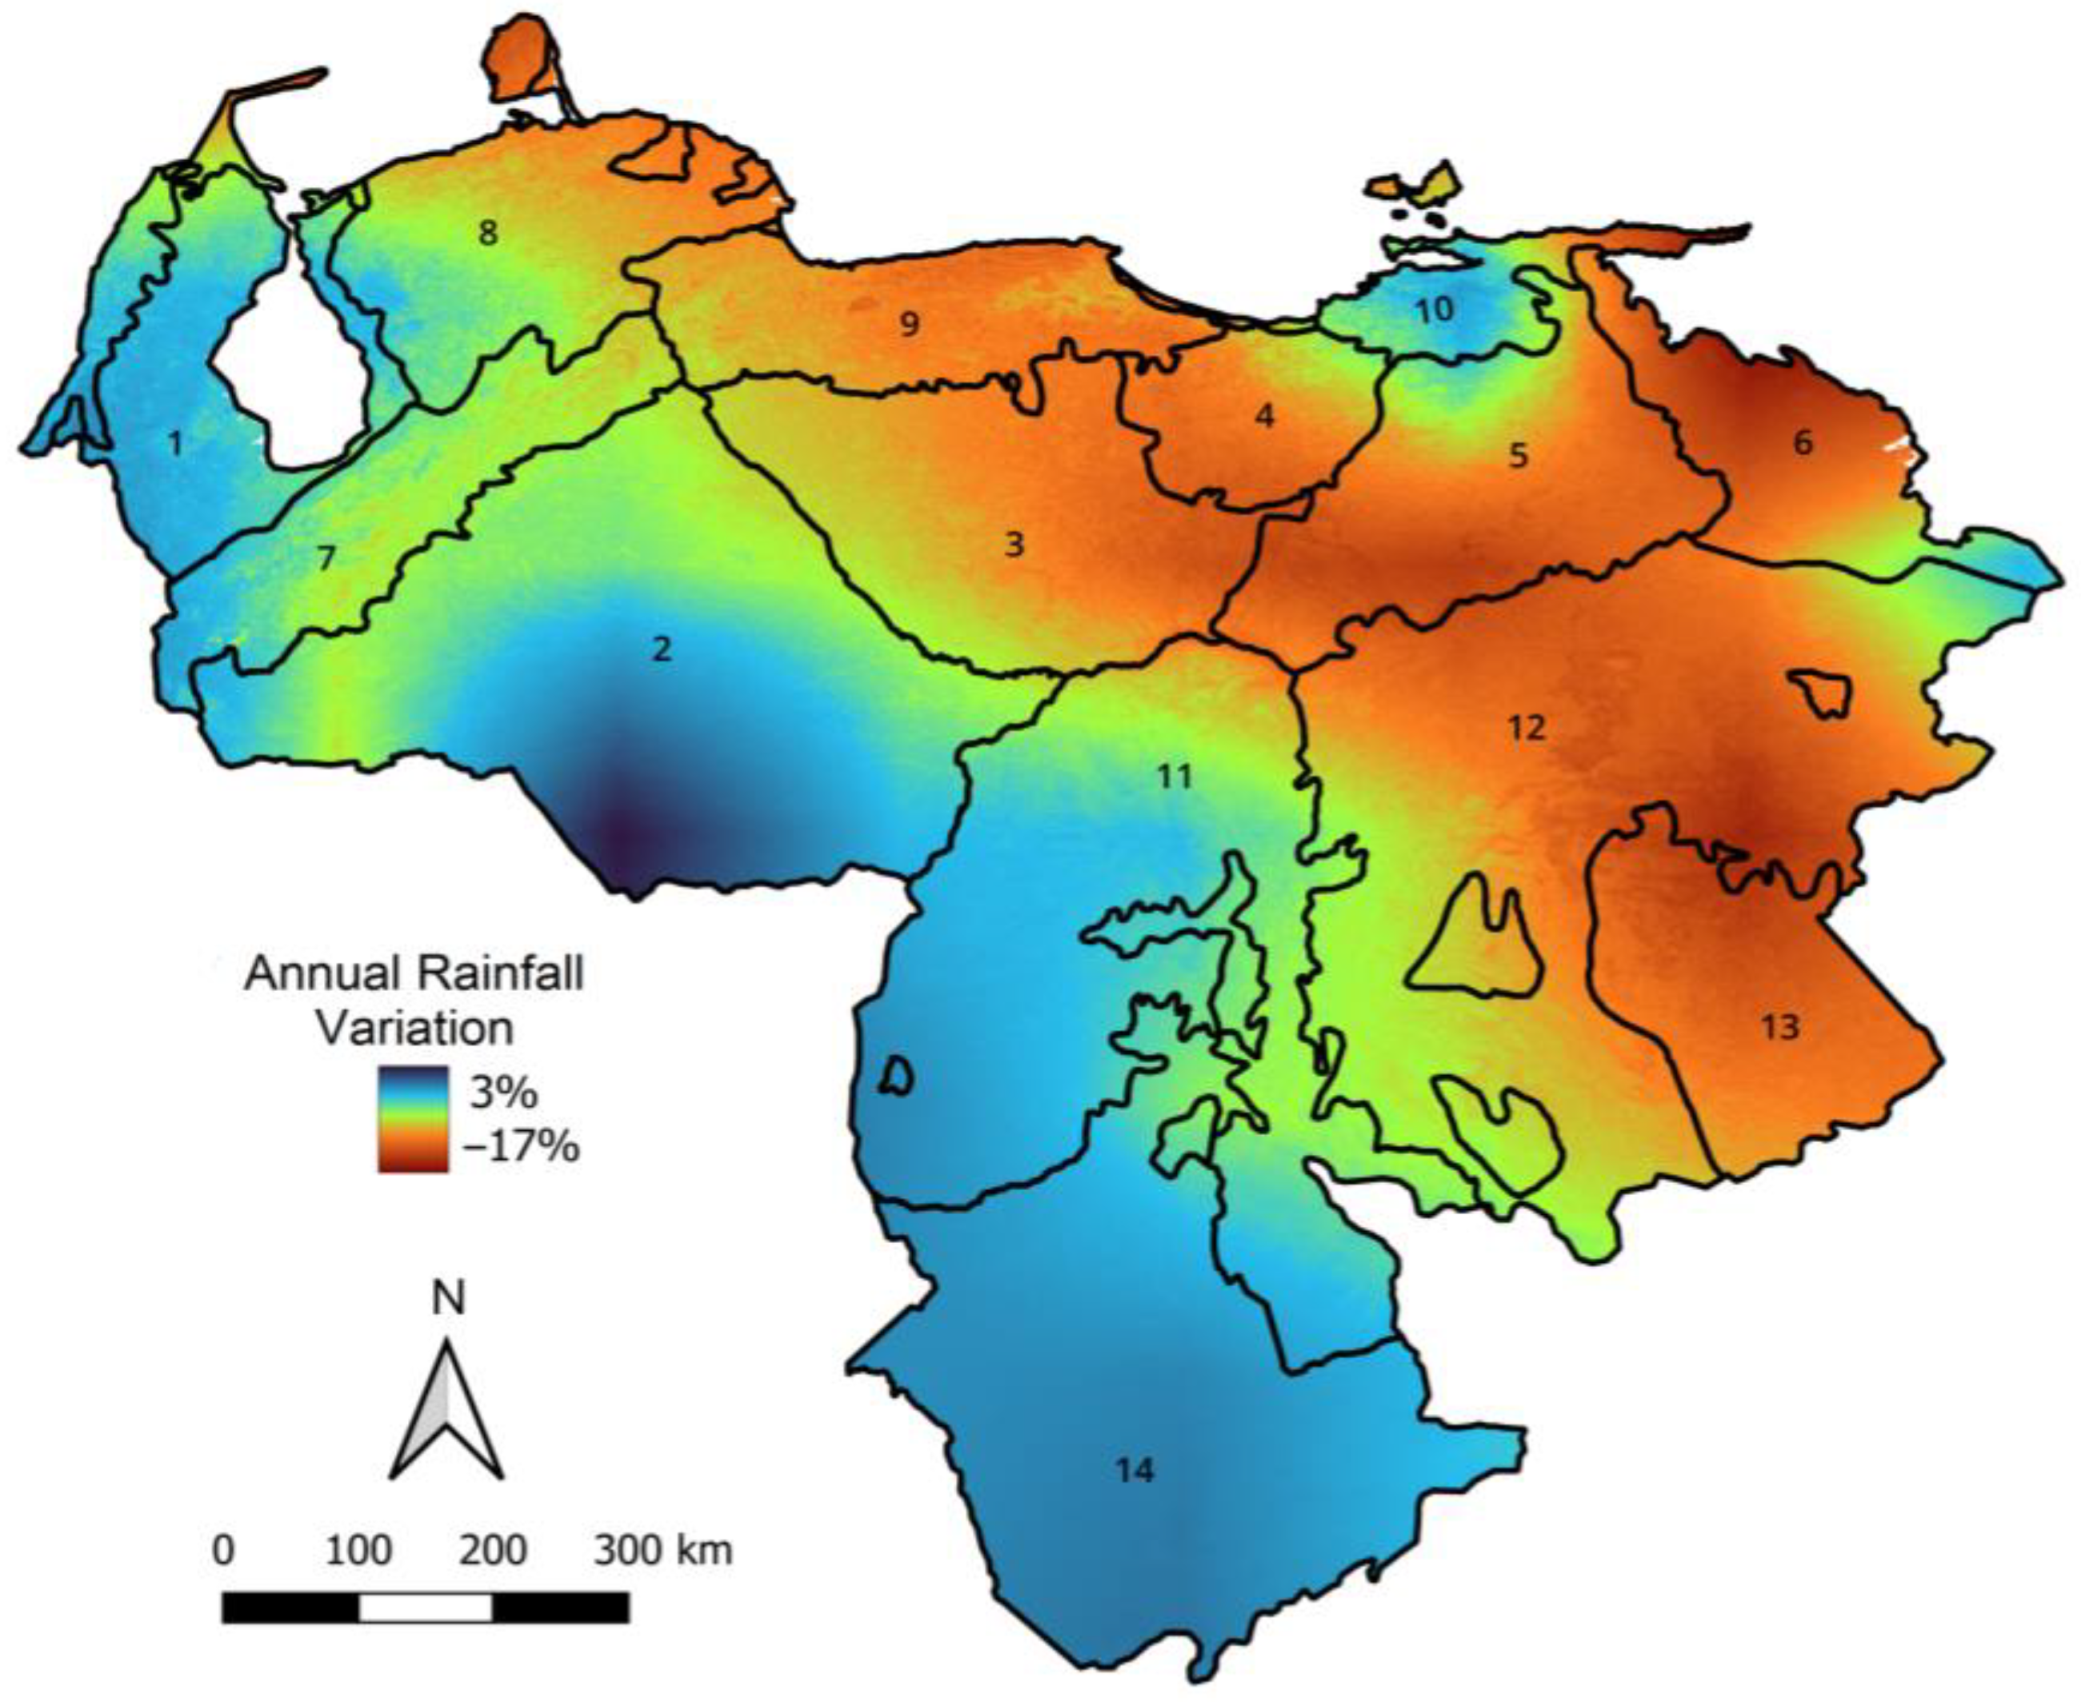
3.2. Precipitation
4. Discussion
5. Conclusions
Author Contributions
Funding
Data Availability Statement
Conflicts of Interest
Appendix A

| Physiographic Regions | Description |
|---|---|
| Lake Maracaibo depression | It is a tectonic subsidence filled by sedimentary rocks and Quaternary sediments with altitudes ranging from 0 to 500 m above sea level (masl). The predominant relief configurations are the Maracaibo plateau and alluvial plains. Precipitation increases from <500 mm/yr in the north to 3550 mm/yr in the southwest. The distribution of the vegetation responds to the precipitation pattern. The variability of climate, relief, parent materials, and age determine a wide diversity of soils. |
| Western plains | These flat and low areas encompass different combinations of fluvial plains and some eolian plains of the Holocene and Upper Pleistocene. The dominant elevation is 100 masl but can vary between 500 and <50 masl. Drainage routes flow south–southeast or eastward. Part of the region is well-drained. Drainage is poor towards the center and southeast of the region, with frequent flooding. Precipitation rises from east to west and from north to south. Vertical and horizontal variability of soils is significant. |
| Central plains | They correspond to undulating erosion plains of low hills with gently sloping convex tops, separated by very open inter-collinear depressions. The difference in elevation between the tops and the bases of the hills ranges between 50 and 80 m. The average altitude of the region is <250 masl. The predominant rocks are sedimentary, aged between the Upper Cenozoic and Pleistocene. Stony, shallow, acidic soils predominate in the hills, while deep, fine, acidic soils predominate in the valleys. In the south, there is an area of sandy dunes alternating with poorly drained depressions. |
| Eastern plains | They have a topography of low mesa, with flat or undulating tops and heights less than 350 masl, formed on horizontal sedimentary layers of the Mesa Formation (Pleistocene). Boxed valleys of variable width and less than 50 m depth are between the mesas. Well-drained sandy soils dominate the mesas with increasing clay content at depth and low moisture retention, as well as being acidic with deficient nutrient and organic matter content. In the valleys, the soils are more fertile and have high spatial variability, with poor drainage in some areas. |
| Unare depression | It resulted from the erosion of Tertiary clayey sedimentary rocks alternating with sandstones. The topography consists of hills, with denudation surfaces and accumulations of sediments from the slopes between the hills. The average altitude is about 150 masl. The soils are predominantly deep, well-drained, clayey, and cracked when dry. |
| Orinoco-deltaic region | It includes the Orinoco Delta and the plain of the San Juan River in the country’s extreme east. The topography is flat and low (<15 masl). Drainage is poor, conditioned by topography, rainfall, the rivers that cross the region, and the Atlantic Ocean and the Caribbean Sea tides. On the surface, there are recent mineral sediments rich in clay, silt, and organic matter, alternating with organic sediments (peat) that are not very decomposed. The predominant vegetation is mangroves, and swamps in the areas are influenced by the tides, while forests and grasslands dominate where fresh water accumulates. The soil is recent and rich in organic matter, and those affected by tides contain iron sulfide (pyrite). |
| Physiographic Regions | Description |
|---|---|
| Andes and Perijá | Its predominant configuration comprises medium and high mountains and deep valleys, with narrow or wide bottoms filled with sediments arranged in terraces. The average altitudes are 2000 to 3000 masl, with maximum altitudes close to 5000 masl. It presents a folded geological structure. The central core consists of metamorphic rocks (gneisses and schists) and granites of the Precambrian and Paleozoic; the flanks are composed of Tertiary rocks. Annual precipitation varies from less than 400 mm to more than 2000 mm, and annual mean temperature varies from ±0° C at the highest peaks to ±24° C at the lowest sites in the region. Due to the variability of the factors described above, there is a great diversity of soils. |
| Falcón-Lara mountains | These are low and medium mountains, with narrow V-shaped or wide intra- and inter-mountain valleys filled with alluvial and colluvial sediments arranged in terraces. The average heights of the mountains vary between 1000 and 1500 masl and the valley bottoms are between 600 and 900 masl. The oldest rocks in the region are metamorphic and belong to the Mesozoic, but those that cover more extension are Cenozoic rocks with folded, fractured structures, and incipient metamorphism. |
| Central-coastal range | They are mountain ranges of medium and low altitudes, separated by intra- and inter-mountain V-shaped valleys with narrow bottoms and valleys with wide bottoms filled with sediments often arranged in terraces. In addition, it contains tectonic depressions filled with sediments, such as the Lake Valencia depression and Barlovento. It extends approximately 300 km east–west and 100 km north–south. The average altitude is between 1000 and 1200 masl and the maximum altitude is higher than 2700 masl. There are Paleozoic rocks in the region, but the most extensive and representative units consist of Mesozoic metamorphic rocks. There is a wide diversity of soil products from variations in climate, vegetation, relief, parent materials, and time of evolution. |
| Eastern-coastal range | It corresponds to the mountainous and hilly reliefs found in the northeastern portion of the country, made up of low- and medium-altitude mountain ranges, intra- and inter-montane V-shaped valleys with narrow bottoms and tectonic depressions filled with sediments. It extends for about 300 km in an east–west direction and approximately 100 km in a north–south direction. The average altitudes range between 1200 and 1400 masl above sea level and the maximum altitudes reach 2500 to 2600 masl. Metamorphic and sedimentary rocks from the Mesozoic are predominant, and, as in the other mountainous areas, there is a wide diversity of soils. |
| Physiographic Regions | Description |
|---|---|
| Intrusive Amazonian shield | Its physiography is variable, including mountains, plateaus, and erosion plains. Acid intrusive rocks of Precambrian age (>2000 million years old), such as granite and granodiorite, are predominant. The dominant vegetation covers are evergreen forests and wooded savannas. Soils are strongly acidic with poor fertility. |
| Guiana shield | It consists of peneplains formed by hills and hillocks, whose predominant rocks are gneisses and granites of the Precambrian age. The vegetation cover varies from wooded savannas and deciduous forests to evergreen forests. Prevalent are strongly weathered soils that are acidic, poorly fertile, and well-drained. |
| Ancient Roraima basin | It comprises various discontinuous highlands, including the “Gran Sabana”, and some elevated plateaus or tepuis of a tabular and practically horizontal structure formed by sedimentary rocks of the Roraima Group. They are remnants of an ancient Precambrian basin. Predominant soils have low humidity retention and scarce nutrient availability. |
| Casiquiare shield | It is south of the 4th parallel. It consists predominantly of plains and peneplains of erosion or alteration derived from Precambrian migmatites, gneisses, and granites. The soils are strongly weathered, acidic, and poorly fertile. |
References
- Márquez, Y.P.; Moreno, E.C. Potential distribution of crops in Mérida State (Venezuela), under climatic change scenarios. Rev. Geográfica Venez. 2021, 62, 428–444. [Google Scholar] [CrossRef]
- Jaimez, R.; Loor, R.; Arteaga, F.; Márquez, V.; Tezara, W. Differential response of photosynthetic activity, leaf nutrient content and yield to long-term drought in cacao clones. Acta Agronómica 2022, 70, 274–284. [Google Scholar] [CrossRef]
- Olivares, B.; Cortez, A.; Parra, R.; Lobo, D.; Rodríguez, M.F.; Rey, J.C. Evaluation of agricultural vulnerability to drought weather in different locations of Venezuela. Rev. Fac. Agron. 2017, 34, 103–129. Available online: https://n9.cl/d827w (accessed on 25 March 2023).
- Olivares, B.; Zingaretti, M.L. Analysis of the meteorological drought in four agricultural locations of Venezuela by the combination of multivariate methods. UNED Res. J. 2018, 10, 181–192. [Google Scholar] [CrossRef]
- Paredes-Trejo, F.; Barbosa-Alves, H.; Moreno-Pizani, M.A.; Farías-Ramírez, A. Influencia de las sequías sobre el régimen hídrico de los ríos en Venezuela. Ríos Riesgo Venez. 2018, 2, 171–184. Available online: https://n9.cl/3xs3d (accessed on 25 March 2023).
- Chacón-Moreno, E.; Rodríguez-Morales, M.; Paredes, D.; Suárez del Moral, P.; Albarrán, A. Impacts of Global Change on the Spatial Dynamics of Treeline in Venezuelan Andes. Front. Ecol. Evol 2021, 9, 615223. [Google Scholar] [CrossRef]
- Silva, M.I.; Mendoza, N. Assessment of meteorological drought in agricultural locations from Venezuela under future projections of climate change. Rev. Fac. Agron. 2021, 38, 548–572. [Google Scholar] [CrossRef]
- Paredes-Trejo, F.; Olivares, B. El desafío de la sequía en Venezuela. In Atlas de Sequía de América Latina y el Caribe; Núñez, C.J., Verbist, K., Eds.; UNESCO: Paris, Francia, 2018; pp. 127–136. Available online: https://n9.cl/h3ay4 (accessed on 25 March 2023).
- Ovalles, F.; Cabrera, E.; Cortéz, A.; Rodríguez, M.F.; Rey, J.C. Formulación de Lineamientos Generales Para un Programa de Adaptación a Los Posibles Impactos de Los Cambios Climáticos Sobre el Sector Agrícola en Venezuela, Considerando Tres Escenarios (2015, 2040 y 2060); Proyecto MARN–PNUD VEN/00/G31. INIA: Maracay, Venezuela, 2005. [Google Scholar]
- Martelo, M.T. Impact of climate change on agriculture in Venezuela. Rev. Fac. Agron. UCV 2012, 71, 66–81. [Google Scholar]
- Medina, E.; Velásquez, G.; Hernández, I. Impact of global warming and atmospherico CO2 enrichment on tropical crops: A perspective for Venezuela. Rev. Fac. Agron. UCV 2016, 42, 25–37. [Google Scholar]
- Olivares, B.; Hernández, R.; Coelho, R.; Molina, J.C.; Pereira, Y. Spatial analysis of the water index: Advances in sustainable decision-making in Carabobo agricultural territories, Venezuela. Rev. Geográfica América Cent. 2018, 60, 277–299. [Google Scholar] [CrossRef]
- Zhang, Y.; Fu, B.; Feng, X.; Pan, N. Response of ecohydrological variables to meteorological drought under climate change. Remote Sens. 2022, 14, 1920. [Google Scholar] [CrossRef]
- IPCC. Climate Change 2022: Impacts, Adaptation, and Vulnerability. Contribution of Working Group II. In Sixth Assessment Report of the Intergovernmental Panel on Climate Change; Pörtner, H.-O., Roberts, D.C., Tignor, M., Poloczanska, E., Mintenbeck, K., Alegría, A., Craig, M., Langsdorf, S., Löschke, S., Möller, V., et al., Eds.; Cambridge University Press: Cambridge, UK, 2022; in press. [Google Scholar]
- Guenni, L.; Degryze, E.; Alvarado, K. Análisis de la tendencia y la estacionalidad de la precipitación mensual en Venezuela. CoJS 2008, 31, 41–65. [Google Scholar]
- Vila, D.A.; de Goncalves, L.; Toll, D.L.; Rozante, J.R. Statistical evaluation of combined daily gauge observations and rainfall satellite estimates over continental South America. J. Hydrometeorol. 2009, 10, 533–543. [Google Scholar] [CrossRef]
- Olivares, B.; Parra, R.; Cortez, A. Characterization of precipitation patterns in Anzoátegui state, Venezuela. Ería 2017, 3, 353–365. [Google Scholar] [CrossRef]
- Fick, S.E.; Hijmans, R.J. Worldclim 2: New 1-km spatial resolution climate surfaces for global land areas. Int. J. Clim. 2017, 37, 4302–4315. [Google Scholar] [CrossRef]
- Dutta, R. Climate change and its impact on tea in Northeast India. J. Water Clim. Chang. 2014, 5, 625–632. [Google Scholar] [CrossRef]
- Bunn, C.; Läderach, P.; Pérez Jimenez, J.G.; Montagnon, C.; Schilling, T. Multiclass Classification of Agro-Ecological Zones for Arabica Coffee: An Improved Understanding of the Impacts of Climate Change. PLoS ONE 2015, 10, e0140490. [Google Scholar] [CrossRef]
- Läderach, P.; Ramirez–Villegas, J.; Navarro-Racines, C.; Zelaya, C.; Martinez–Valle, A.; Jarvis, A. Climate change adaptation of coffee production in space and time. Clim. Chang. 2017, 141, 47–62. [Google Scholar] [CrossRef]
- Babalik, A.A.; Sarikaya, O.; Orucu, O.K. The Current and future compliance areas of Kermes Oak (Quercus coccifera L.) under climate change in Turkey. Fresenius Environ. Bull. 2021, 30, 406–413. Available online: https://hdl.handle.net/20.500.12885/1407 (accessed on 17 February 2023).
- Sondermann, M.; Chou, S.C.; Lyra, A.; Latinovic, D.; Siqueira, G.C.; Junior, W.C.; Giornes, E.; Leite, F.P. Climate change projections and impacts on the eucalyptus plantation around the Doce River basin, in Minas Gerais, Brazil. Clim. Serv. 2022, 28, 100327. [Google Scholar] [CrossRef]
- Daly, C. Guidelines for assessing the suitability of spatial climate data sets. Int. J. Climatol. 2006, 26, 707–721. [Google Scholar] [CrossRef]
- Zheng, P.; Fang, P.; Liu, P.; Xu, W.; Wang, G.; Wang, L. Dominate Tree Species Classification on Large-Scale Mountainous Areas Using Voting Strategy-Based Ensemble Learning Method. In Proceedings of the 8th China High Resolution Earth Observation Conference (CHREOC 2022); Springer: Singapore, 2023; pp. 102–115. [Google Scholar]
- Karger, D.N.; Wilson, A.M.; Mahony, C.; Zimmermann, N.E.; Jetz, W. Global daily 1 km land surface precipitation based on cloud cover-informed downscaling. Sci. Data 2021, 8, 307. [Google Scholar] [CrossRef]
- Fernández, G.; Milla, D. Validez de los datos de precipitación media mensual (1970–2000) generados por el modelo WorldClim V2. 0 para Venezuela. Terra. Nueva Etapa 2018, 34. Available online: https://n9.cl/axbqn (accessed on 17 February 2023).
- Paredes, F.J.; Alves Barbosa, H.; Peñaloza-Murillo, M.A.; Moreno, M.A.; Farias, A. Intercomparison of improved satellite rainfall estimation with CHIRPS gridded product and rain gauge data over Venezuela. Atmósfera 2016, 29, 323–342. [Google Scholar] [CrossRef]
- Olivares, B.; Hernández, R. Regional analysis of homogeneous precipitation zones in Carabobo, Venezuela. Rev. Lasallista Investig 2019, 16, 90–105. [Google Scholar] [CrossRef]
- Olivares, B. Tropical conditions of seasonal rain in the dry-land agriculture of Carabobo, Venezuela. La Granja Rev. Cienc. Vida 2018, 27, 86–102. [Google Scholar] [CrossRef]
- Cortez, A.; Rodríguez, M.F.; Rey, J.C.; Ovalles, F.; González, W.; Parra, R.; Olivares, B.; Marquina, J. Temporary space variability of precipitation in Guarico state, Venezuela. Rev. Fac. Agron. 2016, 33, 292–310. Available online: https://n9.cl/pmdck (accessed on 17 February 2023).
- Veettil, B.K.; Wang, S.; de Souza, S.F.; Bremer, U.F.; Simoes, J.C. Glacier monitoring and glacier-climate interactions in the tropical Andes: A review. J. S. Am. Earth Sci. 2017, 77, 218–246. [Google Scholar] [CrossRef]
- WorldClim Historical Climate Data. Available online: https://www.worldclim.org/data/worldclim21.html (accessed on 22 September 2022).
- WorldClim Future Climate, 30 Seconds Spatial Resolution. Available online: https://www.worldclim.org/data/cmip6/cmip6_clim30s.html (accessed on 23 September 2022).
- WorldClim Downscaling Future and Past Climate Data from GCMs. Available online: https://www.worldclim.org/data/downscaling.html (accessed on 15 March 2023).
- Gutjahr, O.; Putrasahan, D.; Lohmann, K.; Jungclaus, J.H.; von Storch, J.-S.; Brüggemann, N.; Haak, H.; Stössel, A. Max Planck Institute Earth System Model (MPI-ESM1.2) for the High-Resolution Model Intercomparison Project (HighResMIP). Geosci. Model Dev. 2019, 12, 3241–3281. [Google Scholar] [CrossRef]
- Gómez, J.A.; Pérez, G.J.M. Evaluación de los modelos climáticos del IPCC AR5 para Venezuela. In Primer Reporte Académico de Cambio Climático de Venezuela (PRACC); Academia de Ciencias Físicas, Matemáticas y Naturales de Venezuela, Villamizar, A., Buroz Castillo, E., Lairet Centeno, R., Gómez, J.A., Eds.; Ediciones ACFIMAN–CITECI: Caracas, Venezuela, 2018. [Google Scholar]
- Tim, N.; Bravo de Guenni, L. Oceanic influence on the precipitation in Venezuela under current and future climate. Clim. Dyn. 2016, 47, 211–234. [Google Scholar] [CrossRef]
- Silva, O.; Universidad Central de Venezuela, Aragua, Venezuela. Personal Communication, 2022.
- O’Neill, B.C.; Tebaldi, C.; van Vuuren, D.P.; Eyring, V.; Friedlingstein, P.; Hurtt, G.; Knutti, R.; Kriegler, E.; Lamarque, J.F.; Lowe, J.; et al. The Scenario Model Intercomparison Project (ScenarioMIP) for CMIP6. Geosci. Model Dev. 2016, 9, 3461–3482. [Google Scholar] [CrossRef]
- Elizalde, G.; Viloria, J.A.; Rosales, A. Geografía de Suelos de Venezuela. In Geo Venezuela, Tomo 2: Medio Físico y Recursos Ambientales; Fundación Empresas Polar: Caracas, Venezuela, 2007; pp. 402–537. [Google Scholar]
- QGIS.org. QGIS Geographic Information System. QGIS Association. Available online: http://www.qgis.org (accessed on 17 February 2023).
- R Core Team. R: A Language and Environment for Statistical Computing; R Foundation for Statistical Computing: Vienna, Austria; Available online: https://www.R-project.org/ (accessed on 17 February 2023).
- Kruskal, W.H.; Wallis, W.A. Use of ranks in one-criterion variance analysis. J. Am. Stat. Assoc. 1952, 47, 583–621. [Google Scholar] [CrossRef]
- Nemenyi, P. Distribution-Free Multiple Comparisons. Ph.D. Thesis, Princeton University, Princeton, NJ, USA, 1963. [Google Scholar]
- Liu, Y.; Chen, W. A SAS macro for testing differences among three or more independent groups using Kruskal-Wallis and Nemenyi tests. J. Huazhong Univ. Sci. Technol. Med. Sci. J. 2012, 32, 130–134. [Google Scholar] [CrossRef]
- Beyrer, C.; Page, K. Preventable losses: Infant mortality increases in Venezuela. Lancet Glob. Health 2019, 7, e286–e287. [Google Scholar] [CrossRef]
- Page, K.R.; Doocy, S.; Ganteaume, F.R.; Castro, J.S.; Spiegel, P.; Beyrer, C. Venezuela’s public health crisis: A regional emergency. Lancet 2019, 393, 1254–1260. [Google Scholar] [CrossRef]
- Bonacic, C.; Arévalo, C.; Ibarra, J.T.; Laker, J. The Importance of Protected Areas in Mitigating Climate Change and Conserving Ecosystems in Latin America and the Caribbean. In The Food Security, Biodiversity, and Climate Nexus; Springer: Cham, Switzerland, 2022; pp. 35–53. [Google Scholar]
- Teixeira, A.; Da Silva, D.A.; Gonçalves, J.G.R.; Esteves, J.A.F.; Carbonell, S.A.M.; Chiorato, A.F. Root characterization of bean genotypes (Phaseolus vulgaris) under drought stress. Genet. Mol. Res. 2019, 18, GMR18086. [Google Scholar] [CrossRef]
- Ruiz, C.J.A.; Medina, G.; González, I.J.; Flores, H.E.; Ramírez, G.; Ortiz, C.; Byerly, K.F.; Martínez, R.A. Requerimientos agroecológicos de cultivos. In Libro Técnico Núm. 3, 2nd ed.; INIFAP. Instituto Nacional de Investigaciones Forestales Agrícolas y Pecuarias-CIRPAC-Campo Experimental Centro Altos de Jalisco: Tepatitlán de Morelos, México, 2013; 564p. [Google Scholar]
- Cortez, A.; Olivares, B.; Parra, R.; Lobo, D.; Rodríguez, M.F.; Rey, J.C. Event description of meteorological drought in locations central mountains, Venezuela. Cienc. Ing. Appl. 2018, I, 22–44. [Google Scholar]
- Cortez, A.; Olivares, B.; Parra, M.; Lobo, D.; Rey, J.C.; Rodriguez, M.F. Systematization of the calculation of the Standardized Precipitation Index as a methodology to generate meteorological drought information. Rev. Fac. Agron. 2019, 36, 209–223. Available online: https://n9.cl/4spjp (accessed on 17 February 2023).
- Olivares, B.; Zingaretti, M.L. Application of multivariate methods for the characterization of periods of meteorological drought in Venezuela. Luna Azul 2019, 48, 172–192. [Google Scholar] [CrossRef]
- Marchi, M.; Sinjur, I.; Bozzano, M.; Westergren, M. Evaluating WorldClim Version 1 (1961–1990) as the Baseline for Sustainable Use of Forest and Environmental Resources in a Changing Climate. Sustainability 2019, 11, 3043. [Google Scholar] [CrossRef]
- Bautista, S.A. sustainable scenario for Venezuelan power generation sector in 2050 and its costs. Energ. Policy 2012, 44, 331–340. [Google Scholar] [CrossRef]
- Moreno-Pizani, M.A. Water management in agricultural production, the economy, and Venezuelan society. Front. Sustain. Food Syst. 2021, 4, 624066. [Google Scholar] [CrossRef]
- Tapia, M.S.; Puche, M.; Pieters, A.; Marrero, J.F.; Clavijo, S.; Gutiérrez, S.; Machado-Allison, C.; Raffalli, S.; Herrera, M.; de Jiménez, M.L.; et al. Seguridad alimentaria y nutricional en Venezuela. Secuestro Agroalimentario de un País: Visión y Compromiso. In Retos y oportunidades de la seguridad alimentaria en las Américas. El punto de vista de las Academias de Ciencias; Clegg, M., Bianchi, E., McNeil, J., Estrella, L.H., Vammen, K., Eds.; La Red Interamericana de Academias de Ciencias (IANAS); Red Mundial de Academias de Ciencias (IAP); El Ministerio Federal de Educación e Investigación Bundesministerium für Bildung und Forschung (BMBF); Academia Nacional de Ciencias de Alemania: Leopoldina, México, 2017; Available online: http://www.ianas.org (accessed on 30 September 2020).
- Olivares, B.; Hernández, R.; Arias, A.; Molina, J.C.; Pereira, Y. Agroclimatic zoning of corn crop for sustainable agricultural production in Carabobo, Venezuela. Rev. Univ. Geog. 2018, 27, 139–159. Available online: https://n9.cl/l2m83 (accessed on 17 February 2023).
- Santana, P.A., Jr.; Kumar, L.; Da Silva, R.S.; Pereira, J.L.; Picanço, M.C. Assessing the impact of climate change on the worldwide distribution of Dalbulus maidis (DeLong) using MaxEnt. Pest Manag. Sci. 2019, 75, 2706–2715. [Google Scholar] [CrossRef]
- Paredes-Trejo, F.J.; Barbosa-Alves, H.; Moreno-Pizani, M.A.; Farías-Ramírez, A. Cambio climático: Altera el régimen de precipitaciones y caudales en Venezuela? In Ríos en Riesgo de Venezuela Vol. 3; Rodríguez-Olarte, D., Ed.; Universidad Centroccidental Lisandro Alvarado: Barquisimeto, Venezuela, 2020; pp. 37–147. [Google Scholar]
- Trejo, F.J.P.; Barbosa, H.A.; Ruiz, I.Q.; Peñaloza-Murillo, M.A. Meso scale oceanic atmospheric circulation patterns linked with severe and extensive droughts in Venezuela. Rev. Bras. Meteorol 2016, 31, 468–489. [Google Scholar] [CrossRef]
- Olivares, B.; Hernández, R. Application of multivariate techniques in the agricultural land’s aptitude in Carabobo, Venezuela. Trop. Subtrop. Agroecosyst. 2020, 23, 1–12. Available online: https://n9.cl/zeedh (accessed on 17 February 2023).
- Paredes, F.; Millano, J.L.; Guevara, E. Spatial analysis of meteorological droughts in the Los Llanos region of Venezuela during the period 1961–1996. Rev. Climatol. 2008, 8, 15–27. [Google Scholar]
- Paredes, F.; La Cruz, F.; Guevara, E. Regional frequency analysis of meteorological droughts in the largest cereals producing region of Venezuela. Bioagro 2014, 26, 21–28. [Google Scholar]


| Physiographic Regions | Number of Pixels | 1970–2000 | 2041–2060 | Variation (°C) | Variation (%) | ||
|---|---|---|---|---|---|---|---|
| °C | °C | Mean | stdv | Mean | stdv | ||
| 1 Lake-Maracaibo depression | 38,110 | 28.0 | 28.5 | 0.5 | 0.26 | 1.7 | 1.0 |
| 2 Western plains | 148,880 | 27.2 | 28.9 | 1.6 | 0.38 | 6.0 | 1.3 |
| 3 Central plains | 74,328 | 27.0 | 28.2 | 1.2 | 0.29 | 4.4 | 1.0 |
| 4 Unare depression | 24,143 | 26.4 | 27.2 | 0.8 | 0.21 | 3.0 | 0.8 |
| 5 Eastern plains | 63,172 | 26.7 | 27.2 | 0.5 | 0.35 | 1.9 | 1.2 |
| 6 Orinoco-deltaic region | 36,131 | 26.4 | 26.7 | 0.3 | 0.18 | 1.0 | 0.7 |
| 7 Andes and Perija | 50,289 | 20.3 | 21.0 | 0.7 | 0.31 | 3.4 | 3.9 |
| 8 Falcón-Lara mountains | 50,913 | 25.2 | 25.4 | 0.1 | 0.31 | 0.5 | 1.4 |
| 9 Central-coastal range | 43,244 | 24.0 | 24.5 | 0.4 | 0.38 | 1.7 | 2.0 |
| 10 Eastern-coastal range | 15,880 | 23.7 | 24.1 | 0.1 | 0.23 | 0.5 | 1.6 |
| 11 Intrusive Amazonian shield | 137,974 | 25.7 | 27.7 | 2.0 | 0.45 | 7.9 | 2.0 |
| 12 Guiana shield | 170,477 | 25.8 | 26.8 | 1.1 | 0.53 | 4.1 | 2.2 |
| 13 Ancient Roraima basin | 69,978 | 23.4 | 24.8 | 1.4 | 0.39 | 6.0 | 1.8 |
| 14 Casiquiare shield | 131,622 | 26.2 | 28.5 | 2.4 | 0.24 | 9.2 | 1.0 |
| Mean | 25.4 | 26.4 | 0.9 | 3.7 | |||
| Physiographic Regions | MR | MR + CD | Label |
|---|---|---|---|
| 1 Lake-Maracaibo depression | 2.41 | 4.03 | a |
| 2 Western plains | 2.55 | 4.17 | a |
| 3 Central plains | 3.17 | 4.79 | ab |
| 4 Unare depression | 4.68 | 6.3 | b |
| 5 Eastern plains | 4.77 | 6.39 | b |
| 6 Orinoco-deltaic region | 6.31 | 7.93 | bc |
| 7 Andes and Perija | 7.32 | 8.94 | c |
| 8 Falcón-Lara mountains | 7.32 | 8.94 | c |
| 9 Central-coastal range | 8.33 | 9.95 | cd |
| 10 Eastern-coastal range | 9.43 | 11.05 | d |
| 11 Intrusive Amazonian shield | 10.74 | 12.36 | de |
| 12 Guiana shield | 11.57 | 13.19 | e |
| 13 Ancient Roraima basin | 12.74 | 14.36 | ef |
| 14 Casiquiare shield | 13.55 | 15.17 | f |
| Physiographic Regions | Number of Pixels | 1970–2000 | 2041–2060 | Variation mm | Variation % | ||
|---|---|---|---|---|---|---|---|
| mm | mm | Mean | stdv | Mean | stdv | ||
| 1 Lake-Maracaibo depression | 38,612 | 1429 | 1398 | −31 | 18.1 | −3 | 1.6 |
| 2 Western plains | 148,959 | 1790 | 1758 | −32 | 77.5 | −2 | 4.1 |
| 3 Central plains | 74,328 | 1278 | 1157 | −121 | 23.3 | −10 | 1.8 |
| 4 Unare depression | 24,143 | 1070 | 961 | −109 | 42.5 | −10 | 1.9 |
| 5 Eastern plains | 63,172 | 1174 | 1045 | −129 | 54.3 | −11 | 2.7 |
| 6 Orinoco-deltaic region | 36,652 | 1705 | 1511 | −194 | 70.5 | −12 | 3.6 |
| 7 Andes and Perija | 50,554 | 1357 | 1294 | −63 | 27.4 | −5 | 2.1 |
| 8 Falcón-Lara mountains | 51,209 | 845 | 784 | −61 | 19.1 | −7 | 2.4 |
| 9 Central-coastal range | 43,665 | 1137 | 1027 | −110 | 20.7 | −10 | 1.1 |
| 10 Eastern-coastal range | 17,439 | 1141 | 1078 | −63 | 76.6 | −5 | 3.8 |
| 11 Intrusive Amazonian shield | 140,028 | 2435 | 2359 | −76 | 67.2 | −3 | 2.5 |
| 12 Guiana shield | 172,857 | 2021 | 1828 | −193 | 76.5 | −10 | 2.8 |
| 13 Ancient Roraima basin | 70,482 | 2307 | 2076 | −231 | 100.1 | −10 | 3.2 |
| 14 Casiquiare shield | 134,848 | 2956 | 2970 | 14 | 61.5 | 0 | 2.0 |
| Mean | 1618 | 1518 | −100 | −3 | |||
| Physiographic Regions | MR | MR + CD | Label |
|---|---|---|---|
| 1 Lake-Maracaibo depression | 2.93 | 4.55 | a |
| 2 Western plains | 3.21 | 4.83 | a |
| 3 Central plains | 3.49 | 5.11 | a |
| 4 Unare depression | 5.43 | 7.05 | b |
| 5 Eastern plains | 5.77 | 7.39 | b |
| 6 Orinoco-deltaic region | 6.14 | 7.76 | b |
| 7 Andes and Perija | 6.56 | 8.18 | b |
| 8 Falcón-Lara mountains | 8.63 | 10.25 | c |
| 9 Central-coastal range | 8.71 | 10.33 | c |
| 10 Eastern-coastal range | 9.54 | 11.16 | cd |
| 11 Intrusive Amazonian shield | 9.76 | 11.38 | cd |
| 12 Guiana shield | 10.7 | 12.32 | de |
| 13 Ancient Roraima basin | 11.87 | 13.49 | ef |
| 14 Casiquiare shield | 12.46 | 14.08 | f |
Disclaimer/Publisher’s Note: The statements, opinions and data contained in all publications are solely those of the individual author(s) and contributor(s) and not of MDPI and/or the editor(s). MDPI and/or the editor(s) disclaim responsibility for any injury to people or property resulting from any ideas, methods, instructions or products referred to in the content. |
© 2023 by the authors. Licensee MDPI, Basel, Switzerland. This article is an open access article distributed under the terms and conditions of the Creative Commons Attribution (CC BY) license (https://creativecommons.org/licenses/by/4.0/).
Share and Cite
Viloria, J.A.; Olivares, B.O.; García, P.; Paredes-Trejo, F.; Rosales, A. Mapping Projected Variations of Temperature and Precipitation Due to Climate Change in Venezuela. Hydrology 2023, 10, 96. https://doi.org/10.3390/hydrology10040096
Viloria JA, Olivares BO, García P, Paredes-Trejo F, Rosales A. Mapping Projected Variations of Temperature and Precipitation Due to Climate Change in Venezuela. Hydrology. 2023; 10(4):96. https://doi.org/10.3390/hydrology10040096
Chicago/Turabian StyleViloria, Jesús A., Barlin O. Olivares, Pedro García, Franklin Paredes-Trejo, and Aníbal Rosales. 2023. "Mapping Projected Variations of Temperature and Precipitation Due to Climate Change in Venezuela" Hydrology 10, no. 4: 96. https://doi.org/10.3390/hydrology10040096