


Soil–Water–Atmosphere Effects on Soil Crack Characteristics under Field Conditions in a Semiarid Climate
 , ,
, ,
Abstract
:1. Introduction
2. Materials and Methods
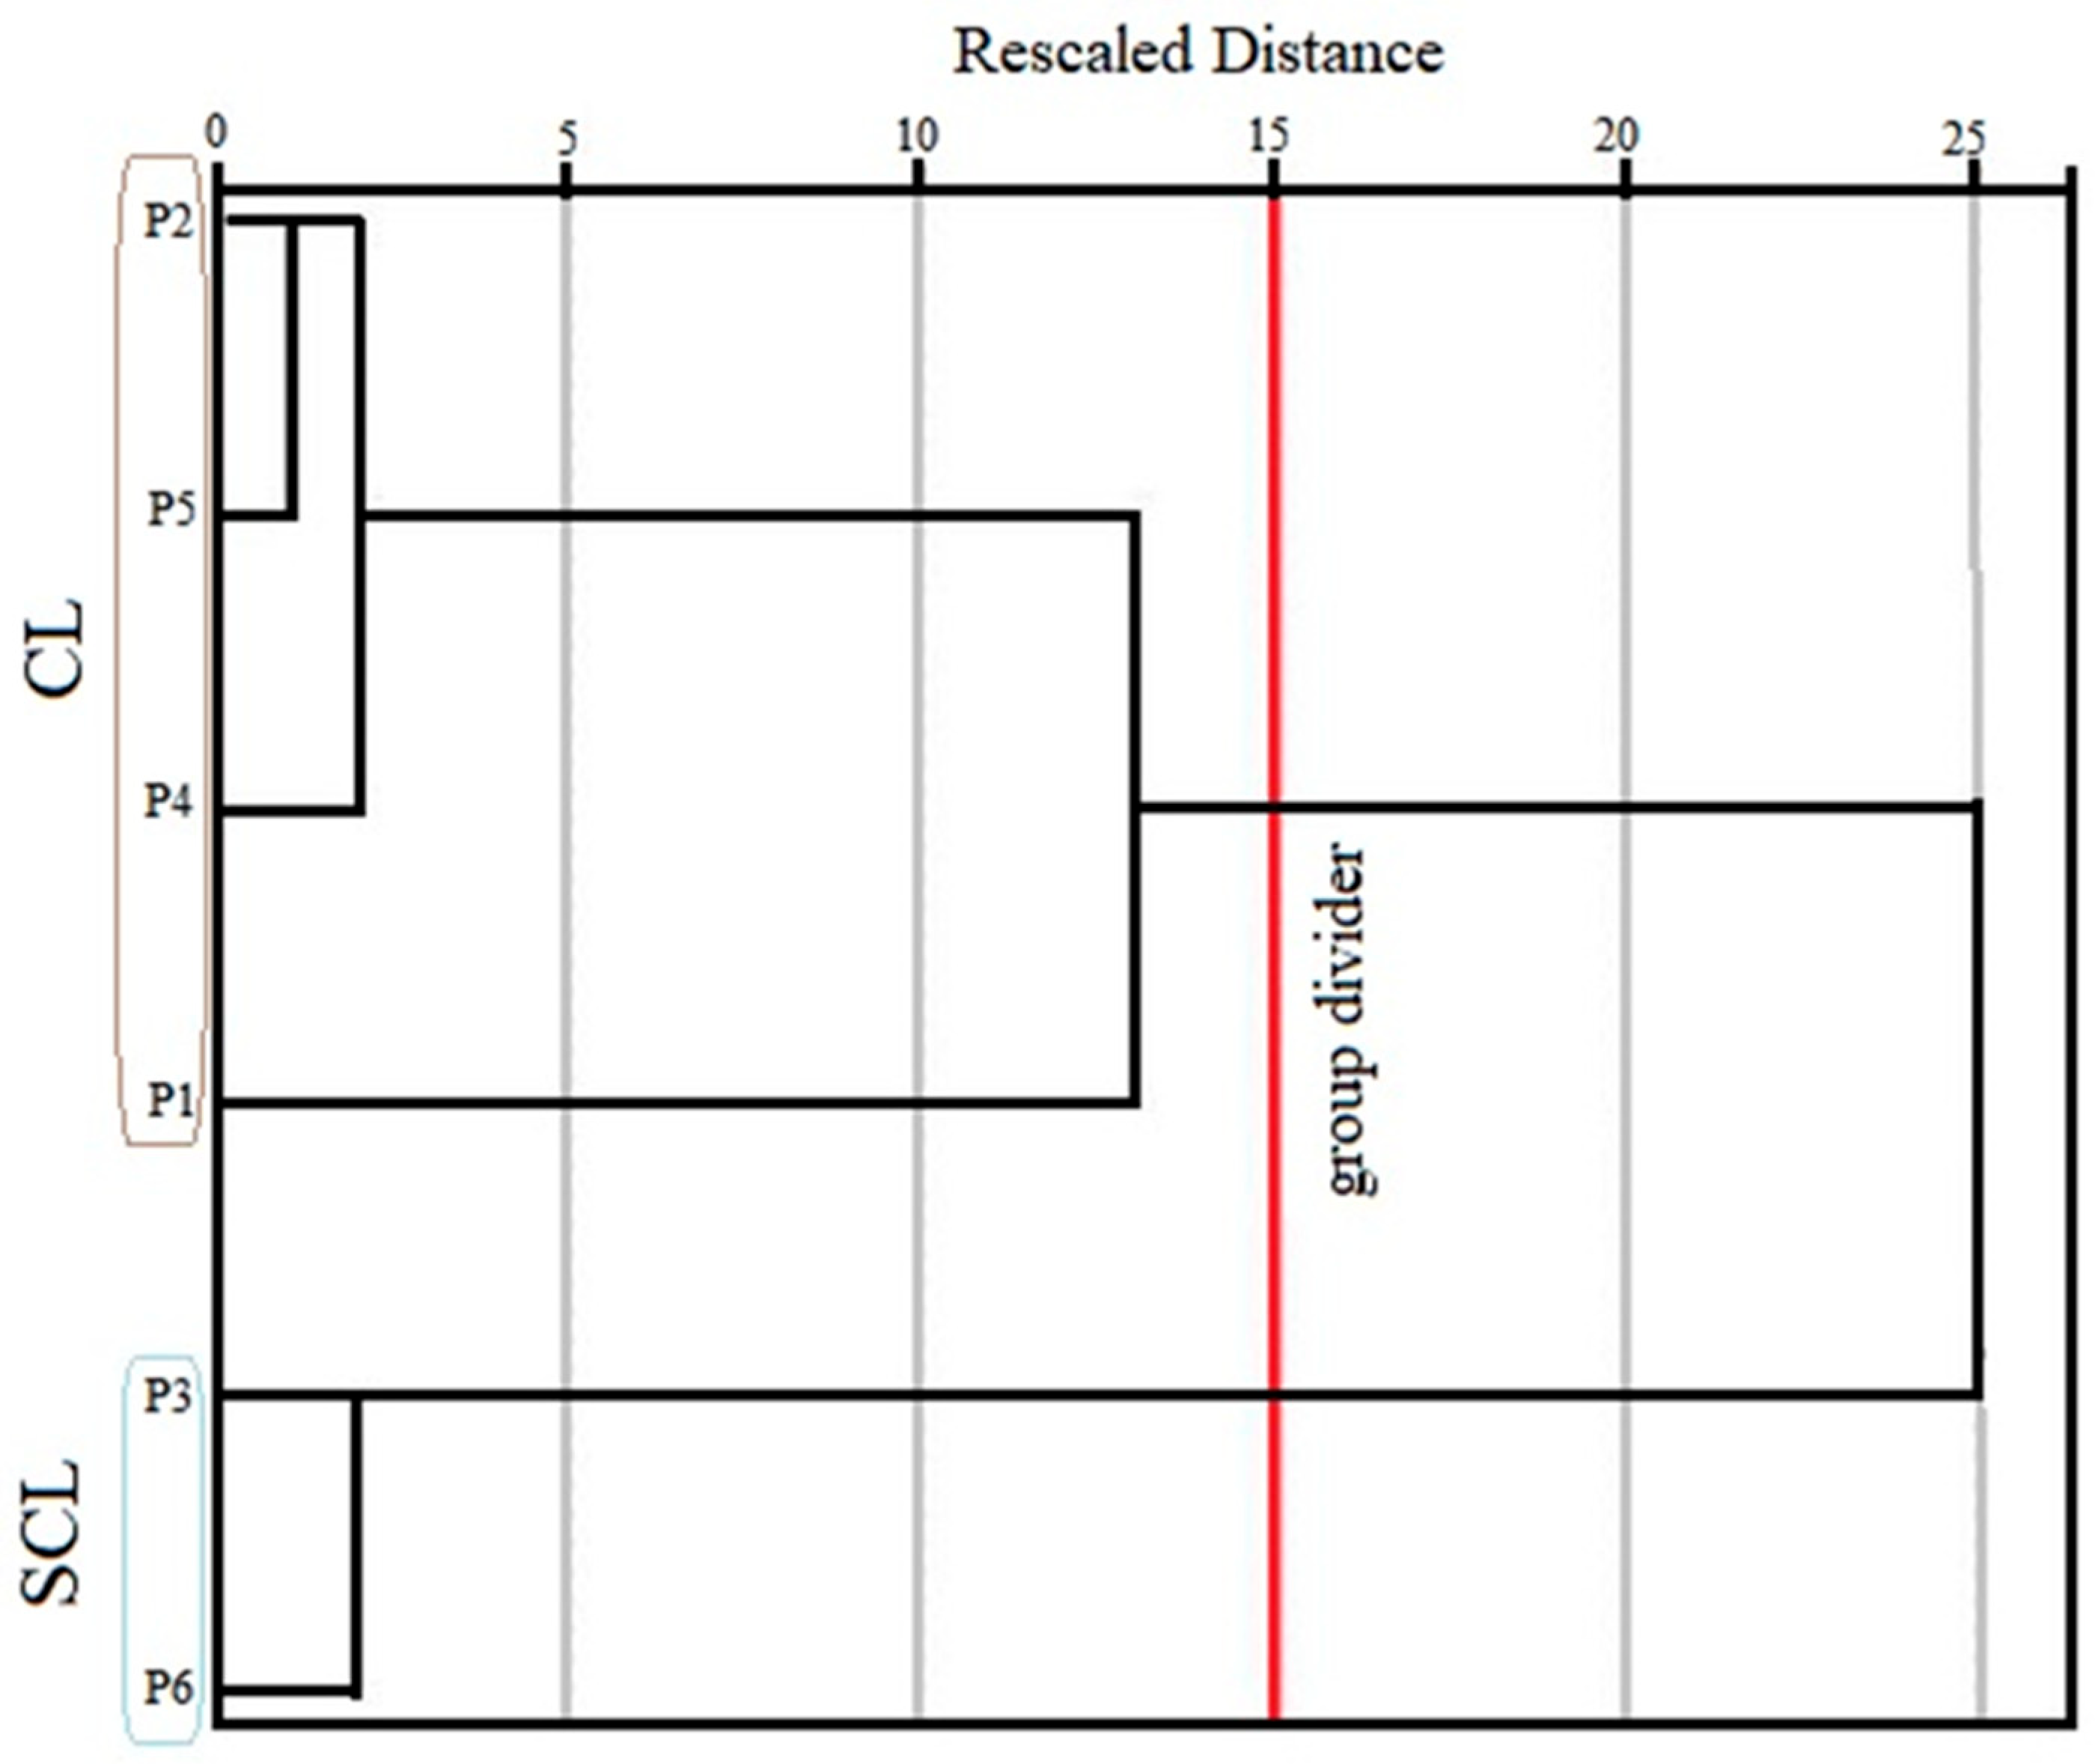
2.1. Study Area
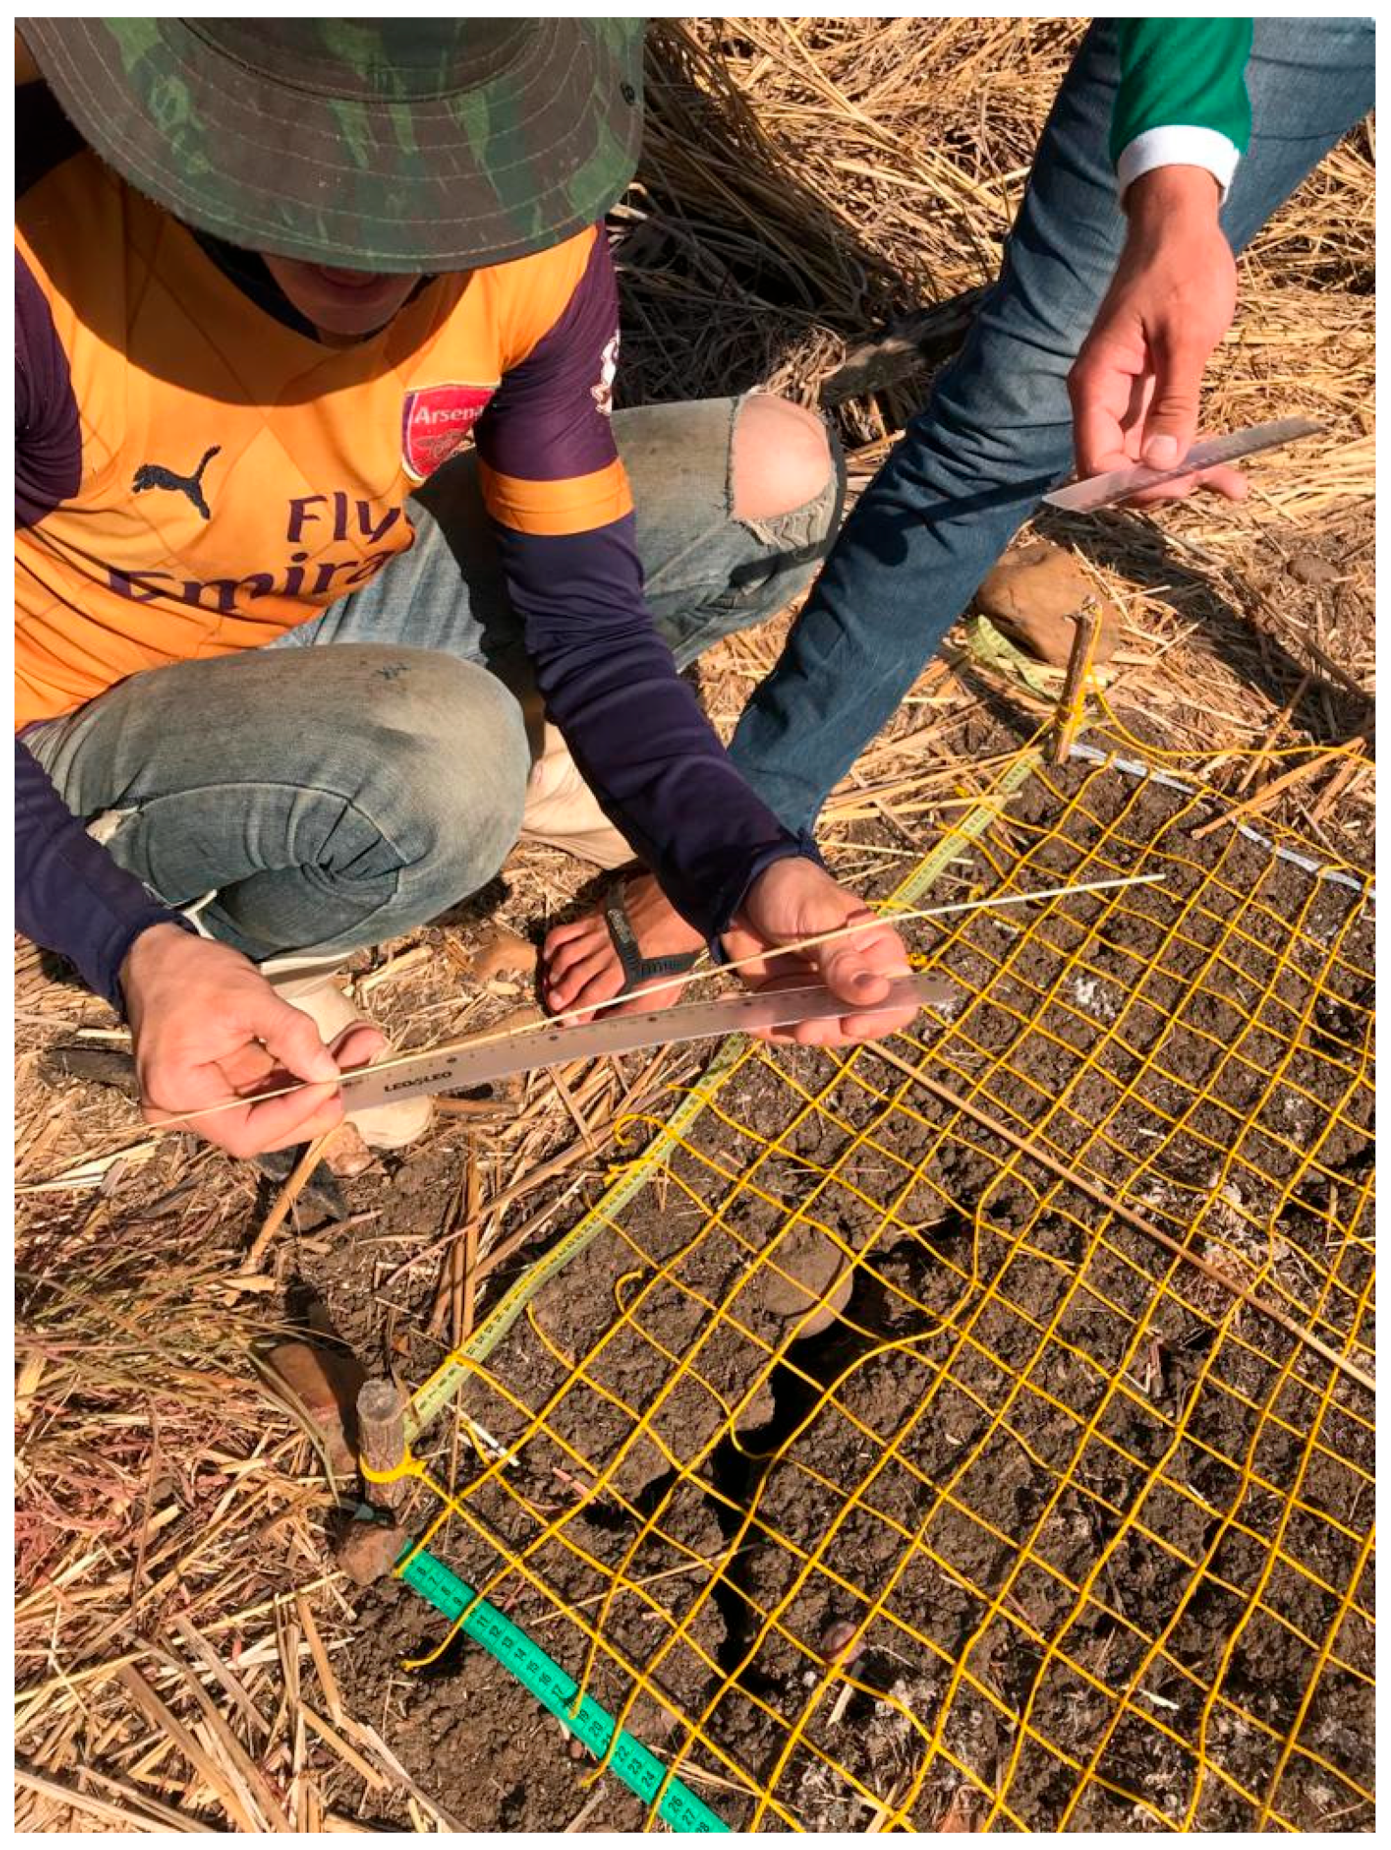
2.2. Monitoring
2.3. Crack Morphology and Dynamics
3. Results
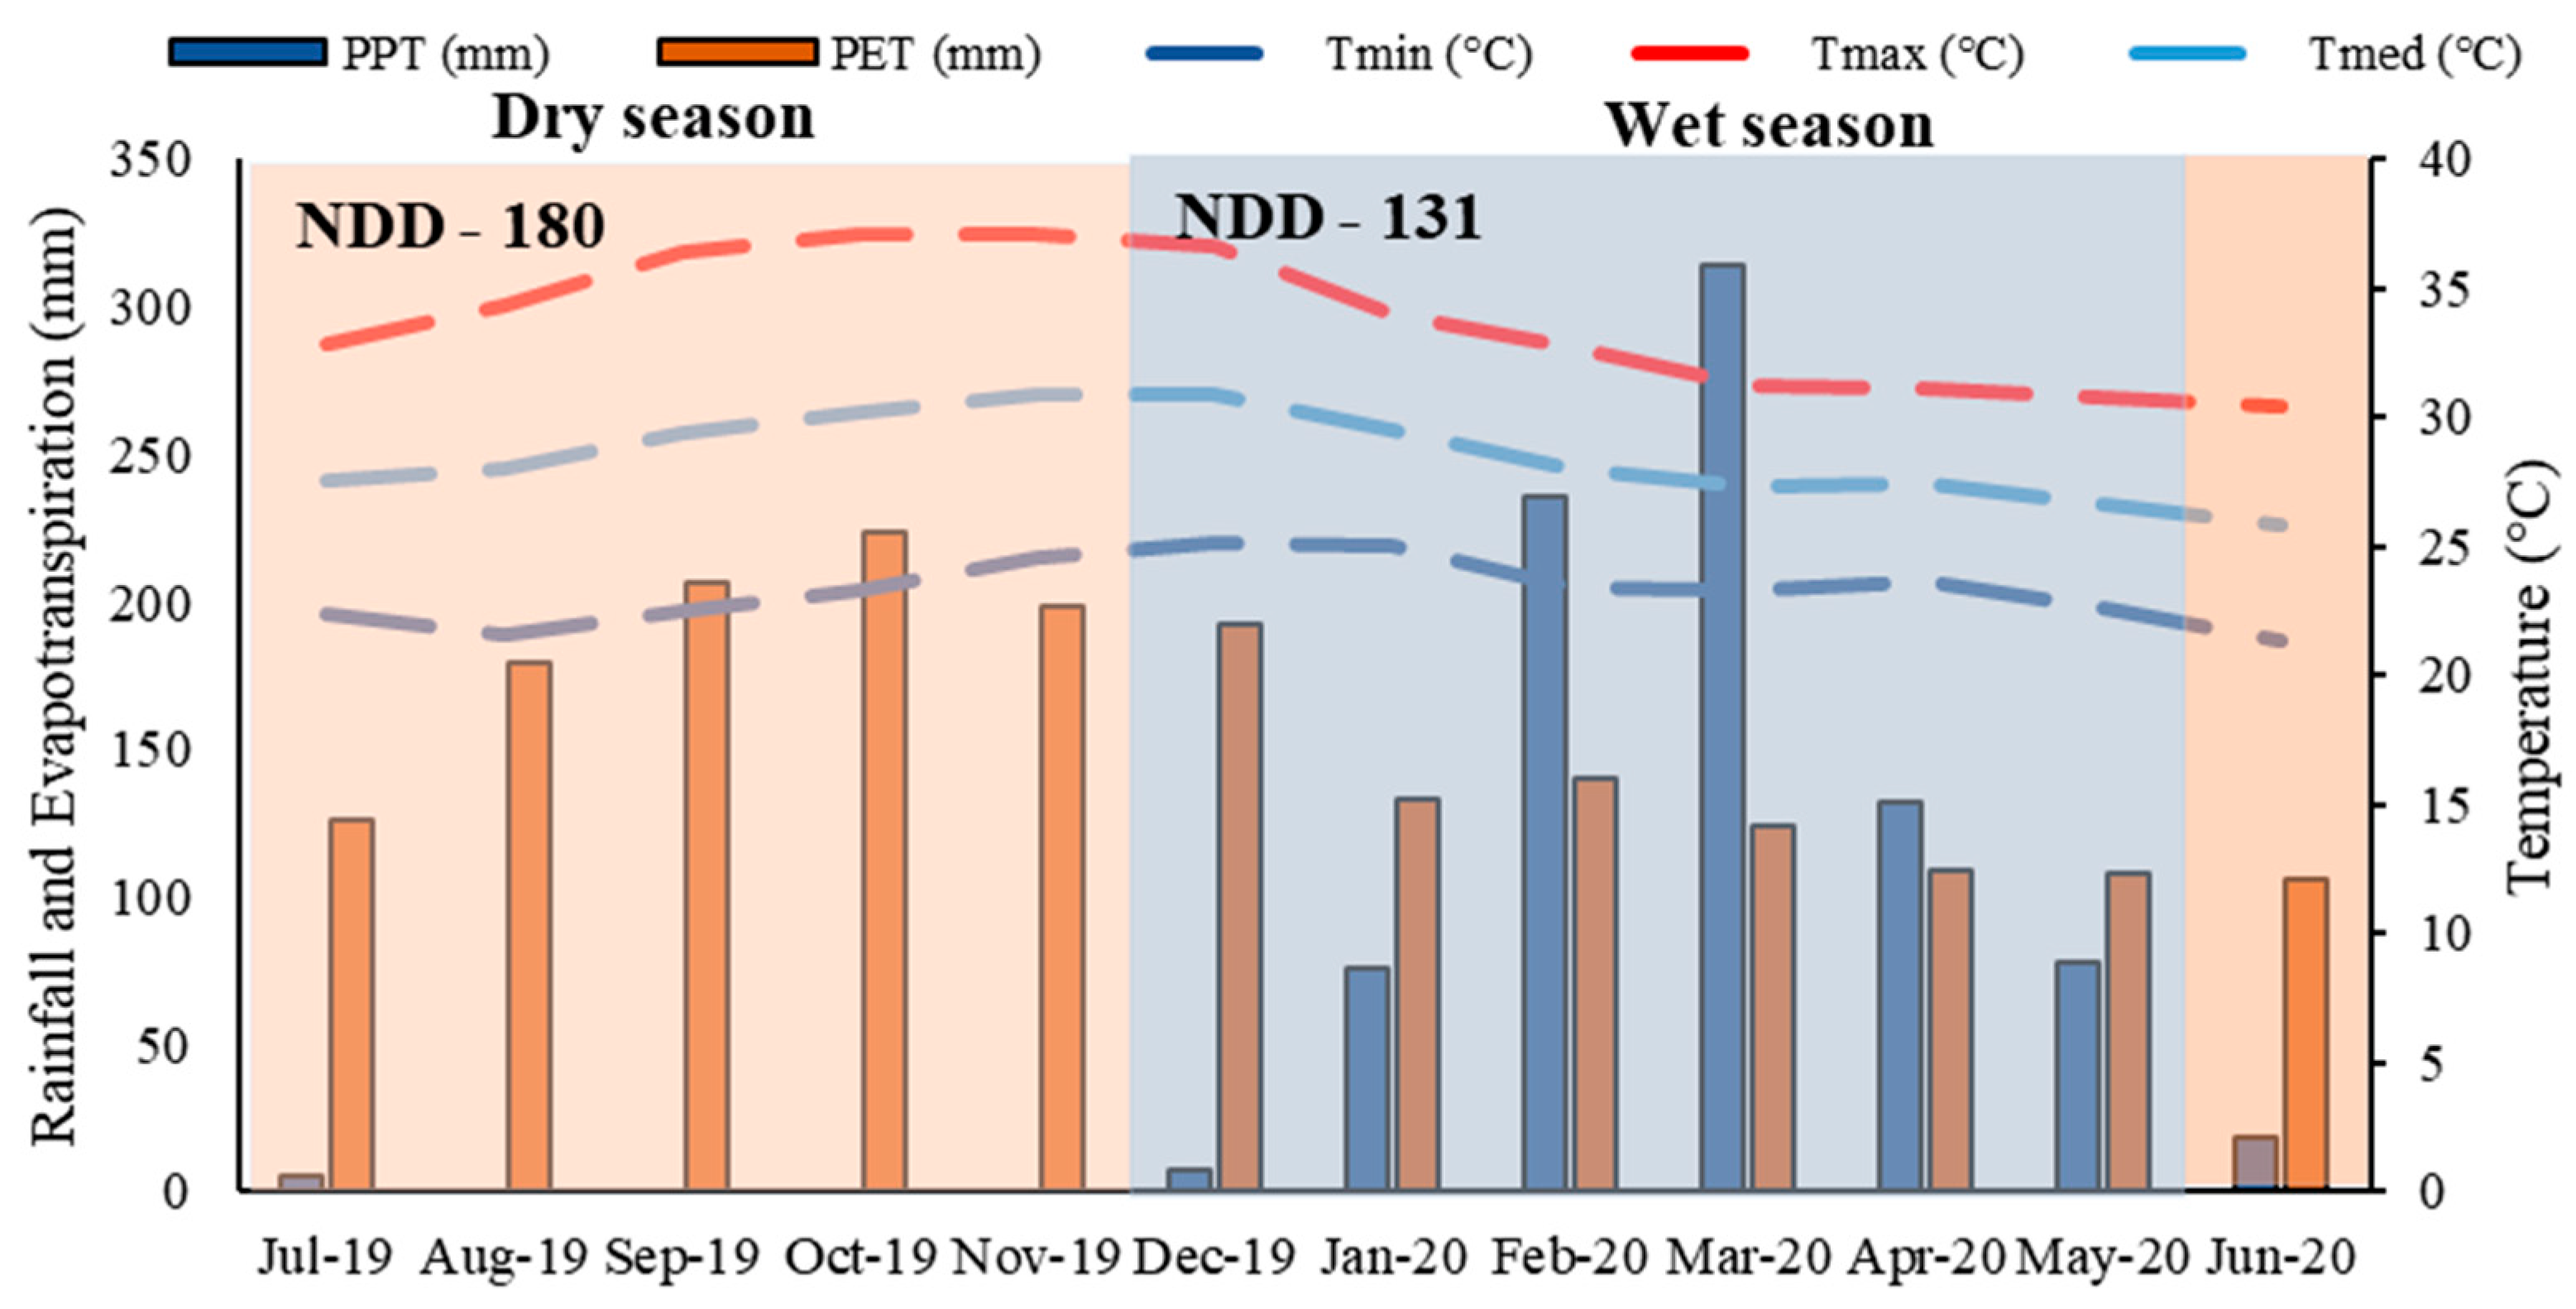
3.1. Field Data
3.2. Crack Morphology
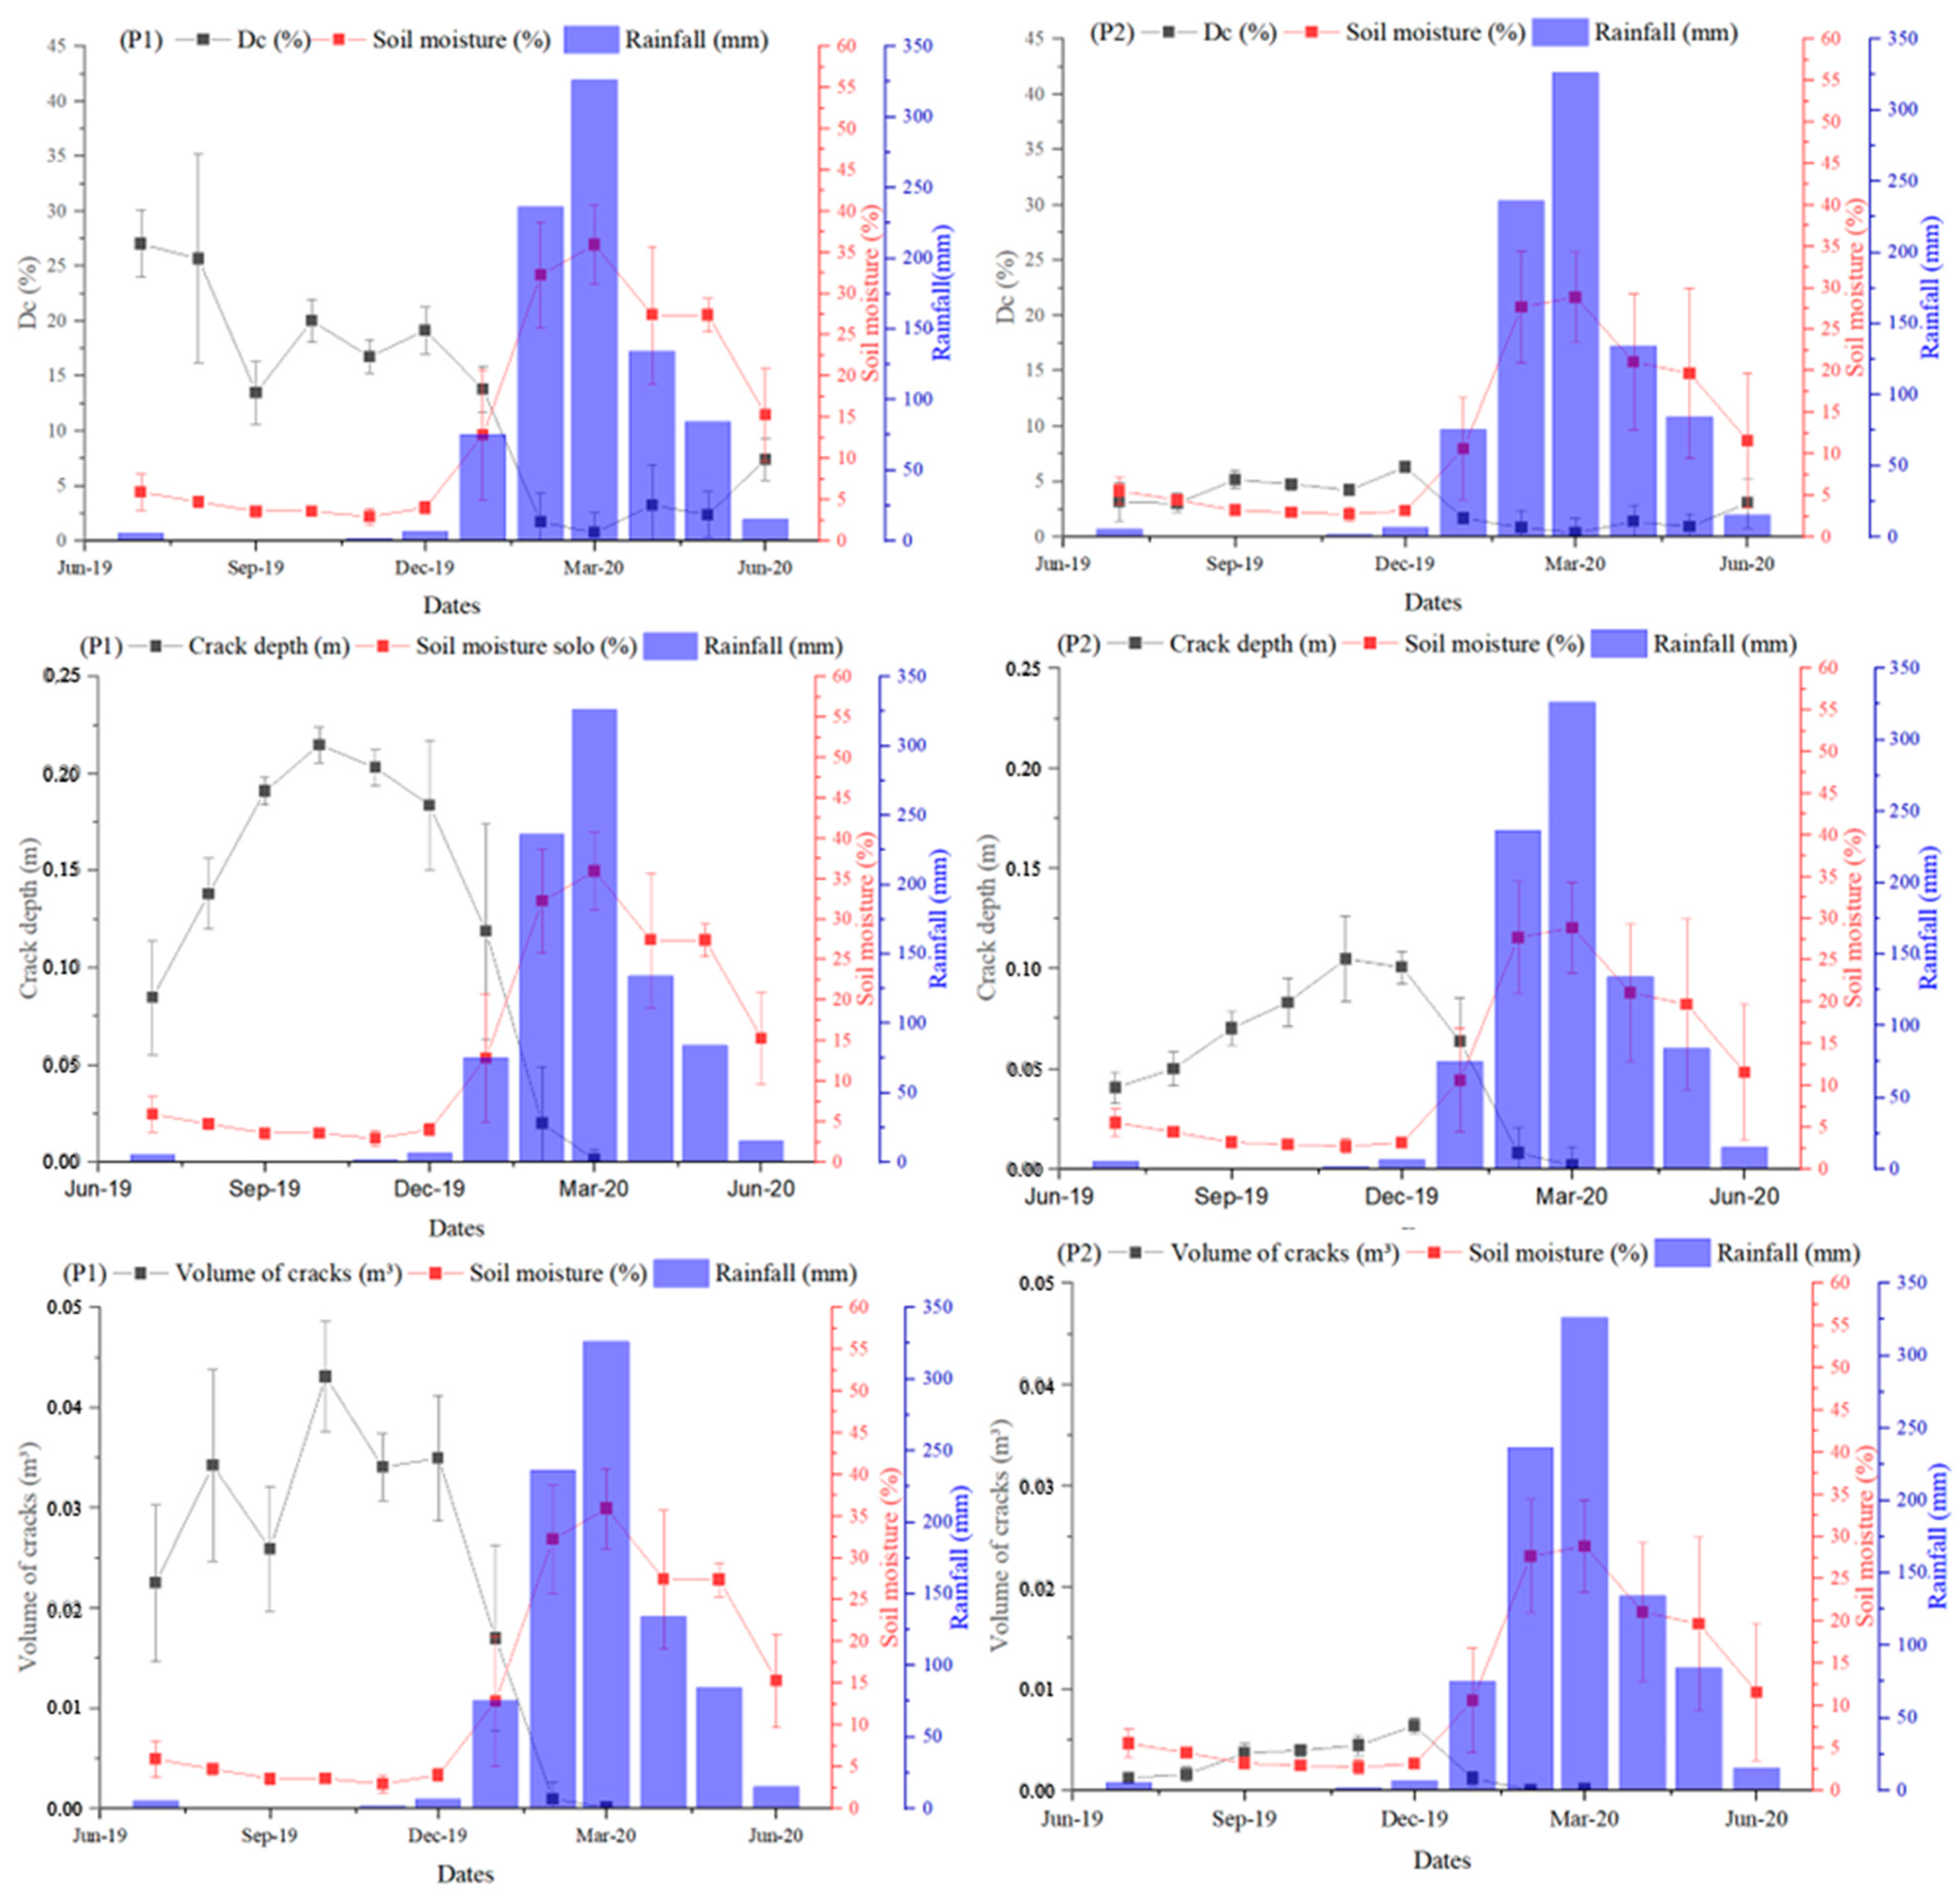
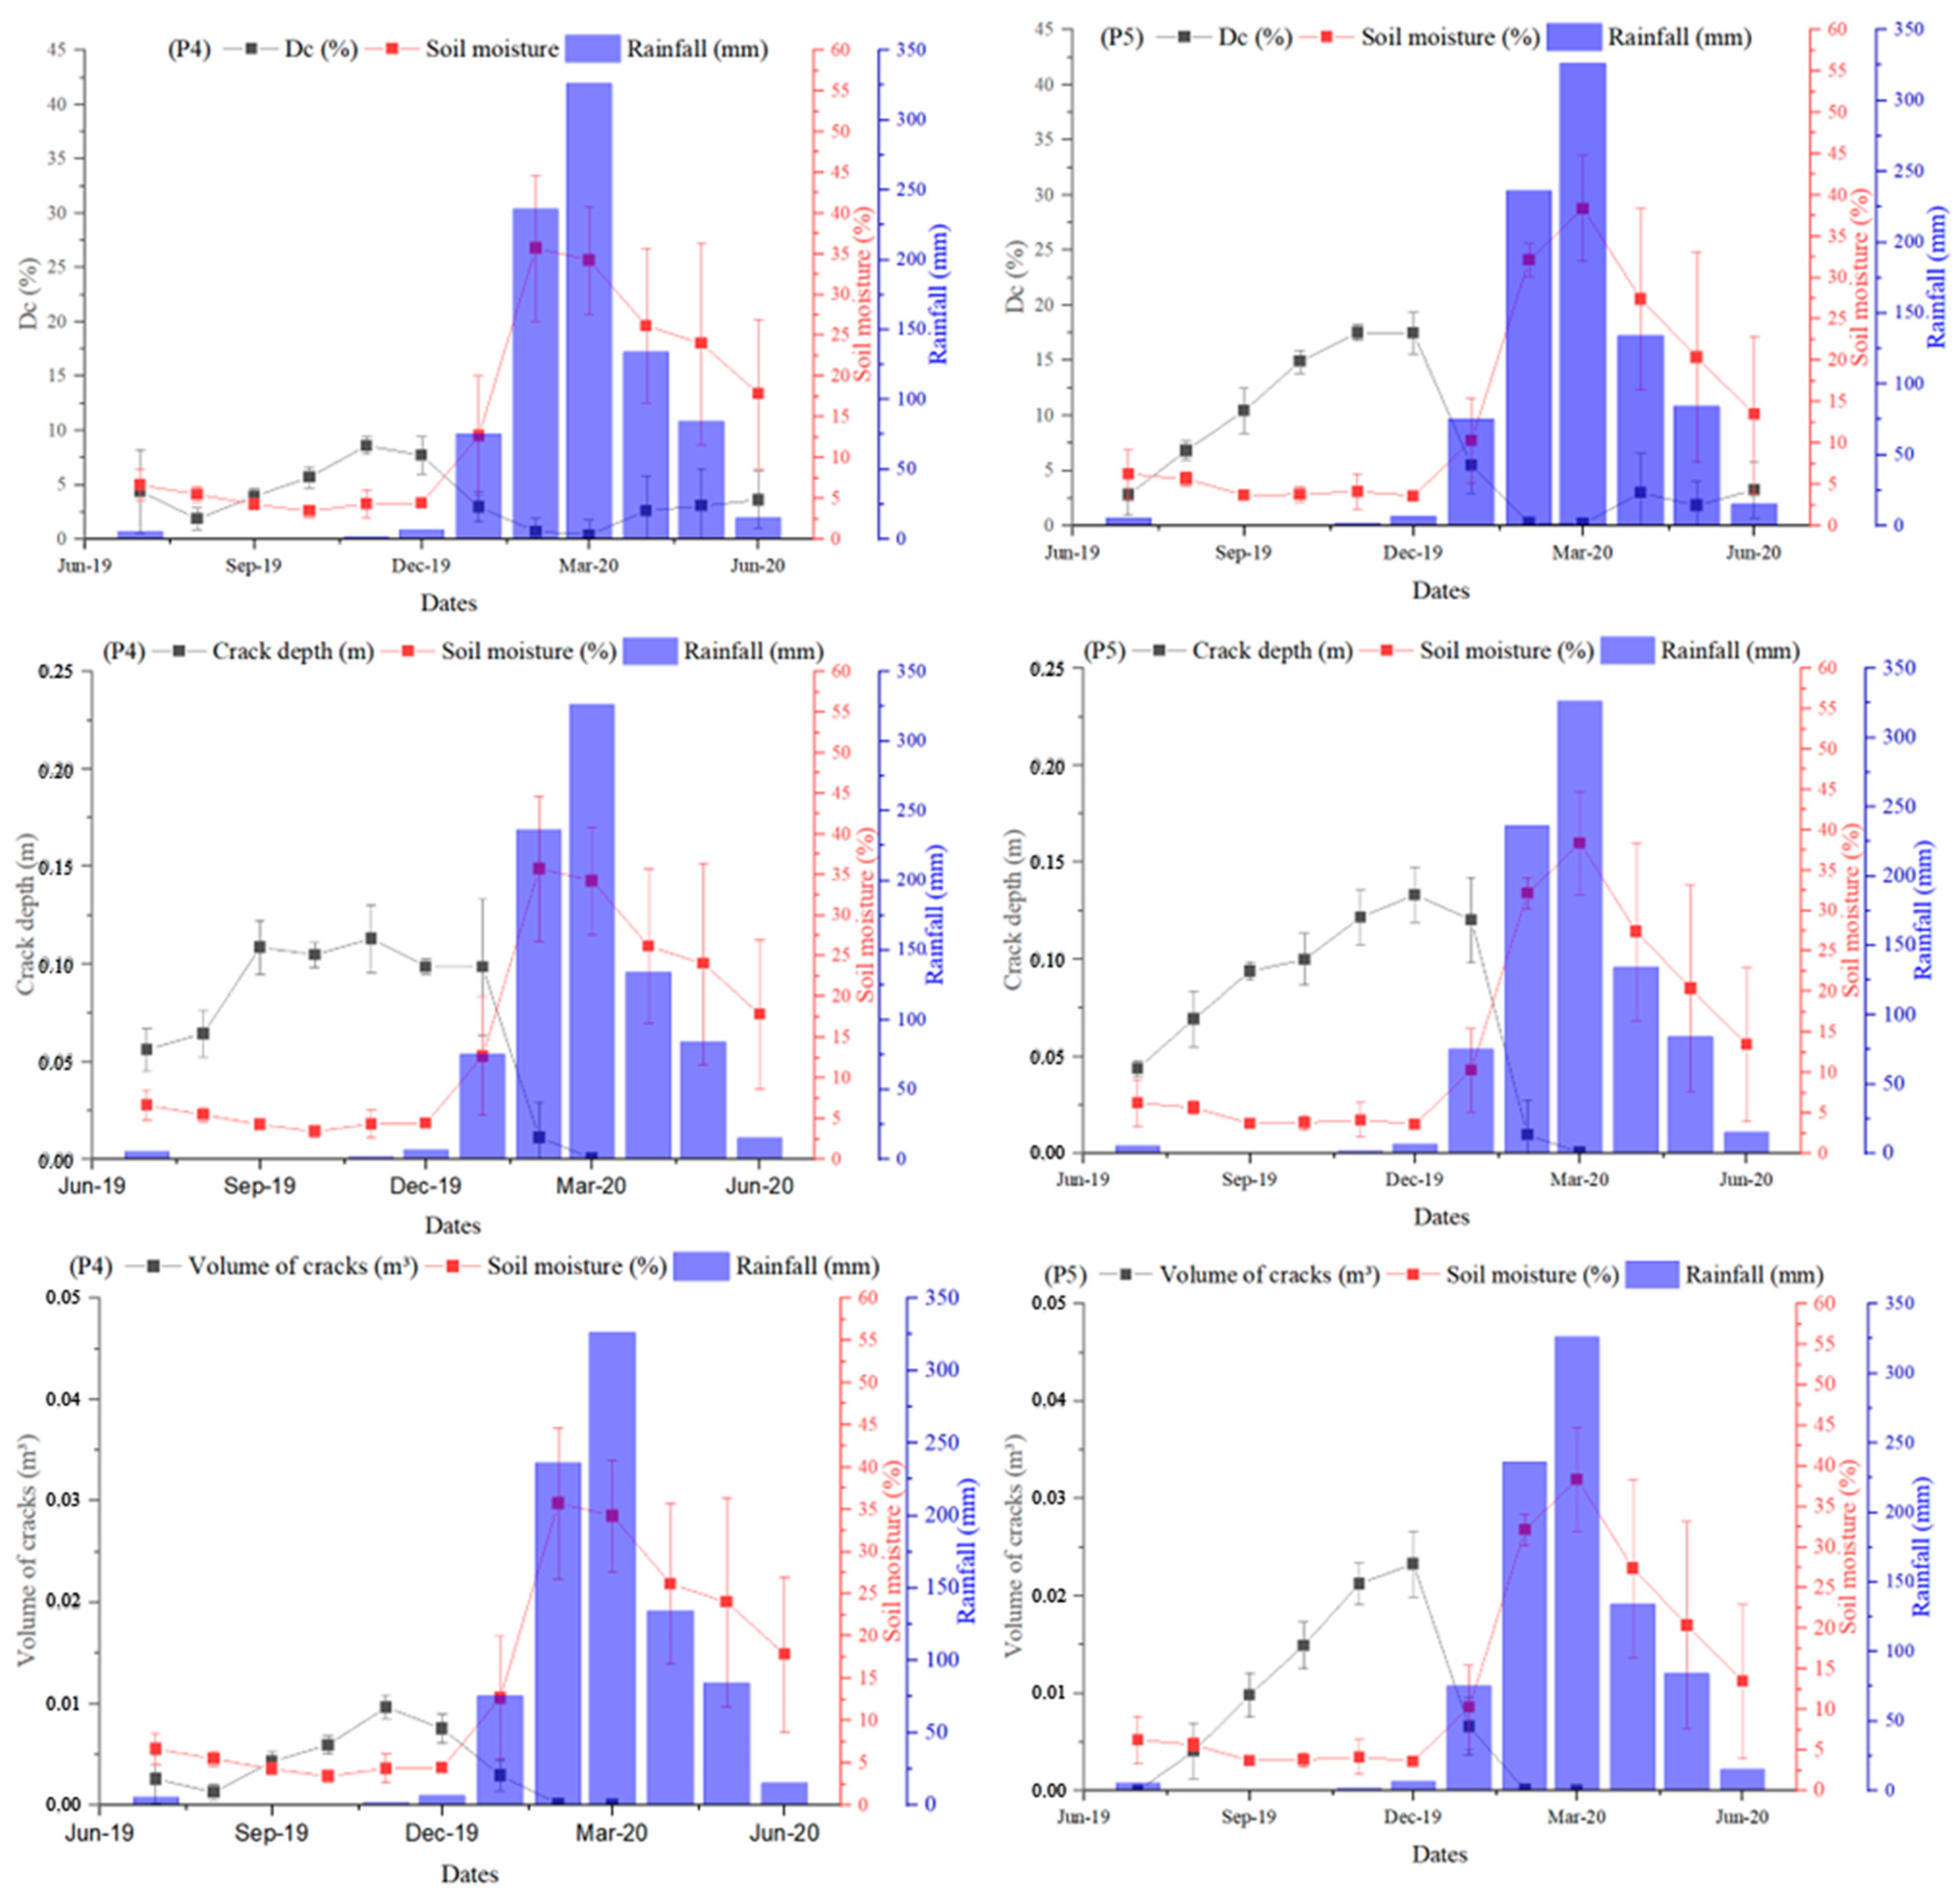
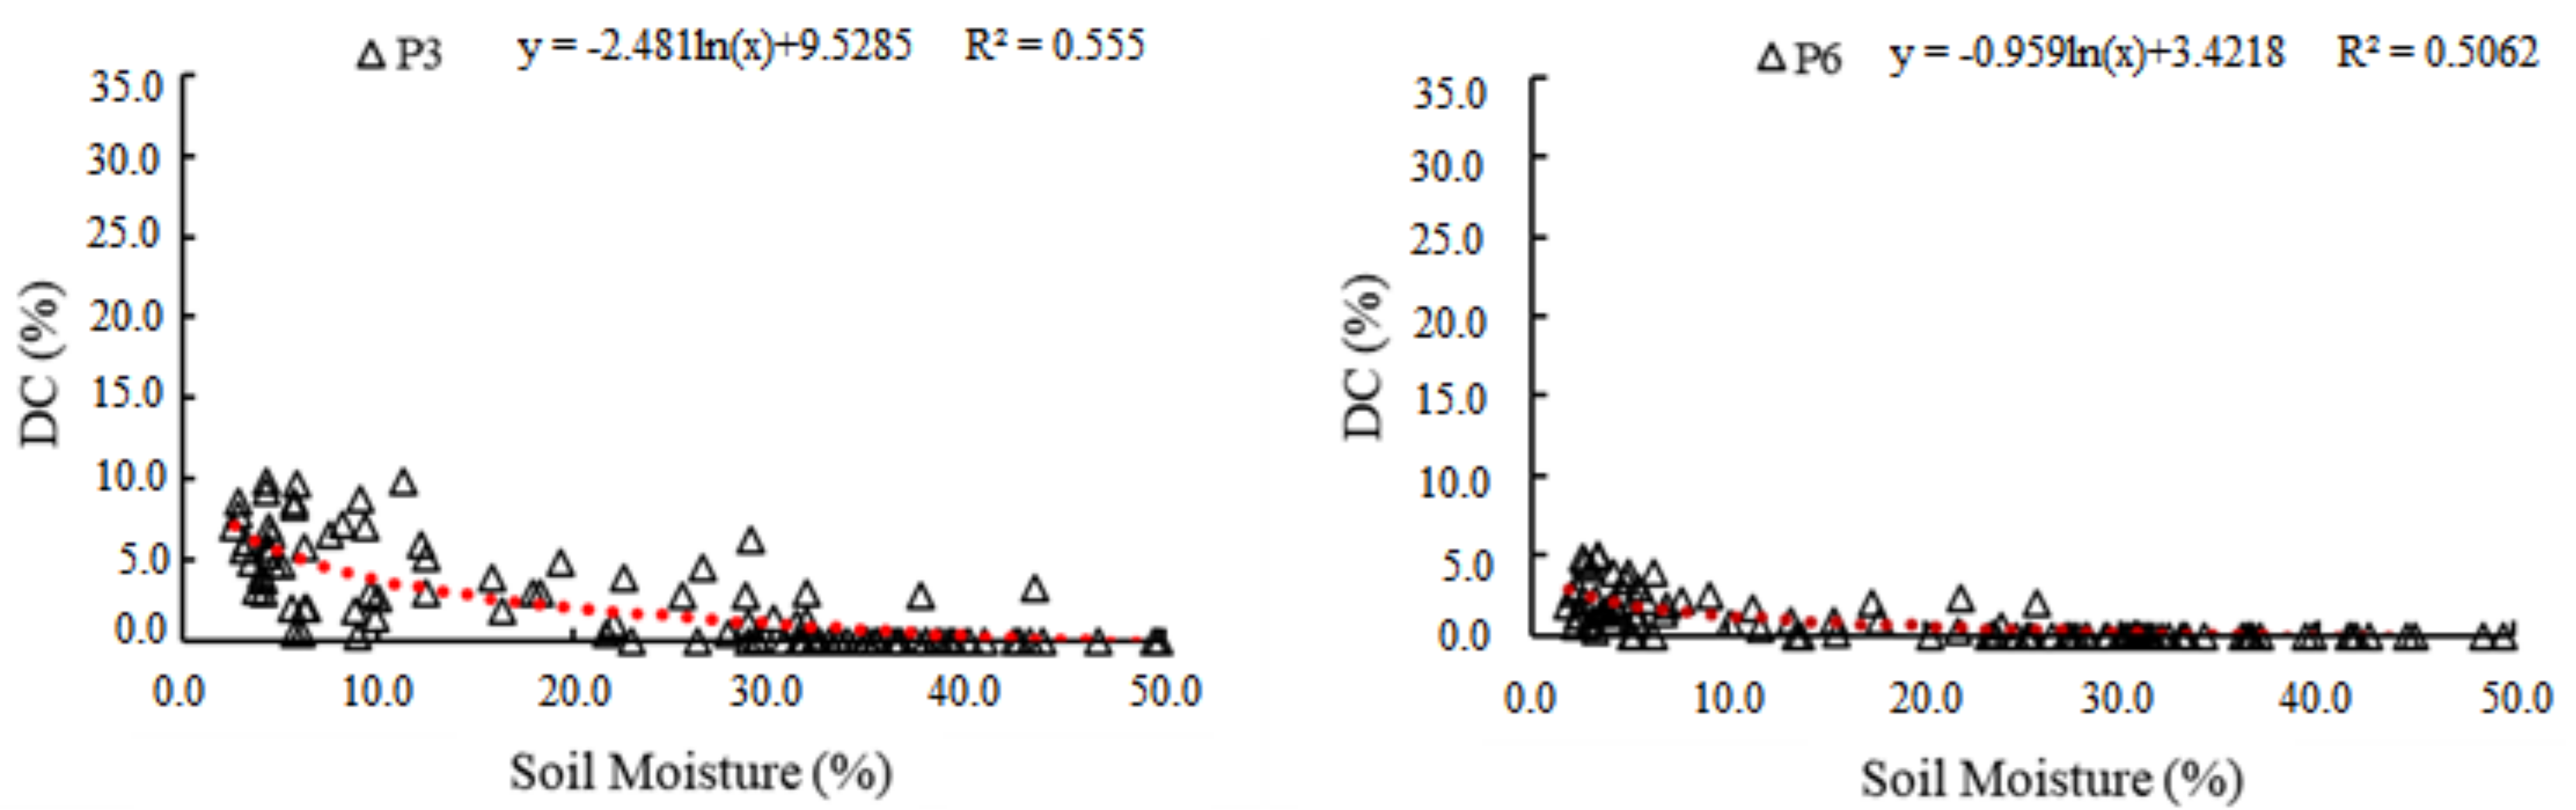
3.3. Crack Dynamics
4. Discussion
4.1. Crack Morphology
4.2. Crack Dynamics
5. Conclusions
Author Contributions
Funding
Data Availability Statement
Acknowledgments
Conflicts of Interest
References
- Wang, C.; Zhang, Z.Y.; Qi, W.; Fan, S.M. Morphological approach to quantifying soil cracks: Application to dynamic crack patterns during wetting-drying cycles. Soil Sci. Soc. Am. J. 2018, 82, 757–771. [Google Scholar] [CrossRef]
- Tang, C.S.; Zhu, C.; Cheng, Q.; Zeng, H.; Xu, J.J.; Tian, B.G.; Shi, B. Desiccation cracking of soils: A review of investigation approaches, underlying mechanisms, and influencing factors. Earth-Sci. Rev. 2021, 216, 103586. [Google Scholar] [CrossRef]
- Dai, A. Increasing drought under global warming in observations and models. Nat. Clim. Chang. 2013, 3, 52–58. [Google Scholar] [CrossRef]
- Santos, J.C.N.; de Andrade, E.M.; Guerreiro, M.J.S.; Medeiros, P.H.A.; de Queiroz Palácio, H.A.; de Araújo Neto, J.R. Effect of dry spells and soil cracking on runoff generation in a semiarid micro watershed under land use change. J. Hydrol. 2016, 541, 1057–1066. [Google Scholar] [CrossRef]
- Bordoloi, S.; Ni, J.; Ng, C.W.W. Soil desiccation cracking and its characterization in vegetated soil: A perspective review. Sci. Total Environ. 2020, 729, 138760. [Google Scholar] [CrossRef]
- Sadeghi, S.H.; Kheirfam, H.; Darki, B.Z. Controlling runoff generation and soil loss from field experimental plots through inoculating cyanobacteria. J. Hydrol. 2020, 585, 124814. [Google Scholar] [CrossRef]
- Cheng, Q.; Tang, C.S.; Xu, D.; Zeng, H.; Shi, B. Water infiltration in a cracked soil considering effect of drying-wetting cycles. J. Hydrol. 2021, 593, 125640. [Google Scholar] [CrossRef]
- Tang, C.S.; Wang, D.Y.; Zhu, C.; Zhou, Q.Y.; Xu, S.K.; Shi, B. Characterizing drying-induced clayey soil desiccation cracking process using electrical resistivity method. Appl. Clay Sci. 2018, 152, 101–112. [Google Scholar] [CrossRef]
- Tang, C.S.; Shi, B.; Liu, C.; Suo, W.B.; Gao, L. Experimental characterization of shrinkage and desiccation cracking in thin clay layer. Appl. Clay Sci. 2011, 52, 69–77. [Google Scholar] [CrossRef]
- Ralaizafisoloarivony, N.; Degré, A.; Mercatoris, B.; Leonard, A.; Toye, D.; Charlier, R. Assessing Soil Crack Dynamics and Water Evaporation during Dryings of Agricultural Soil from Reduced Tillage and Conventional Tillage Fields. Multidiscip. Digit. Publ. Inst. Proc. 2020, 30, 59. [Google Scholar] [CrossRef]
- Al-Jeznawi, D.; Sanchez, M.; Al-Taie, A.J. Using image analysis technique to study the effect of boundary and environment conditions on soil cracking mechanism. Geotech. Geol. Eng. 2021, 39, 25–36. [Google Scholar] [CrossRef]
- Elias, E.A.; Salih, A.A.; Alaily, F. Cracking patterns in the Vertisols of the Sudan Gezira at the end of dry season. Int. Agrophysics 2021, 15, 151–155. [Google Scholar]
- Wei, X.; Hattab, M.; Bompard, P.; Fleureau, J.M. Highlighting some mechanisms of crack formation and propagation in clays on drying path. Géotechnique 2016, 66, 287–300. [Google Scholar] [CrossRef]
- Xu, J.J.; Zhang, H.; Tang, C.S.; Cheng, Q.; Liu, B.; Shi, B. Automatic soil desiccation crack recognition using deep learning. Géotechnique 2022, 72, 337–349. [Google Scholar] [CrossRef]
- Dinka, T.M.; Morgan, C.L.; McInnes, K.J.; Kishné, A.S.; Harmel, R.D. Shrink–swell behavior of soil across a Vertisol catena. J. Hydrol. 2013, 476, 352–359. [Google Scholar] [CrossRef]
- Xiong, D.; Yan, D.; Long, Y.; Lu, X.; Han, J.; Han, X.; Shi, L. Simulation of morphological development of soil cracks in Yuanmou Dry-hot Valley region, Southwest China. Chin. Geogr. Sci. 2010, 20, 112–122. [Google Scholar] [CrossRef]
- Natural Resources Conservation Service. Keys to Soil Taxonomy, 12th ed.; Government Printing Office: Washington, DC, USA, 2014.
- Campos, D.A.; de Andrade, E.M. Seasonal trend of climate variables in an area of the Caatinga phytogeographic domain. Rev. Agro@mbiente On-Line 2021, 15, 1–18. [Google Scholar] [CrossRef]
- Guerreiro, M.S.; Maia de Andrade, E.; Palácio, H.A.D.Q.; Brasil, J.B.; Filho, J.C.R. Enhancing Ecosystem Services to Minimize Impact of Climate Variability in a Dry Tropical Forest with Vertisols. Hydrology 2021, 8, 46. [Google Scholar] [CrossRef]
- Liu, C.; Tang, C.S.; Shi, B.; Suo, W.B. Automatic quantification of crack patterns by image processing. Comput. Geosci. 2013, 57, 77–80. [Google Scholar] [CrossRef]
- Stewart, R.D.; Najm, M.R.A. Field measurements of soil cracks. Soil Sci. Soci. Am. J. 2020, 84, 1462–1476. [Google Scholar] [CrossRef]
- Miller, W.L.; Kishné, A.S.; Morgan, C.L. Vertisol morphology, classification, and seasonal cracking patterns in the Texas Gulf coast prairie. Soil Surv. Horiz. 2010, 51, 10–16. [Google Scholar] [CrossRef] [Green Version]
- Bullard, J.E.; Ockelford, A.; Strong, C.L.; Aubault, H. Impact of multi-day rainfall events on surface roughness and physical crusting of very fine soils. Geoderma 2018, 313, 181–192. [Google Scholar] [CrossRef] [Green Version]
- Li, M.; Yao, J.; Yan, R.; Cheng, J. Effects of infiltration amounts on preferential flow characteristics and solute transport in the protection forest soil of southwestern China. Water 2021, 13, 1301. [Google Scholar] [CrossRef]
- Ferreira, S.R.D.M.; Araújo, A.G.D.D.; Barbosa, F.A.S.; Silva, T.C.R.; Bezerra, I.M.D.L. Analysis of changes in volume and propagation of cracks in expansive soil due to changes in water content. Revista Brasileira de Ciência do Solo 2020, 44, 1–19. [Google Scholar] [CrossRef]
- Rayhani, M.H.T.; Yanful, E.K.; Fakher, A. Physical modeling of desiccation cracking in plastic soils. Eng. Geol. 2008, 97, 25–31. [Google Scholar] [CrossRef]
- Ribeiro Filho, J.C.; de Andrade, E.M.; Guerreiro, M.S.; de Queiroz Palácio, H.A.; Brasil, J.B. Climate Data to Predict Geometry of Cracks in Expansive Soils in a Tropical Semiarid Region. Sustainability 2022, 14, 675. [Google Scholar] [CrossRef]
- Ribeiro Filho, J.C.; de Andrade, E.M.; de Sousa, M.M.M.; Brasil, J.B.; de Quairoz Palácio, H.A. Morphological characteristics of cracks in soil with and without vegetation cover. Rev. Agro@mbiente On-Line 2023, 17, 1–15. [Google Scholar] [CrossRef]
- Guerreiro, M.S.; de Andrade, E.M.; de Sousa, M.M.M.; Brasil, J.B.; Filho, J.C.R.; de Queiroz Palácio, H.A. Contribution of non-rainfall water input to surface soil moisture in a tropical dry forest. Hydrology 2022, 9, 102. [Google Scholar] [CrossRef]
- Dou, Y.; Quan, J.; Jia, X.; Wang, Q.; Liu, Y. Near-Surface Warming Reduces Dew Frequency in China. Geophys. Res. Lett. 2021, 48, e2020GL091923. [Google Scholar] [CrossRef]
- Yu, B.; Liu, G.; Liu, Q.; Wang, X.; Feng, J.; Huang, C. Soil moisture variations at different topographic domains and land use types in the semi-arid Loess Plateau, China. Catena 2018, 165, 125–132. [Google Scholar] [CrossRef]


| Dc Intervals | Levels of Development |
|---|---|
| Dc ≤ 5% | Feeble |
| 5 < Dc ≤ 10 | Light |
| 10 < Dc ≤ 22 | Medium |
| 22 < Dc ≤ 27 | Intensive |
| Dc > 27 | Extremely intensive |
| Soil Properties | Experimental Plots | |||||
|---|---|---|---|---|---|---|
| P1 | P2 | P3 | P4 | P5 | P6 | |
| Grain size analysis | ||||||
| Sand (%) | 21 | 26 | 41 | 22 | 27 | 44 |
| Silt (%) | 43 | 46 | 33 | 41 | 41 | 36 |
| Clay (%) | 36 | 28 | 26 | 37 | 32 | 20 |
| Organic matter (%) | 0.8 | 1.5 | 1.3 | 1.4 | 1.9 | 2.2 |
| Base saturation (%) | 92 | 95 | 84 | 95 | 92 | 89 |
| pH | 6.6 | 7.1 | 6 | 6.8 | 6.6 | 6.7 |
| Specific gravity | 2.79 | 2.57 | 2.53 | 2.53 | 2.48 | 2.52 |
| Liquid limit (%) | 43 | 38 | 28 | 42 | 40 | 33 |
| Plastic limit (%) | 14 | 27 | 21 | 32 | 26 | 27 |
| Plasticity index | 30 | 12 | 7 | 10 | 14 | 7 |
| Textural classification | Clay loam | Clay loam | Sandy clay loam | Clay loam | Clay loam | Sandy clay loam |
Disclaimer/Publisher’s Note: The statements, opinions and data contained in all publications are solely those of the individual author(s) and contributor(s) and not of MDPI and/or the editor(s). MDPI and/or the editor(s) disclaim responsibility for any injury to people or property resulting from any ideas, methods, instructions or products referred to in the content. |
© 2023 by the authors. Licensee MDPI, Basel, Switzerland. This article is an open access article distributed under the terms and conditions of the Creative Commons Attribution (CC BY) license (https://creativecommons.org/licenses/by/4.0/).
Share and Cite
Ribeiro Filho, J.C.; Andrade, E.M.d.; Guerreiro, M.S.; Palácio, H.A.d.Q.; Brasil, J.B. Soil–Water–Atmosphere Effects on Soil Crack Characteristics under Field Conditions in a Semiarid Climate. Hydrology 2023, 10, 83. https://doi.org/10.3390/hydrology10040083
Ribeiro Filho JC, Andrade EMd, Guerreiro MS, Palácio HAdQ, Brasil JB. Soil–Water–Atmosphere Effects on Soil Crack Characteristics under Field Conditions in a Semiarid Climate. Hydrology. 2023; 10(4):83. https://doi.org/10.3390/hydrology10040083
Chicago/Turabian StyleRibeiro Filho, Jacques Carvalho, Eunice Maia de Andrade, Maria Simas Guerreiro, Helba Araújo de Queiroz Palácio, and José Bandeira Brasil. 2023. "Soil–Water–Atmosphere Effects on Soil Crack Characteristics under Field Conditions in a Semiarid Climate" Hydrology 10, no. 4: 83. https://doi.org/10.3390/hydrology10040083