


Characterization of Extreme Rainfall and River Discharge over the Senegal River Basin from 1982 to 2021

Abstract
:1. Introduction
2. Materials and Methods
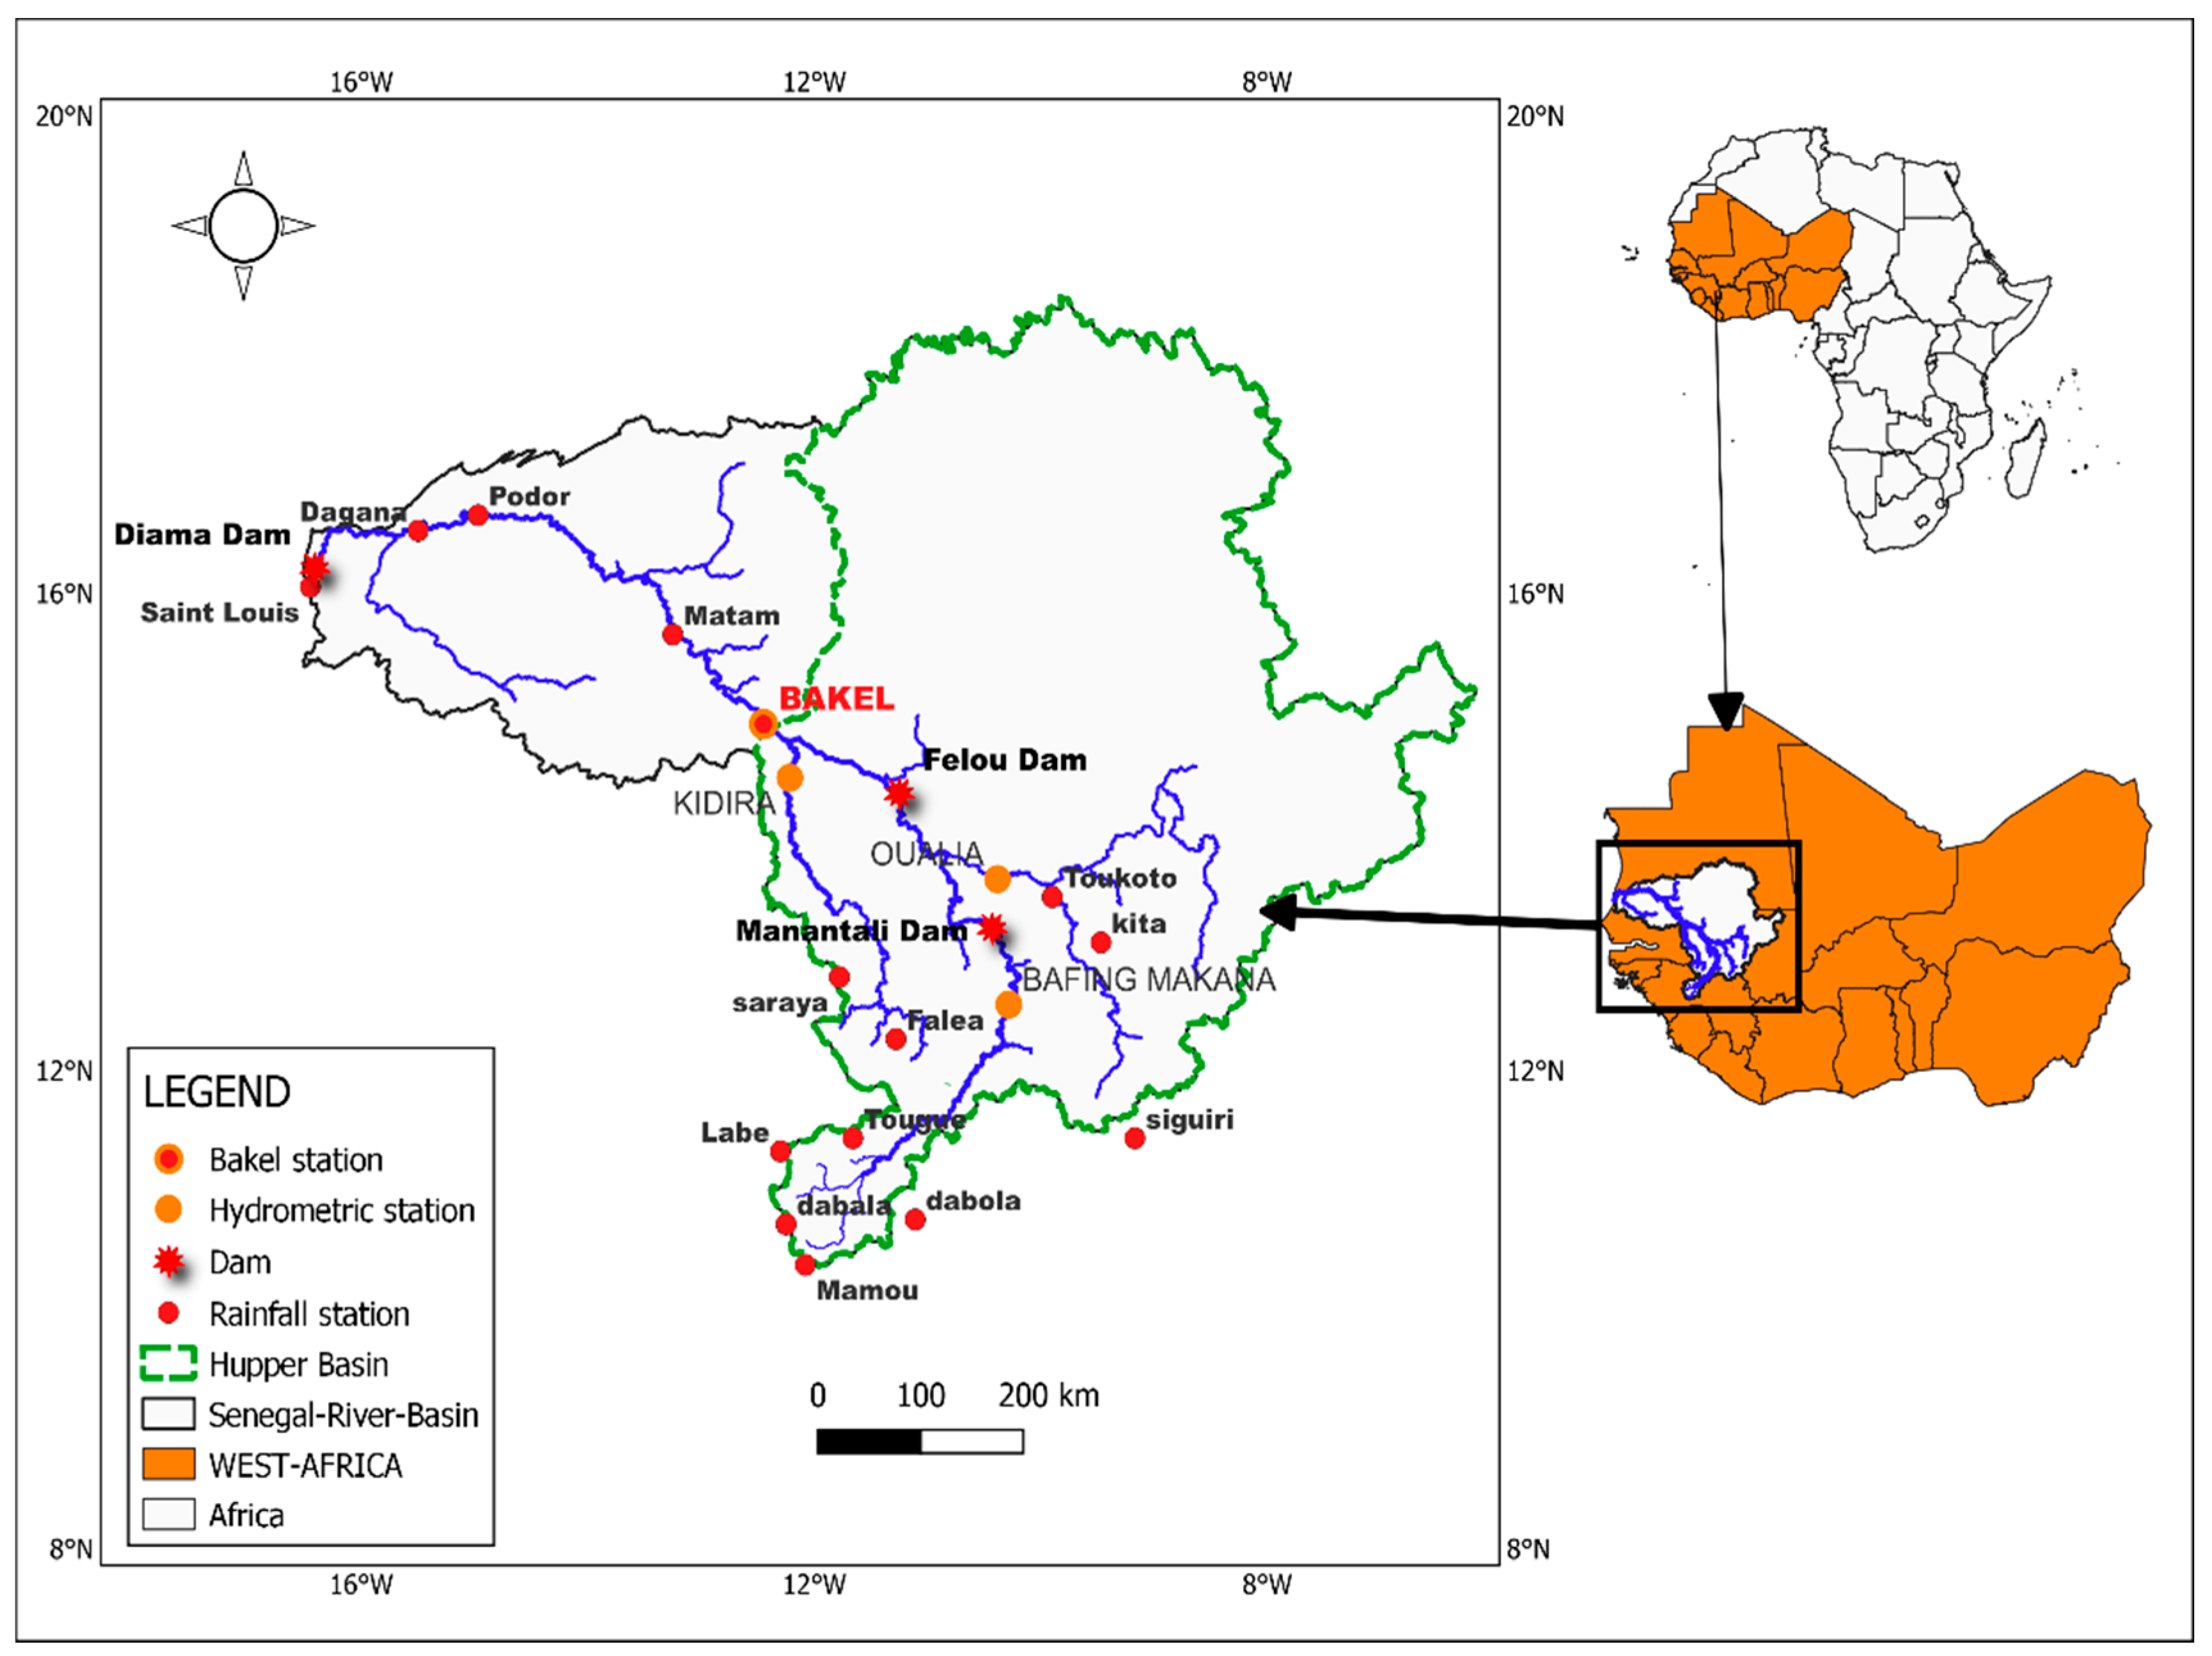
2.1. Study Area
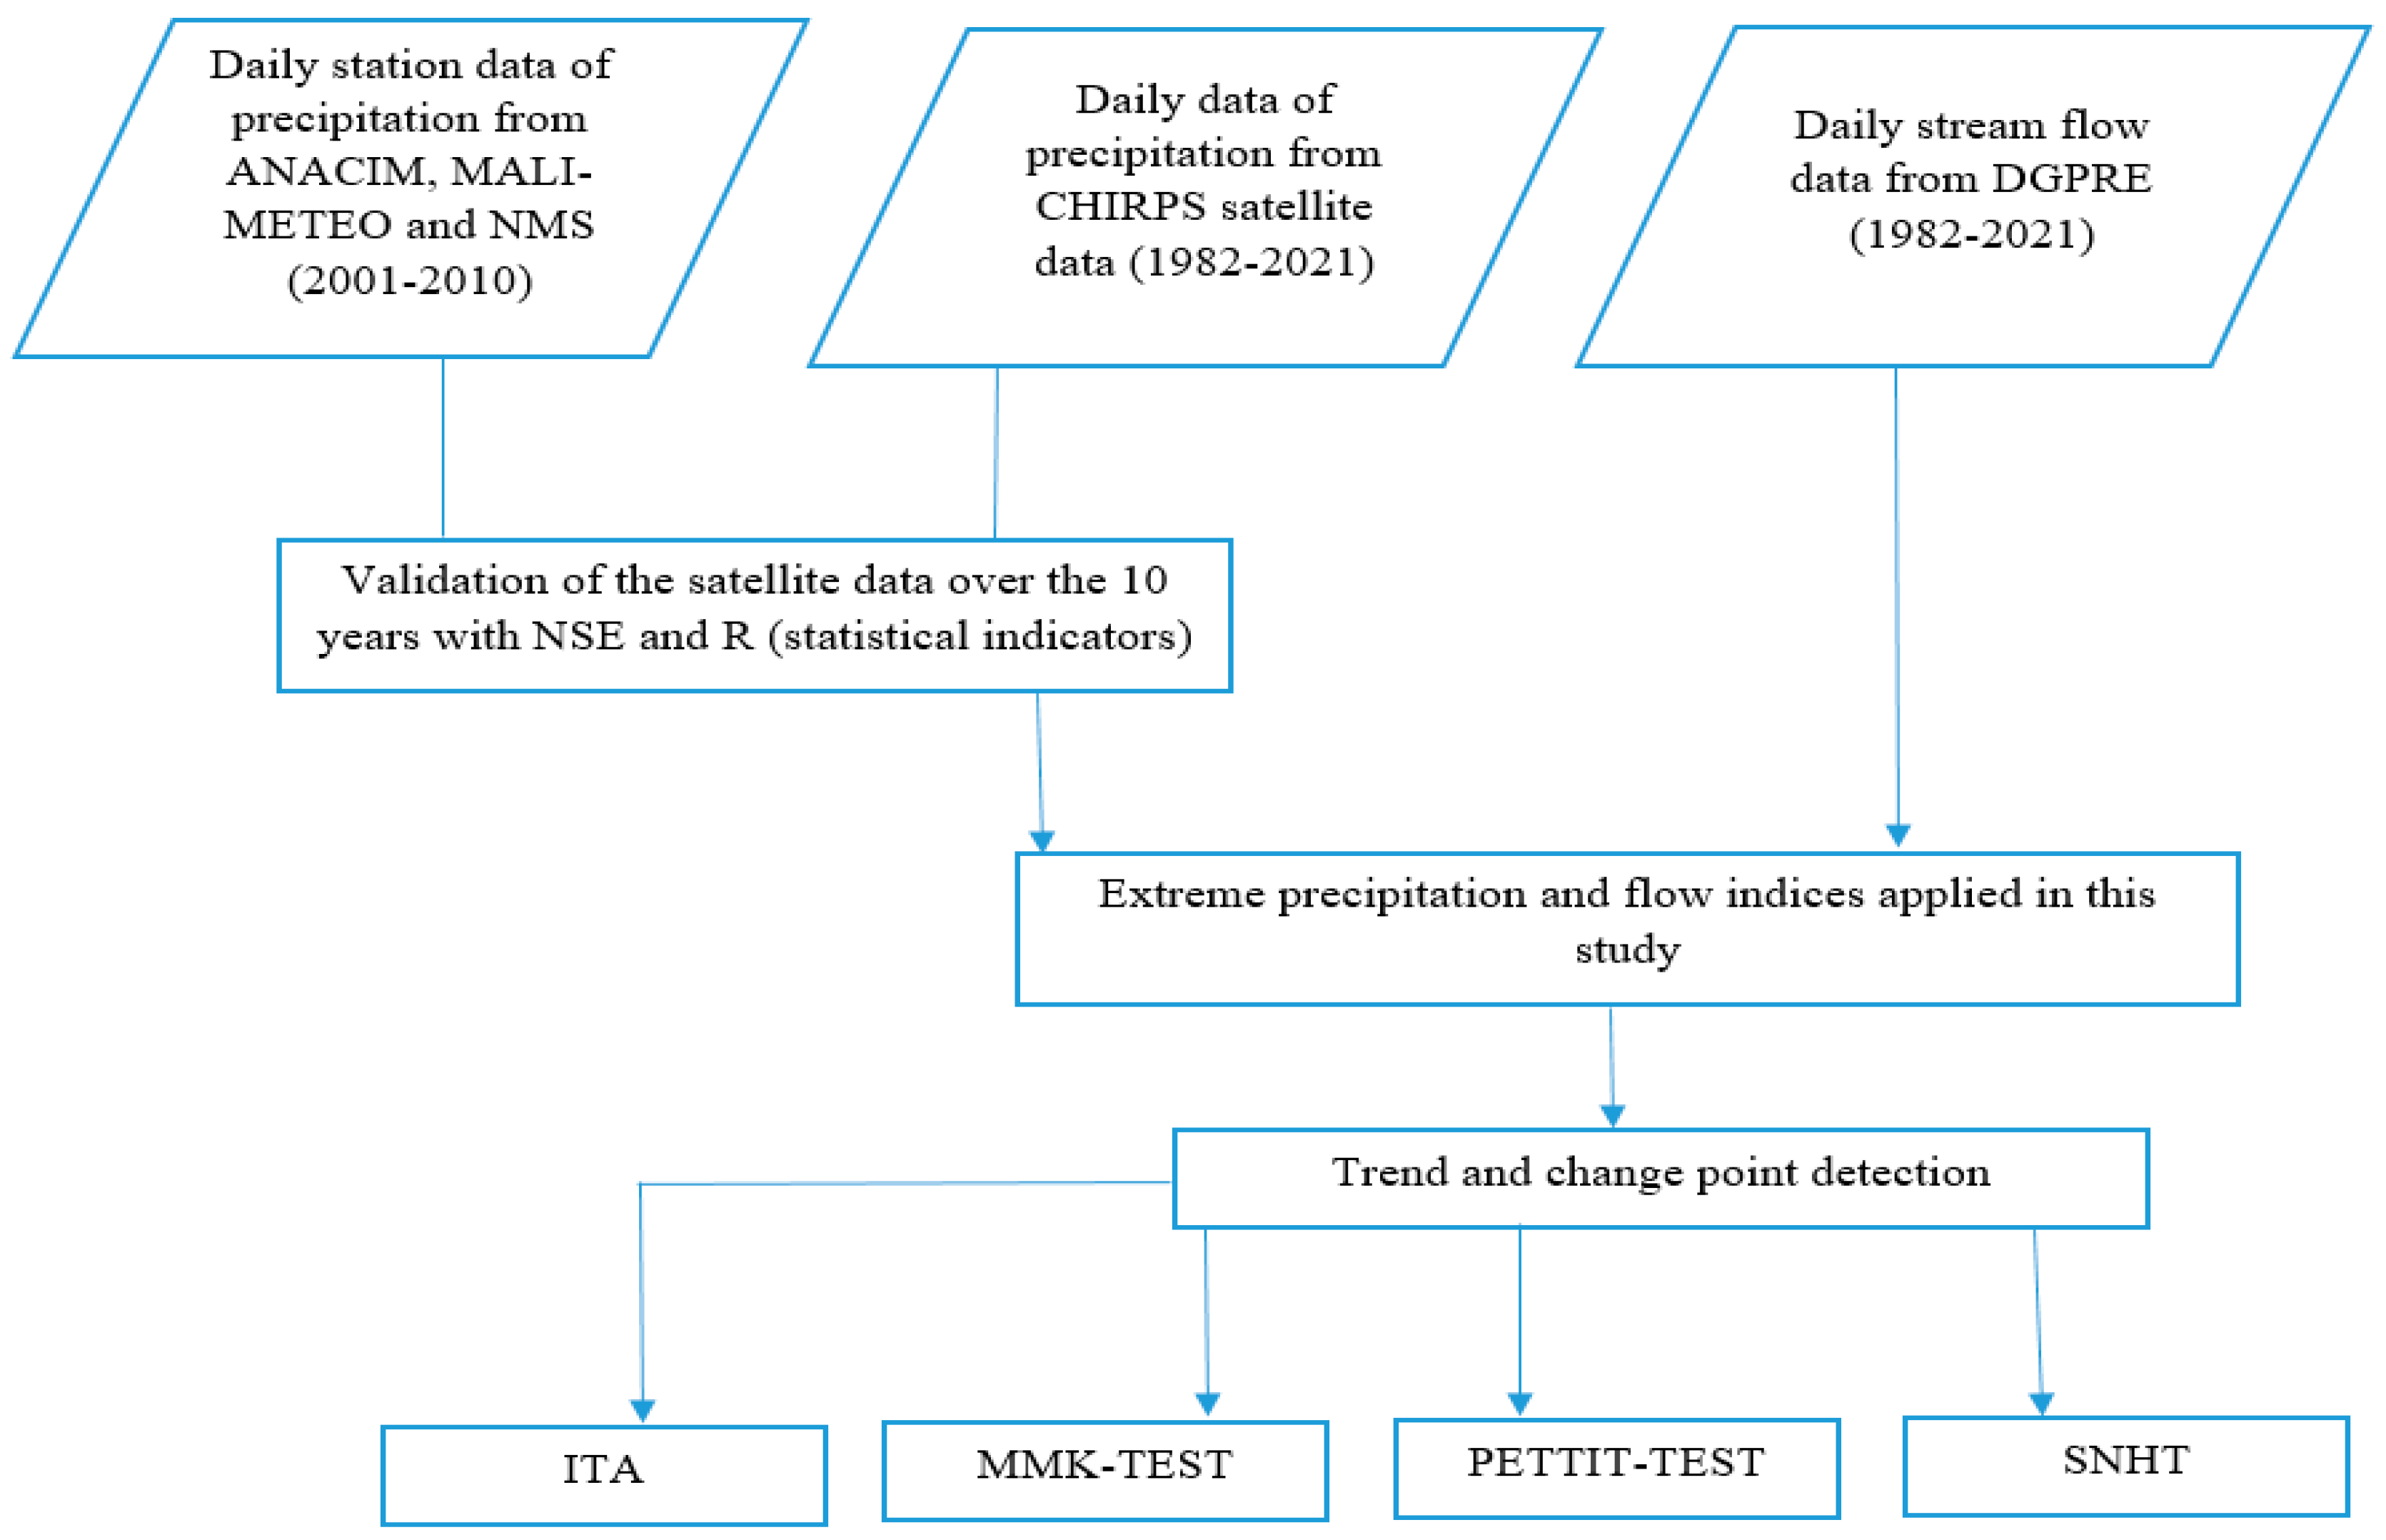
2.2. Data
2.3. Methods
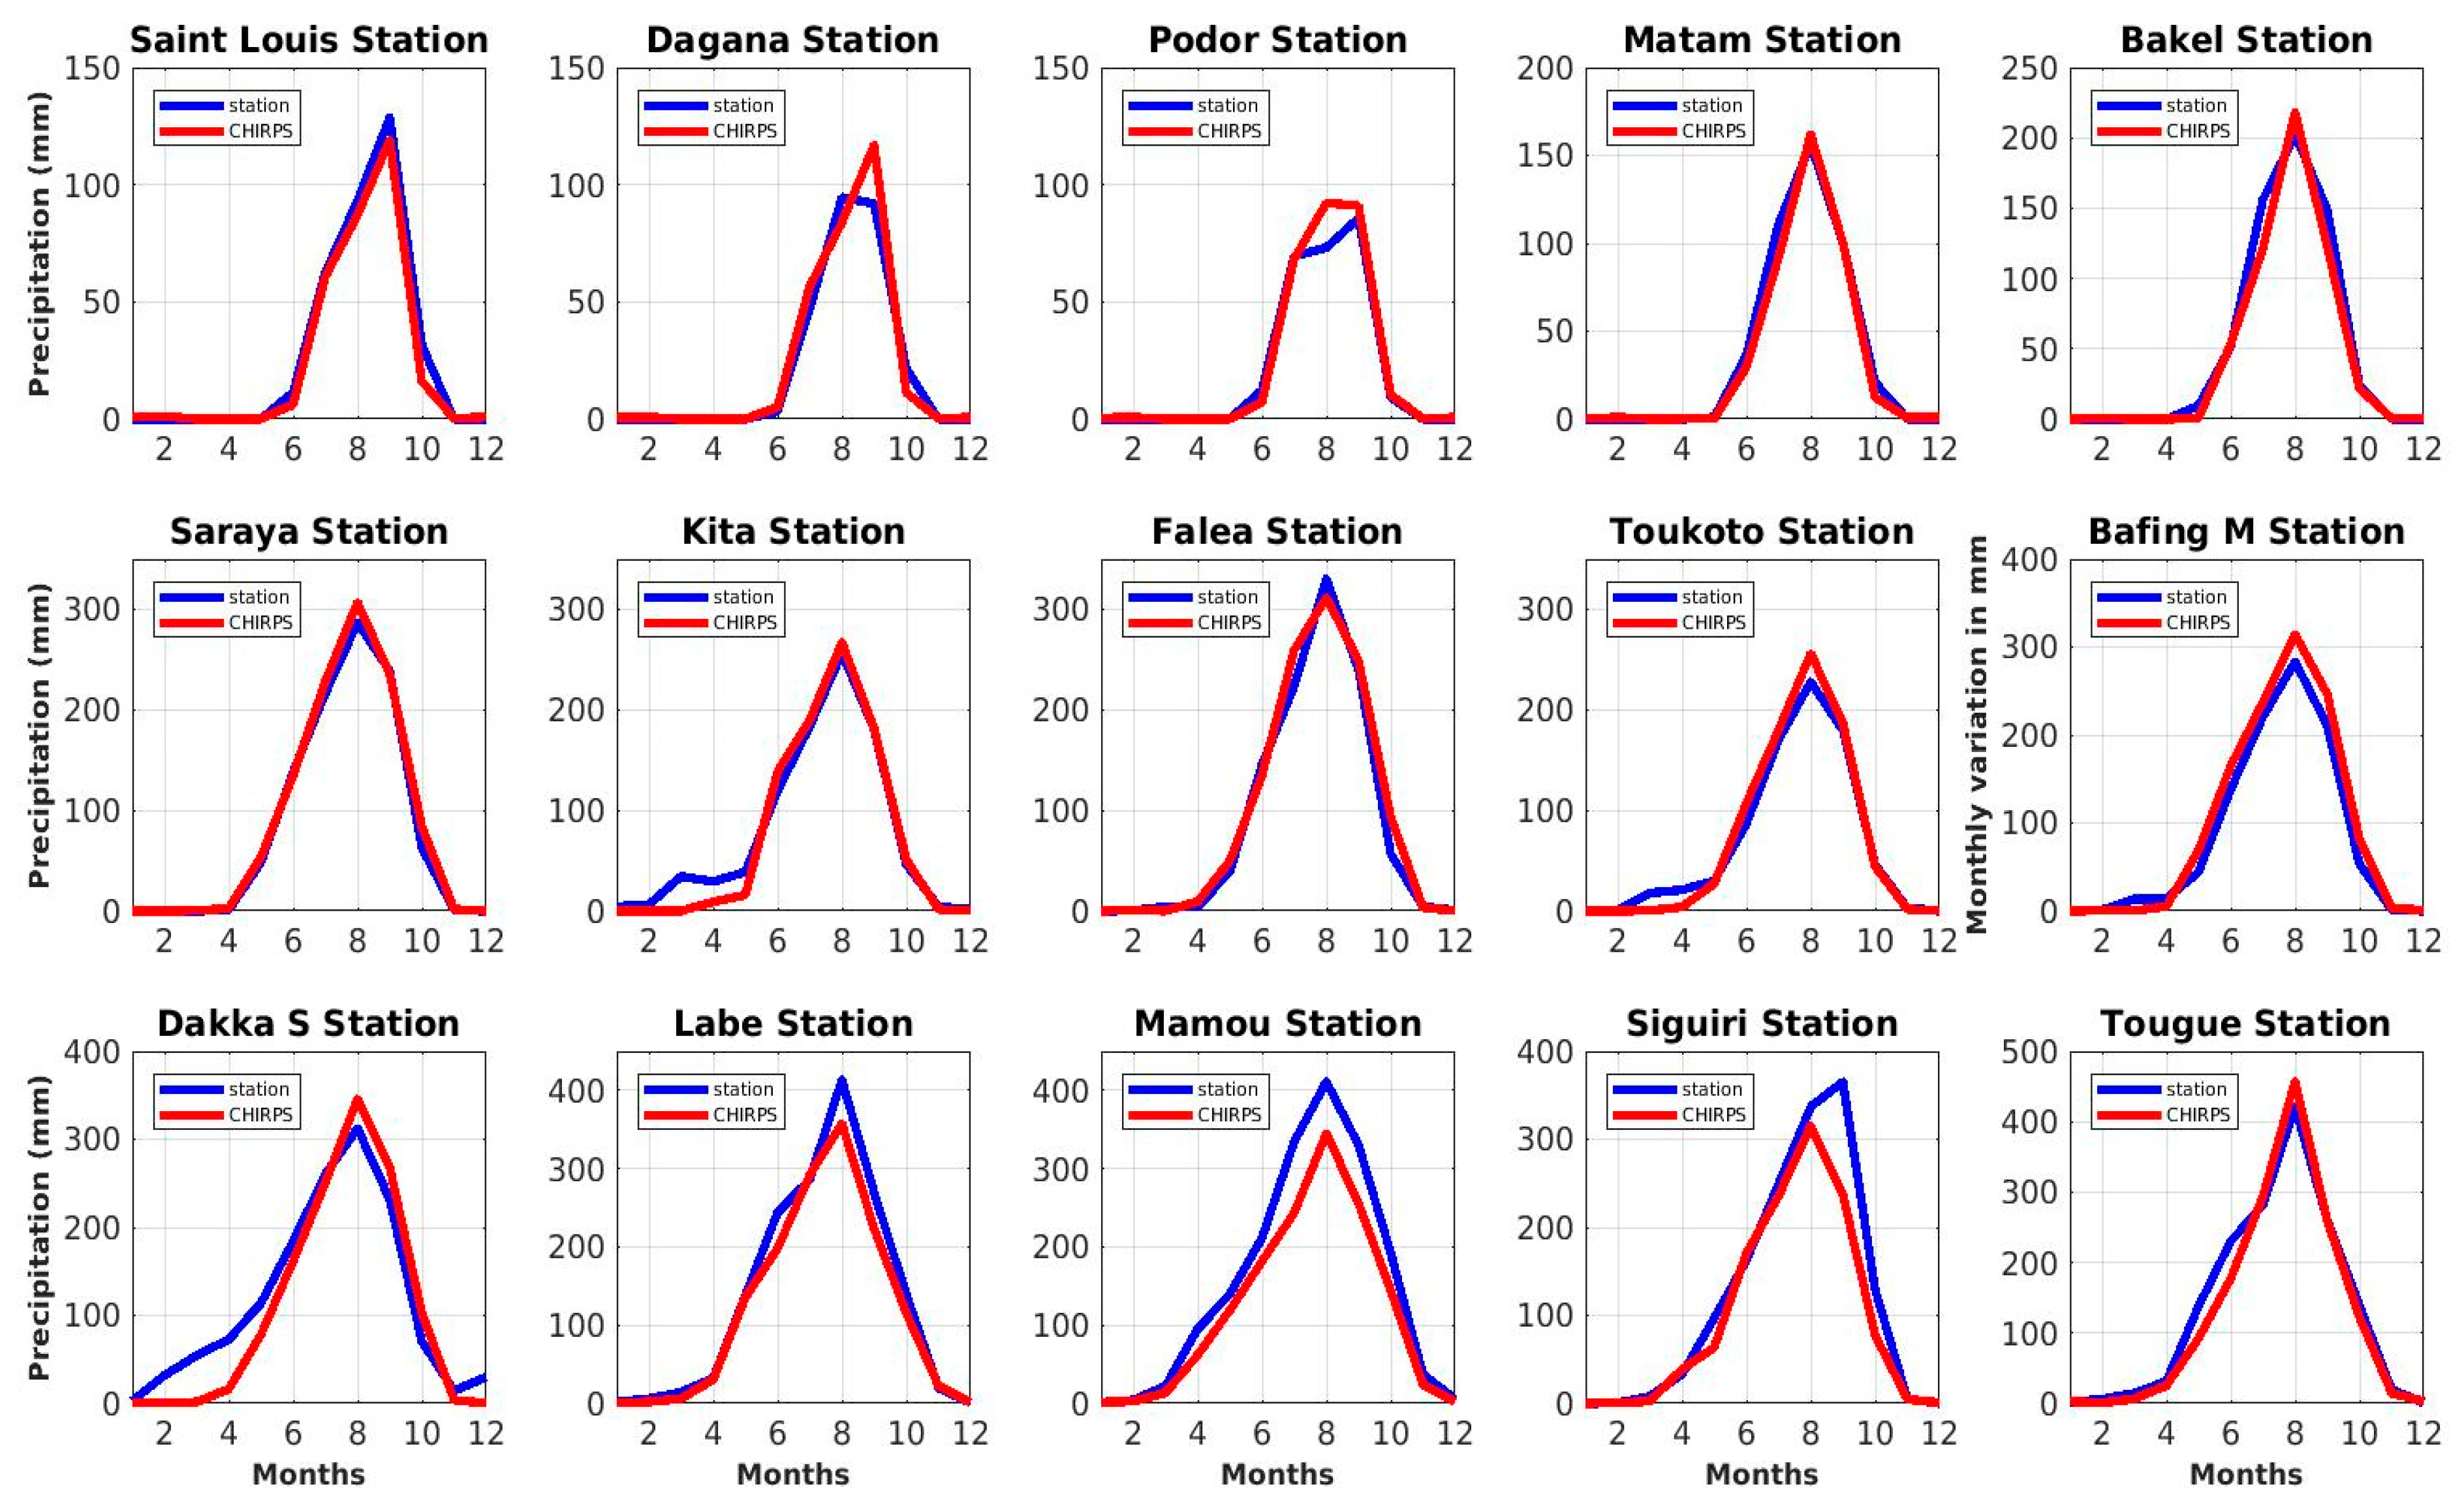
2.3.1. Comparison between Station and CHIRPS Rainfall Data
2.3.2. Description of Selected Rainfall and River Discharge Extreme Indices
2.3.3. Trend and Change-Point Detection
- Tests for Trend Analysis
- Modified Mann–Kendall Test
- The trends in the data series (40 years) are evaluated using the modified Mann–Kendall test [37], which is a nonparametric test used in several studies [38,39,40,41].The selection of MMK can be justified by its consideration of the autocorrelation effect present in the data. The presence of autocorrelation in the data disrupts the classical Mann–Kendall test by introducing outliers. Positive autocorrelation increases the risk of false detection of an overestimated trend, while negative autocorrelation alters the risk of false detection of an underestimated trend. Therefore, adjustments were made to the Mann–Kendall test (MK) to account for this autocorrelation phenomenon.The latter does not impose stringent requirements on data distribution in hydrological and climatic time series, unlike some other parametric trend testing methods [42].Modified MK tests can be more complex to implement and interpret than the traditional MK test. They may require additional steps for tied data adjustment, seasonal decomposition, or handling missing data.The principle of this test is based on an adaptation of the statistic (S) used in the MK test. The modified MK was proposed by ref. [37] with the aim of considering autocorrelation in the series. The statistics allow for adjusting the variance accordingly.
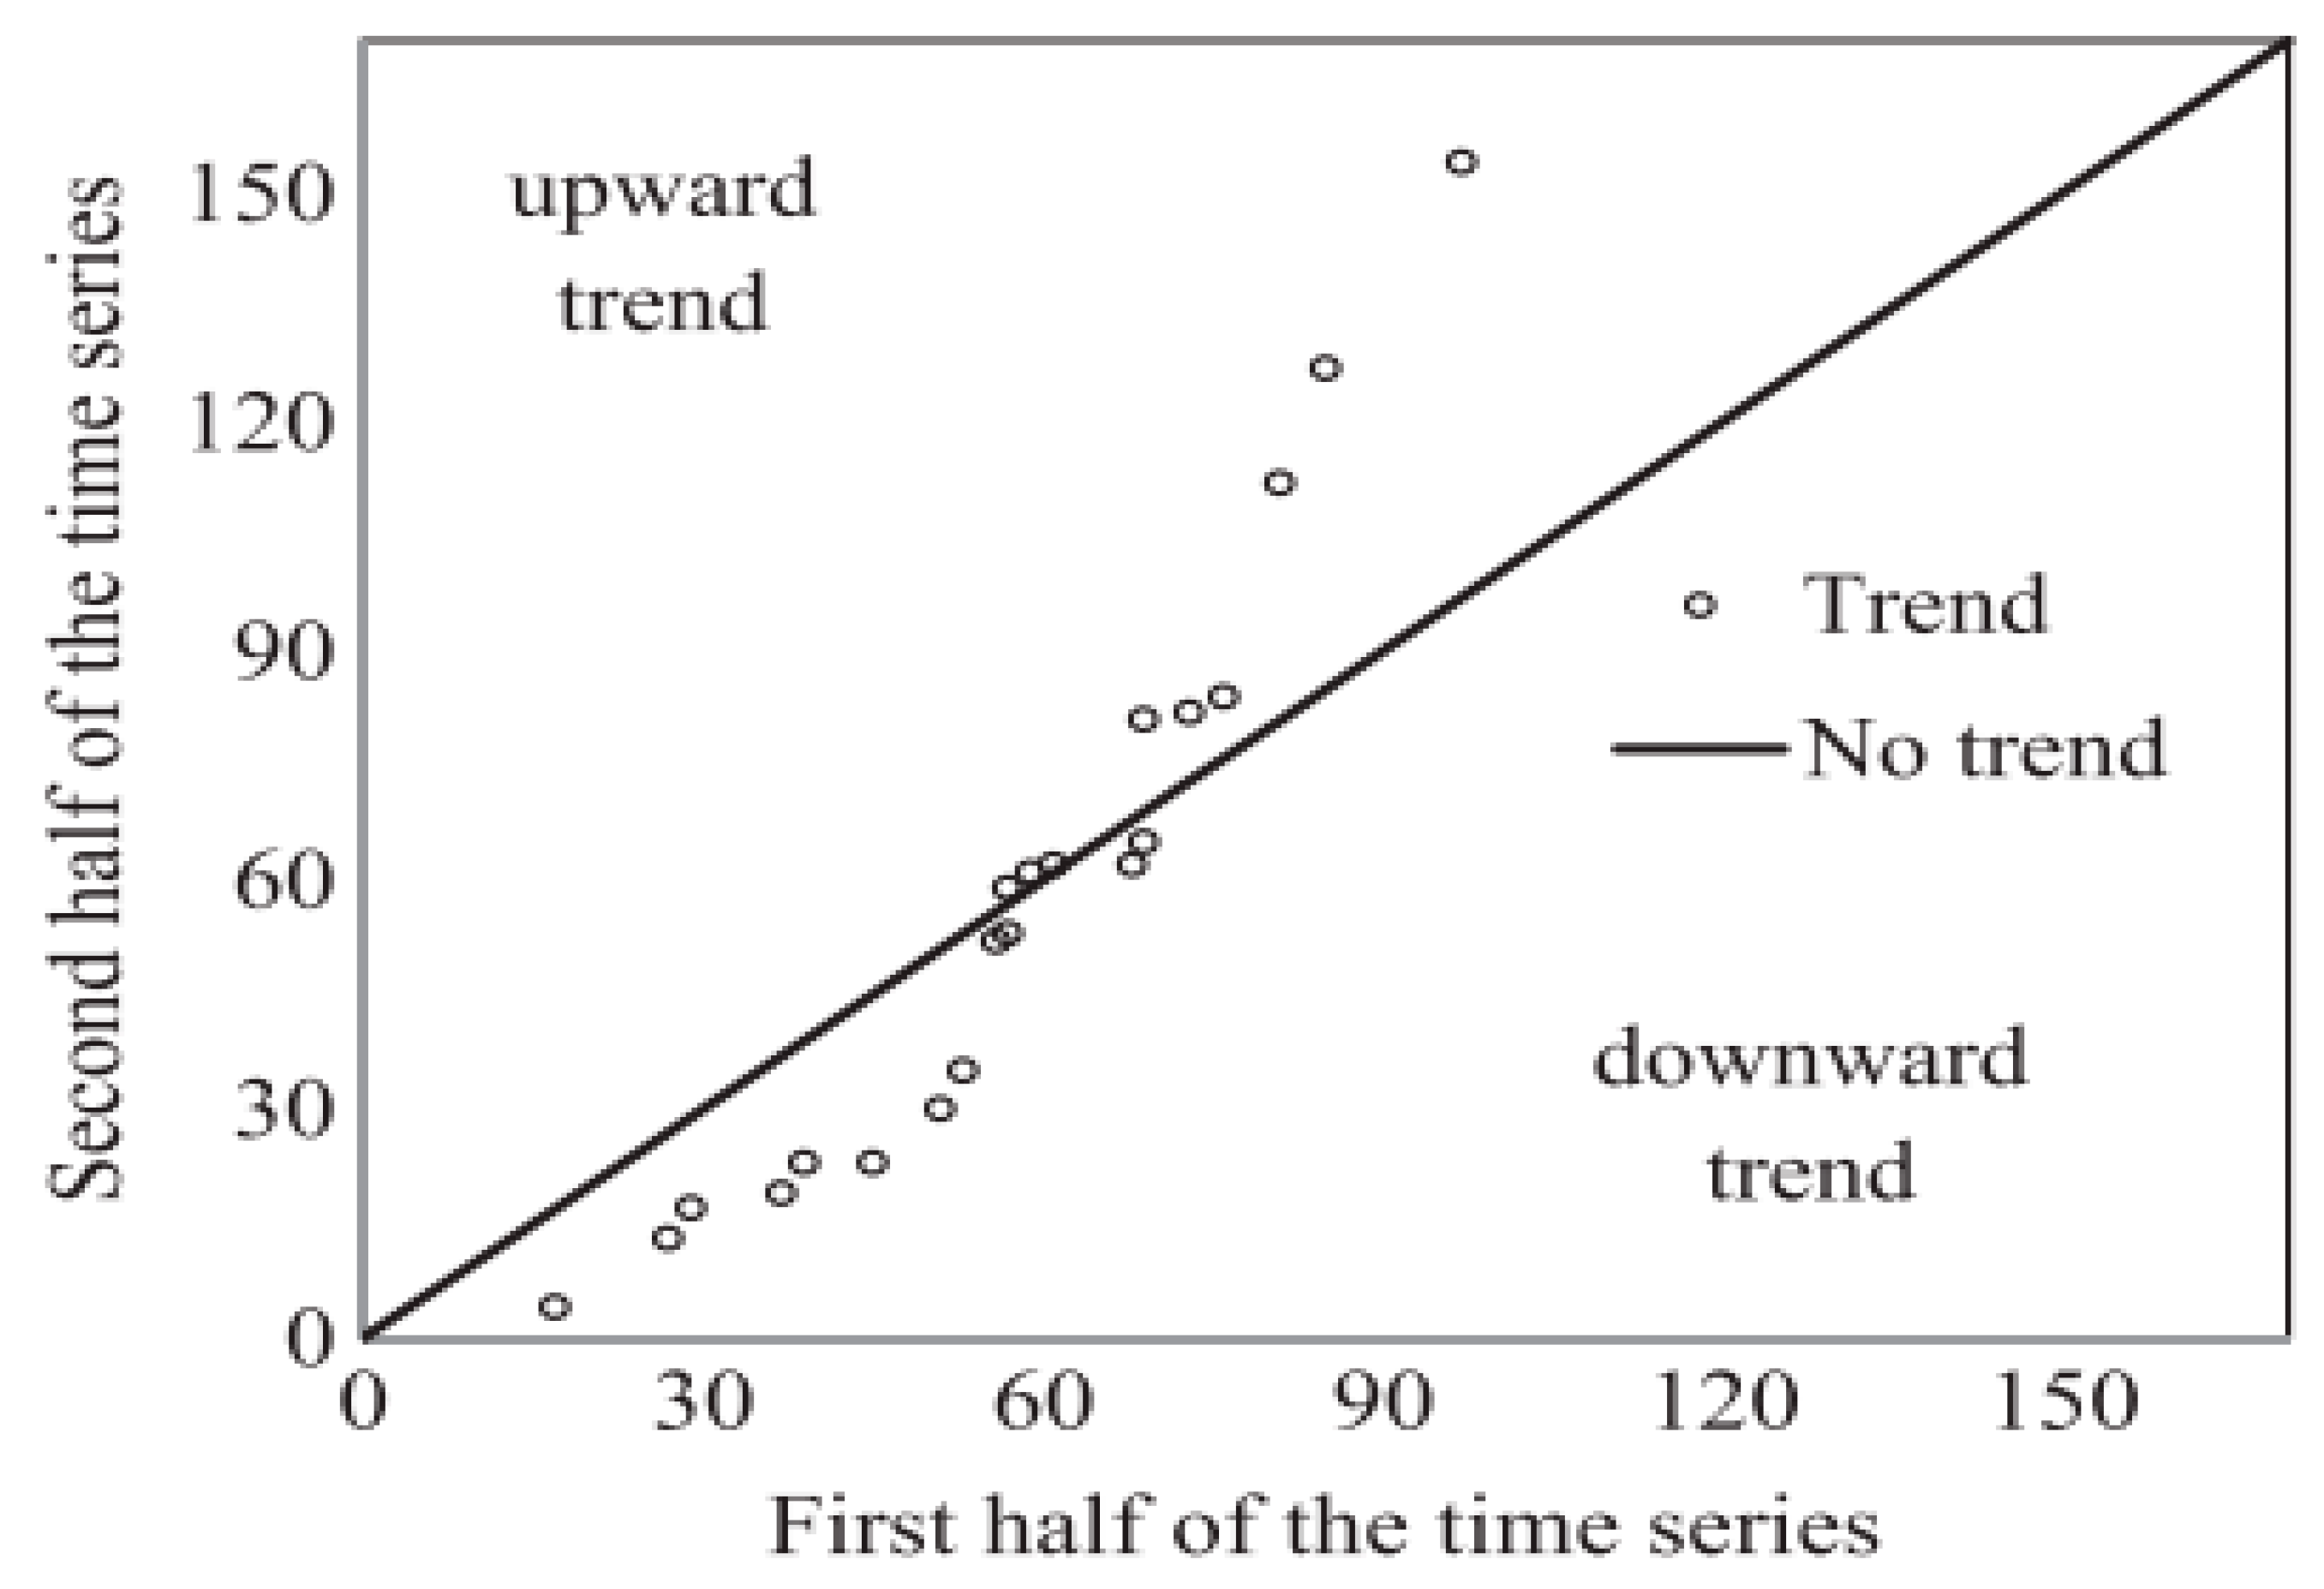
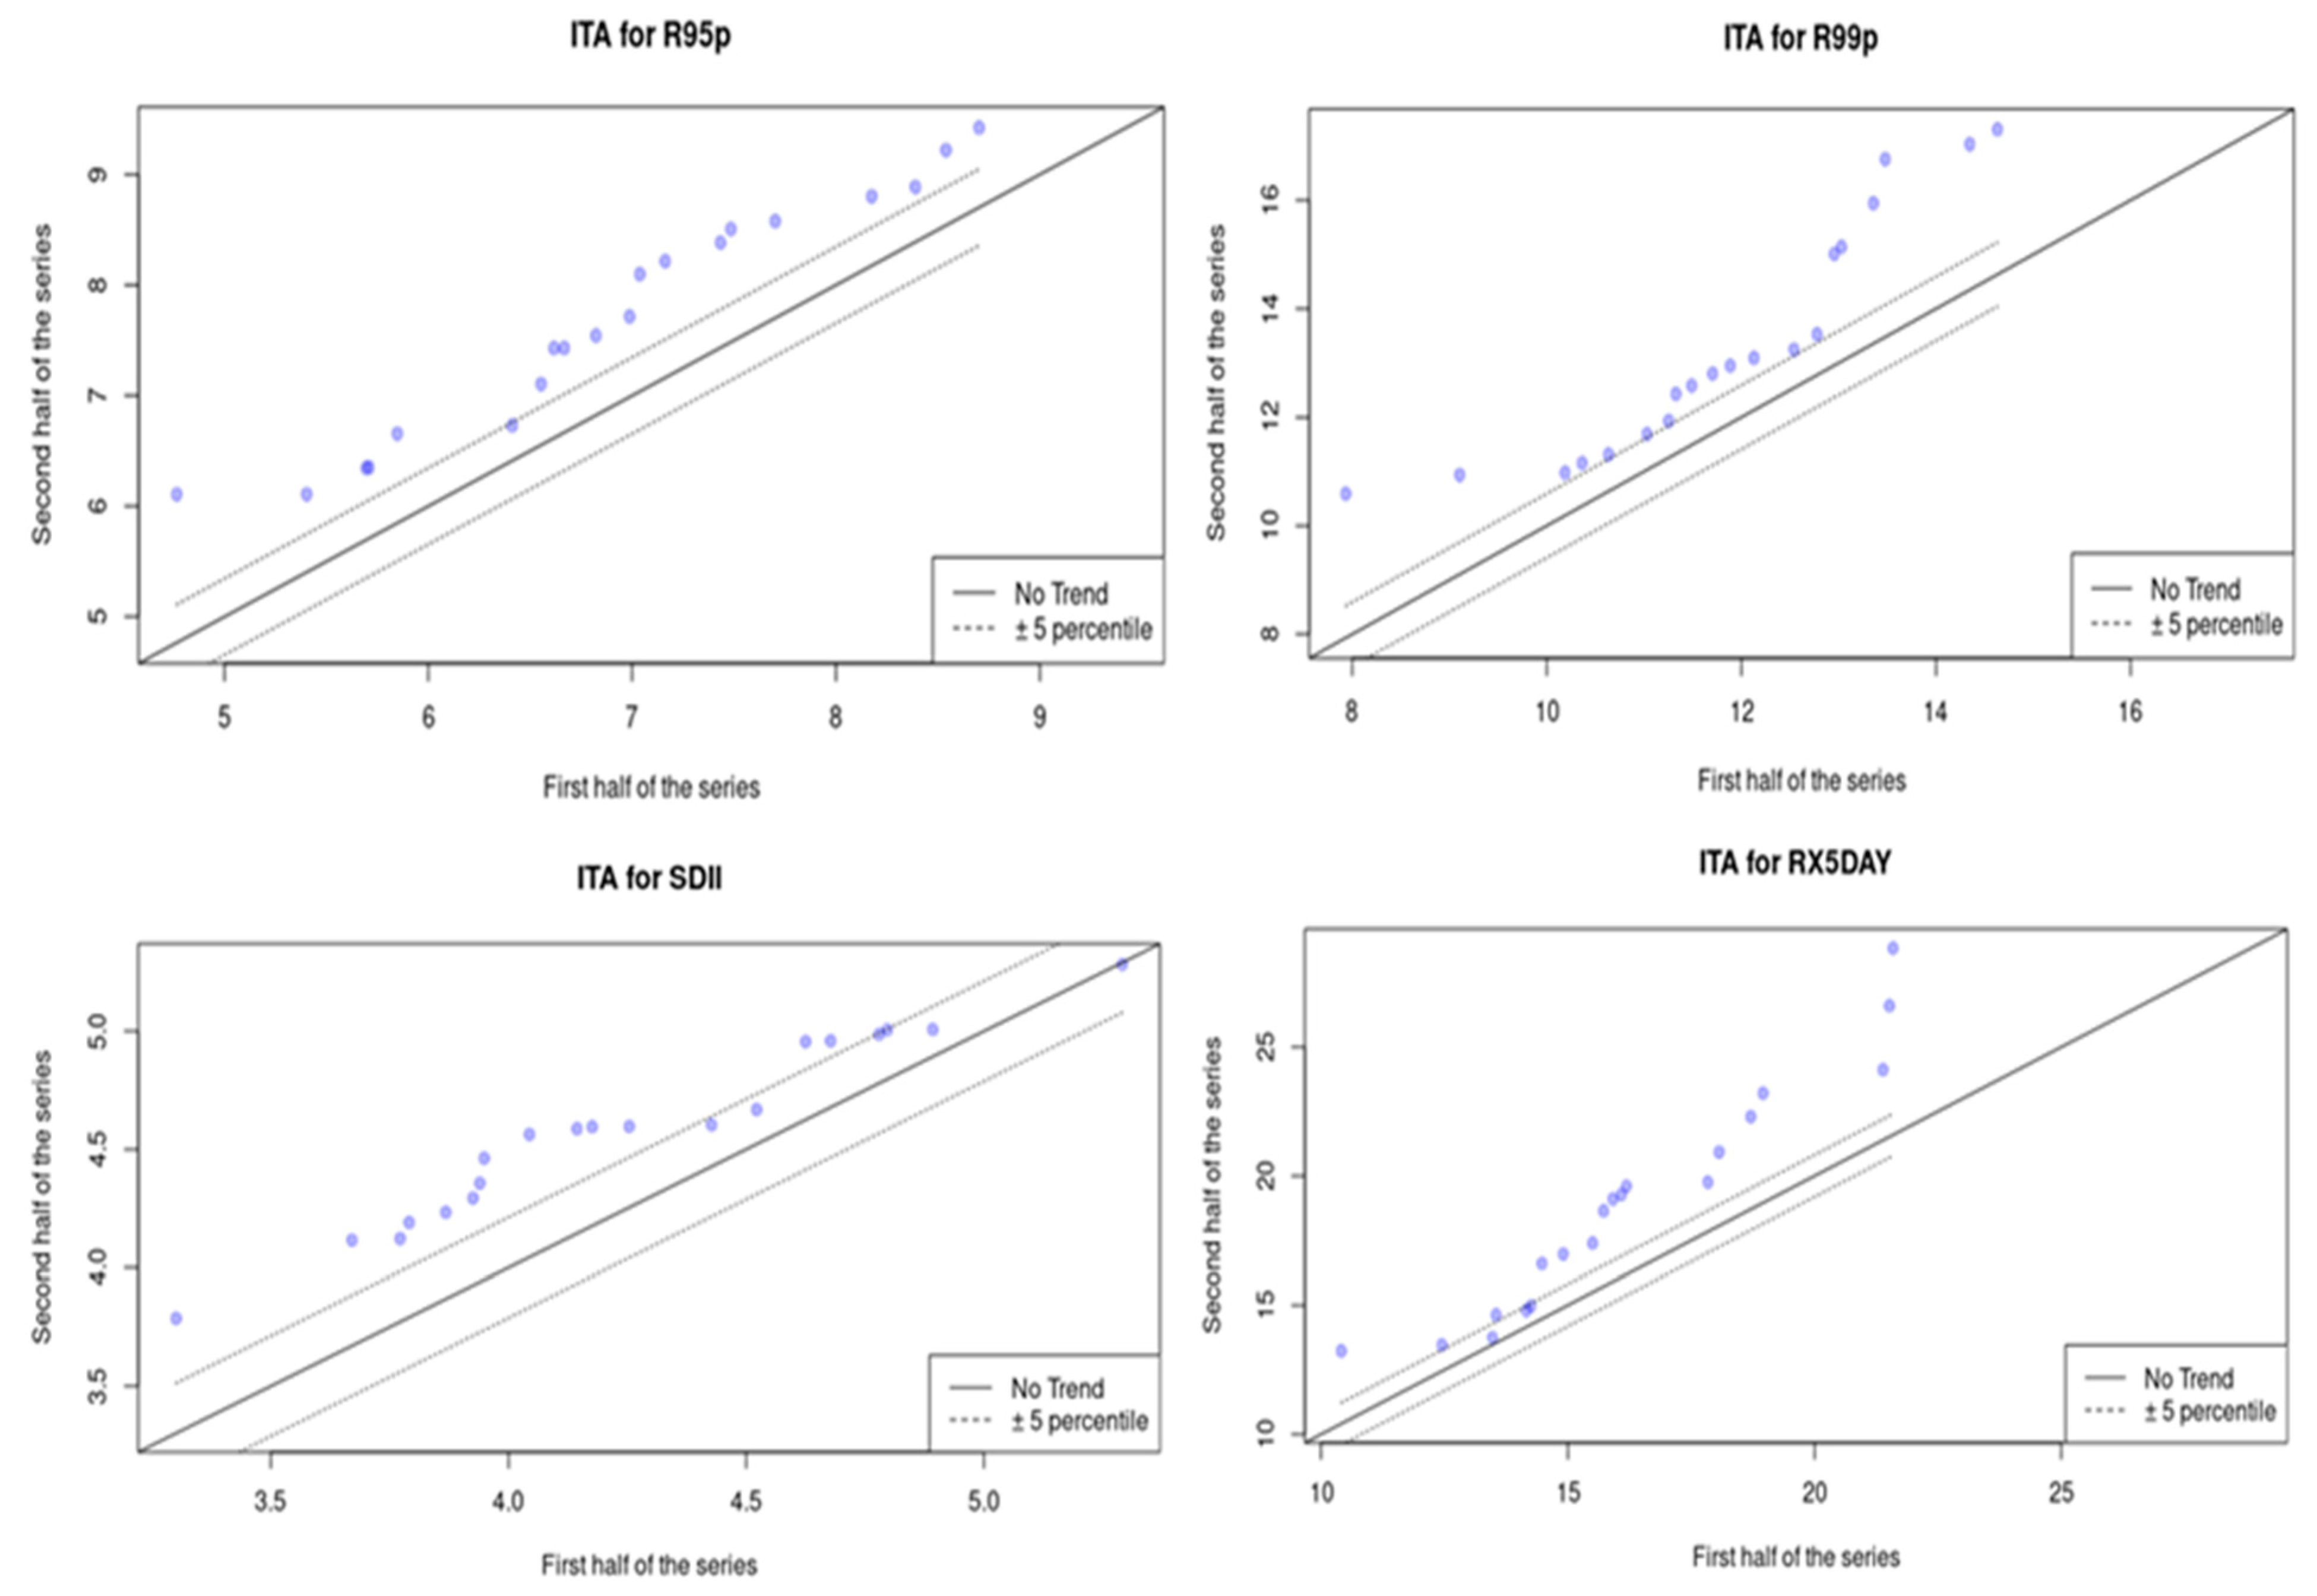
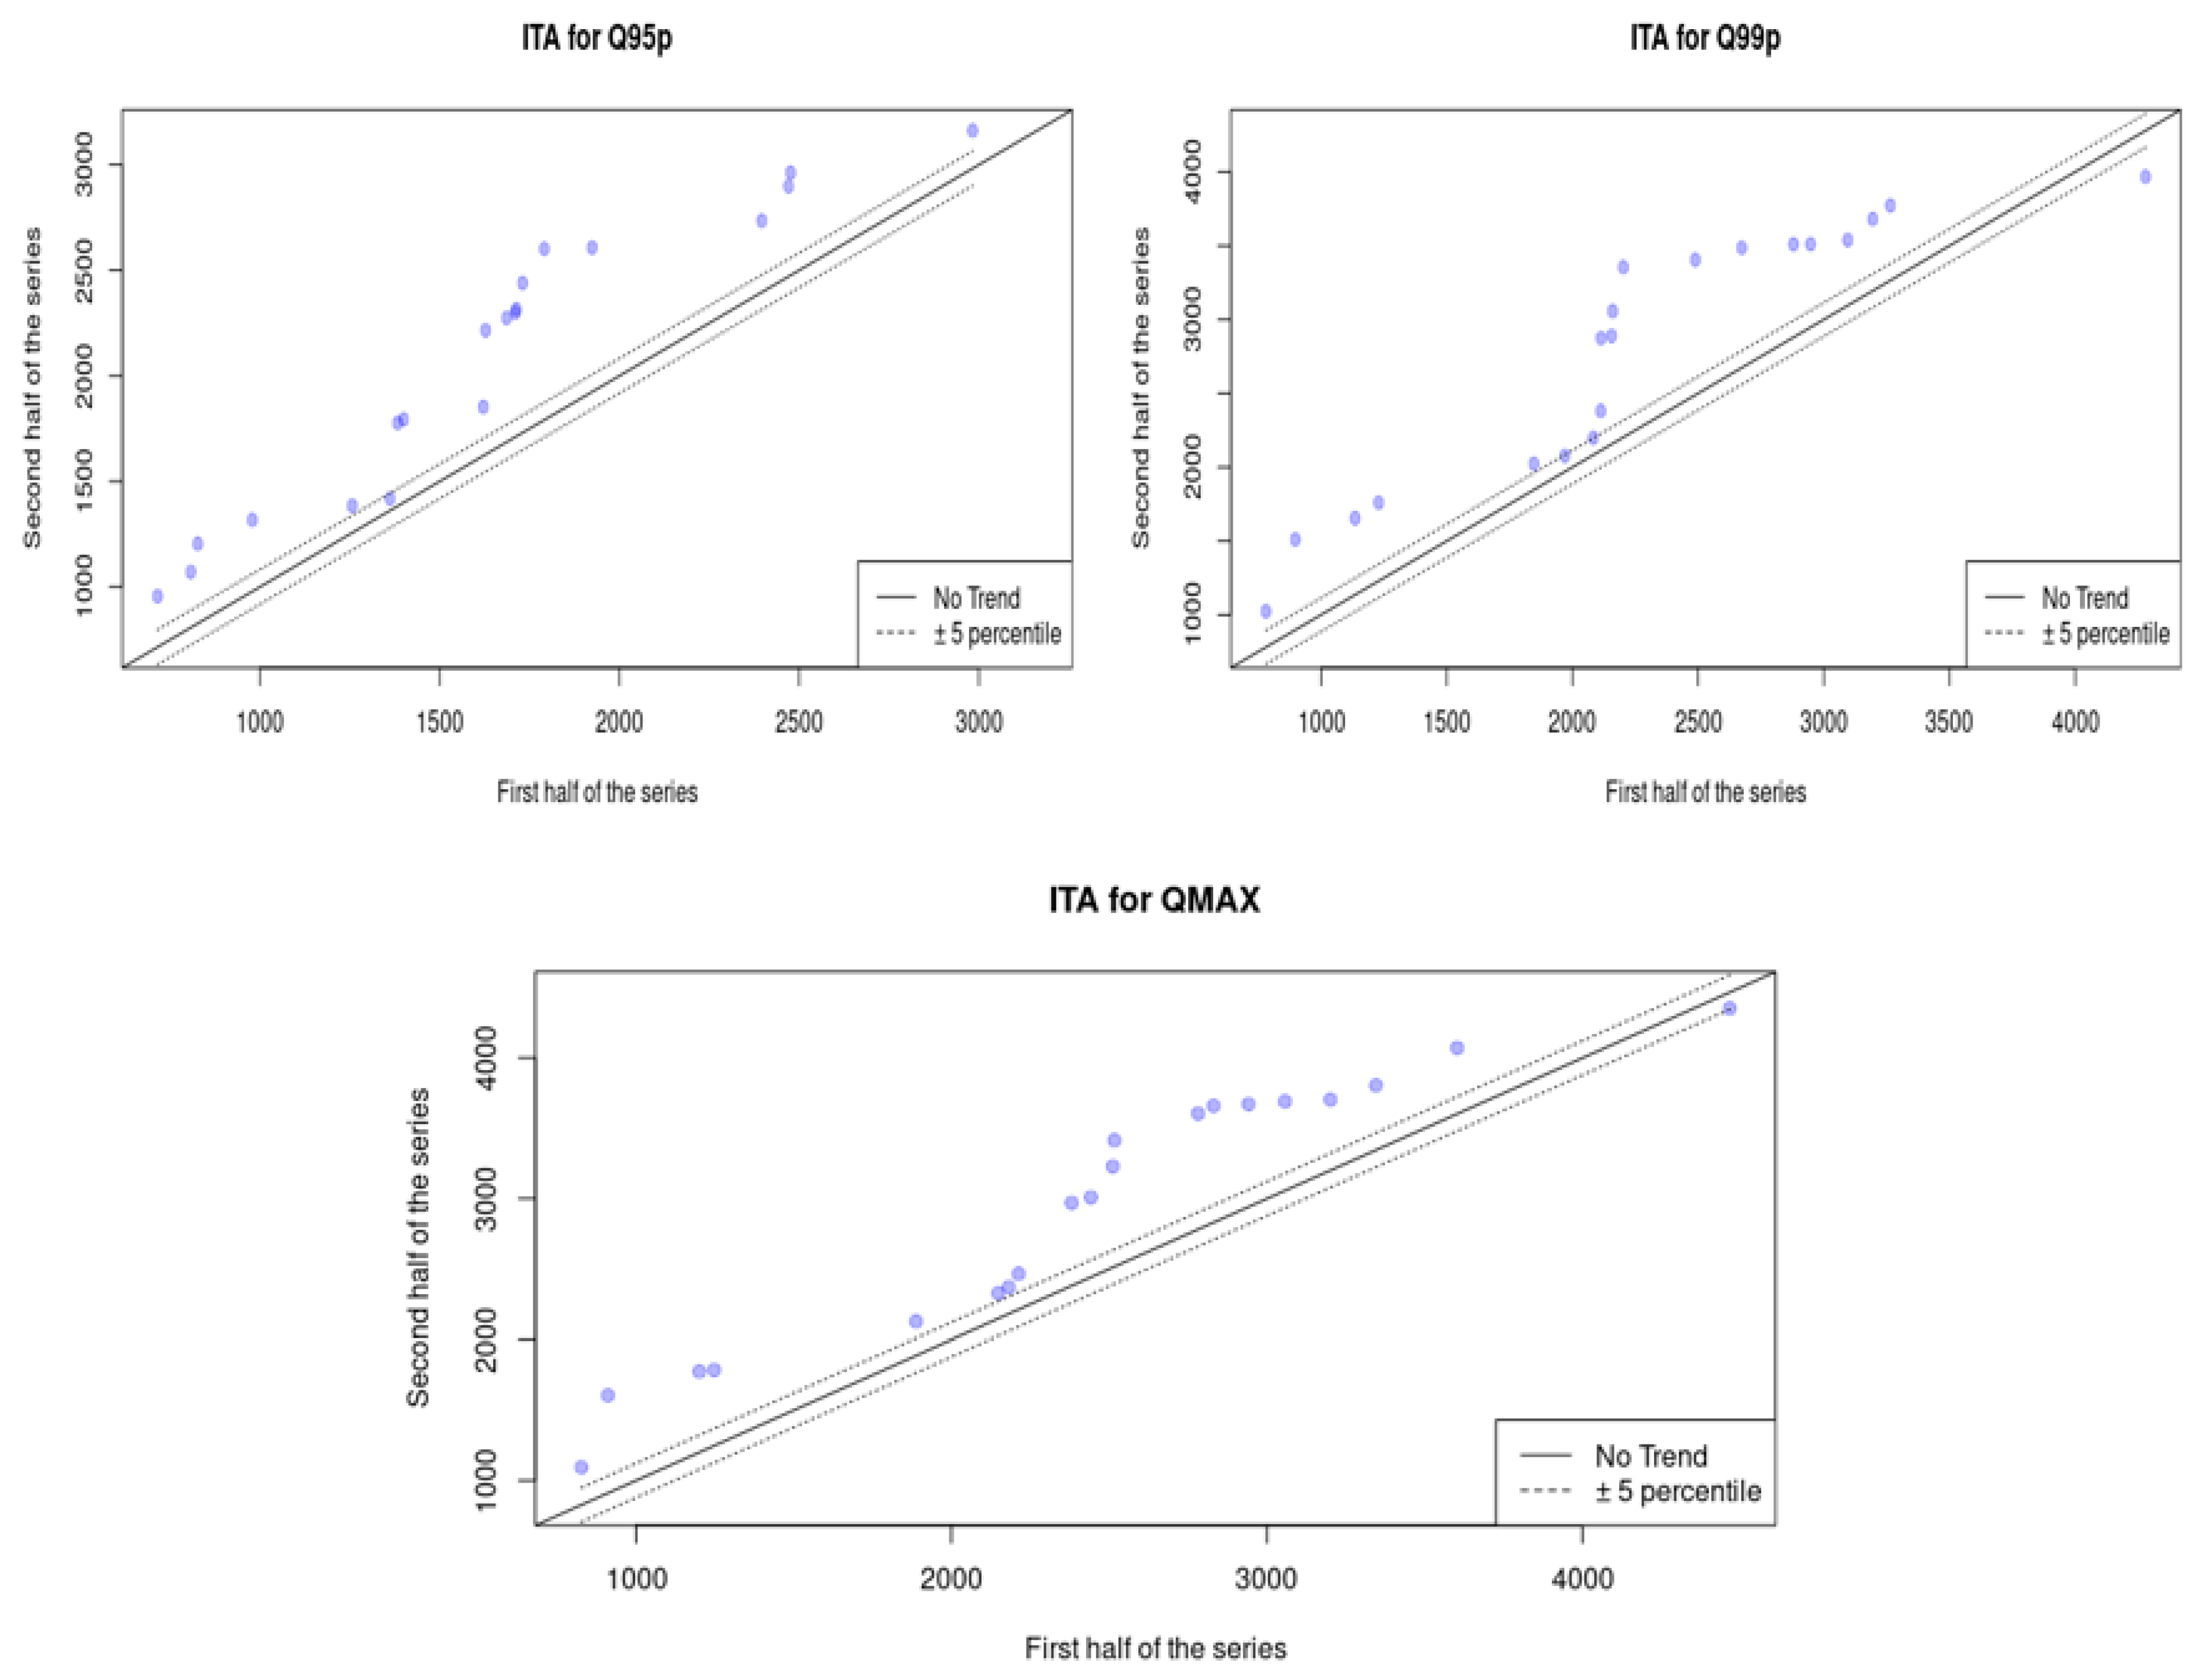
- Innovative Trend Analysis (ITA)
- 2.
- Change-Point Detection Tests
- Pettit’s Test
- Standard Normal Homogeneity Test (SNHT)
- This test’s sensitivity gives it the capability to detect discontinuities at both the beginning and end of a series. Furthermore, it exhibits robustness in handling potential missing values, rendering it relatively straightforward yet highly effective compared with alternative tests. The application of the SNHT relies on the utilization of the following equation:
3. Results and Discussion
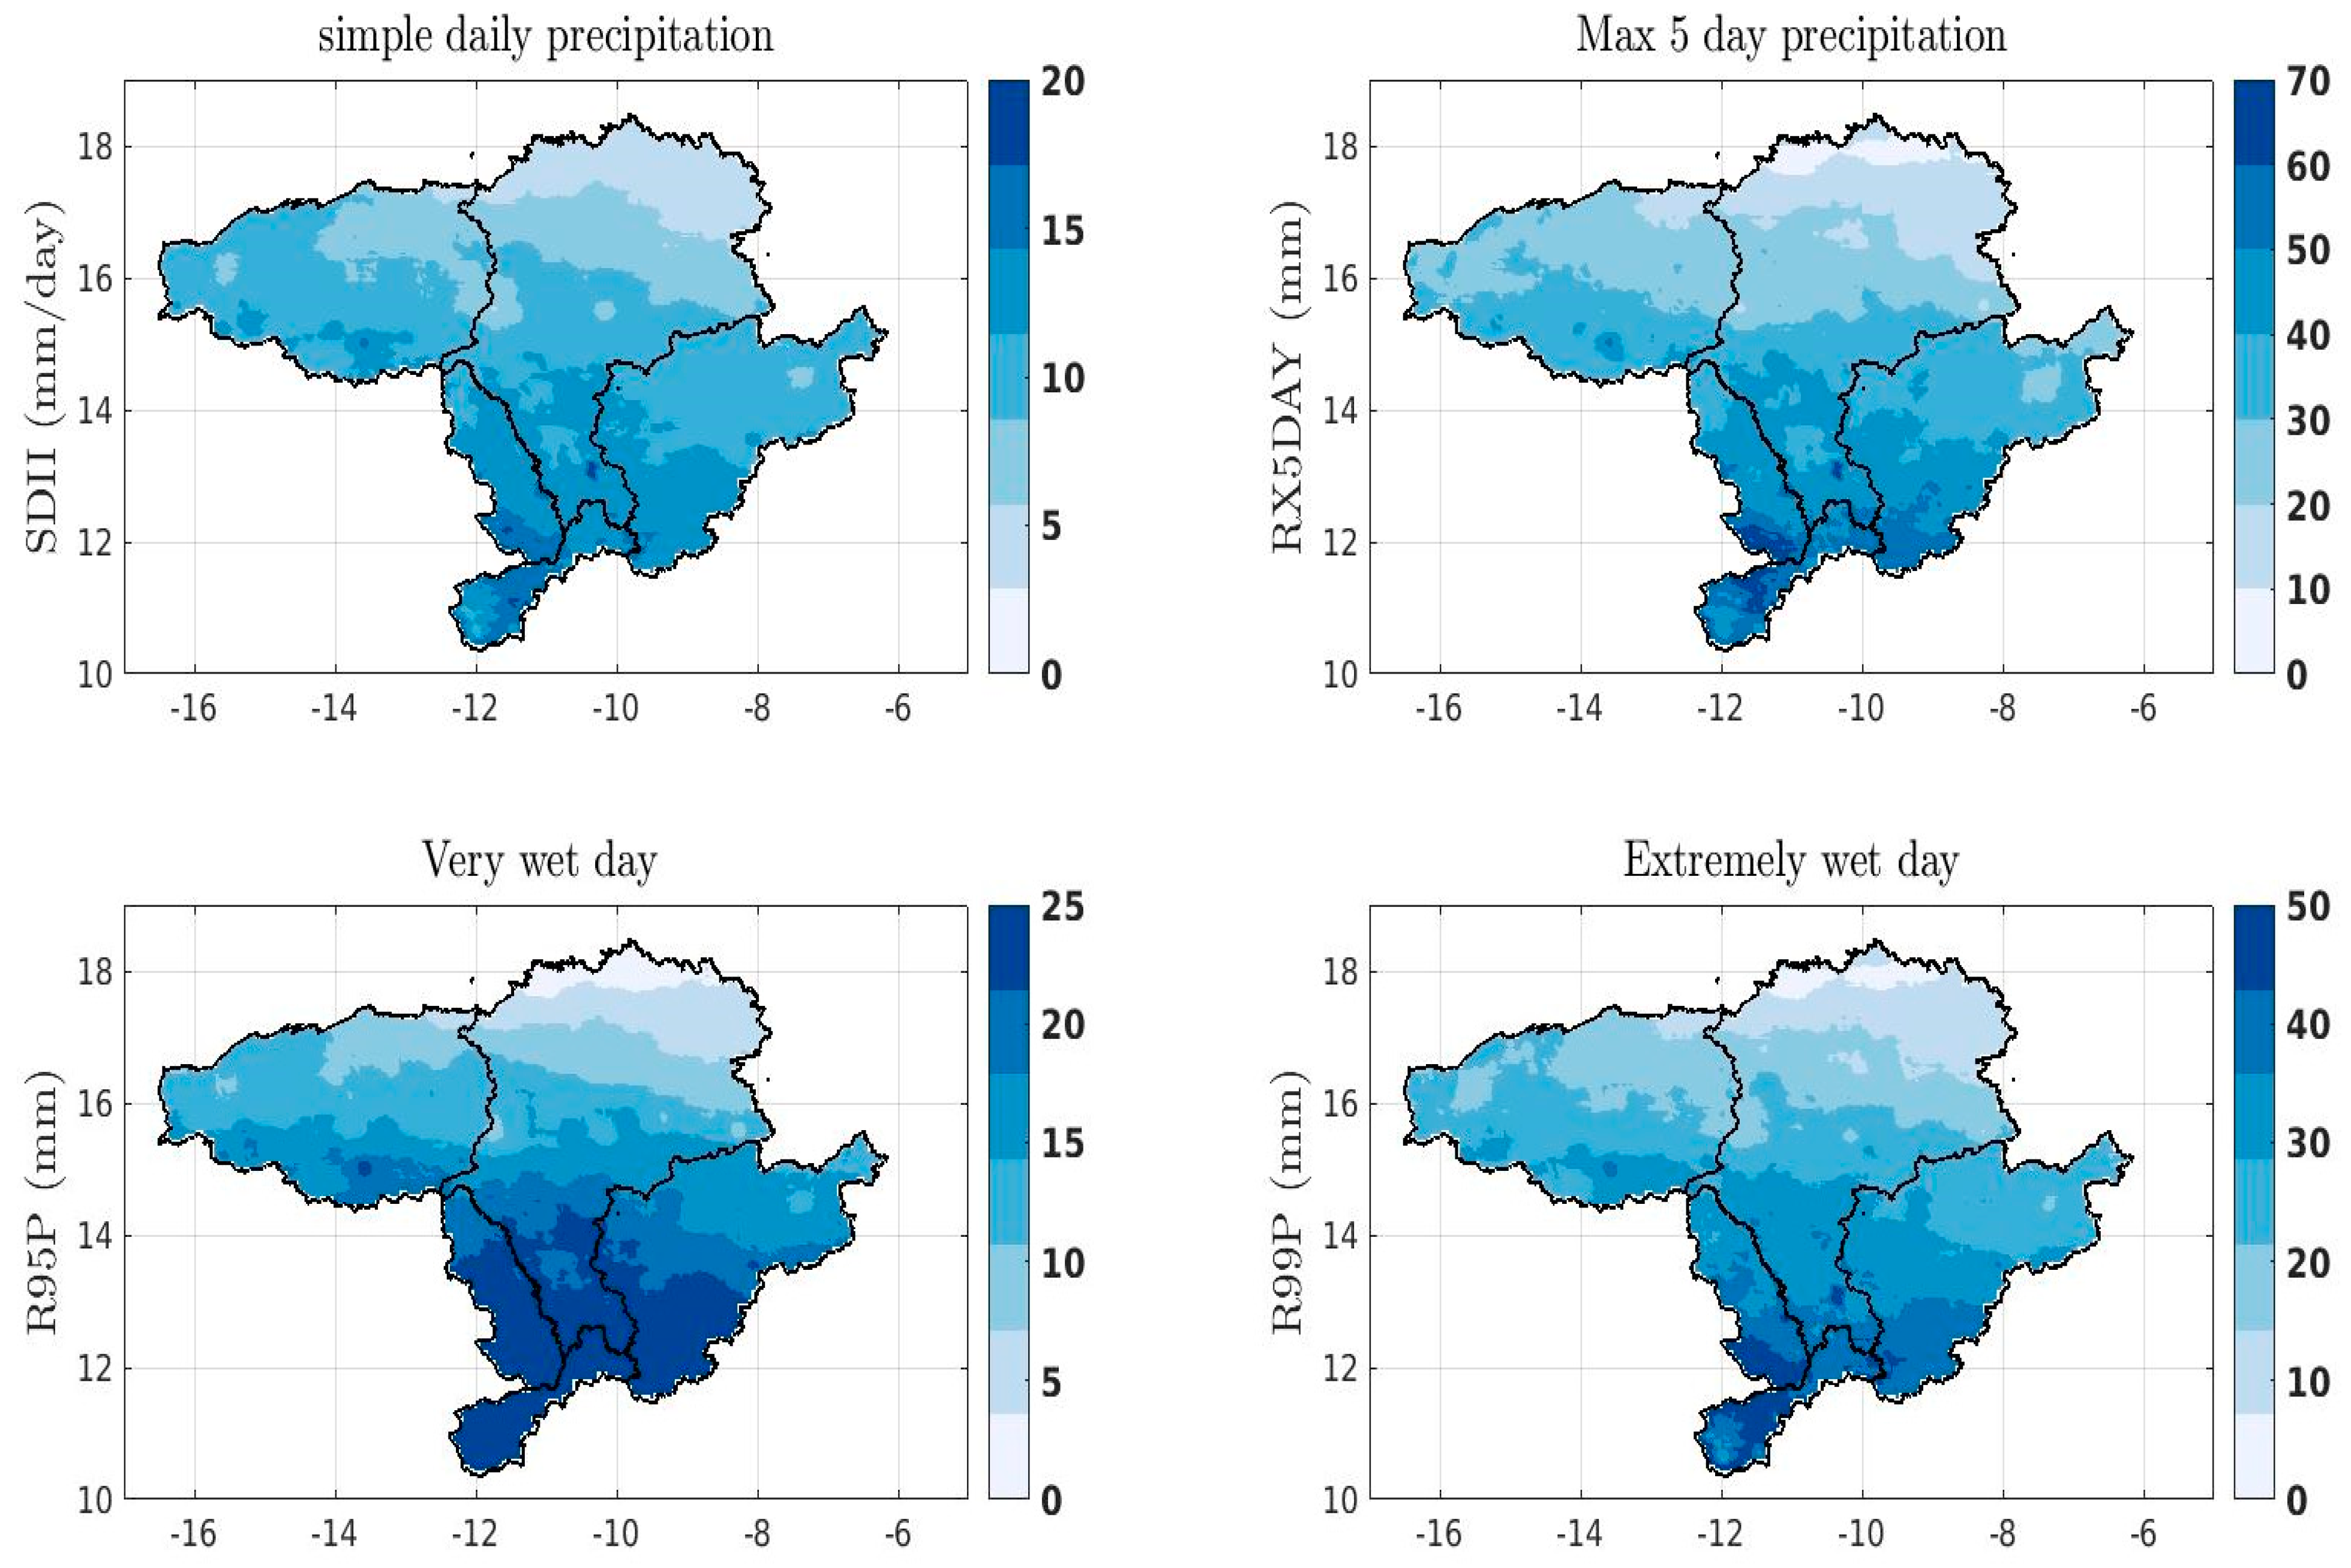
3.1. Spatial Variation in Extreme Rainfall Indices over the Senegal River Basin
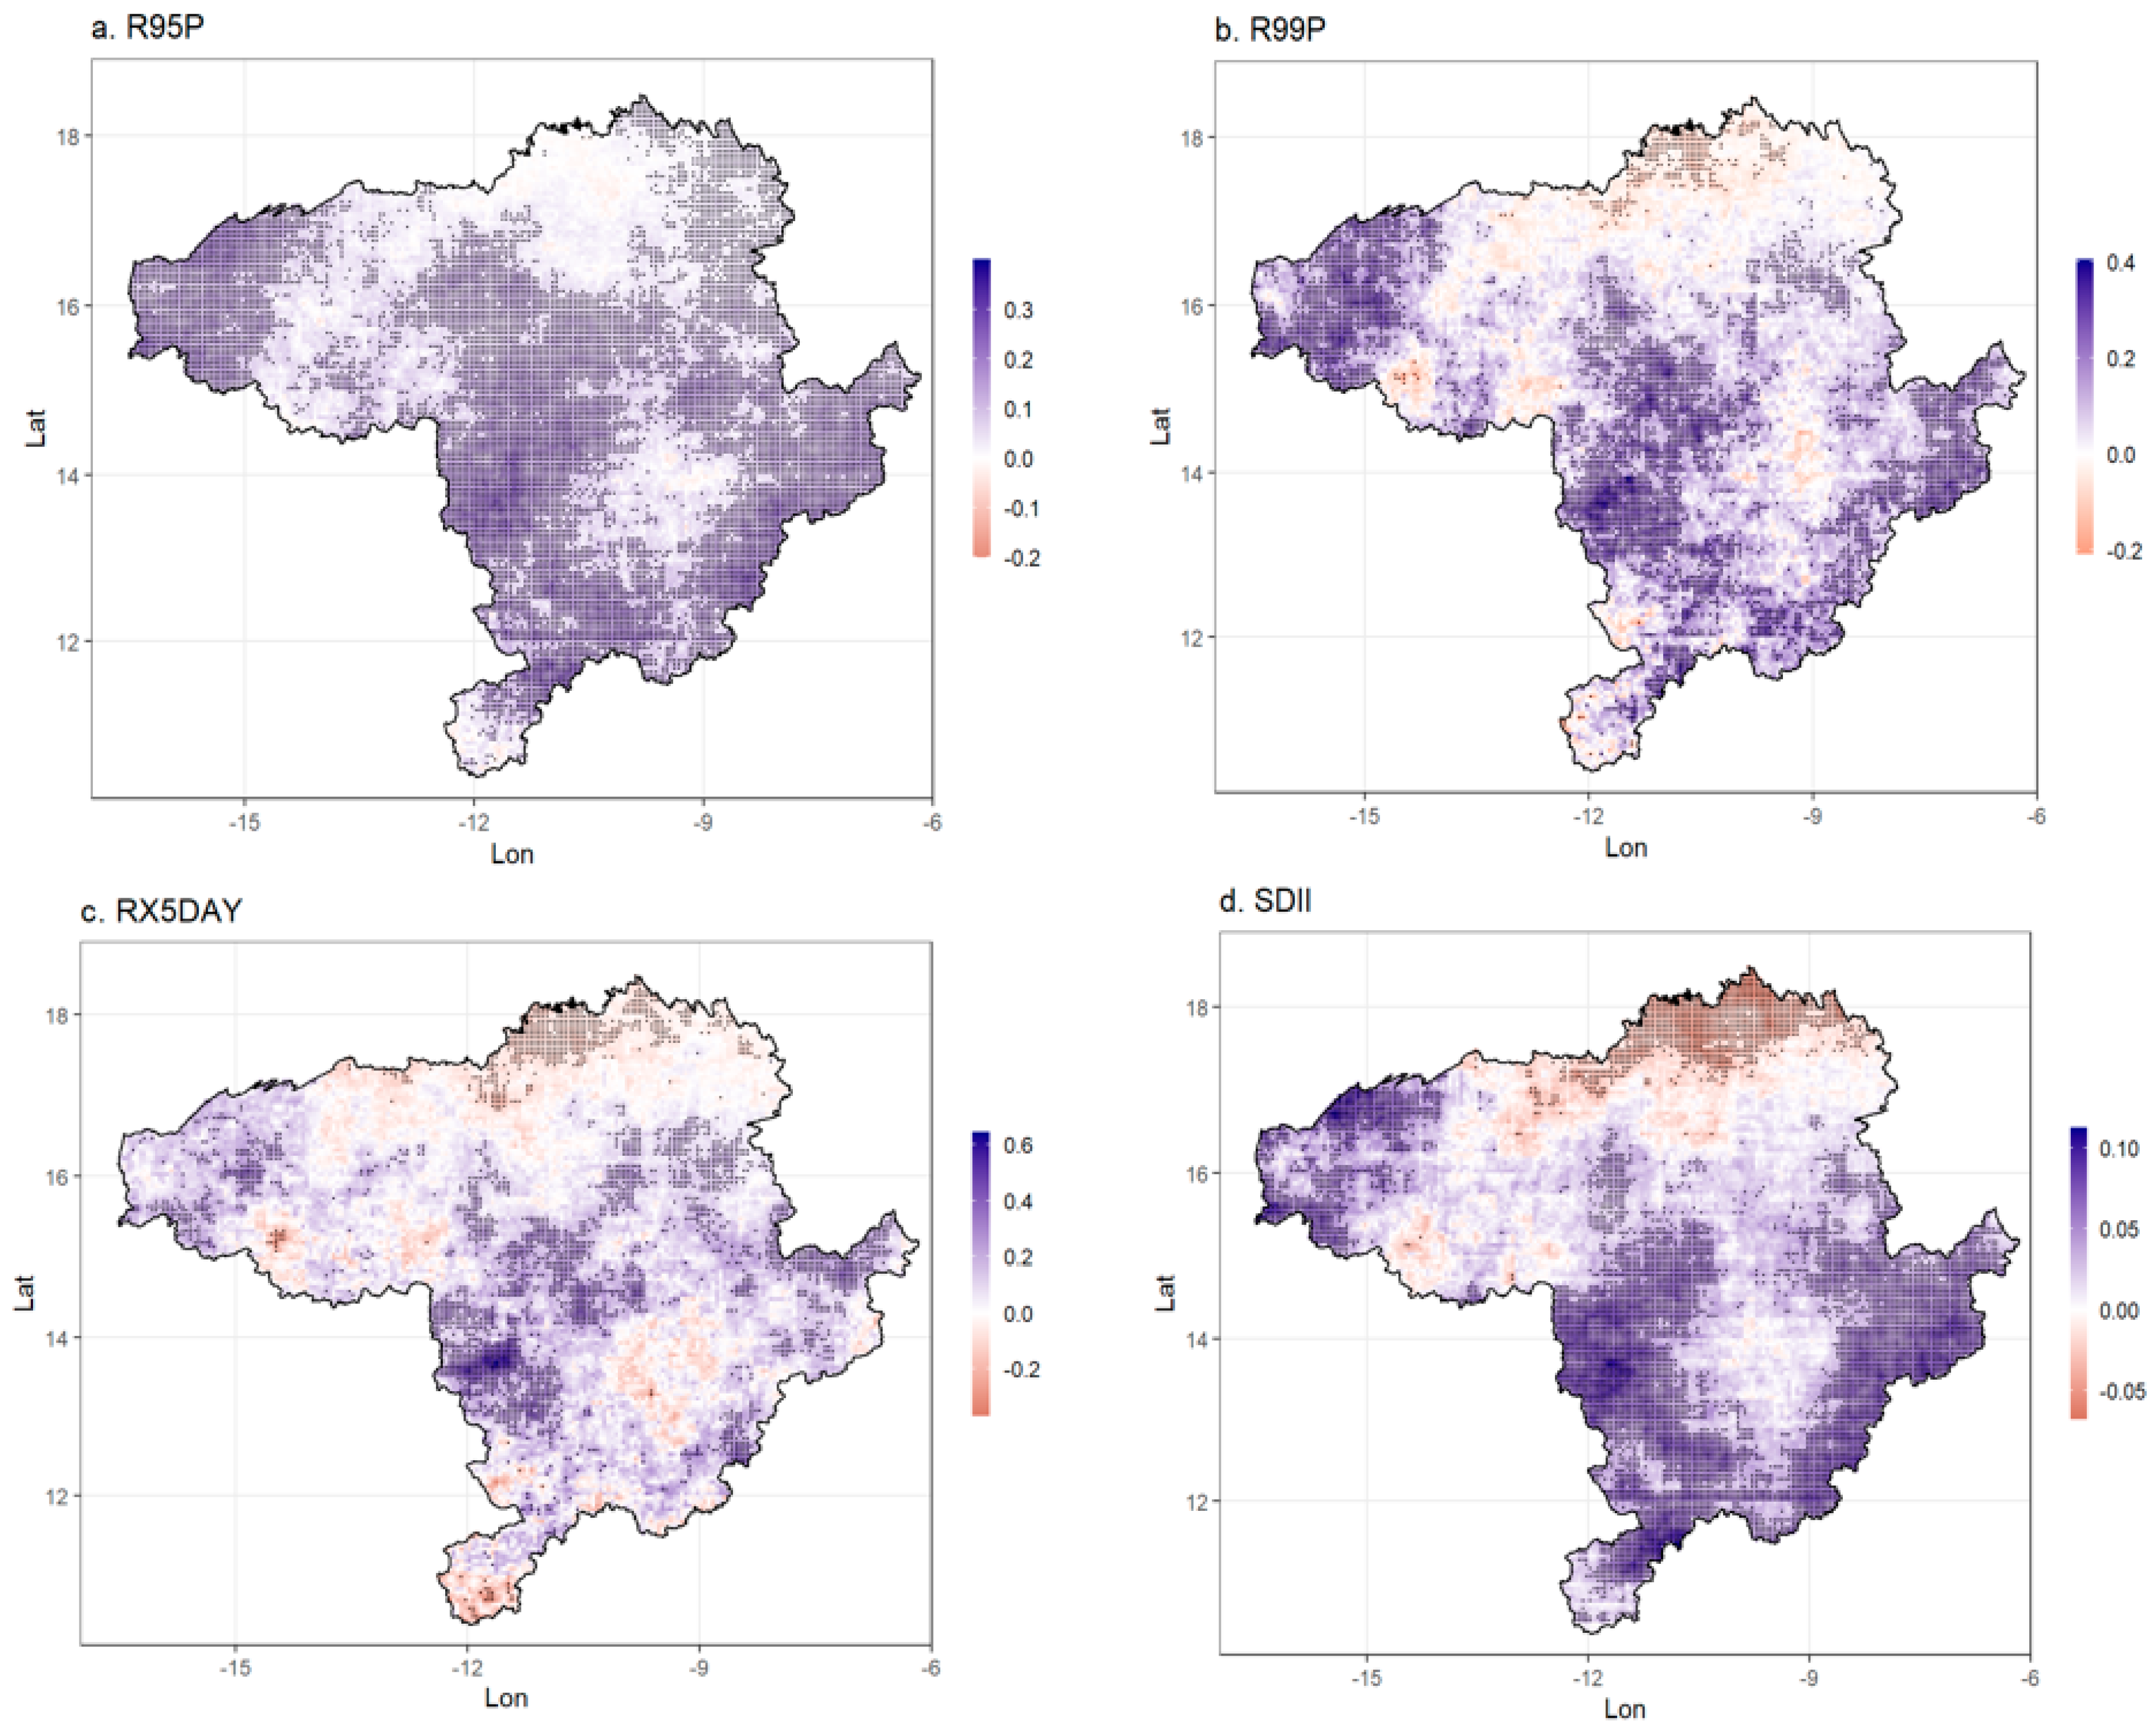
3.2. Trend and Significance of Extreme Indices
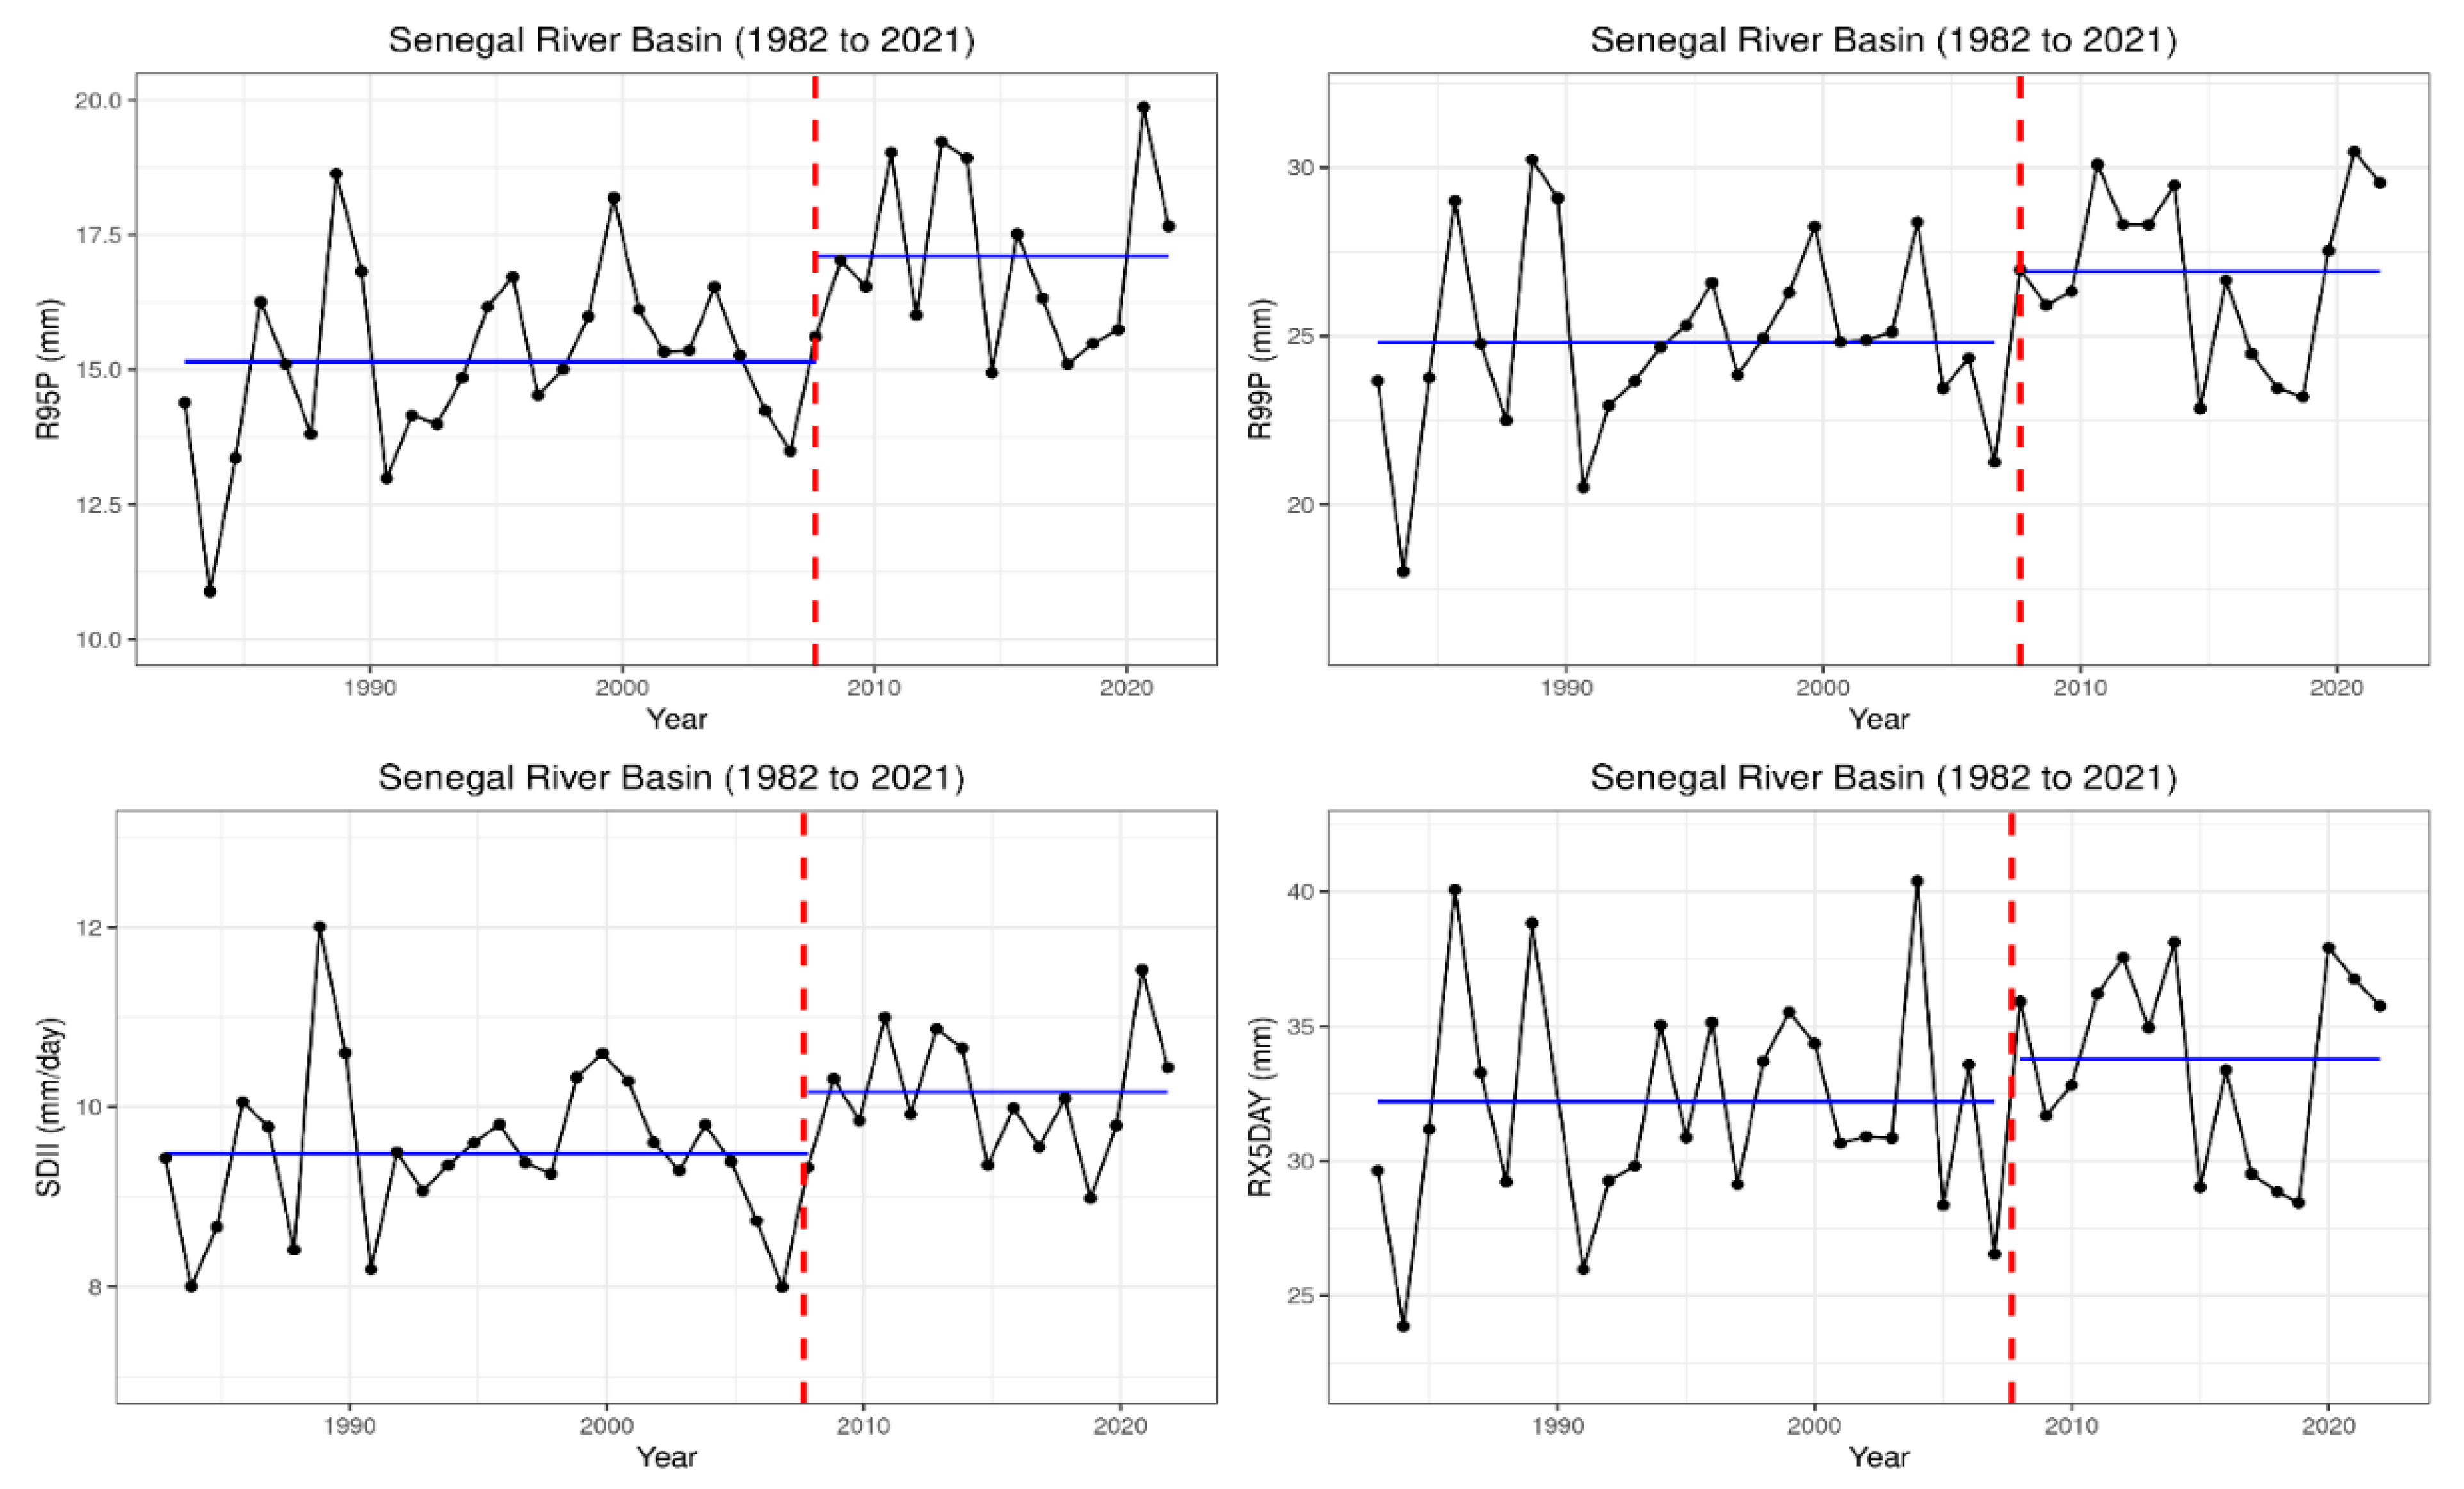
3.3. Interannual Variation and Trends in Extreme Rainfall Indices
3.4. Breakpoint Detection on the Trends of Extreme Precipitations
3.5. Characterization of Extreme Flows of the Basin
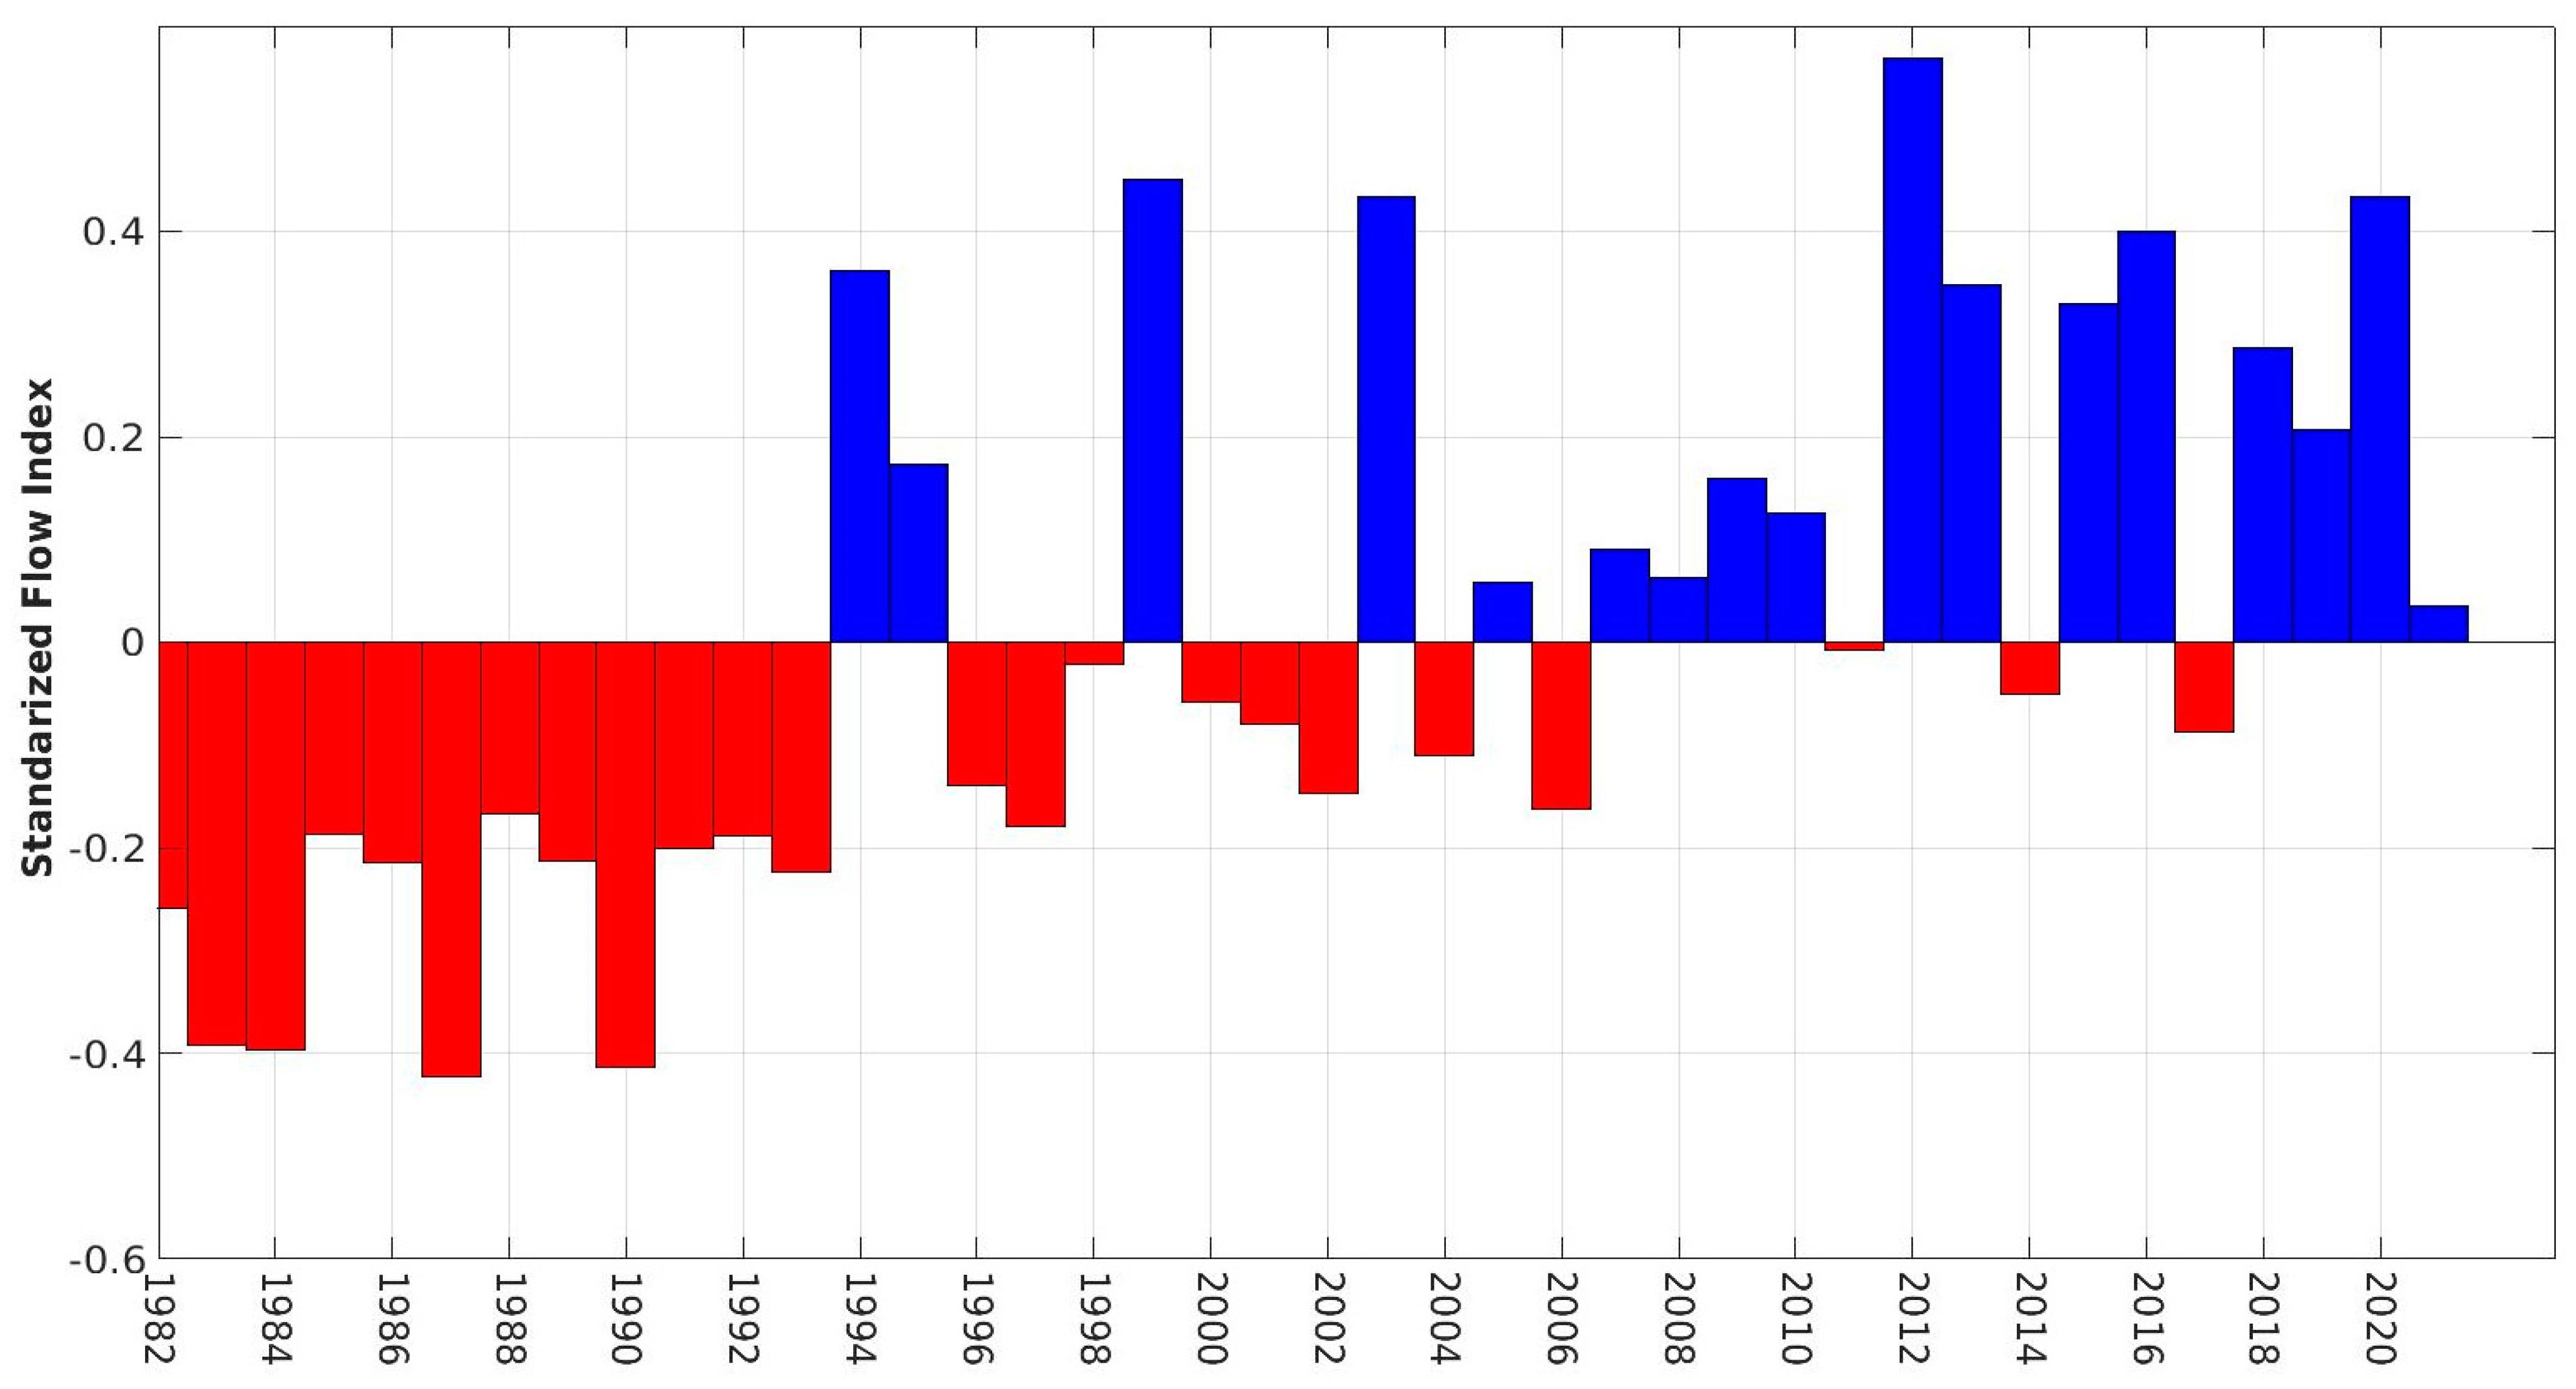
3.5.1. Interannual Variation in Discharge
3.5.2. Trends and Interannual Variability of Extreme Flows
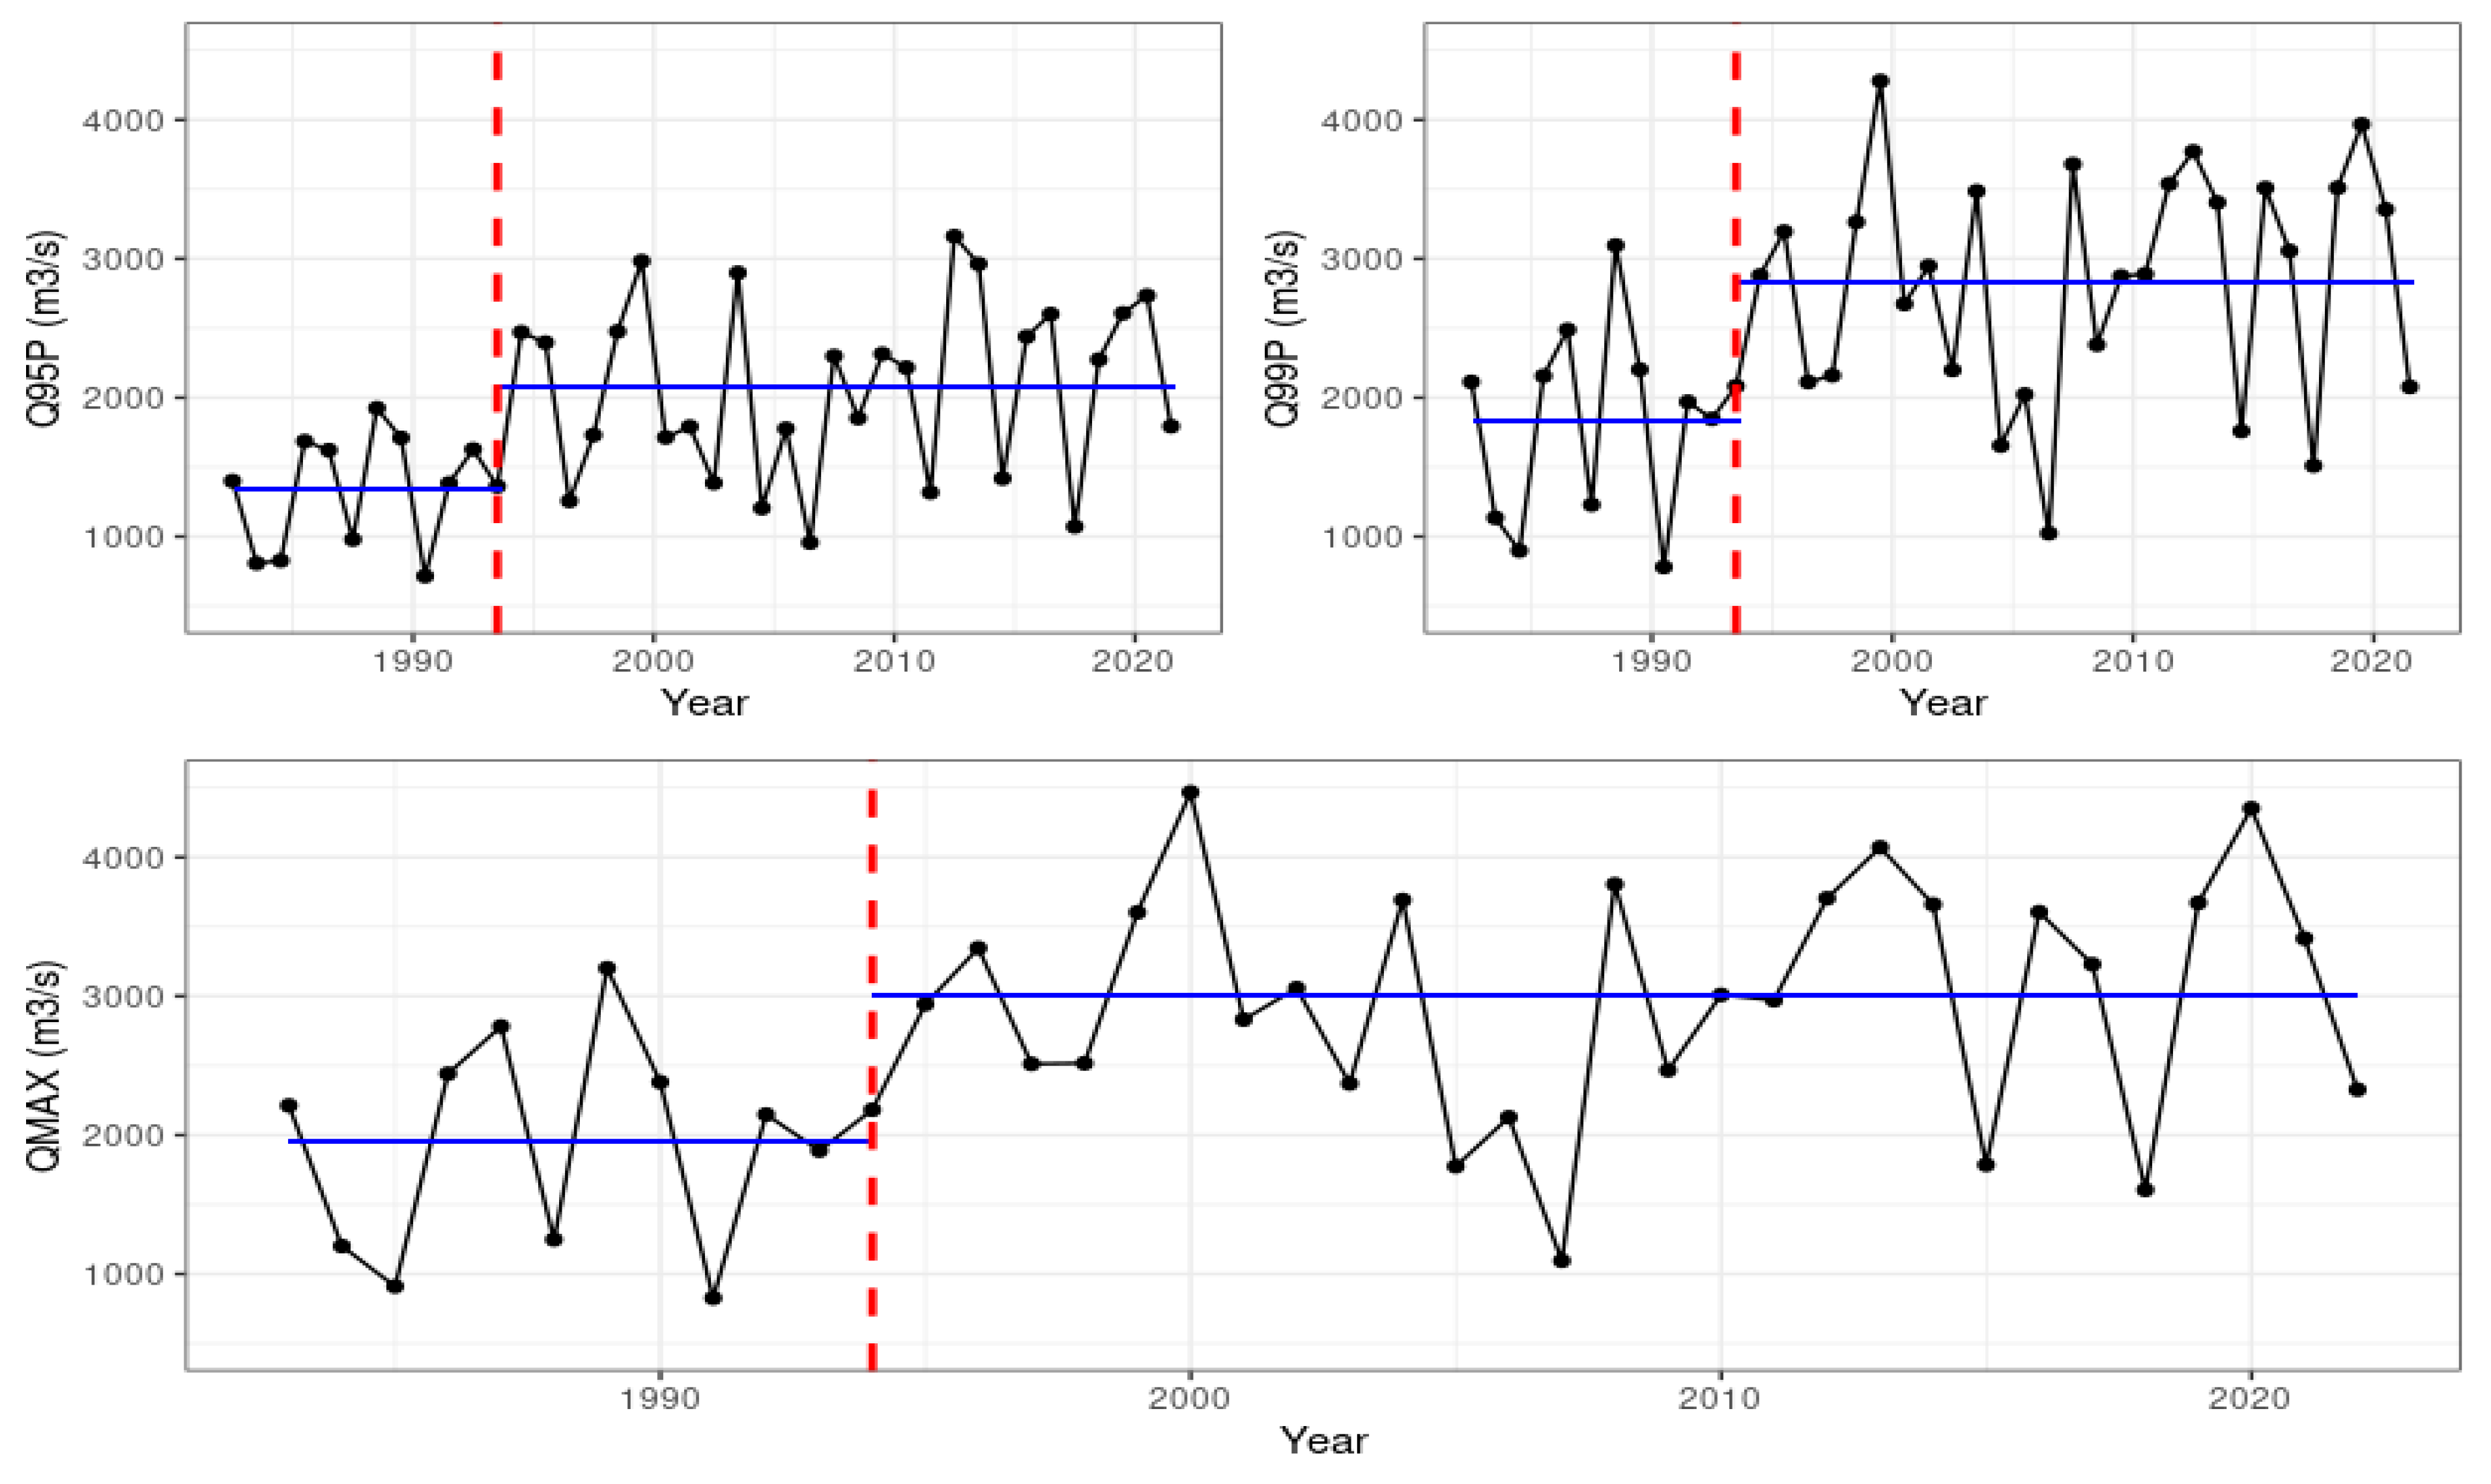
3.5.3. Breakpoint Detection on the Trends of Extreme Flows
4. Conclusions
Author Contributions
Funding
Data Availability Statement
Acknowledgments
Conflicts of Interest
List of Abbreviation
| ANACIM | National Agency of Civil Aviation and Meteorology |
| DGPRE | Direction of Water Management and Planning of Senegal |
| AMV | Atlantic Multidecadal Variability |
| CHIRPS | Climate Hazards Group Infrared Precipitation |
| MALI-METEO | Mali Meteorological Agency |
| NMS | National Meteorological Service of Guinea |
| WMO | World Meteorological Organization |
| ETCCDI | Expert Team on Climate Change Detection and Indices |
| ITA | Innovative Trend Analysis |
References
- Centre for Research on the Epidemiology of Disasters; UN Office for Disaster Risk Reduction. The Human Cost of Natural Disasters: A Global Perspective; Centre for Research on the Epidemiology of Disasters: Brussels, Belgium, 2015; p. 58. [Google Scholar]
- World Bank. Striving toward Disaster Resilient Development in Sub-Saharan Africa; World Bank: Washington, DC, USA, 2020; p. 82. [Google Scholar]
- Ricci, L. Linking adaptive capacity and Peri-Urban features: The findings of a household survey in Dar es Salaam. In Climate Change Vulnerability in Southern African Cities; Springer: Berlin/Heidelberg, Germany, 2014. [Google Scholar] [CrossRef]
- Jonkman, S.N. Global perspectives on loss of human life caused by floods. Nat. Hazards 2005, 34, 151–175. [Google Scholar] [CrossRef]
- OCHA. Afrique de l’Ouest: Inondations 2009; Status Report no. 2; OCHA: New York, NY, USA, 2009. [Google Scholar]
- MPDEPP-CAG. Inondation au Bénin: Rapport d’Evaluration des Besoins Post Catastrophiques; Systeme des Nations Unies du Bénin, Benin, 2011, p. 84. Available online: https://www.gfdrr.org/sites/default/files/publication/pda-2011-benin-fr.pdf (accessed on 5 February 2023).
- Nicholson, S.E. Climatic variations in the Sahel and other African regions during the past five centuries. J. Arid Environ. 1978, 1, 3–24. [Google Scholar] [CrossRef]
- Paturel, J.E.; Servat, E.; Delattre, M.O.; Lubes-niel, H. Analyse de séries pluviométriques de longue durée en Afrique de l’Ouest et Centrale non sahélienne dans un contexte de variabilité climatique. Hydrol. Sci. J. 1998, 43, 937–946. [Google Scholar] [CrossRef]
- Le Barbé, L.; Lebel, T.; Tapsoba, D. Rainfall variability in West Africa during the years 1950–90. J. Clim. 2002, 15, 187–202. [Google Scholar] [CrossRef]
- L’Hôte, Y.; Mahé, G.; Somé, B.; Triboulet, J.P. Analyse d’un indice des précipitations annuelles au Sahel sur la période 1896–2000; la sécheresse n’est pas terminée. Hydrol. Sci. J. 2002, 47, 563–572. [Google Scholar] [CrossRef]
- Lebel, T.; Ali, A. Recent trends in the Central and Western Sahel rainfall regime (1990–2007). J. Hydrol. 2009, 375, 52–64. [Google Scholar] [CrossRef]
- Silver, M.; Karnieli, A.; Ginat, H.; Meiri, E.; Fredj, E. An innovative method for determining hydrological calibration parameters for the WRF-Hydro model in arid regions. Environ. Model. Softw. 2017, 91, 47–69. [Google Scholar] [CrossRef]
- Ben Abdelmalek, M.; Nouiri, I. Study of trends and mapping of drought events in Tunisia and their impacts on agricultural production. Sci. Total Environ. 2020, 734, 139311. [Google Scholar] [CrossRef]
- Konate, D.; Didi, S.R.; Dje, K.B.; Diedhiou, A.; Kouassi, K.L.; Kamagate, B.; Paturel, J.; Coulibaly, H.S.J.; Alain, C.; Kouadio, K.; et al. Observed Changes in Rainfall and Characteristics of Extreme Events in Côte d’Ivoire (West Africa). Hydrology 2023, 10, 104. [Google Scholar] [CrossRef]
- Bedoum, A.; Bouka Biona, C.; Jean Pierre, B.; Adoum, I.; Mbiake, R.; Baohoutou, L. Évolution des indices des extrêmes climatiques en République du Tchad de 1960 à 2008. Atmosphere-Ocean 2017, 55, 42–56. [Google Scholar] [CrossRef]
- Akande, A.; Costa, A.C.; Mateu, J.; Henriques, R. Geospatial Analysis of Extreme Weather Events in Nigeria (1985–2015) Using Self-Organizing Maps. Adv. Meteorol. 2017, 2017, 8576150. [Google Scholar] [CrossRef]
- Larbi, I.; Hountondji, F.C.C.; Annor, T.; Agyare, W.A.; Gathenya, J.M.; Amuzu, J. Spatio-temporal trend analysis of rainfall and temperature extremes in the Vea catchment, Ghana. Climate 2018, 6, 87. [Google Scholar] [CrossRef]
- Badji, A.; Mignot, J.; Mohino, E.; Diakhaté, M.; Gaye, A.T. Decadal Variability of Rainfall Extreme Events in Senegal over the 20th Century: Observations and Modelling. In Proceedings of the EGU General Assembly 2022, Vienna, Austria, 23–27 May 2022; p. 8335. [Google Scholar]
- Descroix, L.; Niang, A.D.; Dacosta, H.; Panthou, G.; Quantin, G.; Diedhiou, A. Évolution des pluies de cumul élevé et recrudescence des crues depuis 1951 dans le bassin du Niger moyen (Sahel). Climatologie 2013, 10, 37–49. [Google Scholar] [CrossRef]
- Diallo, M.A.; Badiane, A.S.; Diongue, K.; Sakandé, L.; Ndiaye, M.; Seck, M.C.; Ndiaye, D. A twenty-eight-year laboratory-based retrospective trend analysis of malaria in Dakar, Senegal. PLoS ONE 2020, 15, e0231587. [Google Scholar] [CrossRef] [PubMed]
- Cisse, M.T.; Sambou, S.; Dieme, Y.; Diatta, C.; Bop, M. Analysis of flow in the Senegal River basin from 1960 to 2008. Rev. Sci. L’Eau 2014, 27, 167–187. [Google Scholar] [CrossRef]
- Faye, C. Impact du Changement Climatique et du Barrage de Manantali Sur la Dynamique du Régime Hydrologique du Fleuve Sénégal À Bakel (1950–2014). BSGLg 2015, 64, 69–82. [Google Scholar]
- Bodian, A.; Diop, L.; Panthou, G.; Dacosta, H.; Deme, A.; Dezetter, A.; Ndiaye, P.M.; Diouf, I.; Visch, T. Recent trend in hydroclimatic conditions in the Senegal River basin. Water 2020, 12, 436. [Google Scholar] [CrossRef]
- Faty, A.; Kane, A.; Ndiaye, A.L. Influence de la manifestation climatique sur les régimes pluviométriques saisonniers dans le haut bassin versant du Sénégal. Rev. Sci. L’Eau 2017, 30, 79–87. [Google Scholar] [CrossRef]
- Maria, D.; Soussou, N.; Seïdou, S.; Samo, K.; Landing, M.; Issa, S. Ensemble forecasting system for the management of the Senegal River discharge: Application upstream the Manantali dam. Appl. Water Sci. 2020, 10, 126. [Google Scholar] [CrossRef]
- Henriette, M.; Sambou, A.; Liersch, S.; Koch, H.; Albergel, J. Synergies and Trade-Offs in Water Resources Management in the Bafing Watershed under Climate Change. Water 2023, 15, 2067. [Google Scholar]
- Faye, C. Méthode d’analyse statistique de données morphométriques: Corrélation de paramètres morphométriques et influence sur l’écoulement des sous-bassins du fleuve Sénégal. Cinq Cont. 2014, 4, 80–108. [Google Scholar]
- Nash, J.E.; Sutcliffe, J.V. River flow forecasting through conceptual models part I—A discussion of principles. J. Hydrol. 1970, 10, 282–290. [Google Scholar] [CrossRef]
- Ting, W.; Shiqiang, Z. Study on Linear Correlation Coefficient and Nonlinear Correlation Coefficient in Mathematical Statistics. Stud. Math. Sci. 2011, 3, 58–63. [Google Scholar]
- Ellis and Victoria Spearma n’s correlation, Environmetrics. 2011, 8. Available online: https://www.statstutor.ac.uk/resources/uploaded/spearmans.pdf (accessed on 2 October 2023).
- Goddard, L.; Gershunov, A. Impact of El Niño on Weather and Climate Extremes. Geophys. Monogr. Ser. 2020, 253, 361–375. [Google Scholar] [CrossRef]
- Avila-Diaz, A.; Benezoli, V.; Justino, F.; Torres, R.; Wilson, A. Assessing current and future trends of climate extremes across Brazil based on reanalyses and earth system model projections. Clim. Dyn. 2020, 55, 1403–1426. [Google Scholar] [CrossRef]
- Sillmann, J.; Kharin, V.V.; Zhang, X.; Zwiers, F.W.; Bronaugh, D. Climate extremes indices in the CMIP5 multimodel ensemble: Part 1. Model evaluation in the present climate. J. Geophys. Res. Atmos. 2013, 118, 1716–1733. [Google Scholar] [CrossRef]
- Wilson, A.B.; Avila-Diaz, A.; Oliveira, L.F.; Zuluaga, C.F.; Mark, B. Climate extremes and their impacts on agriculture across the Eastern Corn Belt Region of the U.S. Weather Clim. Extrem. 2022, 37, 100467. [Google Scholar] [CrossRef]
- Hu, M.; Sayama, T.; Duan, W.; Takara, K.; He, B.; Luo, P. Assessment of hydrological extremes in the Kamo River Basin, Japan. Hydrol. Sci. J. 2017, 62, 1255–1265. [Google Scholar] [CrossRef]
- Garcia, F. Amélioration d’une modélisation hydrologique régionalisée pour estimer les statistiques d’étiage Hydrologie. Université Pierre et Marie Curie—Paris VI, 2016. Français. Available online: https://www.theses.fr/2016PA066653 (accessed on 3 January 2023).
- Ahmad, I.; Zhang, F.; Tayyab, M.; Anjum, M.N.; Zaman, M.; Liu, J.; Farid, H.U.; Saddique, Q. Spatiotemporal analysis of precipitation variability in annual, seasonal and extreme values over upper Indus River basin. Atmos. Res. 2018, 213, 346–360. [Google Scholar] [CrossRef]
- Amichiatchi, N.J.M.C.; Soro, G.E.; Hounkpè, J.; Goula Bi, T.A.; Lawin, A.E. Evaluation of Potential Changes in Extreme Discharges over Some Watersheds in Côte d’Ivoire. Hydrology 2023, 10, 6. [Google Scholar] [CrossRef]
- Hu, Z.; Liu, S.; Zhong, G.; Lin, H.; Zhou, Z. Modified Mann-Kendall trend test for hydrological time series under the scaling hypothesis and its application. Hydrol. Sci. J. 2020, 65, 2419–2438. [Google Scholar] [CrossRef]
- Liu, S.; Xie, Y.; Fang, H.; Du, H.; Xu, P. Trend Test for Hydrological and Climatic Time Series Considering the Interaction of Trend and Autocorrelations. Water 2022, 14, 3006. [Google Scholar] [CrossRef]
- Methods, T.A. Trends in Extreme Precipitation Indices in Northwest Ethiopia: Comparative Analysis Using the Mann—Kendall and Innovative. Climate 2023, 11, 164. [Google Scholar]
- Wang, F.; Huang, G.H.; Cheng, G.H.; Li, Y.P. Impacts of climate variations on non-stationarity of streamflow over Canada. Environ. Res. 2021, 197, 111118. [Google Scholar] [CrossRef]
- Patakamuri, S.K.; O’Brien, N. Package ‘modifiedmk’ (Version 1.4.0): Modified Versions of Mann Kendall and Spearman’s Rho Trend Tests. CRAN 2019, 1–18. Available online: https://cran.r-project.org/web/packages/modifiedmk/modifiedmk.pdf (accessed on 2 October 2023).
- Şen, Z. Innovative Trend Analysis Methodology. J. Hydrol. Eng. 2012, 17, 1042–1046. [Google Scholar] [CrossRef]
- Alifujiang, Y.; Abuduwaili, J.; Maihemuti, B.; Emin, B.; Groll, M. Innovative trend analysis of precipitation in the Lake Issyk-Kul Basin, Kyrgyzstan. Atmosphere 2020, 11, 332. [Google Scholar] [CrossRef]
- Caloiero, T. Evaluation of rainfall trends in the South Island of New Zealand through the innovative trend analysis (ITA). Theor. Appl. Climatol. 2020, 139, 493–504. [Google Scholar] [CrossRef]
- Kisi, O. An innovative method for trend analysis of monthly pan evaporations. J. Hydrol. 2015, 527, 1123–1129. [Google Scholar] [CrossRef]
- Tabari, H.; Taye, M.T.; Onyutha, C.; Willems, P. Decadal Analysis of River Flow Extremes Using Quantile-Based Approaches. Water Resour. Manag. 2017, 31, 3371–3387. [Google Scholar] [CrossRef]
- Pettitt, A.A.N.; Journal, S.; Statistical, R.; Series, S.; Statistics, C.A. A Non-Parametric Approach to the Change-Point Problem Published by: Wiley for the Royal Statistical Society A Non-parametric Approach to the Change-point Problem. Appl. Stat. 1979, 28, 126–135. [Google Scholar] [CrossRef]
- Gao, P.; Mu, X.M.; Wang, F.; Li, R. Changes in streamflow and sediment discharge and the response to human activities in the middle reaches of the Yellow River. Hydrol. Earth Syst. Sci. 2011, 15, 1–10. [Google Scholar] [CrossRef]
- Mu, X.; Zhang, L.; McVicar, T.R.; Chille, B.; Gau, P. Analysis of the impact of conservation measures on stream flow regime in catchments of the Loess Plateau, China. Hydrol. Process. 2007, 21, 2124–2134. [Google Scholar] [CrossRef]
- Sneyers, R. On the statistical analysis of series of observations. World Meteorol. Organ. 1990, 415, 1990. [Google Scholar] [CrossRef]
- Tarhule, A.; Woo, M. Changes in rainfall characteristics in northern Nigeria. Int. J. Climatol. 1998, 18, 1261–1271. [Google Scholar] [CrossRef]
- Verstraeten, G.; Poesen, J.; Demarée, G.; Salles, C. Long-term (105 years) variability in rain erosivity as derived from 10-min rainfall depth data for Ukkel (Brussels, Belgium): Implications for assessing soil erosion rates. J. Geophys. Res. Atmos. 2006, 111, D22109. [Google Scholar] [CrossRef]
- Zhang, S.; Lu, X.X. Hydrological responses to precipitation variation and diverse human activities in a mountainous tributary of the lower Xijiang, China. Catena 2009, 77, 130–142. [Google Scholar] [CrossRef]
- Liu, L.; Xu, Z.X.; Huang, J.X. Spatio-temporal variation and abrupt changes for major climate variables in the Taihu Basin, China. Stoch. Environ. Res. Risk Assess. 2012, 26, 777–791. [Google Scholar] [CrossRef]
- Mersin, D.; Tayfur, G.; Vaheddoost, B.; Safari, M.J.S. Historical Trends Associated with Annual Temperature and Precipitation in Aegean Turkey, Where Are We Heading? Sustainability 2022, 14, 13380. [Google Scholar] [CrossRef]
- Alifujiang, Y.; Abuduwaili, J.; Abliz, A. Precipitation trend identification with a modified innovative trend analysis technique over Lake Issyk-Kul, Kyrgyzstan. J. Water Clim. Chang. 2023, 14, 1798–1815. [Google Scholar] [CrossRef]
- Hounguè, R.; Lawin, A.E.; Moumouni, S.; Afouda, A.A. Change in climate extremes and pan evaporation influencing factors over Ouémé Delta in Bénin. Climate 2019, 7, 2. [Google Scholar] [CrossRef]
- Dike, V.N.; Lin, Z.H.; Ibe, C.C. Intensification of summer rainfall extremes over nigeria during recent decades. Atmosphere 2020, 11, 1084. [Google Scholar] [CrossRef]
- Diatta, S.; Diedhiou, C.W.; Dione, D.M.; Sambou, S. Spatial variation and trend of extreme precipitation in west africa and teleconnections with remote indices. Atmosphere 2020, 11, 999. [Google Scholar] [CrossRef]
- Adeyeri, O.E.; Lamptey, B.L.; Lawin, A.E.; Sanda, I.S. Spatio-Temporal Precipitation Trend and Homogeneity Analysis in Komadugu-Yobe Basin, Lake Chad Region. J. Climatol. Weather Forecast. 2017, 5, 1000214. [Google Scholar] [CrossRef]
- Nicholson, S.E.; Some, B.; Kone, B. An analysis of recent rainfall conditions in West Africa, including the rainy seasons of the 1997 El Nino and the 1998 La Nina years. J. Clim. 2000, 13, 2628–2640. [Google Scholar] [CrossRef]
- Ozer, P.; Erpicum, M.; Demarée, G.; Vandiepenbeeck, M. The Sahelian drought may have ended during the 1990s. Hydrol. Sci. J. 2003, 48, 489–492. [Google Scholar] [CrossRef]
- Sarr, A.B.; Camara, M. Evolution des Indices Pluviométriques Extrêmes Par L’analyse de Modèles Climatiques Régionaux du Programme CORDEX: Les Projections Climatiques Sur le Sénégal. Eur. Sci. J. ESJ 2017, 13, 206. [Google Scholar] [CrossRef]
- Attogouinon, A.; Lawin, A.E.; M’Po, Y.N.T.; Houngue, R. Extreme precipitation indices trend assessment over the Upper Oueme river valley-(Benin). Hydrology 2017, 4, 36. [Google Scholar] [CrossRef]
- Fofana, M.; Adounkpe, J.; Larbi, I.; Hounkpe, J.; Djan’na Koubodana, H.; Toure, A.; Bokar, H.; Dotse, S.Q.; Limantol, A.M. Urban flash flood and extreme rainfall events trend analysis in Bamako, Mali. Environ. Chall. 2022, 6, 100449. [Google Scholar] [CrossRef]
- Abiodun, B.J.; Adegoke, J.; Abatan, A.A.; Ibe, C.A.; Egbebiyi, T.S.; Engelbrecht, F.; Pinto, I. Potential impacts of climate change on extreme precipitation over four African coastal cities. Clim. Chang. 2017, 143, 399–413. [Google Scholar] [CrossRef]
- Dong, B.; Sutton, R. Dominant role of greenhouse-gas forcing in the recovery of Sahel rainfall. Nat. Clim. Chang. 2015, 5, 757–760. [Google Scholar] [CrossRef]
- Fitzpatrick, R.G.J.; Parker, D.J.; Marsham, J.H.; Rowell, D.P.; Guichard, F.M.; Taylor, C.M.; Cook, K.H.; Vizy, E.K.; Jackson, L.S.; Finney, D.; et al. What drives the intensification of mesoscale convective systems over the West African Sahel under climate change? J. Clim. 2020, 33, 3151–3172. [Google Scholar] [CrossRef]
- Knippertz, P.; Evans, M.J.; Field, P.R.; Fink, A.H.; Liousse, C.; Marsham, J.H. The possible role of local air pollution in climate change in West Africa. Nat. Clim. Chang. 2015, 5, 815–822. [Google Scholar] [CrossRef]
- Saley, I.A.; Salack, S.; Sanda, I.S.; Moussa, M.S.; Bonkaney, A.L.; Ly, M.; Fodé, M. The possible role of the Sahel Greenbelt on the occurrence of climate extremes over the West African Sahel. Atmos. Sci. Lett. 2019, 20, e927. [Google Scholar] [CrossRef]
- Nouaceur, Z. La reprise des pluies et la recrudescence des inondations en Afrique de l’Ouest sahélienne. Physio-Géo 2020, 15, 89–109. [Google Scholar] [CrossRef]
- Taylor, C.M.; Belusic, D.; Guichard, F.; Parker, D.J.; Vischel, T.; Bock, O.; Harris, P.P.; Janicot, S.; Klein, C.; Panthou, G. Frequency of extreme Sahelian storms tripled since 1982 in satellite observations. Nature 2017, 544, 475–478. [Google Scholar] [CrossRef] [PubMed]
- Decembre, V.F. Sdaged u Fleuve Senegal. 2009. Report, 180p. Available online: http://www.omvs.org (accessed on 12 January 2023).
- Palmer, M.A.; Liermann, C.A.R.; Nilsson, C.; Alcamo, J.; Lake, P.S.; Bond, N.; Frontiers, S.; Mar, N.; Palmer, M.A.; Liermann, C.A.R.; et al. Climate change and the world’s river basins: Anticipating management options. Front. Ecol. Environ. 2008, 6, 81–89. [Google Scholar] [CrossRef]
- Taylor, P.; Döll, P.; Oki, T.; Arnell, N.W.; Benito, G.; Cogley, J.G. Integrating risks of climate change into water management. Hydrol. Sci. J. 2014, 60, 4–13. [Google Scholar] [CrossRef]
- Yi, Y.; Billa, L.; Singh, A. Geoscience Frontiers Effect of climate change on seasonal monsoon in Asia and its impact on the variability of monsoon rainfall in Southeast Asia. Geosci. Front. 2015, 6, 817–823. [Google Scholar] [CrossRef]
- Niang, A.J.; Ozer, A.; Ozer, P. Fifty years of landscape evolution in Southwestern Mauritania by means of aerial photos. J. Arid Environ. 2008, 72, 97–107. [Google Scholar] [CrossRef]
- Ozer, P.; Hountondji, Y.C.; Laminou Manzo, O. Evolution des caractéristiques pluviométriques dans l’est du niger de 1940 a 2007. Geo-Eco-Trop 2009, 33, 11–30. [Google Scholar]
- Panthou, G.; Vischel, T.; Lebel, T. Recent trends in the regime of extreme rainfall in the Central Sahel. Int. J. Climatol. 2014, 34, 3998–4006. [Google Scholar] [CrossRef]
- Sene, S.; Ozer, P. Évolution Pluviométrique Et Relation Inondations—Événements Pluvieux Au Sénégal. Bull. Société Géographique Liège 2002, 42, 27–33. [Google Scholar]
- Sambou, S.; Badji, A.M.; Malanda-nimy, E.N. Une Approche Statistique. Sécheresse 2009, 20, 104–111. [Google Scholar] [CrossRef]


| Rainfall Station Name | Longitude | Latitude | Country Located |
|---|---|---|---|
| Saint-Louis | −16.45 | 16.05 | Senegal |
| Dagana | −15.5 | 16.52 | Senegal |
| Podor | −14.97 | 16.65 | Senegal |
| Matam | −13.25 | 15.65 | Senegal |
| Bakel | −12.47 | 14.90 | Senegal |
| Saraya | −11.78 | 12.78 | Senegal |
| Siguiri | −9.17 | 11.43 | Guinea |
| Labe | −12.30 | 11.32 | Guinea |
| Tougue | −11.66 | 11.43 | Guinea |
| Mamou | −12.08 | 10.37 | Guinea |
| Toukoto | −9.90 | 13.45 | Mali |
| Bafing-Makana | −10.25 | 12.55 | Mali |
| Daka saidiou | −10.61 | 11.95 | Mali |
| Kita | −9.47 | 13.07 | Mali |
| Falea | −11.82 | 12.26 | Mali |
| Discharge Station Name | Longitude | Latitude Mean | Standard Deviation Periods |
|---|---|---|---|
| Bakel | −12.45 | 14.9 485.72 m3/s | 631.7151 1982–2021 |
| Kidira | −12.21 | 14.45 135.63 m3/s | 276.89 2000–2020 |
| Oualia | −10.38 | 13.6 96,903 m3/s | 206.99 2000–2016 |
| Bafing-Makana | −10.28 | 12.55 251.95 m3/s | 350.19 2001–2019 |
| Statistical Indicators | |||
|---|---|---|---|
| Stations | NSE | R Spearman’s rs | Spearman (p-Value) |
| Saint-Louis | 0.98 | 0.99 0.88 | 0.00015 |
| Dagana | 0.93 | 0.97 0.88 | 0.00011 |
| Podor | 0.96 | 0.99 0.88 | 000015 |
| Matam | 0.98 | 0.99 0.76 | 0.004 |
| Bakel | 0.96 | 0.98 0.90 | 5.6 × |
| Saraya | 0.99 | 0.99 0.72 | 0.01 |
| Kita | 0.96 | 0.99 0.96 | 2.4 × |
| Falea | 0.97 | 0.98 0.95 | 2 × |
| Tokoto | 0.97 | 0.95 0.90 | 2 × |
| Daka saidou | 0.89 | 0.97 0.91 | 2 × |
| Bafing-Makana | 0.95 | 0.99 0.93 | 8.06 × |
| Mamou | 0.90 | 0.99 0.98 | 2.2 × |
| Tougue | 0.85 | 0.96 0.97 | 2 × |
| Labe | 0.96 | 0.99 0.98 | 2 × |
| Siguiri | 0.89 | 0.96 0.97 | 9.4 × |
| Values | Class |
|---|---|
| ≥ 2 | Extremely wet |
| 1.5 ≤ ≤ 1.99 | Very wet |
| 1.0 ≤ ≤ 1.49 | Moderately wet |
| −0.99 ≤ ≤ 0.99 | Close to normal |
| −1.0 ≤ ≤ −1.49 | Moderately dry |
| −1.5 ≤ ≤ −1.99 | Very dry |
| ≤ −2 | Extremely dry |
| Index | Index Name | Index Definitions | Units |
|---|---|---|---|
| SDII | Simple daily rainfall index | The ratio of annual total rainfall to the number of wet days | mm/day |
| RX5day | Max 5-day rainfall | Annual maximum consecutive 5-day rainfall | mm |
| R95P | Very wet days | Total annual rainfall accumulated above the 95th percentile in 1982–2021 | mm |
| R99P | Extremely wet day | Total annual rainfall accumulated above the 95th percentile in 1982–2021 | mm |
| QMAX | Peak discharge | Annual maximum discharge in 1982–2021 | m3/s |
| Q95P | High-flow days | Annual total stream flow from days > 95th percentile in 1982–2021 | m3/s |
| Q99P | Very high-flow days | Annual total stream flow from days > 99th percentile in 1982–2021 | m3/s |
| Indices | p-Value | Zc | Sen’s Slope | Tau | Var(s) | Units |
|---|---|---|---|---|---|---|
| R95P | 47 × | 10.33 | 0.079 | 0.34 | 667.00 | mm/year |
| R99P | 99 × | 5.73 | 0.098 | 0.23 | 997.35 | mm/year |
| SDII | 11 × | 6.08 | 0.024 | 0.22 | 826.80 | mm/year |
| RX5DAY | 22 × | 3.05 | 0.067 | 0.096 | 587.97 | mm/year |
| Index | p-Value | Breakpoint |
|---|---|---|
| R95p | 0.020 | 2007 |
| R99p | 0.2625 | 2006 |
| SDII | 0.078 | 2007 |
| RX5DAY | 1 | 2006 |
| Indices | p-Value | Zc | Sen’s Slope | Tau | Var(s) | Units |
|---|---|---|---|---|---|---|
| Q95P | 22 × | 8.48 | 29.23 | 0.33 | 946.912 | m3/s/year |
| Q99P | 33 × | 7.58 | 37.49 | 0.31 | 1060 | m3/s/year |
| Qmax | 13 × | 7.08 | 38.35 | 0.30 | 1137.5 | m3/s/year |
| Indices | Pettit’s Test | SNHT | ||
|---|---|---|---|---|
| p-value | Breakpoint | p-value | Breakpoint | |
| Q95p | 0.0239 | 1993 | 0.0153 | 1993 |
| Q99p | 0.04125 | 1993 | 0.01795 | 1993 |
| QMAX | 0.02804 | 1993 | 0.01735 | 1993 |
Disclaimer/Publisher’s Note: The statements, opinions and data contained in all publications are solely those of the individual author(s) and contributor(s) and not of MDPI and/or the editor(s). MDPI and/or the editor(s) disclaim responsibility for any injury to people or property resulting from any ideas, methods, instructions or products referred to in the content. |
© 2023 by the authors. Licensee MDPI, Basel, Switzerland. This article is an open access article distributed under the terms and conditions of the Creative Commons Attribution (CC BY) license (https://creativecommons.org/licenses/by/4.0/).
Share and Cite
Ndiaye, A.; Mbaye, M.L.; Arnault, J.; Camara, M.; Lawin, A.E. Characterization of Extreme Rainfall and River Discharge over the Senegal River Basin from 1982 to 2021. Hydrology 2023, 10, 204. https://doi.org/10.3390/hydrology10100204
Ndiaye A, Mbaye ML, Arnault J, Camara M, Lawin AE. Characterization of Extreme Rainfall and River Discharge over the Senegal River Basin from 1982 to 2021. Hydrology. 2023; 10(10):204. https://doi.org/10.3390/hydrology10100204
Chicago/Turabian StyleNdiaye, Assane, Mamadou Lamine Mbaye, Joël Arnault, Moctar Camara, and Agnidé Emmanuel Lawin. 2023. "Characterization of Extreme Rainfall and River Discharge over the Senegal River Basin from 1982 to 2021" Hydrology 10, no. 10: 204. https://doi.org/10.3390/hydrology10100204