
Flood Perception from Local Perspective of Rural Community vs. Geomorphological Control of Fluvial Processes in Large Alluvial Valley (the Middle Vistula River, Poland)

Abstract
:1. Introduction
2. Study Area, Methods and Outline of the 2010 Flood
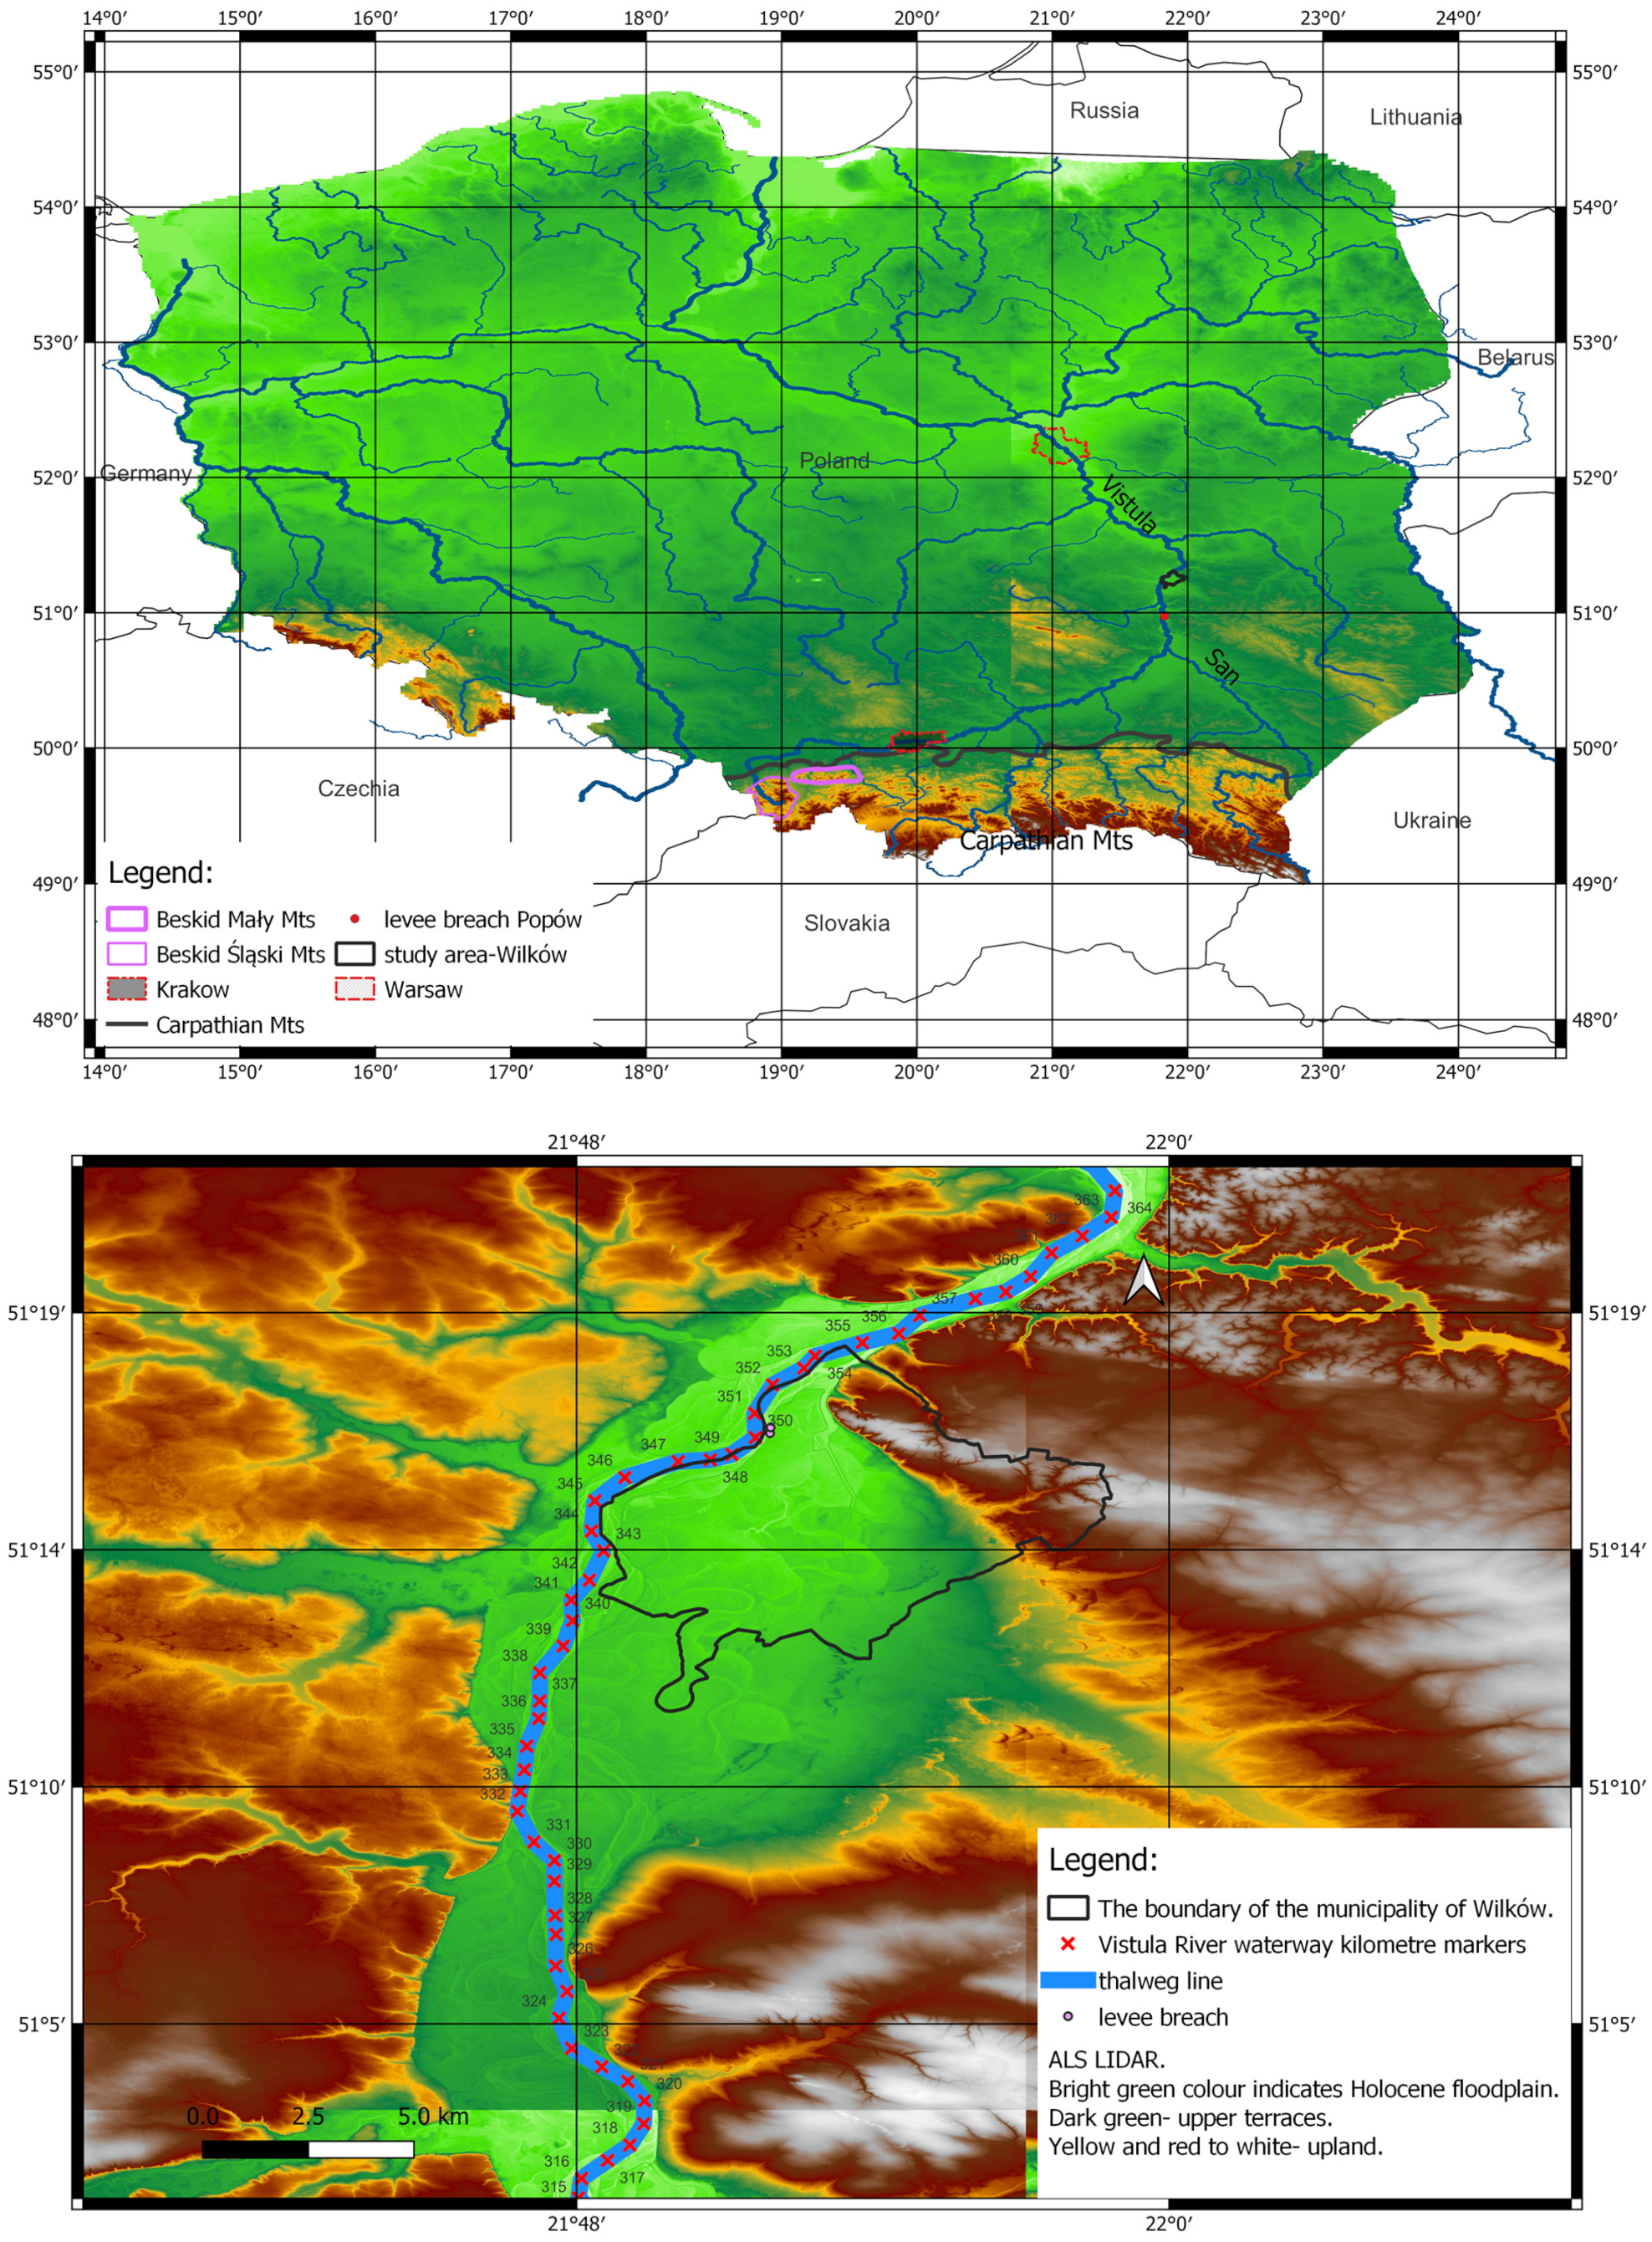
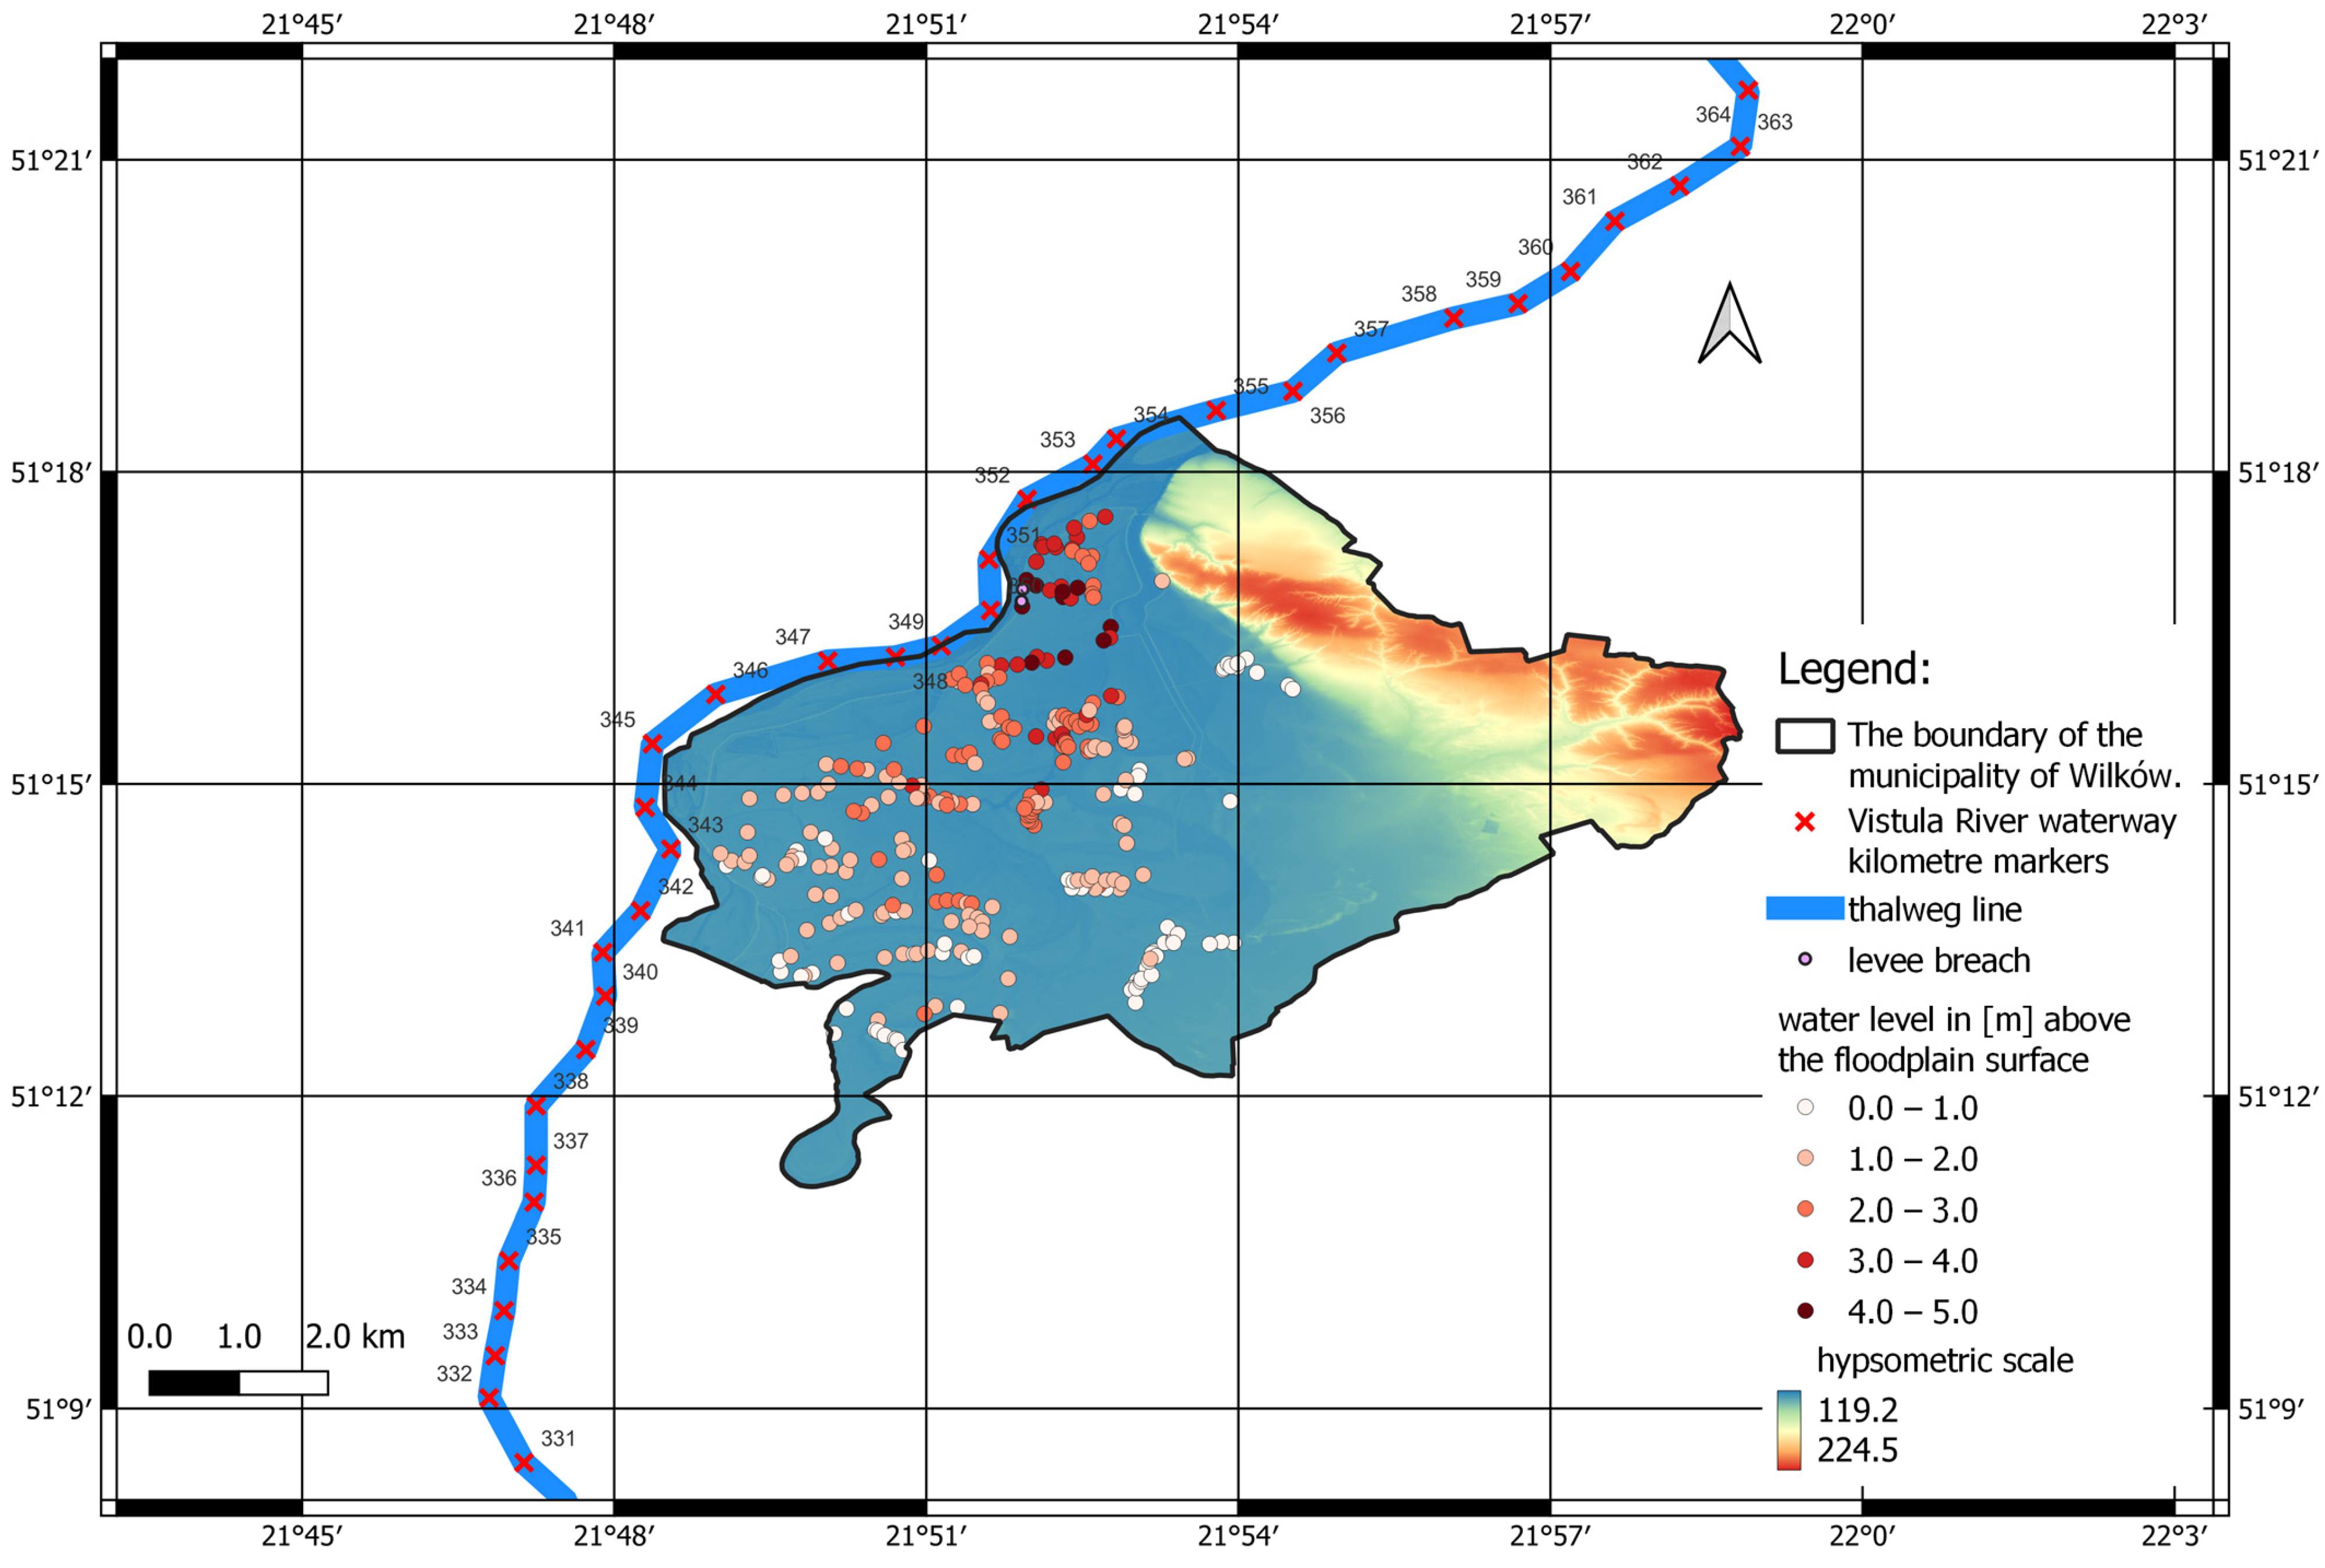
2.1. The Study Area
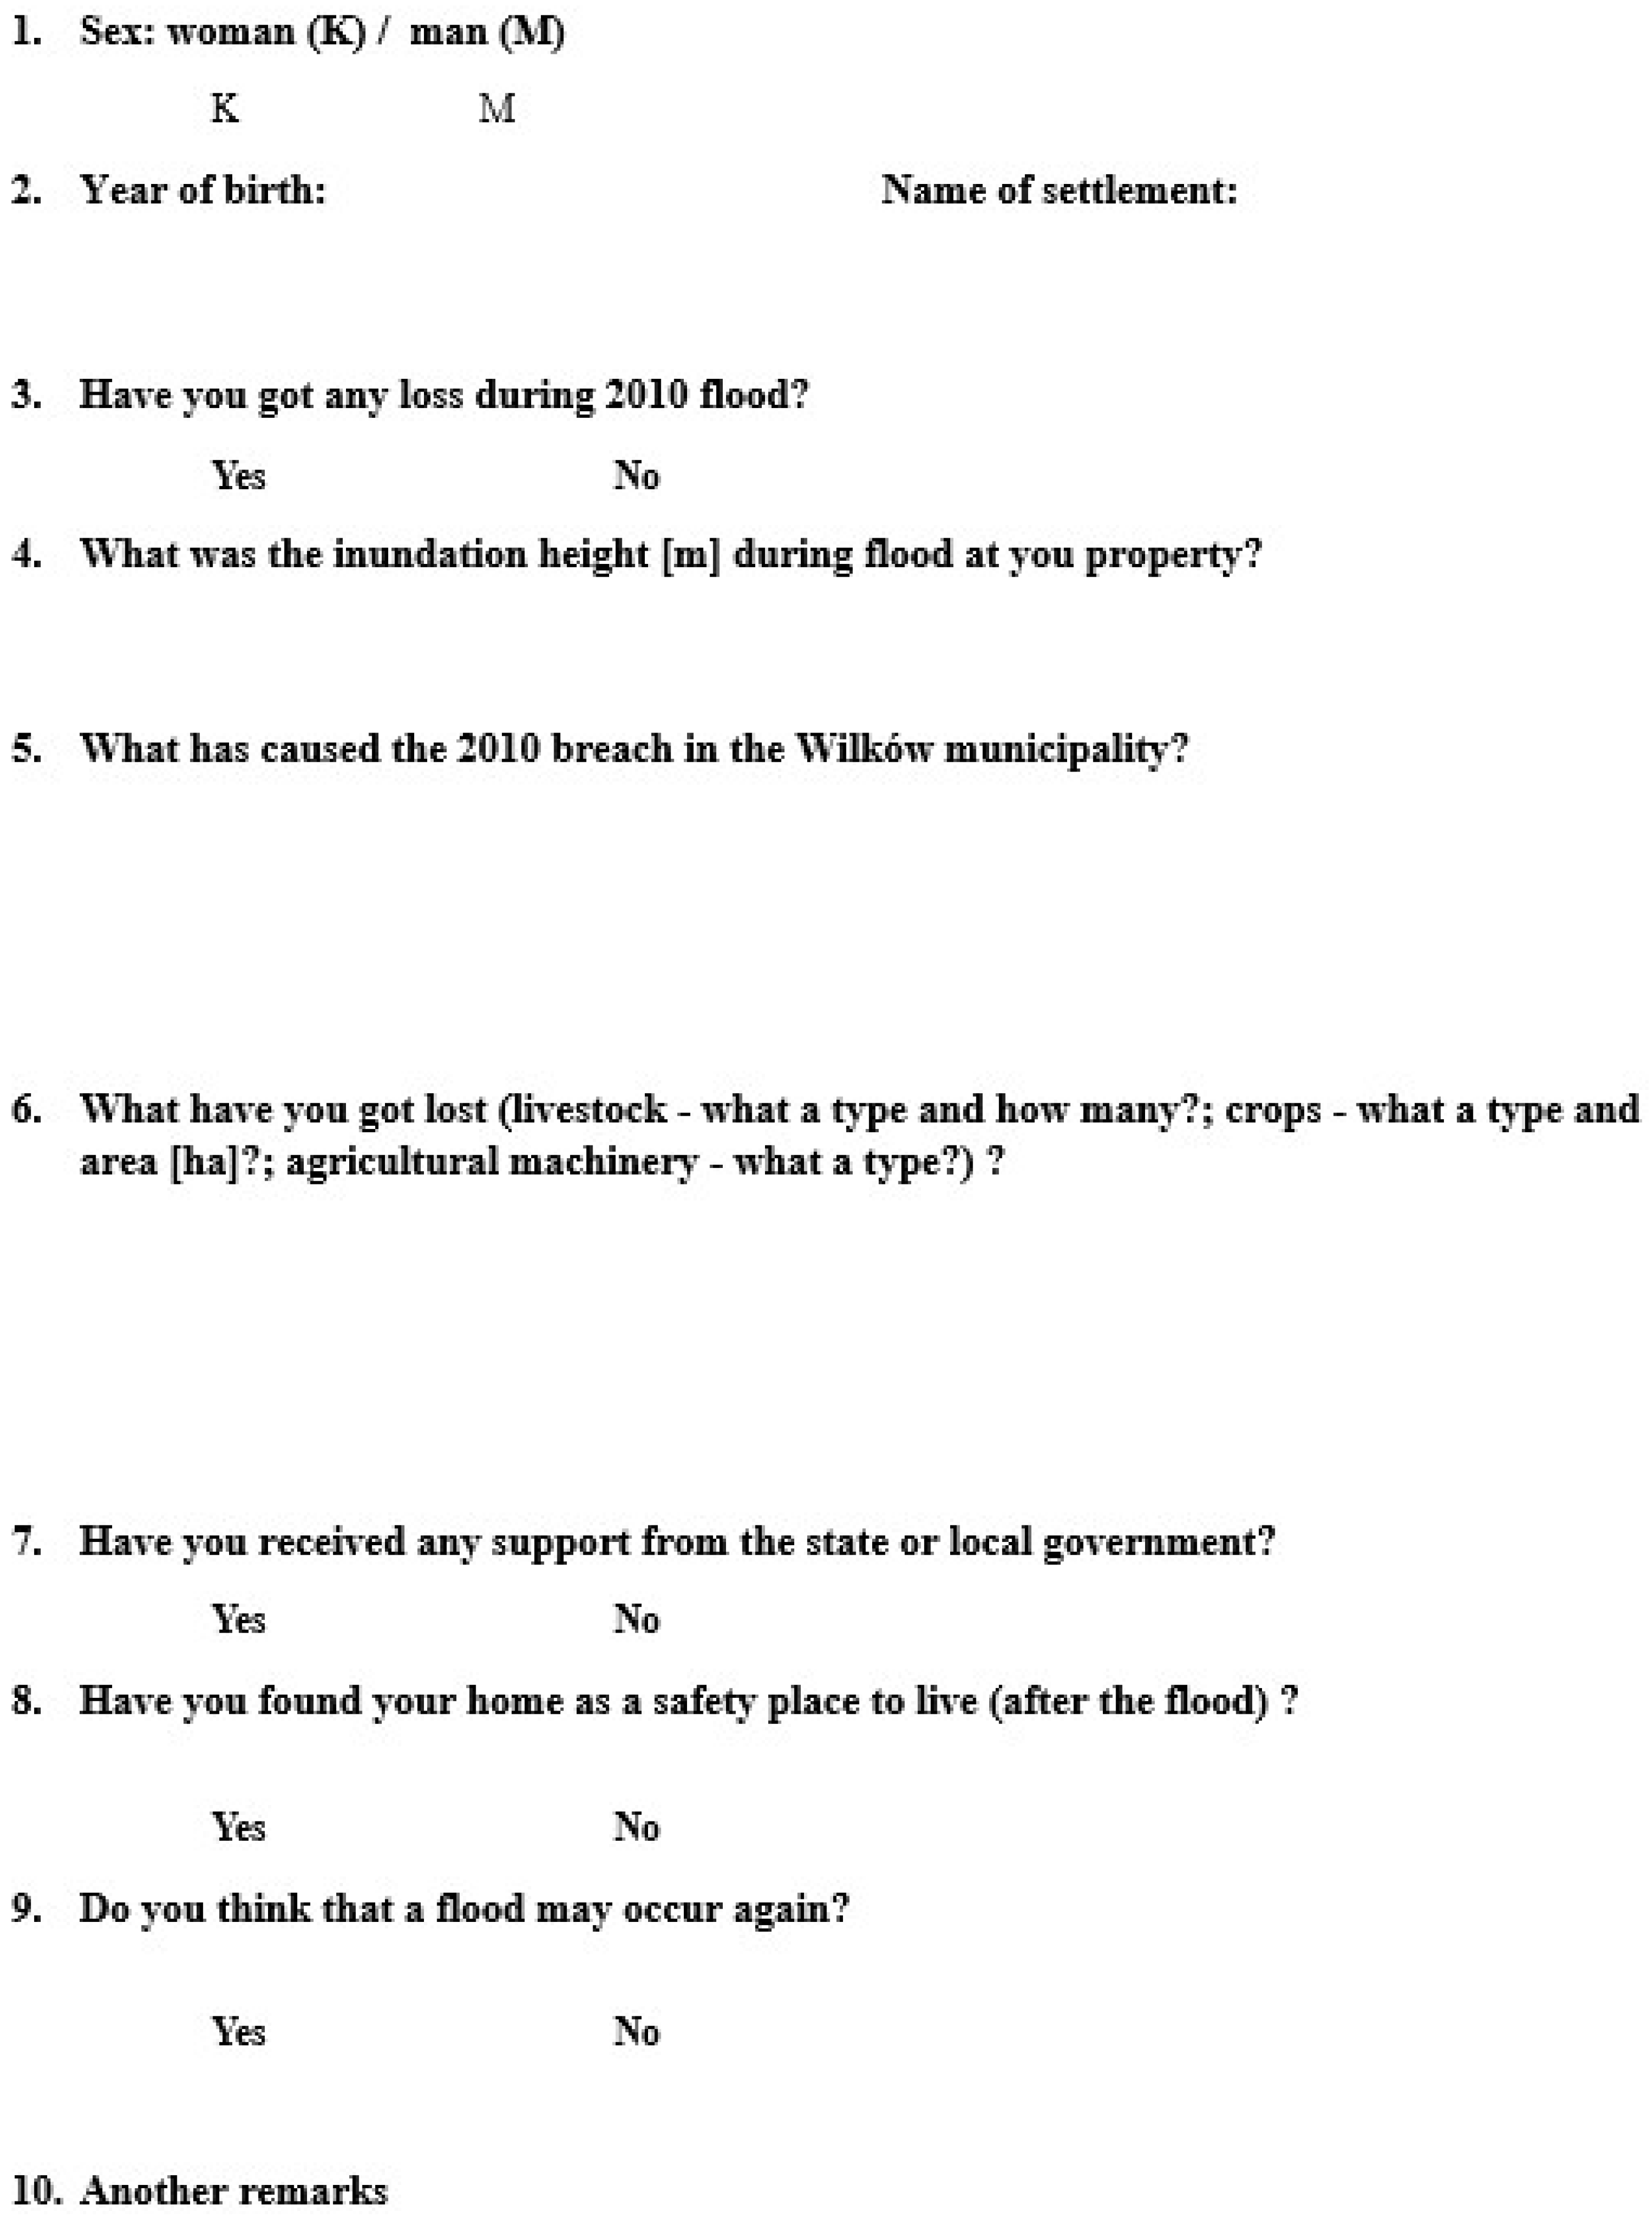
2.2. Methods
2.3. The Origin of the 2010 Pluvial Flood
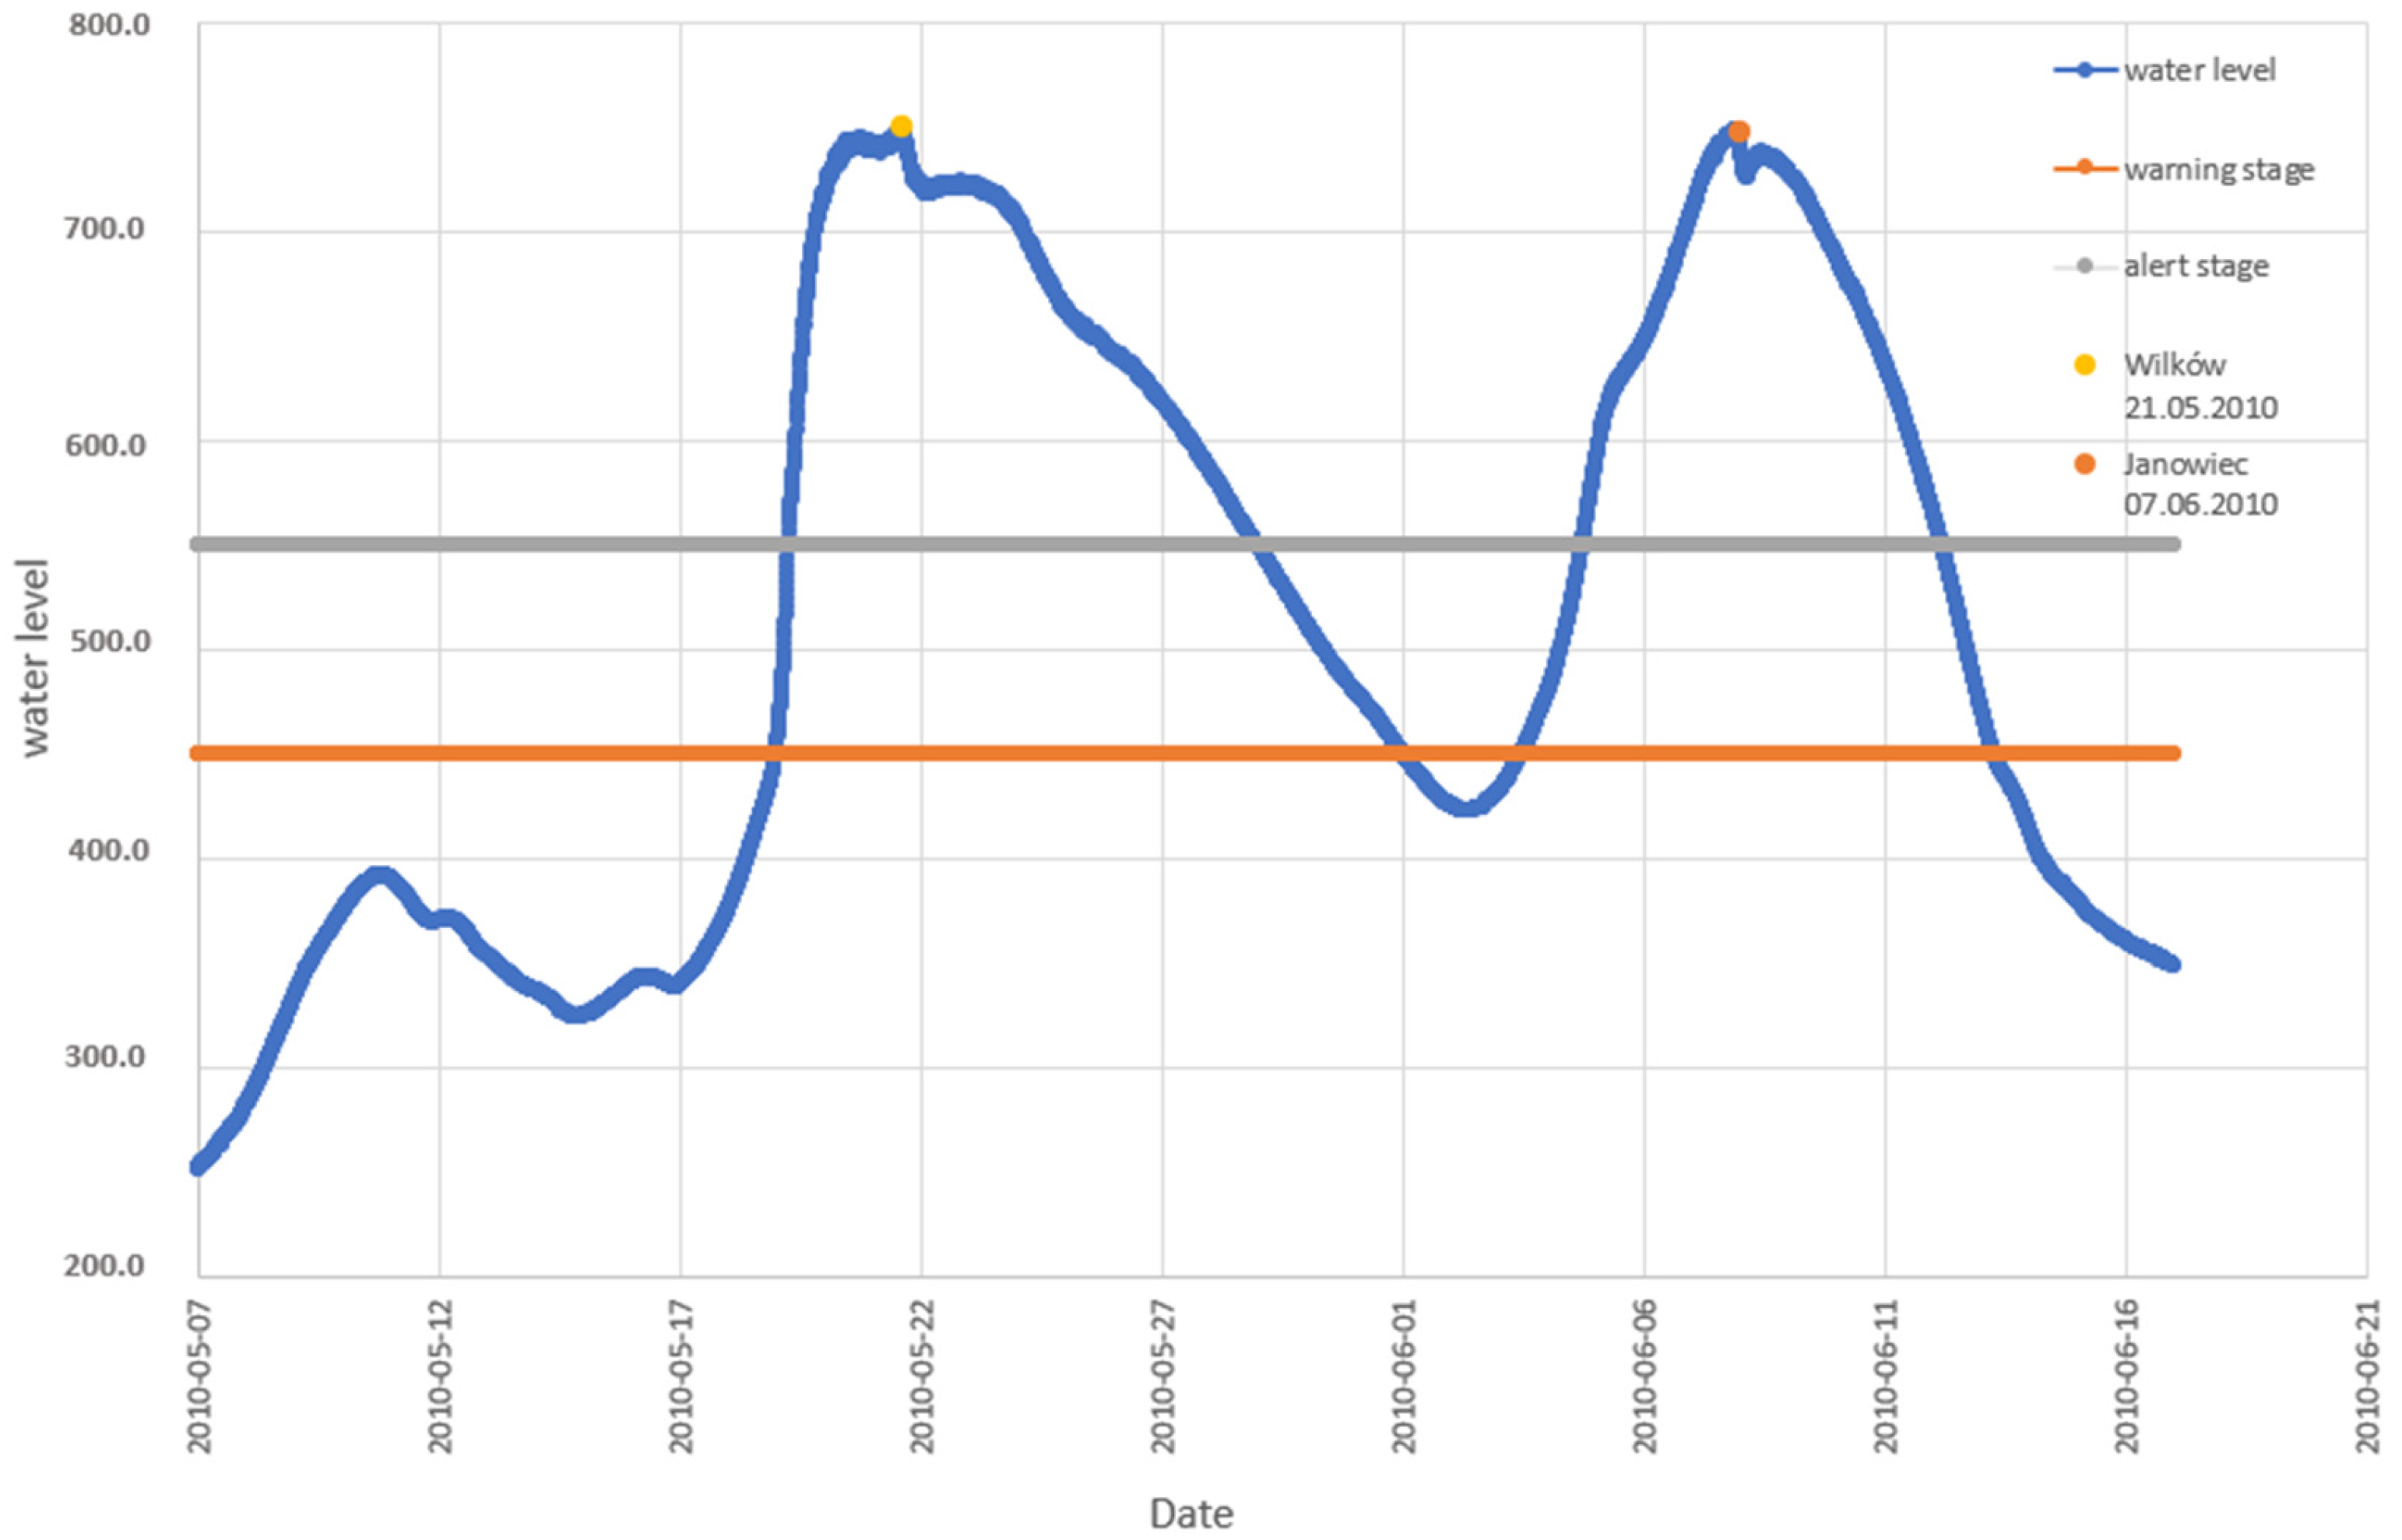
2.4. The 2010 Flood Dynamics in the Middle Vistula River
3. Results
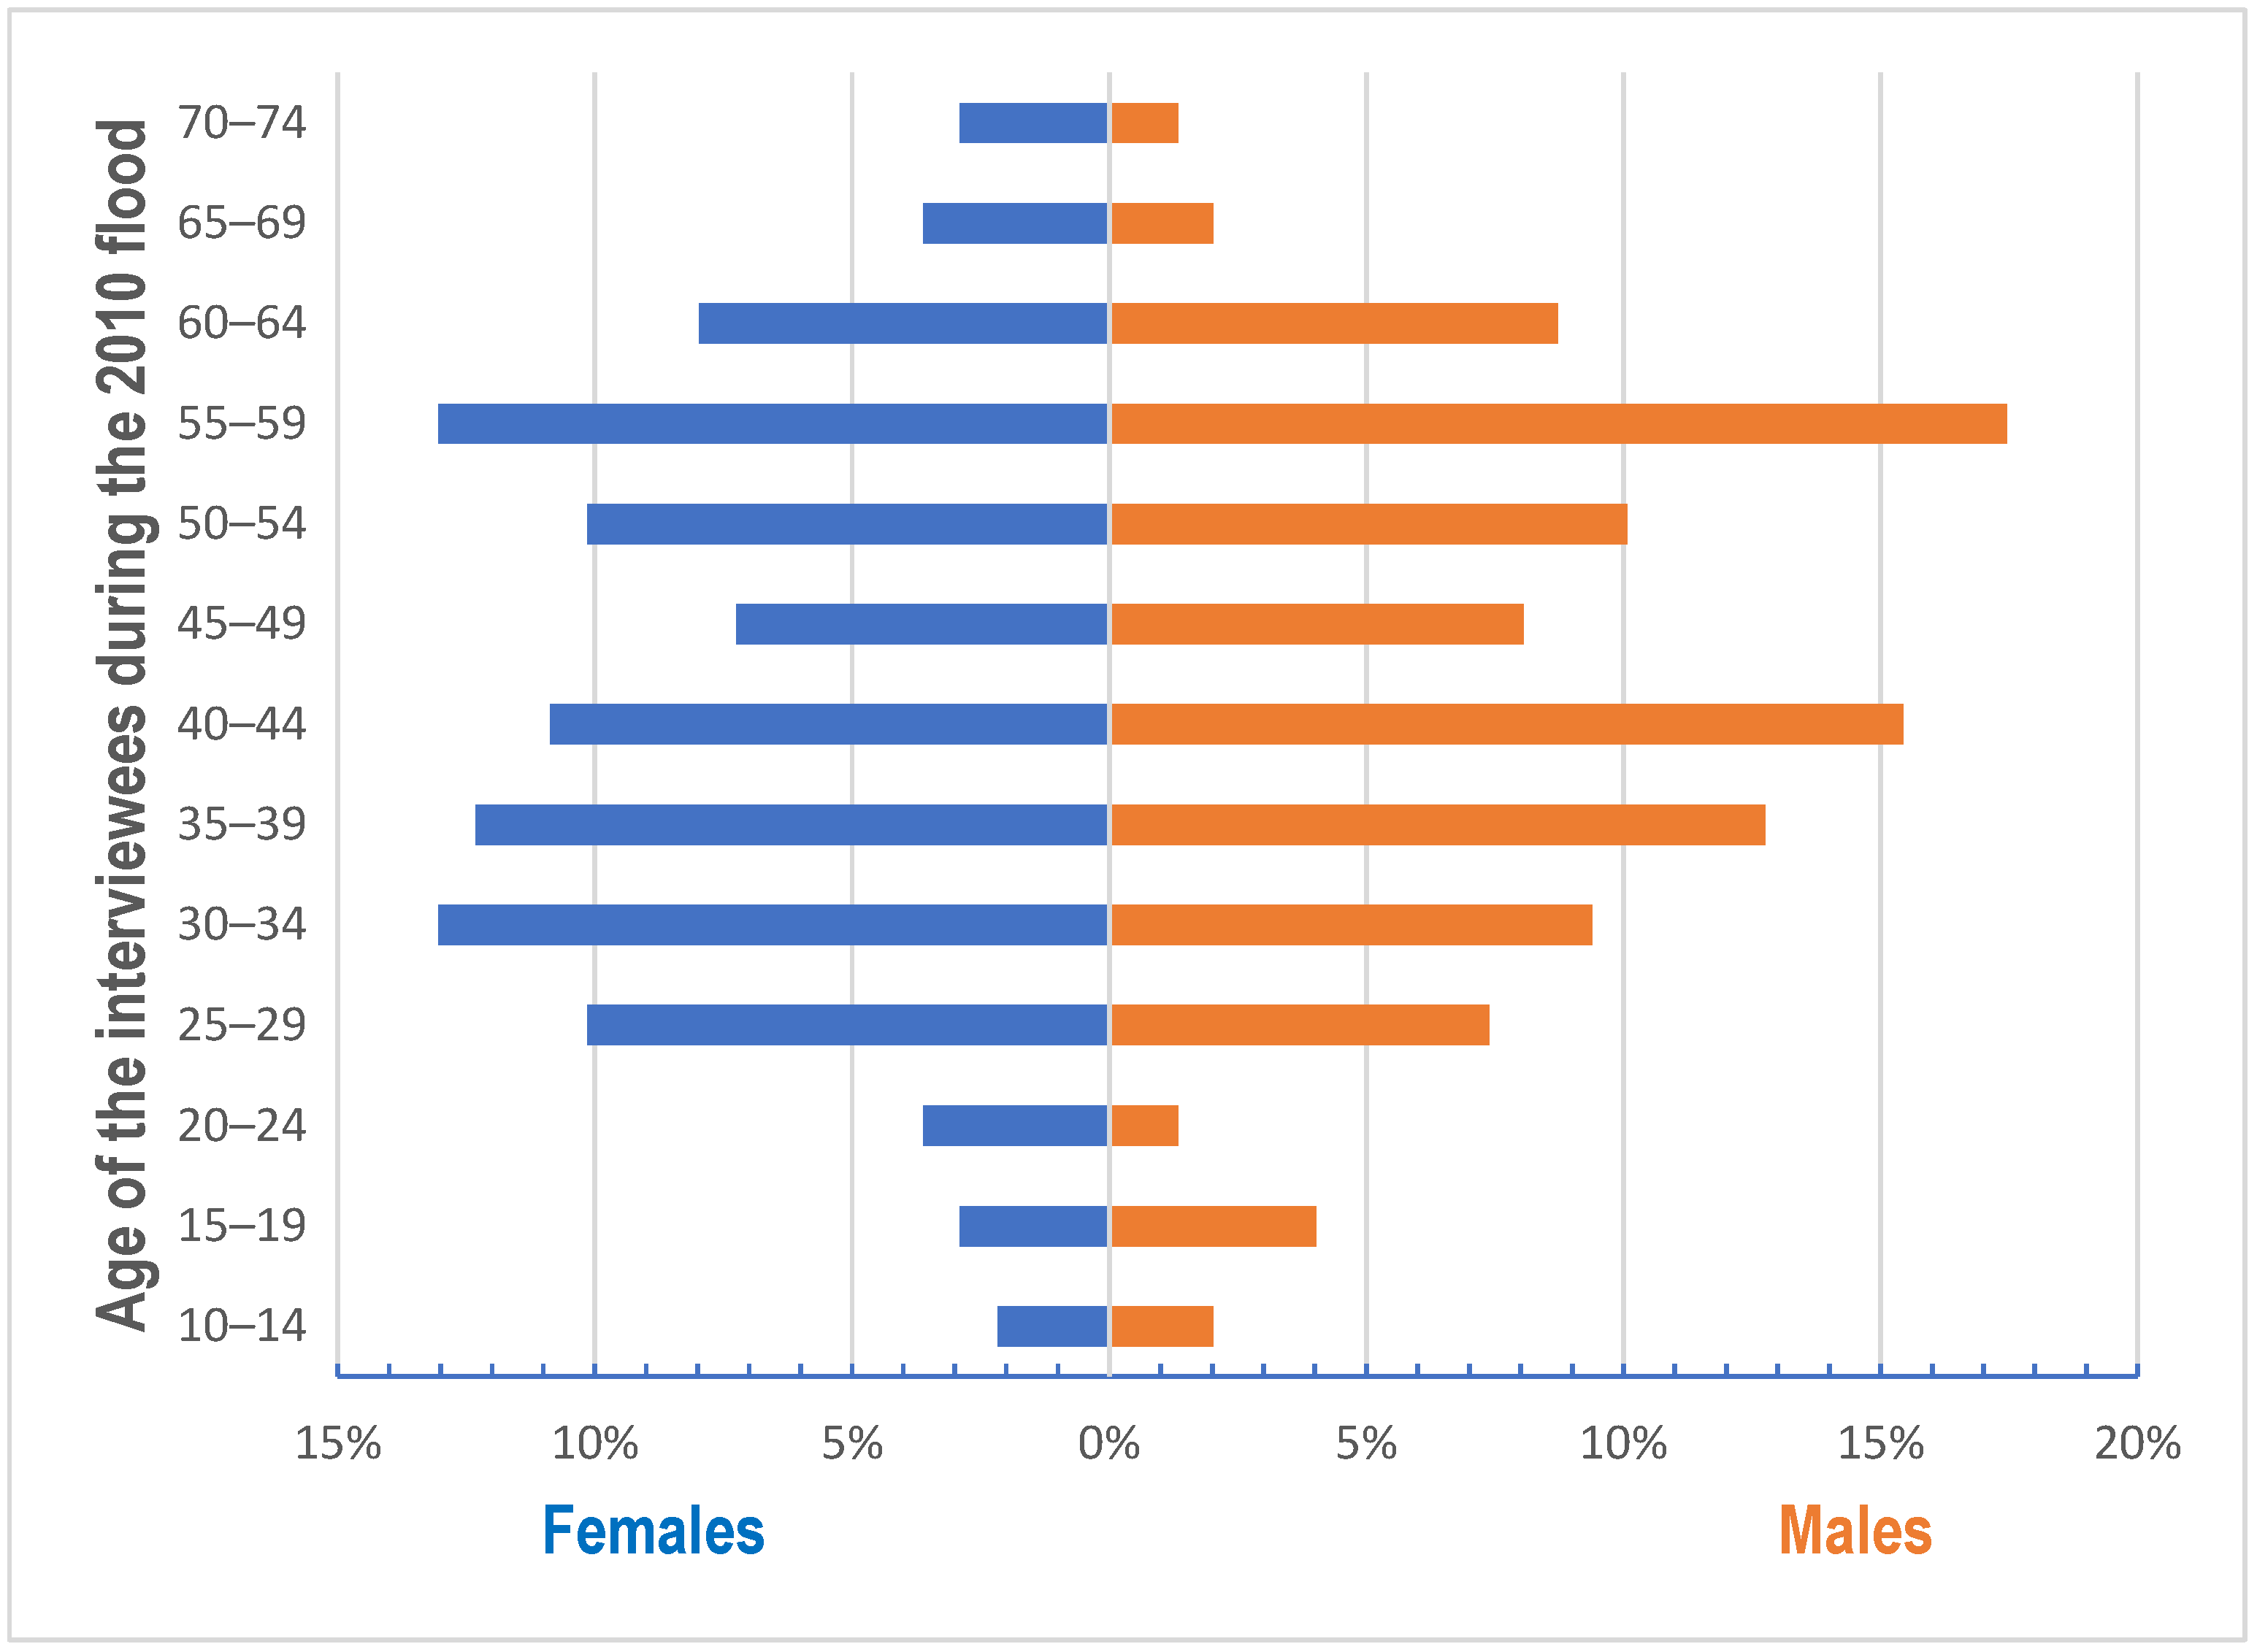
3.1. Population of the Interviewees
3.2. Collective Flood Memory after 12 Years
3.2.1. Inundation Height
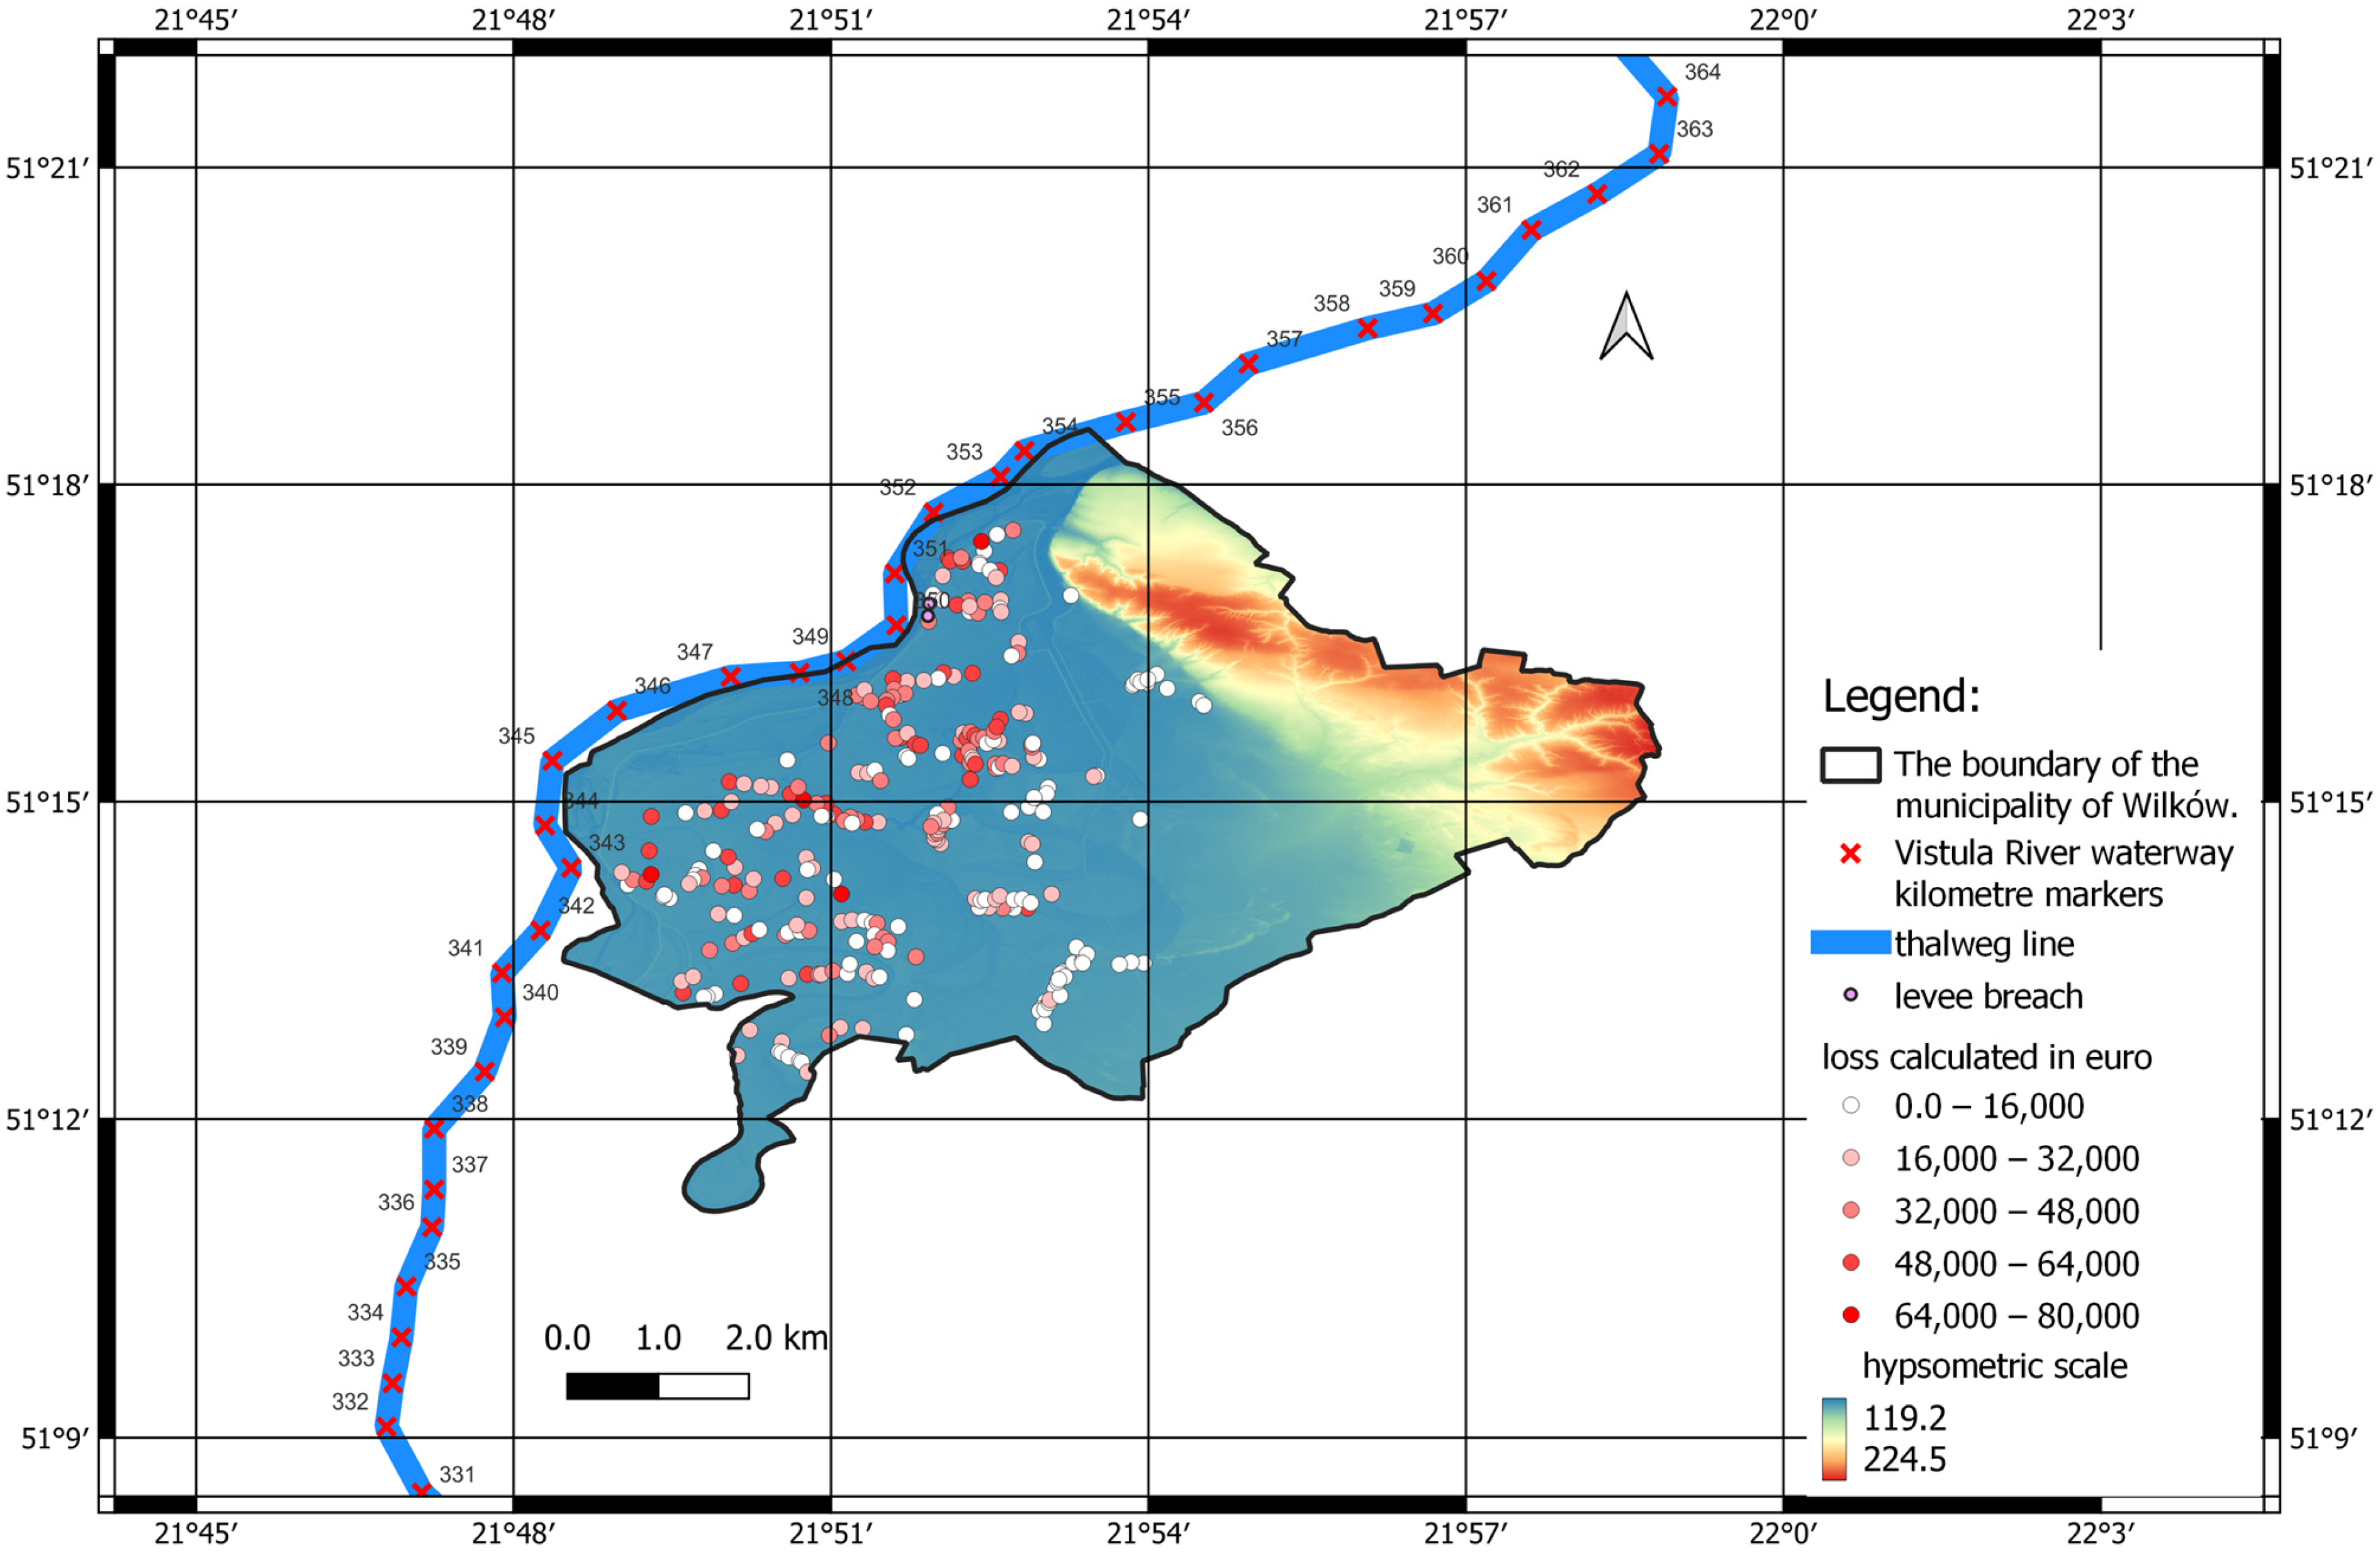
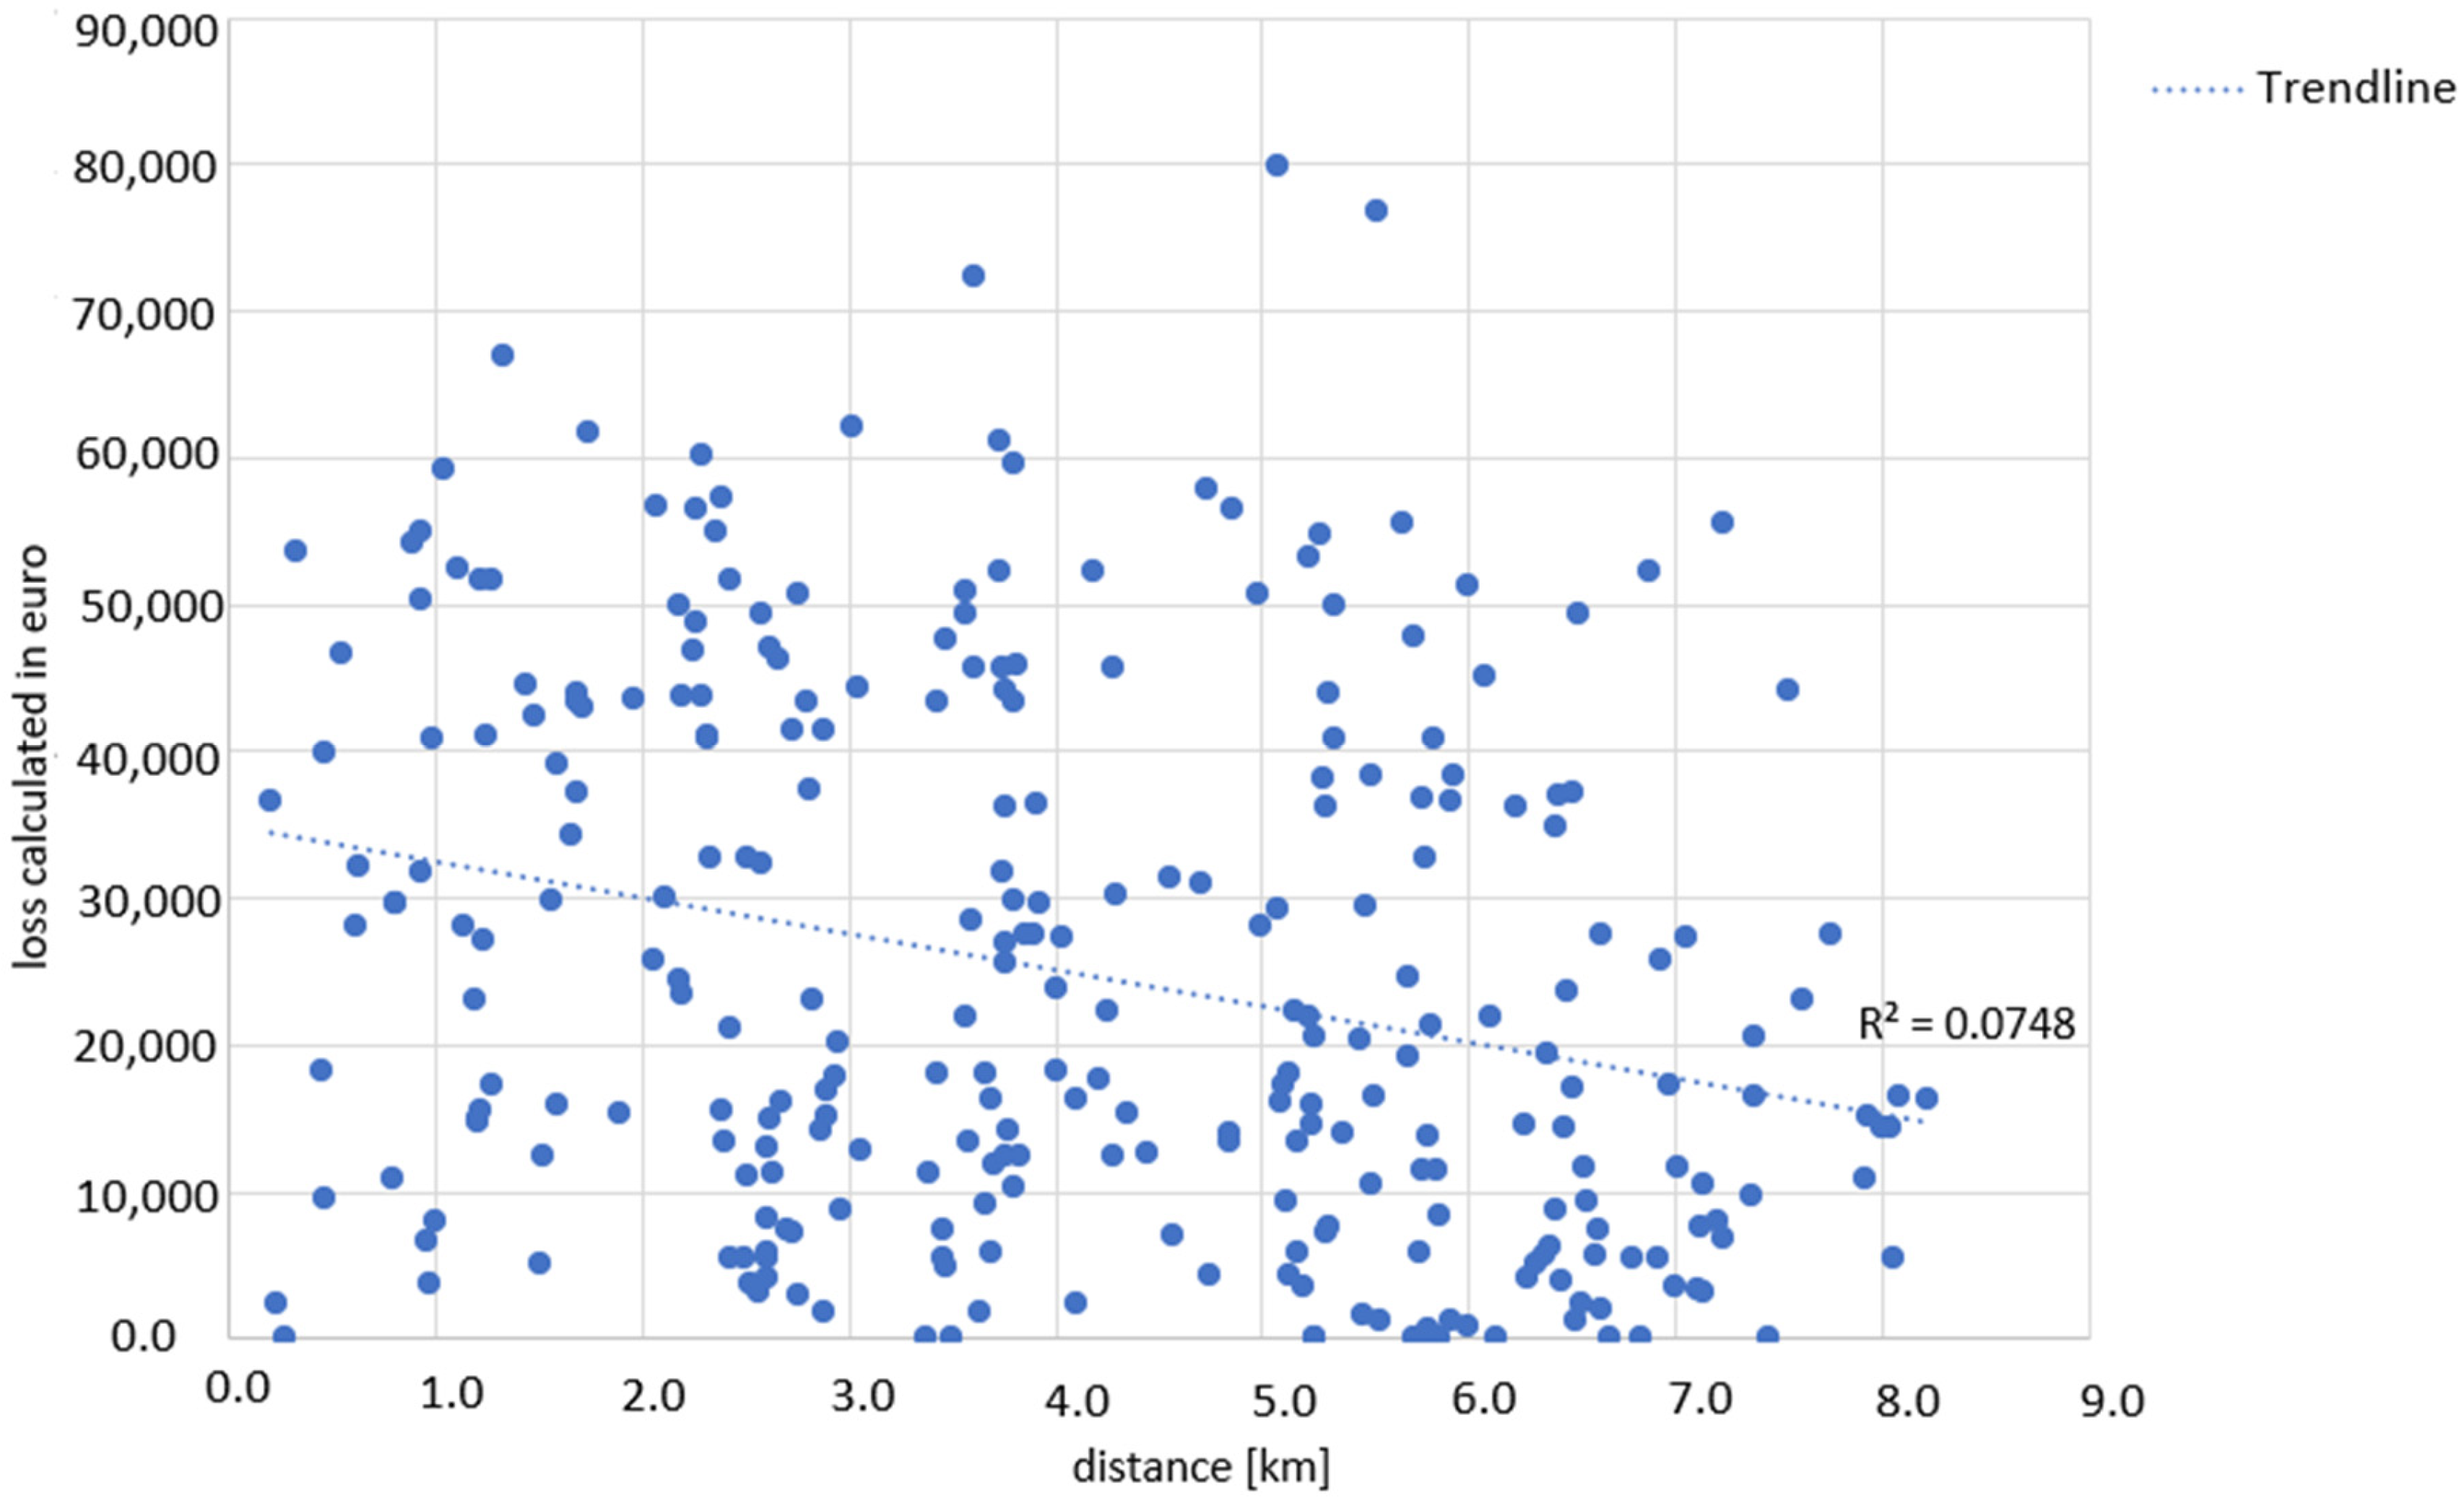
3.2.2. Economic Losses
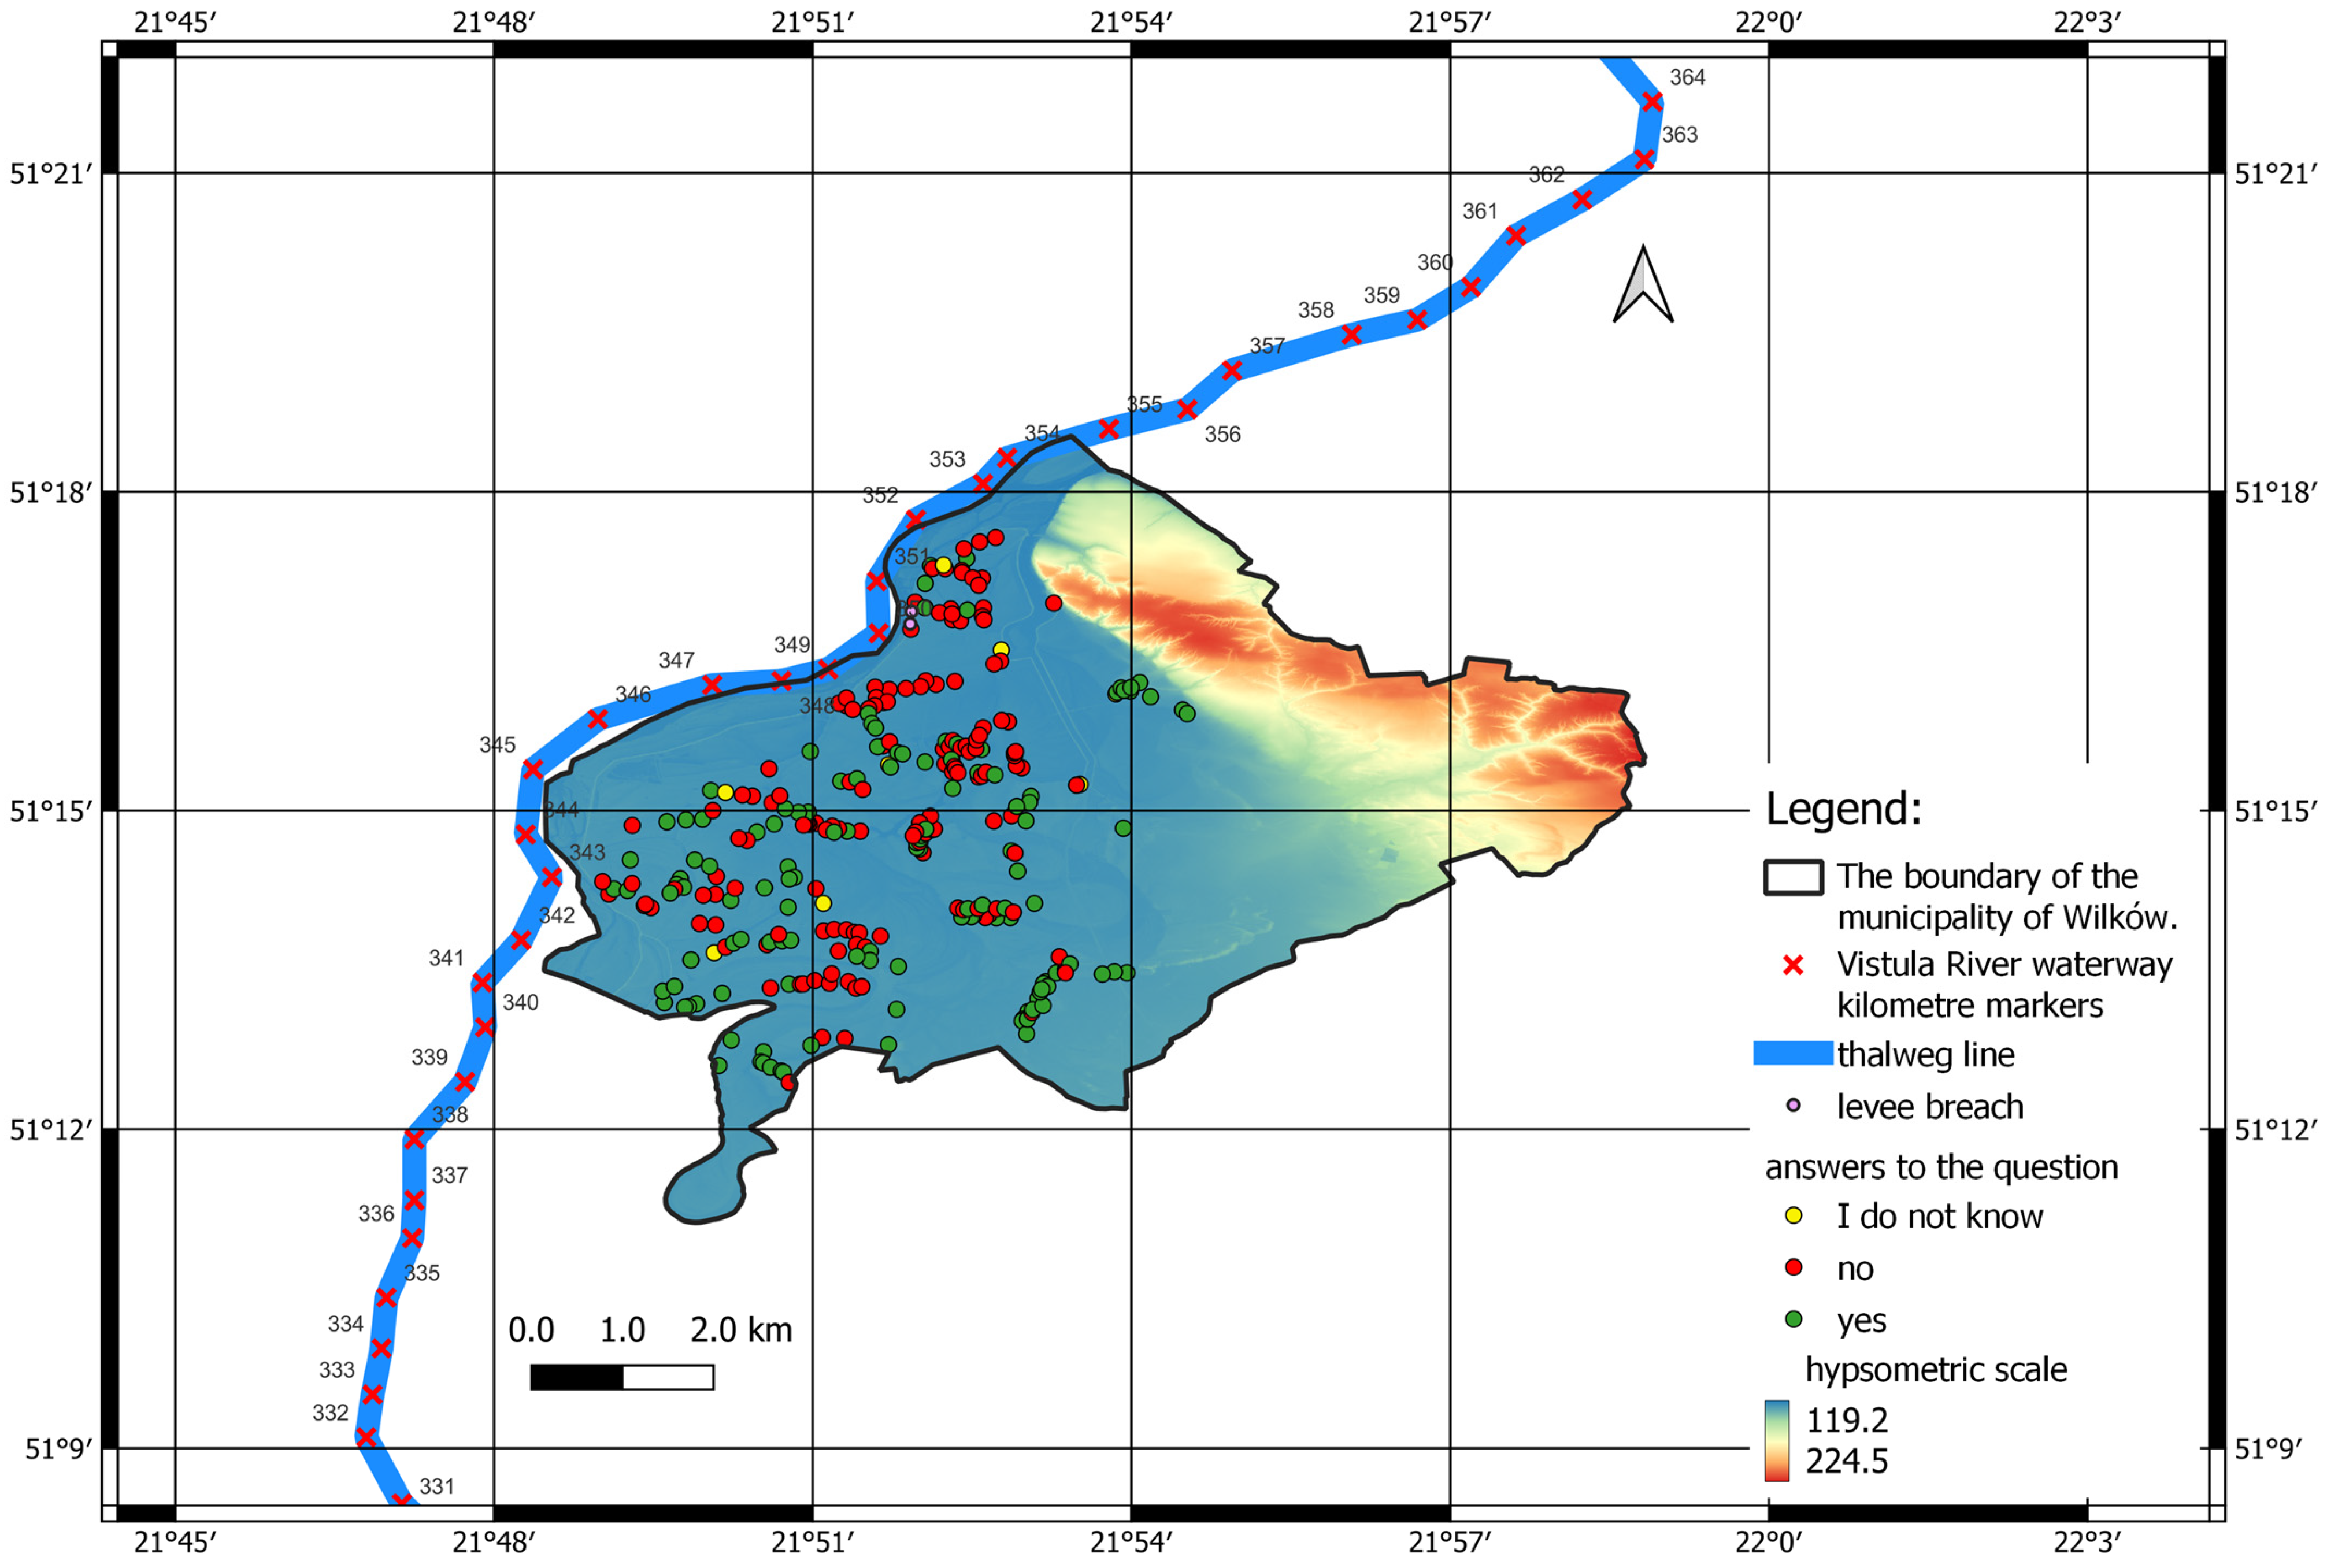
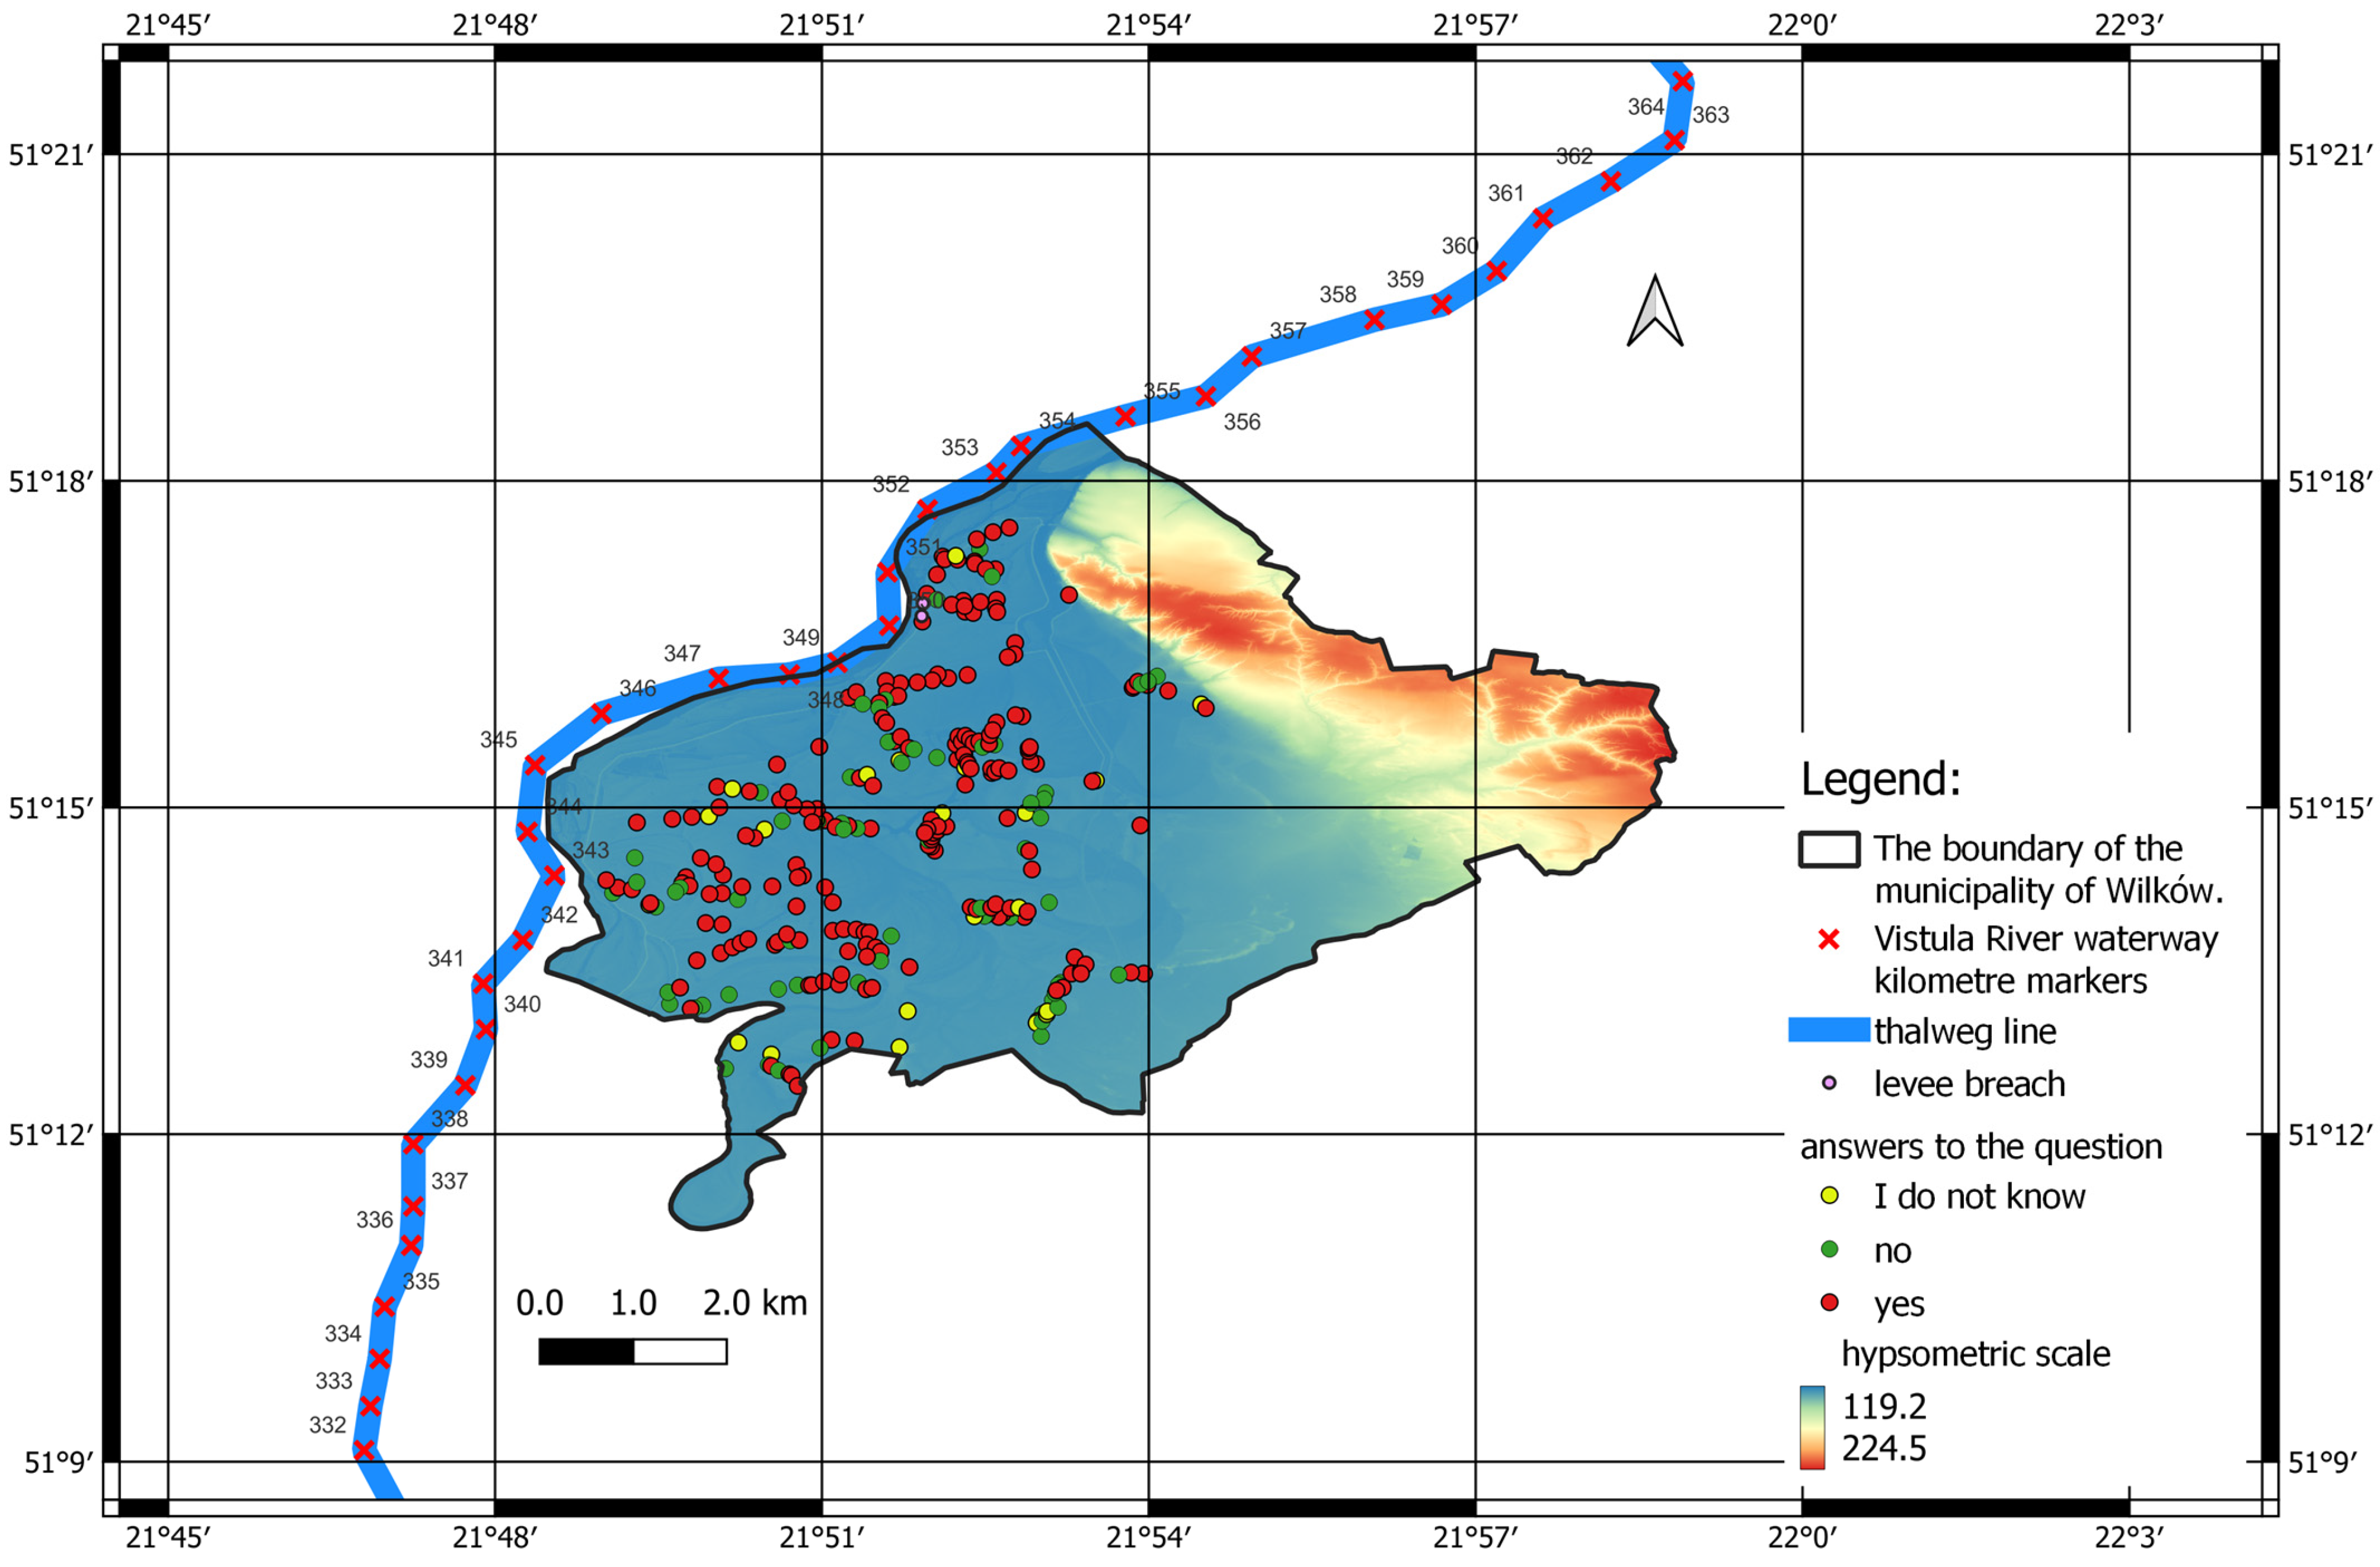
3.2.3. Sense of Place on the Flood-Prone Area: Flood Risk and Recurrence of a Flood
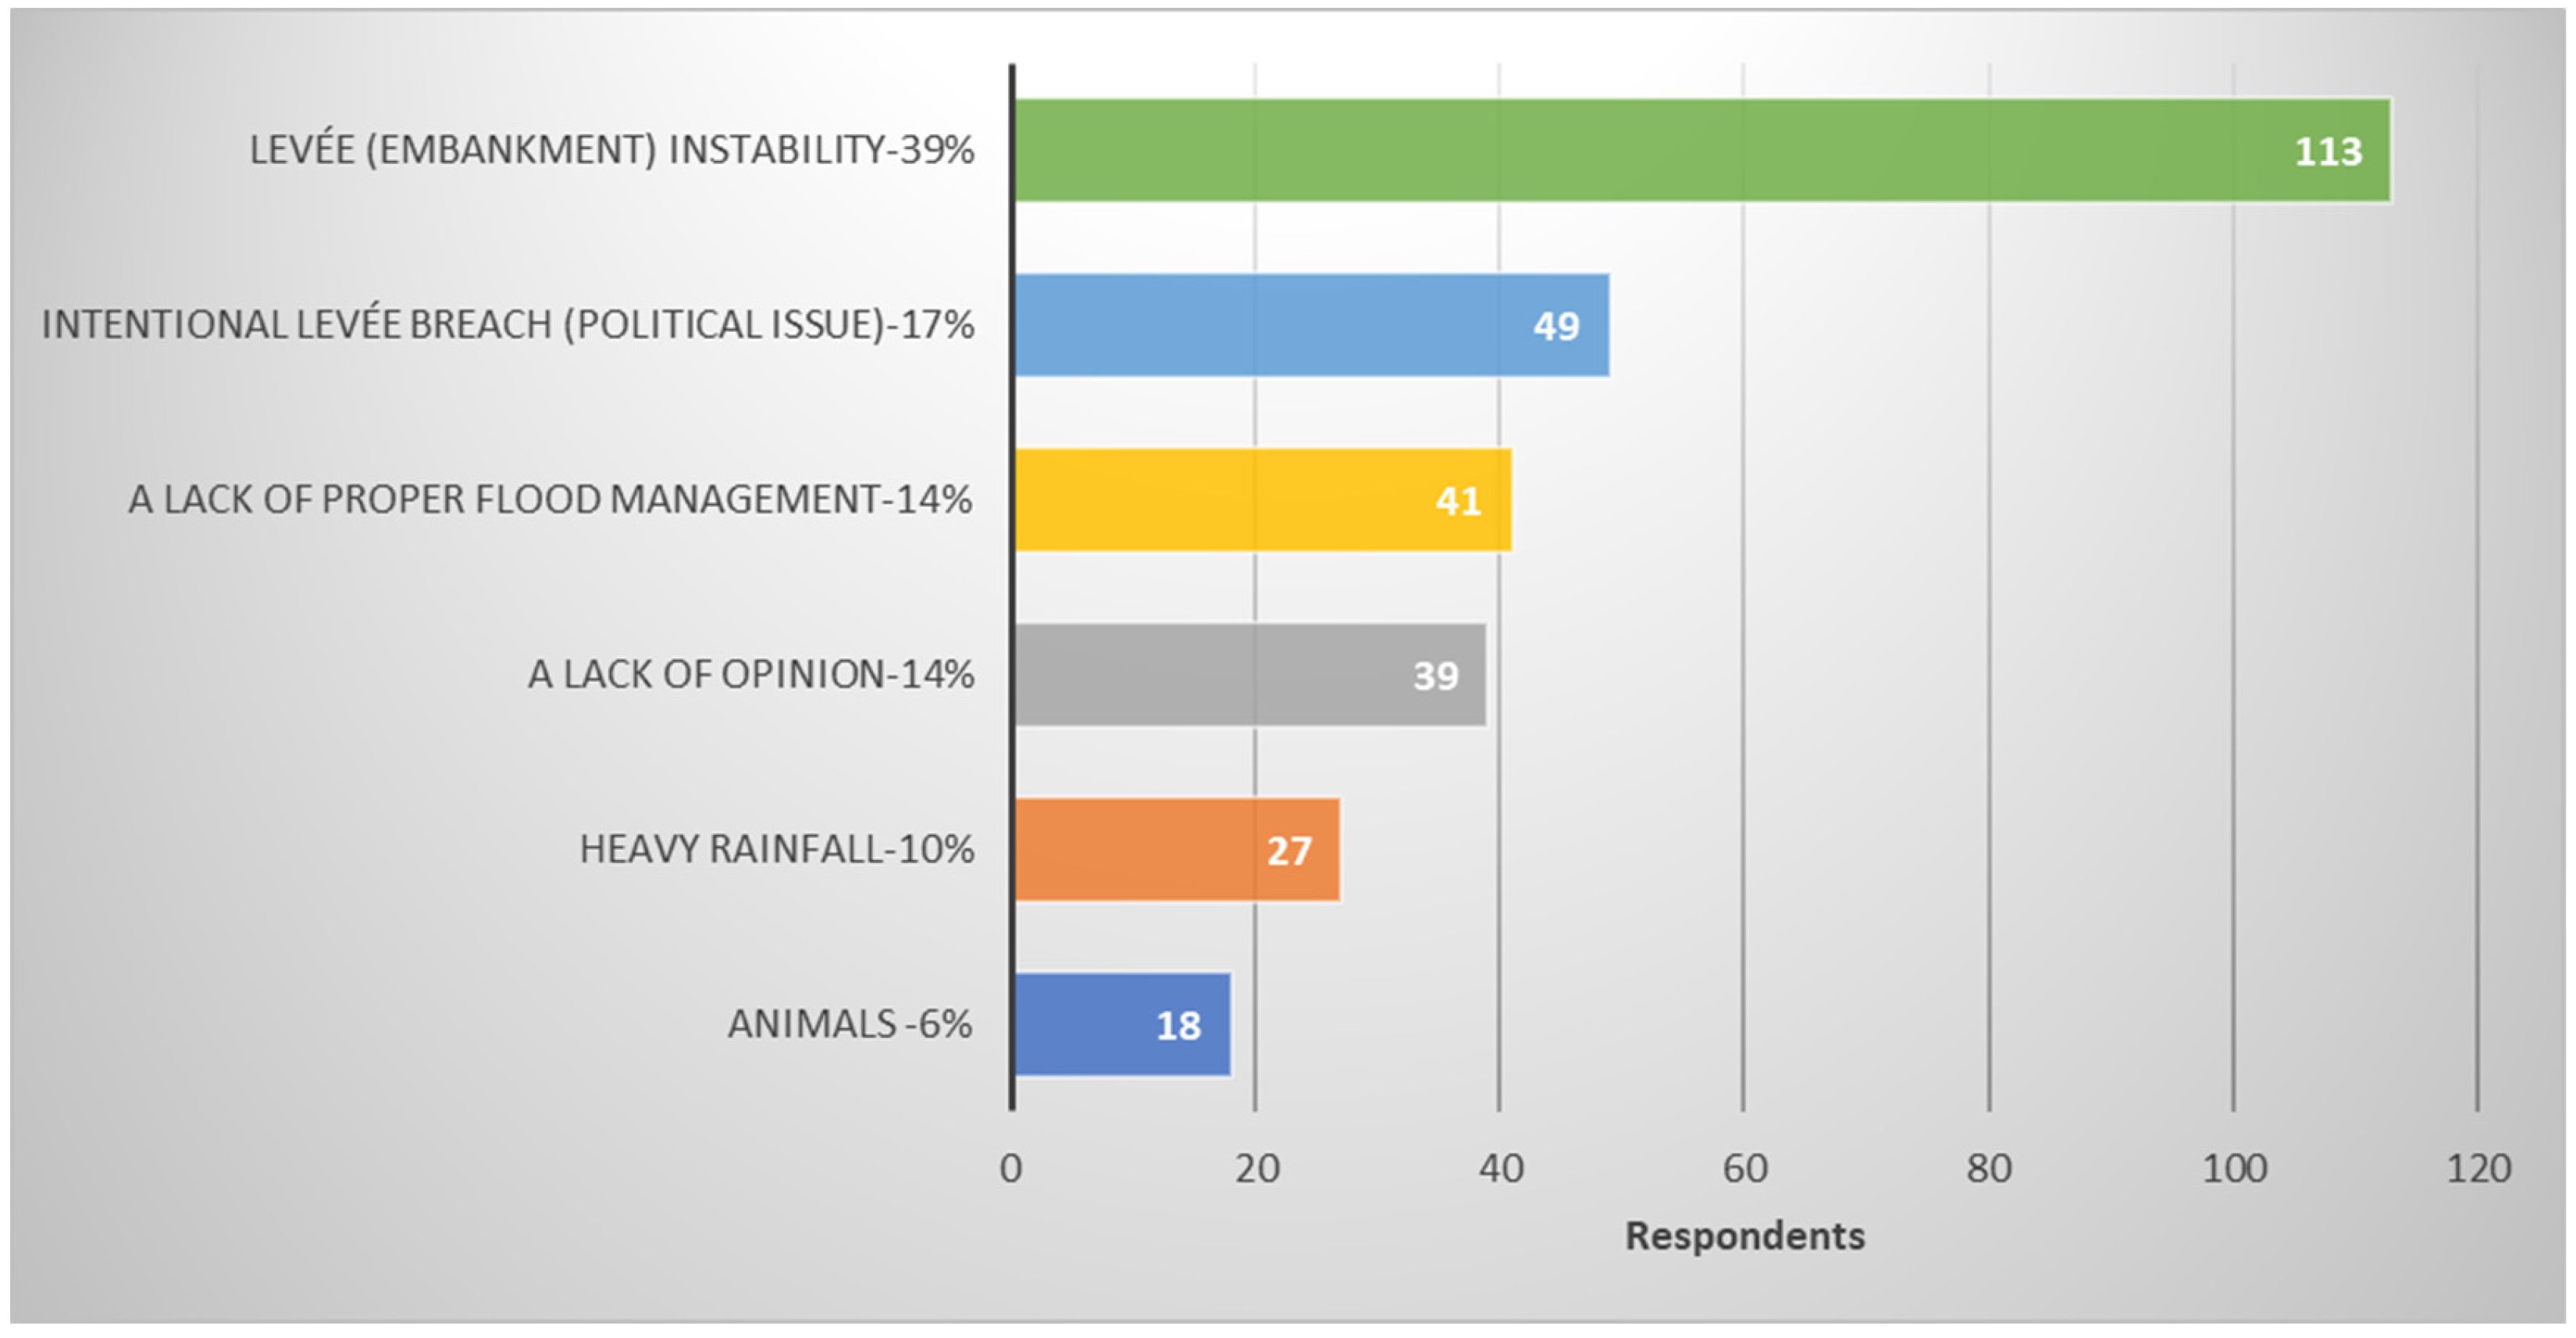
3.2.4. Collective Memory of the Flood’s Causes
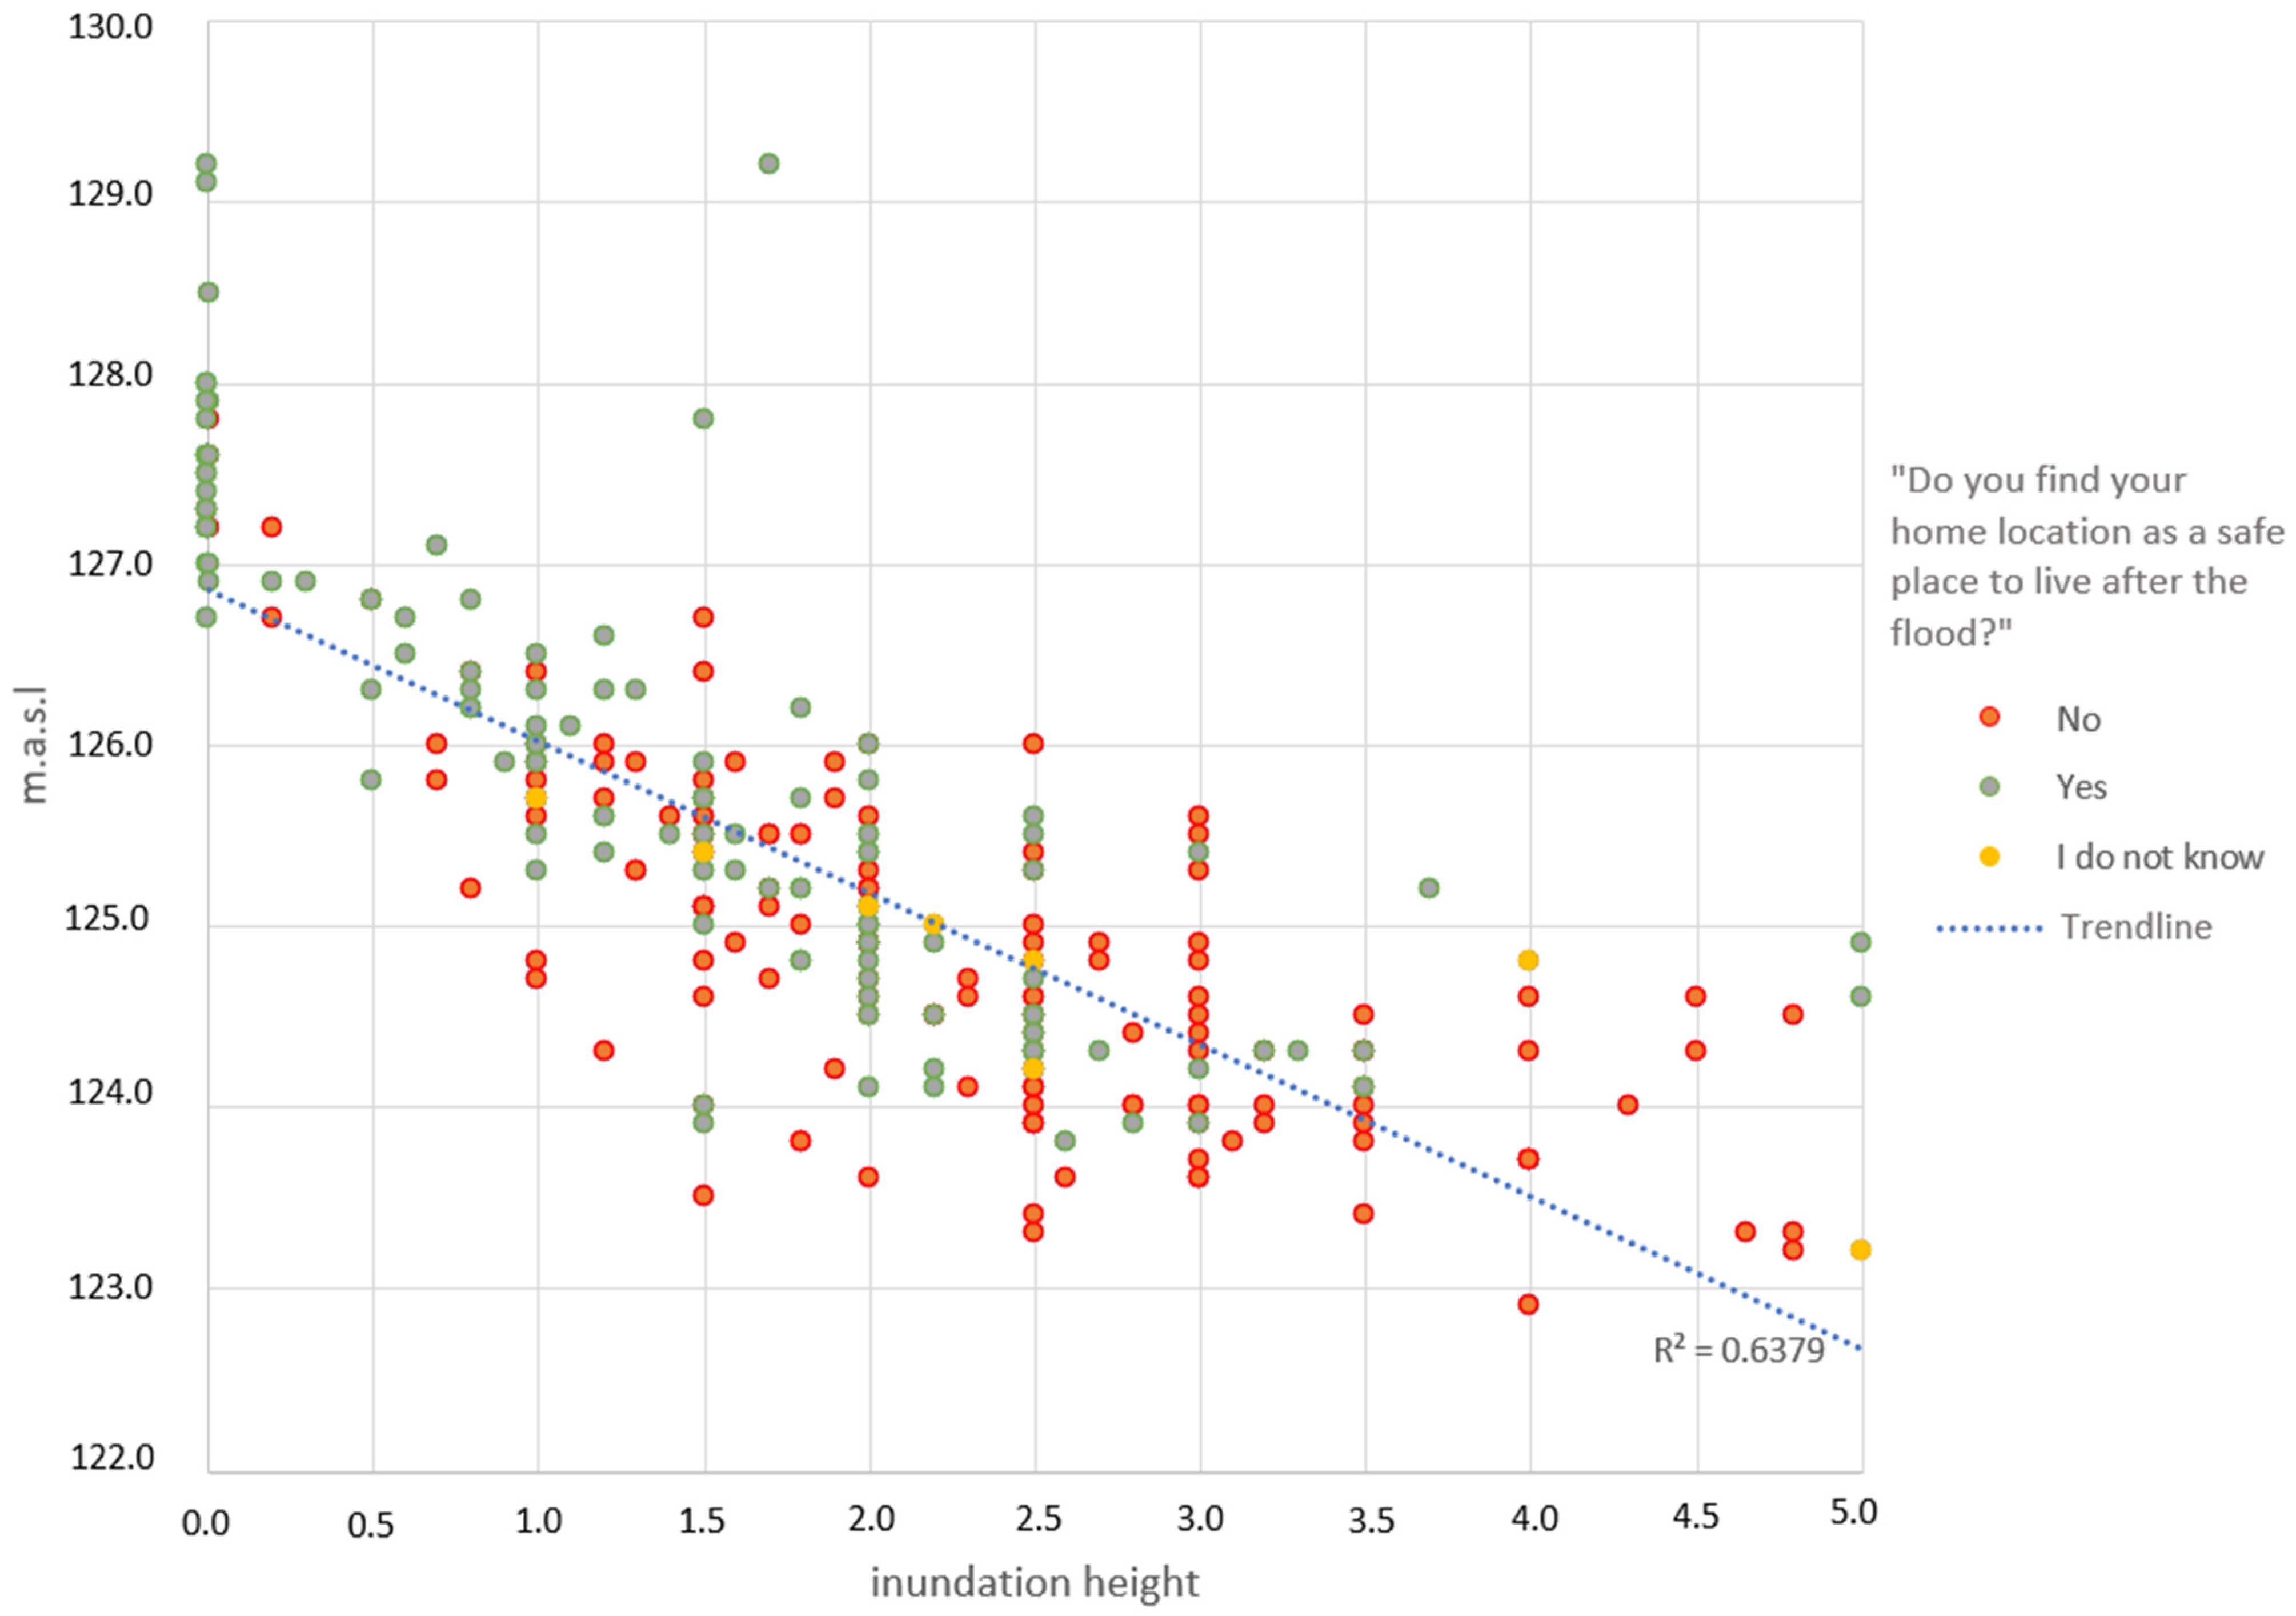
3.2.5. Correlation between Floodplain Height, Inundation Height and Perception of Safety
4. Discussion
5. Conclusions
Author Contributions
Funding
Data Availability Statement
Acknowledgments
Conflicts of Interest
References
- Jotheri, J.; Altaweel, M.; Tuji, A.; Anma, R.; Pennington, B.; Rost, S.; Watanabe, C. Holocene fluvial and anthropogenic processes in the region of Uruk in southern Mesopotamia. Quat. Int. 2018, 483, 57–69. [Google Scholar] [CrossRef]
- Forti, L.; Romano, L.; Celant, A.; D’Agostino, F.; Rita, F.; Jotheri, J.; Magri, D.; Mazzini, I.; Tentori, D.; Milli, S. The paleoenvironment and depositional context of the Sumerian site of Abu Tbeirah (Nasiriyah, southern Mesopotamia, Iraq). Quat. Res. 2022, 110, 165–183. [Google Scholar] [CrossRef]
- Malykhina, I. On the influence of geography on the development of accounting operations in ancient Egypt. Tomsk State Univ. J. Hist. 2015, 36, 59–62. [Google Scholar] [CrossRef]
- Toonen, W.H.J.; Cortebeeck, K.; Hendrickx, S.; Bader, B.; Peeters, J.; Willems, H. The hydro-geomorphological setting of the Old Kingdom town of al-Ashmūnayn in the Egyptian Nile Valley. Geoarchaeology 2022, 37, 267–283. [Google Scholar] [CrossRef]
- Giosan, L.; Clift, P.D.; Macklin, M.G.; Fuller, D.Q.; Constantinescu, S.; Durcan, J.A.; Stevens, T.; Duller, G.A.T.; Tabrez, A.R.; Gangal, K.; et al. Fluvial landscapes of the Harappan civilization. Proc. Natl. Acad. Sci. USA 2012, 109, 1688–1694. [Google Scholar] [CrossRef]
- Chaudhri, A.R.; Chopra, S.; Kumar, P.; Ranga, R.; Singh, Y.; Rajput, S.; Sharma, V.; Verma, V.K.; Sharma, R. Saraswati River in northern India (Haryana) and its role in populating the Harappan civilization sites—A study based on remote sensing, sedimentology, and strata chronology. Archaeol. Prospect. 2021, 28, 565–582. [Google Scholar] [CrossRef]
- Li, K.; Gao, W.; Wu, L.; Hu, H.; Gong, P.; Li, S.; Jin, R.; Si, Y. Spatial Expansion of Human Settlement during the Longshan Period (~4.5–~3.9 ka BP) and Its Hydroclimatic Contexts in the Lower Yellow River Floodplain, Eastern China. Land 2021, 10, 712. [Google Scholar] [CrossRef]
- Gao, W.; Hu, H.; Hou, W.; Zhang, P.; Gong, P.; Jia, W.; Liu, X.; Li, K. The Spatiotemporal Patterns of Human Settlement during the Longshan and Erlitou Periods in Relation to Extreme Floods and Subsistence Strategy in the Upper and Middle Qin River Reaches, Central China. Land 2022, 11, 1088. [Google Scholar] [CrossRef]
- Solís-Castillo, B.; Ortiz-Pérez, M.A.; Solleiro-Rebolledo, E. Unidades geomorfológico-ambientales de las Tierras Bajas Mayas deTabasco-Chiapas en el río Usumacinta: Un registro de los procesosaluviales y pedológicos durante el Cuaternario. Bol. Soc. Geol. Mex. 2014, 66, 279–290. [Google Scholar] [CrossRef]
- Luzzadder-Beach, S.; Beach, T. Arising from the Wetlands: Mechanisms and Chronology of Landscape Aggradation in the Northern Coastal Plain of Belize. Ann. Assoc. Am. Geogr. 2008, 99, 1–26. [Google Scholar] [CrossRef]
- Ramírez-Núñez, C.; Cyphers, A.; Parrot, J.-F.; Höfle, B. Multidirectional interpolation of LIDAR data from southern Veracuz, Mexico: Implications for early Olmec substinence. Anc. Mesoam. 2019, 30, 385–398. [Google Scholar] [CrossRef]
- Stoner, W.D.; Stark, B.L. Distributed Urban Networks in the Gulf Lowlands of Veracruz. J. Archaeol. Res. 2023, 31, 449–501. [Google Scholar] [CrossRef]
- Wotchoko, P.; Bardintzeff, J.-M.; Itiga, Z.; Nkouathio, D.G.; Guedjeo, C.S.; Ngnoupeck, G.; Dongmo, A.K.; Wandji, P. Geohazards (floods and landslides) in the Ndop plain, Cameroon volcanic line. Open Geosci. 2016, 8, 429–449. [Google Scholar] [CrossRef]
- Buchenrieder, G.; Brandl, J.; Balgah, A.R. The Perception of Flood Risks: A Case Study of Babessi in Rural Cameroon. Int. J. Disaster Risk Sci. 2021, 12, 1–21. [Google Scholar] [CrossRef]
- Li, W.-J.; Yu, S.-Y.; Pan, J.; Cao, X.; Chen, Y.; Wang, Y. A 2000-year documentary record of levee breaches on the lower Yellow River and their relationship with climate changes and human activities. Holocene 2021, 31, 333–345. [Google Scholar] [CrossRef]
- Araya, K.; Muñoz, P.; Dezileau, L.; Maldonado, A.; Campos-Caba, R.; Rebolledo, L.; Cardenas, P.; Salamanca, M. Extreme Sea Surges, Tsunamis and Pluvial Flooding Events during the Last ~1000 Years in the Semi-Arid Wetland, Coquimbo Chile. Geosciences 2021, 12, 135. [Google Scholar] [CrossRef]
- Alcayaga, H.; Soto-Alvarez, M.; Laronne, J.B.; Caamaño, D.; Mao, L.; Urrutia, R. Runoff volume and sediment yield from an endorheic watershed generated by rare rainfall events in the Atacama Desert. Geomorphology 2022, 400, 108107. [Google Scholar] [CrossRef]
- Bach, E.; Mote, S.; Krishnamurthy, V.; Sharma, A.S.; Ghil, M.; Kalnay, E. Ensemble Oscillation Correction (EnOC): Leveraging oscillatory modes to improve forecasts of chaotic systems. J. Clim. 2021, 34, 5673–5686. [Google Scholar] [CrossRef]
- Ray, A.; Rakshit, S.; Basak, G.K.; Dana, S.K.; Ghosh, D. Understanding the origin of extreme events in El Niño southern oscillation. Phys. Rev. E 2020, 101, 062210. [Google Scholar] [CrossRef]
- Chang, H.-S.; Su, Q.; Jheng, D.-C. Comparing the spatial patterns of flooding and individual risk perception: A case study of Yunlin, Taiwan. Urban Clim. 2022, 45, 101260. [Google Scholar] [CrossRef]
- Mazzoleni, M.; Brandimarte, L. Modelling flood awareness in floodplain dynamics. Hydrol. Sci. J. 2023, 68, 604–613. [Google Scholar] [CrossRef]
- Ridolfi, E.; Mondino, E.; Di Baldassarre, G. Hydrological risk: Modeling flood memory and human proximity to rivers. Hydrol. Res. 2021, 52, 241–252. [Google Scholar] [CrossRef]
- van Heel, B.F.; van den Born, R.J. Studying residents’ flood risk perceptions and sense of place to inform public participation in a Dutch river restoration project. J. Integr. Environ. Sci. 2020, 17, 35–55. [Google Scholar] [CrossRef]
- Fanta, V.; Šálek, M.; Sklenicka, P. How long do floods throughout the millennium remain in the collective memory? Nat. Commun. 2019, 10, 1105. [Google Scholar] [CrossRef] [PubMed]
- Brandolini, P.; Del Monte, M.; Faccini, F.; Cattoor, B.; Zwoliński, Z.; Smith, M. Geomorphological mapping in urban areas. J. Maps 2021, 17, 1–5. [Google Scholar] [CrossRef]
- Wierzbicki, G.; Ostrowski, P.; Bartold, P.; Bujakowski, F.; Falkowski, T.; Osiński, P. Urban geomorphology of the Vistula River valley in Warsaw. J. Maps 2021, 17, 170–185. [Google Scholar] [CrossRef]
- Forno, M.G.; Gianotti, F. The Turin fluvial terraces as evidence of the new Holocene setting of the Po River. J. Maps 2020, 17, 75–85. [Google Scholar] [CrossRef]
- Łajczak, A.; Zarychta, R.; Wałek, G. Changes in the topography of Krakow city centre, Poland, during the last millennium. J. Maps 2020, 17, 186–193. [Google Scholar] [CrossRef]
- Zwoliński, Z.; Jasiewicz, J.; Mazurek, M.; Hildebrandt-Radke, I.; Makohonienko, M. Geohazards and Geomorphological Setting in Poznań Urban Area, Poland. J. Maps 2021, 17, 202–214. [Google Scholar] [CrossRef]
- Anderson, E.P.; Jackson, S.; Tharme, R.E.; Douglas, M.; Flotemersch, J.E.; Zwarteveen, M.; Lokgariwar, C.; Montoya, M.; Wali, A.; Tipa, G.T.; et al. Understanding rivers and their social relations: A critical step to advance environmental water management. Wiley Interdiscip. Rev. Water 2019, 6, e1381. [Google Scholar] [CrossRef]
- Buckland, J.; Rahman, M. Community-based Disaster Management During the 1997 Red River Flood in Canada. Disasters 1999, 23, 174–191. [Google Scholar] [CrossRef] [PubMed]
- Garau, E.; Torralba, M.; Pueyo-Ros, J. What is a river basin? Assessing and understanding the sociocultural mental constructs of landscapes from different stakeholders across a river basin. Landsc. Urban Plan. 2021, 214, 104192. [Google Scholar] [CrossRef]
- Koutsovili, E.I.; Tzoraki, O.; Kalli, A.A.; Provatas, S.; Gaganis, P. Participatory approaches for planning nature-based solutions in flood vulnerable landscapes. Environ. Sci. Policy 2023, 140, 12–23. [Google Scholar] [CrossRef]
- de Brito, M.M.; Evers, M.; Almoradie, A.D.S. Participatory flood vulnerability assessment: A multi-criteria approach. Hydrol. Earth Syst. Sci. 2018, 22, 373–390. [Google Scholar] [CrossRef]
- Blöschl, G.; Hall, J.; Parajka, J.; Perdigão, R.A.P.; Merz, B.; Arheimer, B.; Aronica, G.T.; Bilibashi, A.; Bonacci, O.; Borga, M.; et al. Changing climate shifts timing of European floods. Science 2017, 357, 588–590. [Google Scholar] [CrossRef] [PubMed]
- Venegas-Cordero, N.; Kundzewicz, Z.W.; Jamro, S.; Piniewski, M. Detection of trends in observed river floods in Poland. J. Hydrol. Reg. Stud. 2022, 41, 101098. [Google Scholar] [CrossRef]
- Lindenschmidt, K.-E. RIVICE—A Non-Proprietary, Open-Source, One-Dimensional River-Ice Model. Water 2017, 9, 314. [Google Scholar] [CrossRef]
- Solon, J.; Borzyszkowski, J.; Bidłasik, M.; Richling, A.; Badora, K.; Balon, J.; Brzezińska-Wójcik, T.; Chabudziński, Ł.; Dobrowolski, R.; Grzegorczyk, I.; et al. Physico-geographical mesoregions of Poland: Verification and adjustment of boundaries on the basis of contemporary spatial data. Geogr. Pol. 2018, 91, 143–170. [Google Scholar] [CrossRef]
- Goudie, A. Alphabetical Gloassary of Gemorphology. Available online: http://www.geomorph.org/wp-content/uploads/2015/06/GLOSSARY_OF_GEOMORPHOLOGY1.pdf (accessed on 8 September 2023).
- Wierzbicki, G.; Ostrowski, P.; Samulski, M.; Bujakowski, F. The impact of geological setting into a dynamics of extreme floods—A case study of the 2010 flood event in the vistula valley. Infrastruct. Ecol. Rural Areas 2012, 3, 27–41. [Google Scholar]
- Wierzbicki, G.; Ostrowski, P.; Falkowski, T.; Mazgajski, M. Geological setting control of flood dynamics in lowland rivers (Poland). Sci. Total Environ. 2018, 636, 367–382. [Google Scholar] [CrossRef]
- Falkowski, T. Alluvial bottom geology inferred as a factor controlling channel flow along the Middle Vistula River, Poland. Geol. Q. 2007, 51, 91–102. [Google Scholar]
- Falkowski, T. Factors of Natural Stability of the Middle Vistula River Channel Zones. “Treatises and Monographs”; SGGW: Warszawa, Poland, 2006. [Google Scholar]
- Wierzbicki, G.; Ostrowski, P.; Mazgajski, M.; Bujakowski, F. Using VHR multispectral remote sensing and LIDAR data to determine the geomorphological effects of overbank flow on a floodplain (the Vistula River, Poland). Geomorphology 2013, 183, 73–81. [Google Scholar] [CrossRef]
- Bihałowicz, J.S.; Wierzbicki, G. Rivers Try Harder. Reversed “Differential Erosion” as Geological Control of Flood in the Large Fluvial Systems in Poland. Water 2021, 13, 424. [Google Scholar] [CrossRef]
- Kallio, H.; Pietilä, A.-M.; Johnson, M.; Kangasniemi, M. Systematic methodological review: Developing a framework for a qualitative semi-structured interview guide. J. Adv. Nurs. 2016, 72, 2954–2965. [Google Scholar] [CrossRef]
- Kurczyński, Z.; Bakuła, K. Generowanie referencyjnego numerycznego modelu terenu o zasięgu krajowym w oparciu o lotnicze skanowanie laserowe w projekcie ISOK. Arch. Fotogram. Kartogr. Teledetekcji 2013, 59–68. [Google Scholar]
- Gałaś, A. Impact of volcanic eruptions on the environment and climatic conditions in the area of Poland (Central Europe). Earth-Sci. Rev. 2016, 162, 58–64. [Google Scholar] [CrossRef]
- Bissolli, P.; Friedrich, K.; Rapp, J.; Ziese, M. Flooding in eastern central Europe in May 2010—Reasons, evolution and climatological assessment. Weather 2011, 66, 147–153. [Google Scholar] [CrossRef]
- Cebulak, E.; Kilar, P.; Milanówka, D.; Mizera, M.; Pyrc, R. Wysokość, natężenie i przestrzenny rozkład opadów atmosferycznych. In Dorzecze Wisły. Monografia Powodzi Maj-Czerwiec 2010; Maciejewski, M., Ostojski, M.S., Walczykiewicz, T., Eds.; IMGW-PIB: Warszawa, Poland, 2011; pp. 27–41. [Google Scholar]
- Magnuszewski, A.; Gutry-Korycka, M.; Mikulski, Z. Historyczne i współczesne warunki przepływu wód wielkich Wisły w Warszawie. Część I. Gospod. Wodna 2012, 1, 9–18. [Google Scholar]
- Rizzo, C.; Maranzoni, A.; D’Oria, M. Probabilistic mapping and sensitivity assessment of dam-break flood hazard. Hydrol. Sci. J. 2023, 68, 700–718. [Google Scholar] [CrossRef]
- Macias, P.; Stelmasiak, D.; Szafranek, K. Nowcasting food inflation with a massive amount of online prices. Int. J. Forecast. 2023, 39, 809–826. [Google Scholar] [CrossRef]
- Wolski, R. Residential Real Estate as a Potential Hedge of Capital Against Inflation. Real Estate Manag. Valuat. 2023, 31, 36–42. [Google Scholar] [CrossRef]
- Chodakiewicz, M.J. Intermarium: The Land between the Black and Baltic Seas Transaction, 1st ed.; Routledge: New York, NY, USA, 2012. [Google Scholar]
- Pawlat, H.; Adamczewska-Andrzejewska, K.; Mackin-Rogalska, R.; Nabaglo, L. Przeciwdziałanie występowaniu i zwalczanie drobnych ssaków zasiedlających wały przeciwpowodziowe. Wiadomości Inst. Melior. Użytków Zielonych 1992, 17, 363–372. [Google Scholar]
- Beavers Responsible for Poland’s Flooding. Available online: https://www.telegraph.co.uk/news/worldnews/europe/poland/7764347/Beavers-responsible-for-Polands-flooding.html?mod=article_inline (accessed on 25 May 2010).
- Bujakowski, F.; Falkowski, T. Hydrogeological Analysis Supported by Remote Sensing Methods as A Tool for Assessing the Safety of Embankments (Case Study from Vistula River Valley, Poland). Water 2019, 11, 266. [Google Scholar] [CrossRef]
- Bujakowski, F.; Falkowski, T.; Podlasek, A.; Ostrowski, P. Real-Time Groundwater Dynamics Verification in the Embankment’s Substrate during the Transition of a Flood Wave. Water 2022, 14, 3986. [Google Scholar] [CrossRef]
- Falkowski, T.; Popek, Z. Zones of the ice-jam formation on the Middle Vistula River reach in relation to variable of river valley morphology. Ann. Wars. Univ. Life Sci.—SGGW Land Reclam. 2000, 30, 77–90. [Google Scholar]
- Falkowski, T. The application of geomorphological analysis of the Vistula River, Poland in the evaluation of the safety of regulation structures. Acta Geol. Pol. 2007, 57, 377–389. [Google Scholar]
- Falkowski, T. Basement of the alluvia influence on the channel pattern in example of selected reach of the Pilica River. Ann. Wars. Univ. Life Sci.—SGGW Land Reclam. 2010, 42, 93–104. [Google Scholar] [CrossRef]
- Ostrowski, P.; Falkowski, T. Application of Remote Sensing Methods to Study the Relief of Lowland River Valleys with a Complex Geological Structure—A Case Study of the Bug River. Water 2020, 12, 487. [Google Scholar] [CrossRef]
- Ostrowski, P.; Falkowski, T.; Utratna-Żukowska, M. The effect of geological channel structures on floodplain morphodynamics of lowland rivers: A case study from the Bug River, Poland. CATENA 2021, 202, 105209. [Google Scholar] [CrossRef]
- Gębica, P.; Sokołowski, T. Sedimentological interpretation of crevasse splays formed during the extreme 1997 flood in the upper Vistula river valley (South Poland). Ann. Soc. Geol. Pol. 2001, 71, 53–62. [Google Scholar]
- Gębica, P.; Sokołowski, T. Crevassing of an inland dune during the 1998 flood in the upper Vistula river valley (South Poland). Ann. Soc. Geol. Pol. 2002, 72, 191–197. [Google Scholar]
- Deschaux, J. Flood-Related Impacts on Cultural Heritage. In Floods; Elsevier: Amsterdam, The Netherlands, 2017; pp. 53–72. [Google Scholar] [CrossRef]
- Song, S.; Wang, S.; Fu, B.; Dong, Y.; Liu, Y.; Chen, H.; Wang, Y. Improving representation of collective memory in socio-hydrological models and new insights into flood risk management. J. Flood Risk Manag. 2021, 14, e12679. [Google Scholar] [CrossRef]
- Garde-Hansen, J.; McEwen, L.; Holmes, A.; Jones, O. Sustainable flood memory: Remembering as resilience. Mem. Stud. 2017, 10, 384–405. [Google Scholar] [CrossRef]
- Cruz-Bello, G.M.; Alfie-Cohen, M. Capturing flood community perceptions for social vulnerability reduction and risk management planning. Environ. Sci. Policy 2022, 132, 190–197. [Google Scholar] [CrossRef]
- Szczepanek, R.; Toś, C.; Bodziony, M. Temporary flood marks proposal: What we learned after losing the baroque artifact from Cracow, Poland. Int. J. Disaster Risk Reduct. 2022, 74, 102942. [Google Scholar] [CrossRef]
- Dziechciarz, M. Historyczne Powodzie na Wiśle Lubelskiej w Świetle Znaków i Tablic Wielkich Wód; Uniwersytet Mikołaja Kopernika: Toruń, Poland, 2010. [Google Scholar]
- Szczepanek, R. A Deep Learning Model of Spatial Distance and Named Entity Recognition (SD-NER) for Flood Mark Text Classification. Water 2023, 15, 1197. [Google Scholar] [CrossRef]
- Szczepanek, R. Flood Marks. Available online: http://openhydrology.org/maps/flood_mark/?zoom=17&lat=51.233081&lon=21.876681 (accessed on 8 September 2023).
- Falkowska, E.; Falkowski, T. Trace metals distribution pattern in floodplain sediments of a lowland river in relation to contemporary valley bottom morphodynamics. Earth Surf. Process. Landf. 2015, 40, 876–887. [Google Scholar] [CrossRef]


Disclaimer/Publisher’s Note: The statements, opinions and data contained in all publications are solely those of the individual author(s) and contributor(s) and not of MDPI and/or the editor(s). MDPI and/or the editor(s) disclaim responsibility for any injury to people or property resulting from any ideas, methods, instructions or products referred to in the content. |
© 2023 by the authors. Licensee MDPI, Basel, Switzerland. This article is an open access article distributed under the terms and conditions of the Creative Commons Attribution (CC BY) license (https://creativecommons.org/licenses/by/4.0/).
Share and Cite
Krasiewicz, D.W.; Wierzbicki, G. Flood Perception from Local Perspective of Rural Community vs. Geomorphological Control of Fluvial Processes in Large Alluvial Valley (the Middle Vistula River, Poland). Hydrology 2023, 10, 191. https://doi.org/10.3390/hydrology10100191
Krasiewicz DW, Wierzbicki G. Flood Perception from Local Perspective of Rural Community vs. Geomorphological Control of Fluvial Processes in Large Alluvial Valley (the Middle Vistula River, Poland). Hydrology. 2023; 10(10):191. https://doi.org/10.3390/hydrology10100191
Chicago/Turabian StyleKrasiewicz, Daria Wiesława, and Grzegorz Wierzbicki. 2023. "Flood Perception from Local Perspective of Rural Community vs. Geomorphological Control of Fluvial Processes in Large Alluvial Valley (the Middle Vistula River, Poland)" Hydrology 10, no. 10: 191. https://doi.org/10.3390/hydrology10100191