Article

Novel Bi-Functional MoS2/α-Fe2O3 Nanocomposites for High Photocatalytic Performance

by
Islam Ibrahim
1,2,3,
Pinelopi P. Falara
1,4,
Elias Sakellis
1,
Maria Antoniadou
5,
Chrysoula Athanasekou
1 and
Michalis K. Arfanis
1,*
1
Institute of Nanoscience and Nanotechnology, National Centre for Scientific Research (NCSR) “Demokritos”, Agia Paraskevi, 15341 Athens, Greece
2
Department of Chemistry and Biochemistry, Florida International University, Miami, FL 33199, USA
3
Department of Chemistry, Faculty of Science, Al-Azhar University, Nasr City, Cairo 11884, Egypt
4
School of Chemical Engineering, National Technical University of Athens, Zografos Campus, 15773 Athens, Greece
5
Department of Chemical Engineering, University of Western Macedonia, 51000 Kozani, Greece
*
Author to whom correspondence should be addressed.
ChemEngineering 2024, 8(1), 20; https://doi.org/10.3390/chemengineering8010020
Submission received: 16 December 2023 / Revised: 11 January 2024 / Accepted: 1 February 2024 / Published: 6 February 2024

Abstract

:
In this study, 3-dimensional molybdenum disulfide (MoS2) structures, integrated with hematite (α-Fe2O3) nanoparticles, were fabricated under a convenient two-step hydrothermal route. The fabricated photocatalytic nanocomposites consist of well-arranged MoS2 flakes, resembling spherical flower-like morphology, and the nanoparticulate α-Fe2O3 structures decorate the 3D network. By raising the α-Fe2O3 weight ratio, the composites’ specific surface area and morphology were not affected, regardless of the partial cover of the cavities for higher hematite content. Moreover, the crystallinity examination with XRD, Raman, and FTIR techniques revealed that the precursor reagents were fully transformed to well-crystalized MoS2 and Fe2O3 composites of high purity, as no organic or inorganic residues could be detected. The photocatalytic oxidation and reduction performance of these composites was evaluated against the tetracycline pharmaceutical and the industrial pollutant hexavalent chromium, respectively. The improvement in the removal efficiencies demonstrates that the superior photoactivity originates from the high crystallinity and homogeneity of the composite, in combination with the enhanced charge carriers’ separation in the semiconductors’ interface.

1. Introduction

Nowadays, the maintenance of freshwater quality and wastewater management are highly related to the efficient operation of municipal water treatment plants (MWTPs). At the moment, recalcitrant substances like pharmaceuticals, pesticides, personal care products, or different types of organic and inorganic industrial pollutants are insufficiently eliminated at MWTPs; therefore, additional procedures should be adopted. Among the proposed approaches, the integration of the existing water treatment technologies with photocatalytic advanced oxidation processes (AOPs) gain significant impact because of their simplicity and effectiveness [1,2]. In this regard, photocatalysis takes the advantage of semiconductors’ photoexcitation with solar light and their ability to create reactive oxidative species (ROS), which are able to destroy organic and inorganic contaminants of emerging concern [3]. The activity of the photocatalytic materials can be evaluated against a variety of contaminants, such as tetracycline, an antibiotic for bacterial infections in both human and animals [4]; nitenpyram, an insecticide toxin based on neonicotinoid compound [5]; p-nitrophenol, a poisonous precursor of the chemical industry [6]; chlorobenzene and toluene, a representative polluting gas mixture of aromatic volatile organic compounds [7]; hexavalent chromium, a commonly used heavy metal in industrial manufacturing of pigments and anti-corrosion protection [8]; or even the inhibition of Staphylococcus aureus and Escherichia coli bacteria [9].
During the recent years, titanium dioxide was extensively studied in wastewater treatment applications and was established as the most efficient photocatalyst; however, it cannot exploit the whole range of solar light and its quantum efficiency is limited due to recombination effects [1]. The fabrication of alternative nanomaterials or nanocomposites, instead of TiO2, could be a feasible strategy to improve the impact of photocatalytic processes as a reliable choice for wastewater management. Molybdenum disulfide (MoS2) could be an ideal candidate due to its advanced optoelectronic properties [10], while its layered morphology provides higher surface area, which enhances the adsorption and degradation of the target compounds [11]. However, most often, MoS2 is packed on multi-layered aggregates, leading to a lower number of active sites, lower charge carriers’ mobility, and a lower photocatalytic performance [12]. In order to overcome the intrinsic limitations of MoS2, the combination with other catalysts, like iron oxides, and the development of composites is suggested [10,13].
Recently, the fabrication and the performance of MoS2 composites with hematite (α-Fe2O3) was taken into consideration because the hematite’s energy band levels match with the respective levels of MoS2, enabling band alignment and enhancing charge carrier separation [14]. Moreover, hematite is a well-known photocatalyst with a relatively short energy gap and it is earth abundant and eco-friendly [15]. Depending on the experimental conditions, α-Fe2O3 has the ability to decompose contaminants through the production of reactive radicals based on heterogeneous photocatalysis and/or the Fenton mechanism [16,17]. Interestingly, the MoS2/Fe2O3 composites are not examined thoroughly, regardless of their superior opto-electronic properties, which imply improved photocatalytic performance. Occasionally, some studies of MoS2/α-Fe2O3 materials focus on their photoelectrochemical properties and their utilization in supercapacitors [18], water splitting systems [19], or the photo-electro-catalytic degradation of pollutants [20]. Additionally, the evolution of oxygen [21], or the production of photofuels, like H2 production and hydrocarbons [22,23], has been reported. Nevertheless, applications on the photocatalytic degradation of emerging contaminants is limited on the elimination of organic dyes, such as methylene blue and rhodamine-B [24,25], while the examination of recalcitrant and persistent organic pollutants in water, like pharmaceuticals [26], is generally missing. In addition, most of these studies fabricate ternary composites, by coupling the binary MoS2/α-Fe2O3 systems with other semiconductors or graphitic materials [19,25]. On the other hand, some studies explore binary systems using different ferrite phases, but they cannot exclude the formation of additional intrinsic impurities [13].
Herein, MoS2/Fe2O3 heterostructures (noted as MoFe) were synthesized under a two-step hydrothermal method and their morphological, spectroscopic, and photocatalytic properties were examined in depth. Compared to the existing reports for MoS2/Fe2O3 fabrication under hydrothermal or other wet chemistry approaches, in this study, the excess of thiourea was adjusted appropriately regarding the molarity of molybdenum precursors, while the added hematite quantities were used to prepare MoFe-nanostructured composites with 1:2, 1:1, and 2:1 weight ratios of the individual materials. Under this synthetic route, MoS2 flakes were packed in an extended 3D flower-like network, free from any undesired crystal phases or impurities, and were decorated with well-dispersed nanoparticulate α-Fe2O3 crystals. In addition, the photo oxidation of the tetracycline pharmaceutical and the photoreduction of hexavalent chromium with MoFe was rarely examined under the applied conditions. In particular, the experiments occurred in the absence of hydrogen peroxide (H2O2) additives in order to prevent the direct activation of the Fenton mechanism; therefore, only photocatalytic reactions occurred and were evaluated.

2. Materials and Methods

2.1. Materials Synthesis

In order to prepare hematite (α-Fe2O3) nanoparticles, 5.05 g ferric nitrate (Fe(NO3)3•9H2O) was dispersed in a 25 mL ethanol/125 mL DI H2O mixture. Then, 10 g sodium acetate (CH3COONa) was added to the above solution and stirred for 30 min. Subsequently, the hydrothermal treatment was performed at 180 °C for 24 h. The final oxide was obtained after several washing cycles with DI water and was dried at 50 °C overnight [27].
The preparation of MoS2 nanopowders was also based on a one-step hydrothermal method [28]. In brief, 0.525 g of ammonium molybdate tetrahydrate (NH46Mo7O24•4H2O) was mixed with 0.455 g of sulfur precursor (thiourea, H2CSNH2) in 125 mL DI water and stirred for 90 min, in order to adjust their molar ratio to ~1:15. The resultant solution was placed into a 300 mL autoclave and kept there for 24 h at 200 °C. The black precipitate was washed multiple times with DI water and absolute ethanol, and was finally dried overnight at 80 °C. Following this technique, ~160 mg of pure MoS2 was obtained.
Finally, the nanocomposites were prepared by mixing hematite in a MoS2 precursor solution. The α-Fe2O3 content was adjusted to 80, 160, or 320 mg, assuming that the weight ratios between α-Fe2O3 and MoS2 would approximate to 2:1, 1:1, and 1:2 after the hydrothermal process. Before hydrothermal treatment, mixture homogenization was established under 1 h sonication and stirring for half an hour. Following the same annealing, washing, and drying steps, the derived samples were named as MoFe (2:1), MoFe (1:1), and MoFe (1:2)—regarding the relative weight ratio of the two catalysts.

2.2. Materials Characterization

The diffractometer Siemens D-500 with Cu Kα1 (λ = 1.5406 Å) and Cu Kα2 (λ = 1.5444 Å) was used to carry out X-ray powder diffraction (XRPD) analyses for all prepared nanocomposites (Siemens, Erlangen, Germany). The data were collected for 3 s at 0.02° increments in detector placement in the range of 5° ≤ 2θ ≤ 80°.
The micro-Raman spectra were performed with a Renishaw reflex spectrometer (Renishaw, Wotton-under-Edgr, UK) using diode laser beams at λ = 514.5 nm and 785 nm. Each laser beam was directed on the prepared catalysts using a ×50 objective, with power density equal to 0.02 mW μm−2. The scattered light was collected by an ultra-highly sensitive CCD detector.
Fourier transform infrared (FTIR) spectra were acquired using a Thermo Scientific Nicolet 6700 FTIR under N2 flow (Thermo Scientific, Pittsburgh, PA, USA). Spectra were obtained utilizing a transmission cell containing a potassium bromide pellet. Data were obtained between 4000 and 400 cm−1 (with a resolution of 4 cm−1).
By using barium sulfate as a reference, the optical characteristics of the samples were examined using a UV-Vis diffuse reflectance spectrometer Hitachi 3010 (Hitachi, Tokyo, Japan), equipped with an integrating sphere (60 mm diameter).
The morphological properties of the prepared samples were collected using a Philips Quanta FEI Inspect Scanning Electron Microscope (SEM, FEI company, Eidhoven, The Netherlands) by employing a tungsten filament running at 25 keV. The morphology of the nanostructure was studied using a high-resolution FEI Talos F200-i field emission (scanning) transmission electron microscope (S/TEM) operating at 200 kV. The microscope (Thermo Fisher Scientific Inc., Waltham, MA, USA) was equipped with a windowless energy-dispersive spectroscopy microanalyzer (6T/100 Bruker, Hamburg, Germany). In all cases, approximately 0.2 g of each sample was received, and the powders were suspended in alcohol, followed by ultrasonication in order to reduce possible agglomeration of the nanoparticles. Subsequently, a drop from the resulting suspension was deposited on a 300-mesh carbon coated copper grid and was air-dried overnight. The S/TEM was also equipped with an Oxford X-Max 100 Silicon Drift Energy-Dispersive X-ray (EDX) Spectrometer (Oxford Instruments, Wycombe, UK), with a probe size varying between 2 and 5 nm. Therefore, both elemental and mapping analyses were performed via EDX.
The textural characteristics of the samples were evaluated by N2 adsorption–desorption isotherms at −196 °C, using an automated volumetric system (Autosorb-ASiQ, Quantachrome, Boynton Beach, FL, USA). Prior to each measurement, the samples were degassed at 200 °C for 48 h under high vacuum, which was achieved with a turbomolecular pump. The specific surface area was estimated using the Brunauer–Emmett–Teller (BET) equation. Similarly, the volume and cumulative surface area of the mesopores were calculated via the Barrett–Joyner–Halenda (BJH) method.
The electrochemical characterization of the samples was conducted with an Autolab PGSTAT-30 potentiostat (Metrohm/Eco Chemie, Utrecht, The Netherlands) under simulated solar light (1 sun, 1000 W∙m−2) from a Xenon lamp combined with AM 1.5G optical filters. Nyquist plots were obtained using a standard 3-electrode system; a platinum foil (Pt) as a counter electrode; and a silver/ silver chloride (Ag/AgCl) with electrolyte concentration CKCl = 3 M as a reference electrode. The working electrode was produced as follows: 5 mg of the photocatalyst was dispersed into a solution comprising 25 μL Nafion perfluorinated, 145 μL 3D water, and 84 μL absolute ethanol. The above solution was ultrasonicated for 2 h in order to obtain uniform suspension. Following this, a doctor blade technique was utilized to fabricate a uniform 1 cm2 active area on a clean FTO electrode. The sample was then annealed at 450 °C. The solution used for the electrochemical measurements contained a sodium sulfate (Na2SO4) electrolyte with a concentration of 0.2 M [29].

2.3. Photocatalytic Experiments

Lastly, the photocatalytic properties of the fabricated samples were evaluated during the photo oxidation of the tetracycline pharmaceutical (TC) and the photoreduction of the hexavalent chromium (Cr(IV)) industrial pollutant. In brief, the photocatalytic performance of MoS2, Fe2O3, and MoS2/Fe2O3 nanocomposites was investigated under UV light by suspending 5 mg of each catalyst in 50 mL of Cr6+ solution (5 ppm) and adding 6 drops of 0.2 M H2SO4. The solution was stirred in the dark for 10 h to achieve an adsorption–desorption equilibrium. UV irradiation was performed using a black box photoreactor (50 cm × 50 cm × 30 cm), connected with four UV-A, 4-Sylvania TLD 15 W/08 lamps (350–390 nm, 0.23 mW/cm2, Feilo Sylvania, Erlangen, Germany). The photoreduction process was evaluated using a colorimetric method with a diphenylcarbazine metal ion indicator and by measuring the absorbance of the Cr6+–diphenylcarbazide complex (542 nm) at equal time intervals. In the case of tetracycline photo oxidation, 0.2 g/L of the samples was suspended in 10 mL of TC solution (20 ppm). After reaching the adsorption–desorption equilibrium (lasted 60 min), the catalysts were separated from the suspension (6000 rpm, EBA 2000, Hettich, Tuttlingen, Germany) and the characteristic absorption peak of TC at 357 nm was determined.

3. Results

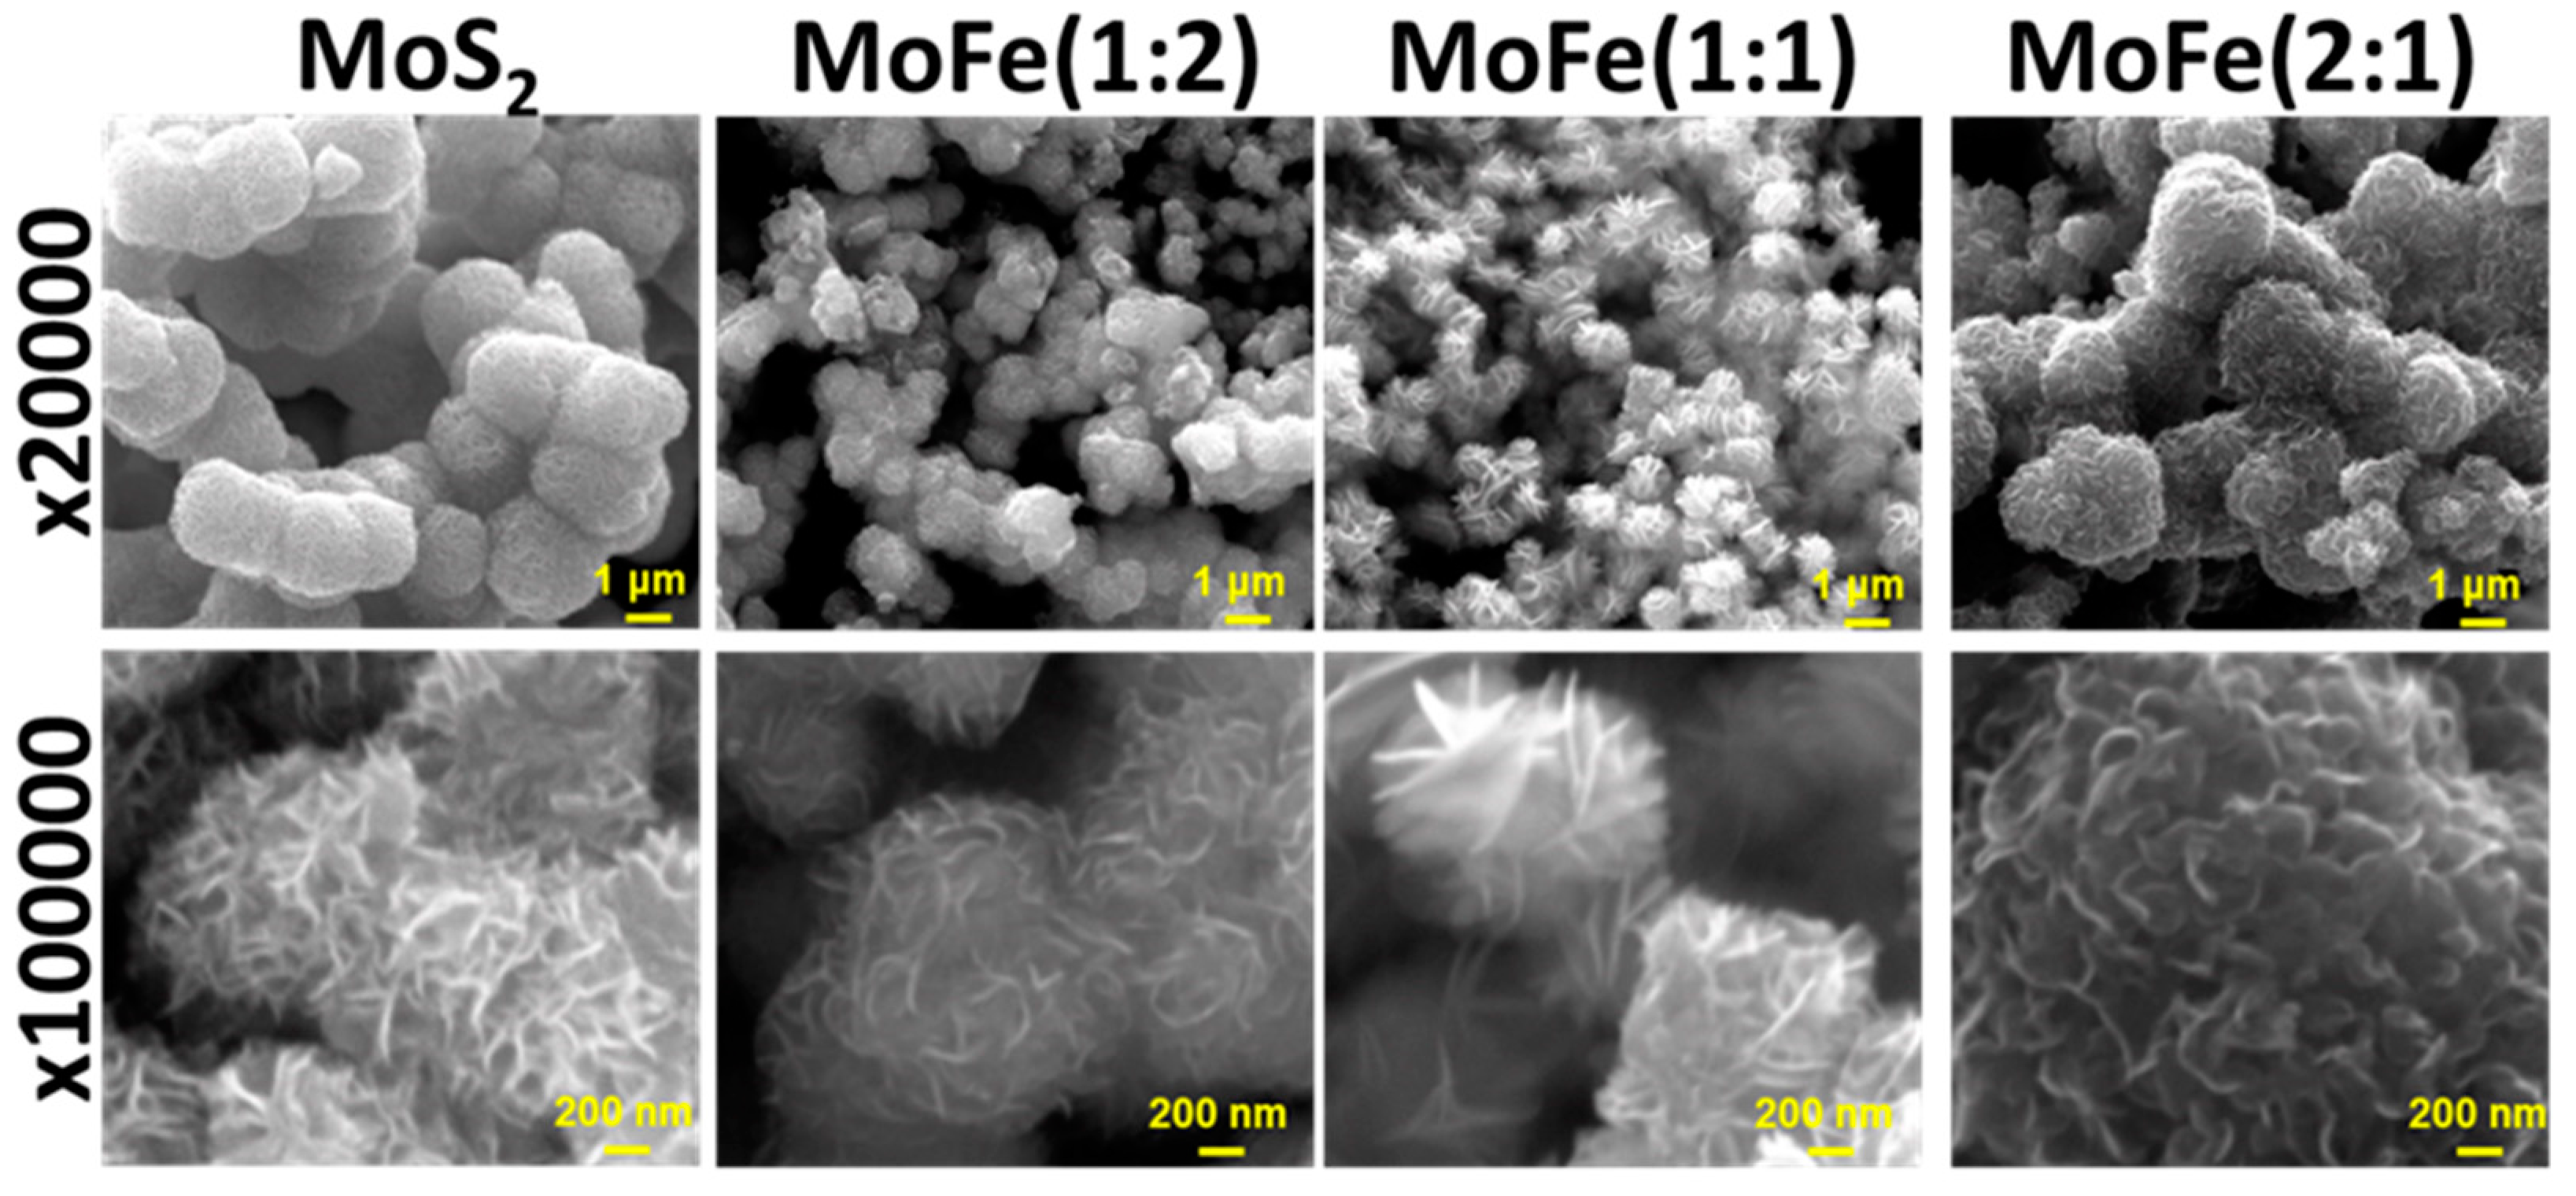
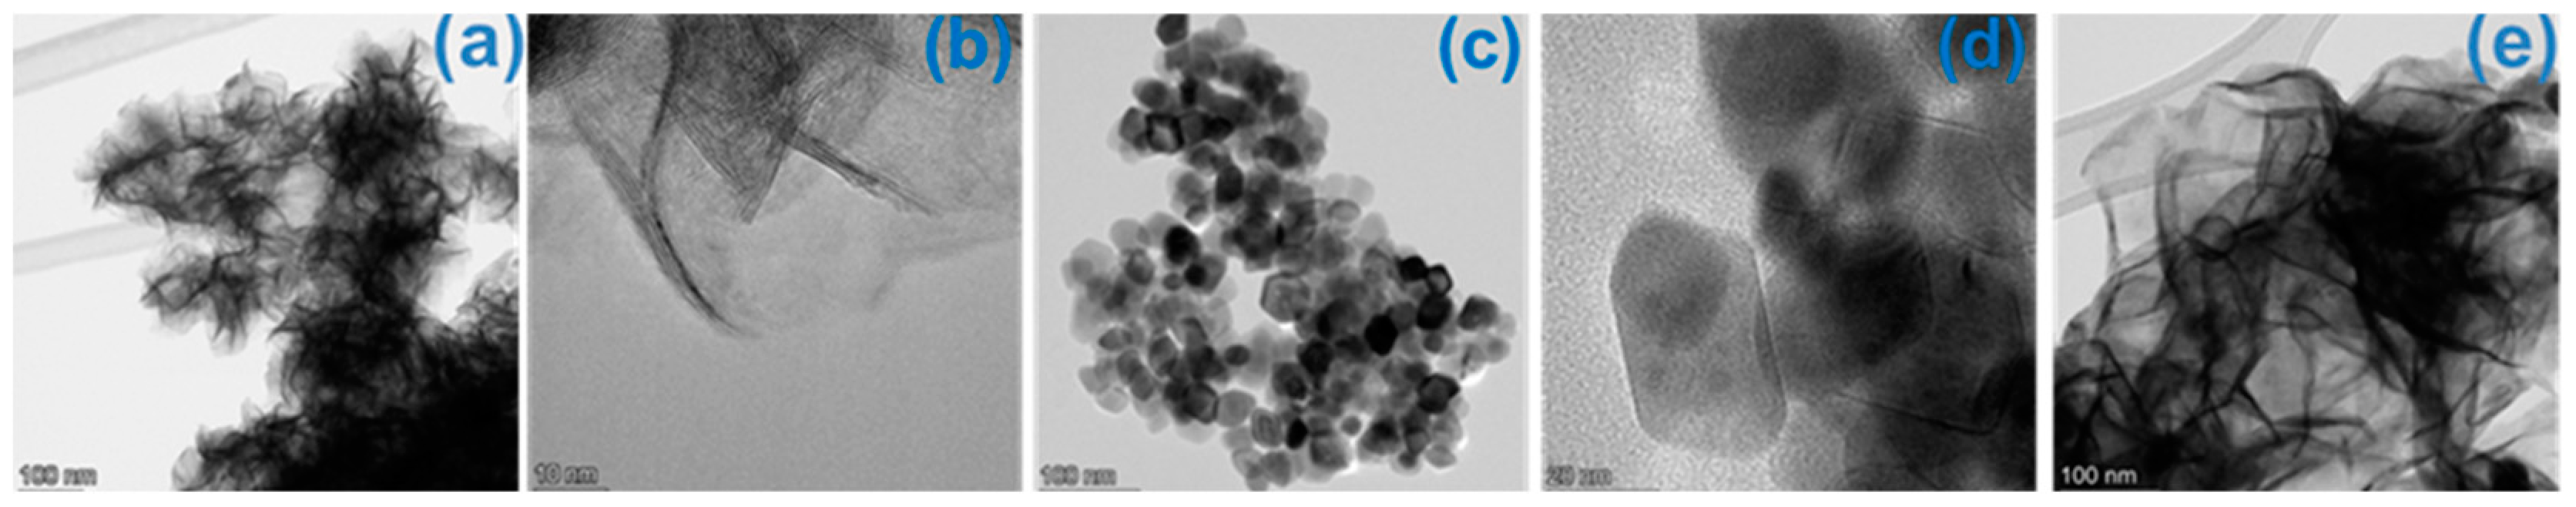
3.1. Morphology Characterization

First, the morphological examination of the MoS2, α-Fe2O3, and MoFe samples was performed with SEM microscopy (Figure 1 and Figure S1). The MoS2 nanoparticles consist of multi-layered flakes, a thickness of ~20 nm, and a length ranging from 180 to 300 nm. These flakes are clustered to bigger and well-arranged spherical formations, resembling 3D flower-like structures, with an average diameter of 2.2 μm. Upon the addition of different amounts of hematite, the hematite-rich MoFe (1:1) and MoFe (1:2) samples maintained their flower-like structures, although the spheres considerably shrank and the empty spaces among the flakes were partially filled. On the contrary, the flakes in the MoS2-rich MoFe (2:1) samples were curved and filled the voids of the flower, without affecting the size and shape of the spherical structure. Interestingly, even if the pristine hematite nanoparticles form micro-sized bulk aggregates (Figure S1a,b), this tendency is not observed in the case of the MoFe samples. Probably, upon the addition of the pre-synthesized α-Fe2O3 in the MoS2 precursor solution, the oxide is either fragmented or dispersed uniformly along the flakes of the sulfide photocatalyst during the hydrothermal process, or it acts as a condensation core for the sulfide [23].
Next, TEM images were captured, as shown in Figure 2, in order to investigate the morphology and the structural features of the as-synthesized MoS2, α-Fe2O3, and MoFe (2:1) samples. Figure 2a clearly shows that MoS2 flakes are condensed, creating a 3D flower-like structure. The higher magnification for the MoS2-layered structure (Figure 2b) reveals that the interspace distance of the crystal lattice is approximately 0.615 nm, corresponding to the (002) plane of hexagonal MoS2. Τhe hexagonal crystal structure of α-Fe2O3 is evident in Figure 2c, in which the lattice spacing of the (110) crystallographic planes is calculated to be 0.25 nm (Figure 2d). In the case of the MoFe (2:1) sample, the oxide’s domains are not evident (Figure 2e). Nevertheless, the MoFe (2:1) composite’s elemental mapping images (Figure S2) reveal the co-presence of Fe with Mo, O, and S elements in the selected area, verifying the successful preparation of the MoS2/α-Fe2O3 nanocomposite. Possibly, the iron oxide was condensed into the structures of lower dimensions (unable to be observed with SEM or TEM), achieving a complete coverage of MoS2 flakes during the second hydrothermal treatment step.
In order to explore the textural properties of the composites, N2 porosimetry experiments took place for the MoS2-based samples (Figure S4). The N2 adsorption–desorption isotherms present typical type IV isotherms with H3 hysteresis, corresponding to mesoporous material as indicated by the IUPAC classification. All samples have mesopores with diameter in the range of 2–50 nm, whereas the MoFe (2:1) and MoFe (1:2) composites also exhibit macropores in the range of 50 to 350 nm. As shown in Table 1, BET surface area values of all composites have a slightly lower surface area and pore size than the initial MoS2 sample. Accordingly, the hematite’s BET is more than double that of the MoFe (1:2) and MoFe (2:1) samples’ and almost double that of the MoFe (1:1) and MoS2 samples’. Moreover, the hematite sample shows the highest total pore volume value. These observations show that the values of the composites are slighter than the pristine MoS2, and they support the fact that the nanoparticulate hematite covers the MoS2 surface during hydrothermal treatment, leading to blocked pores and limited BET surface area.

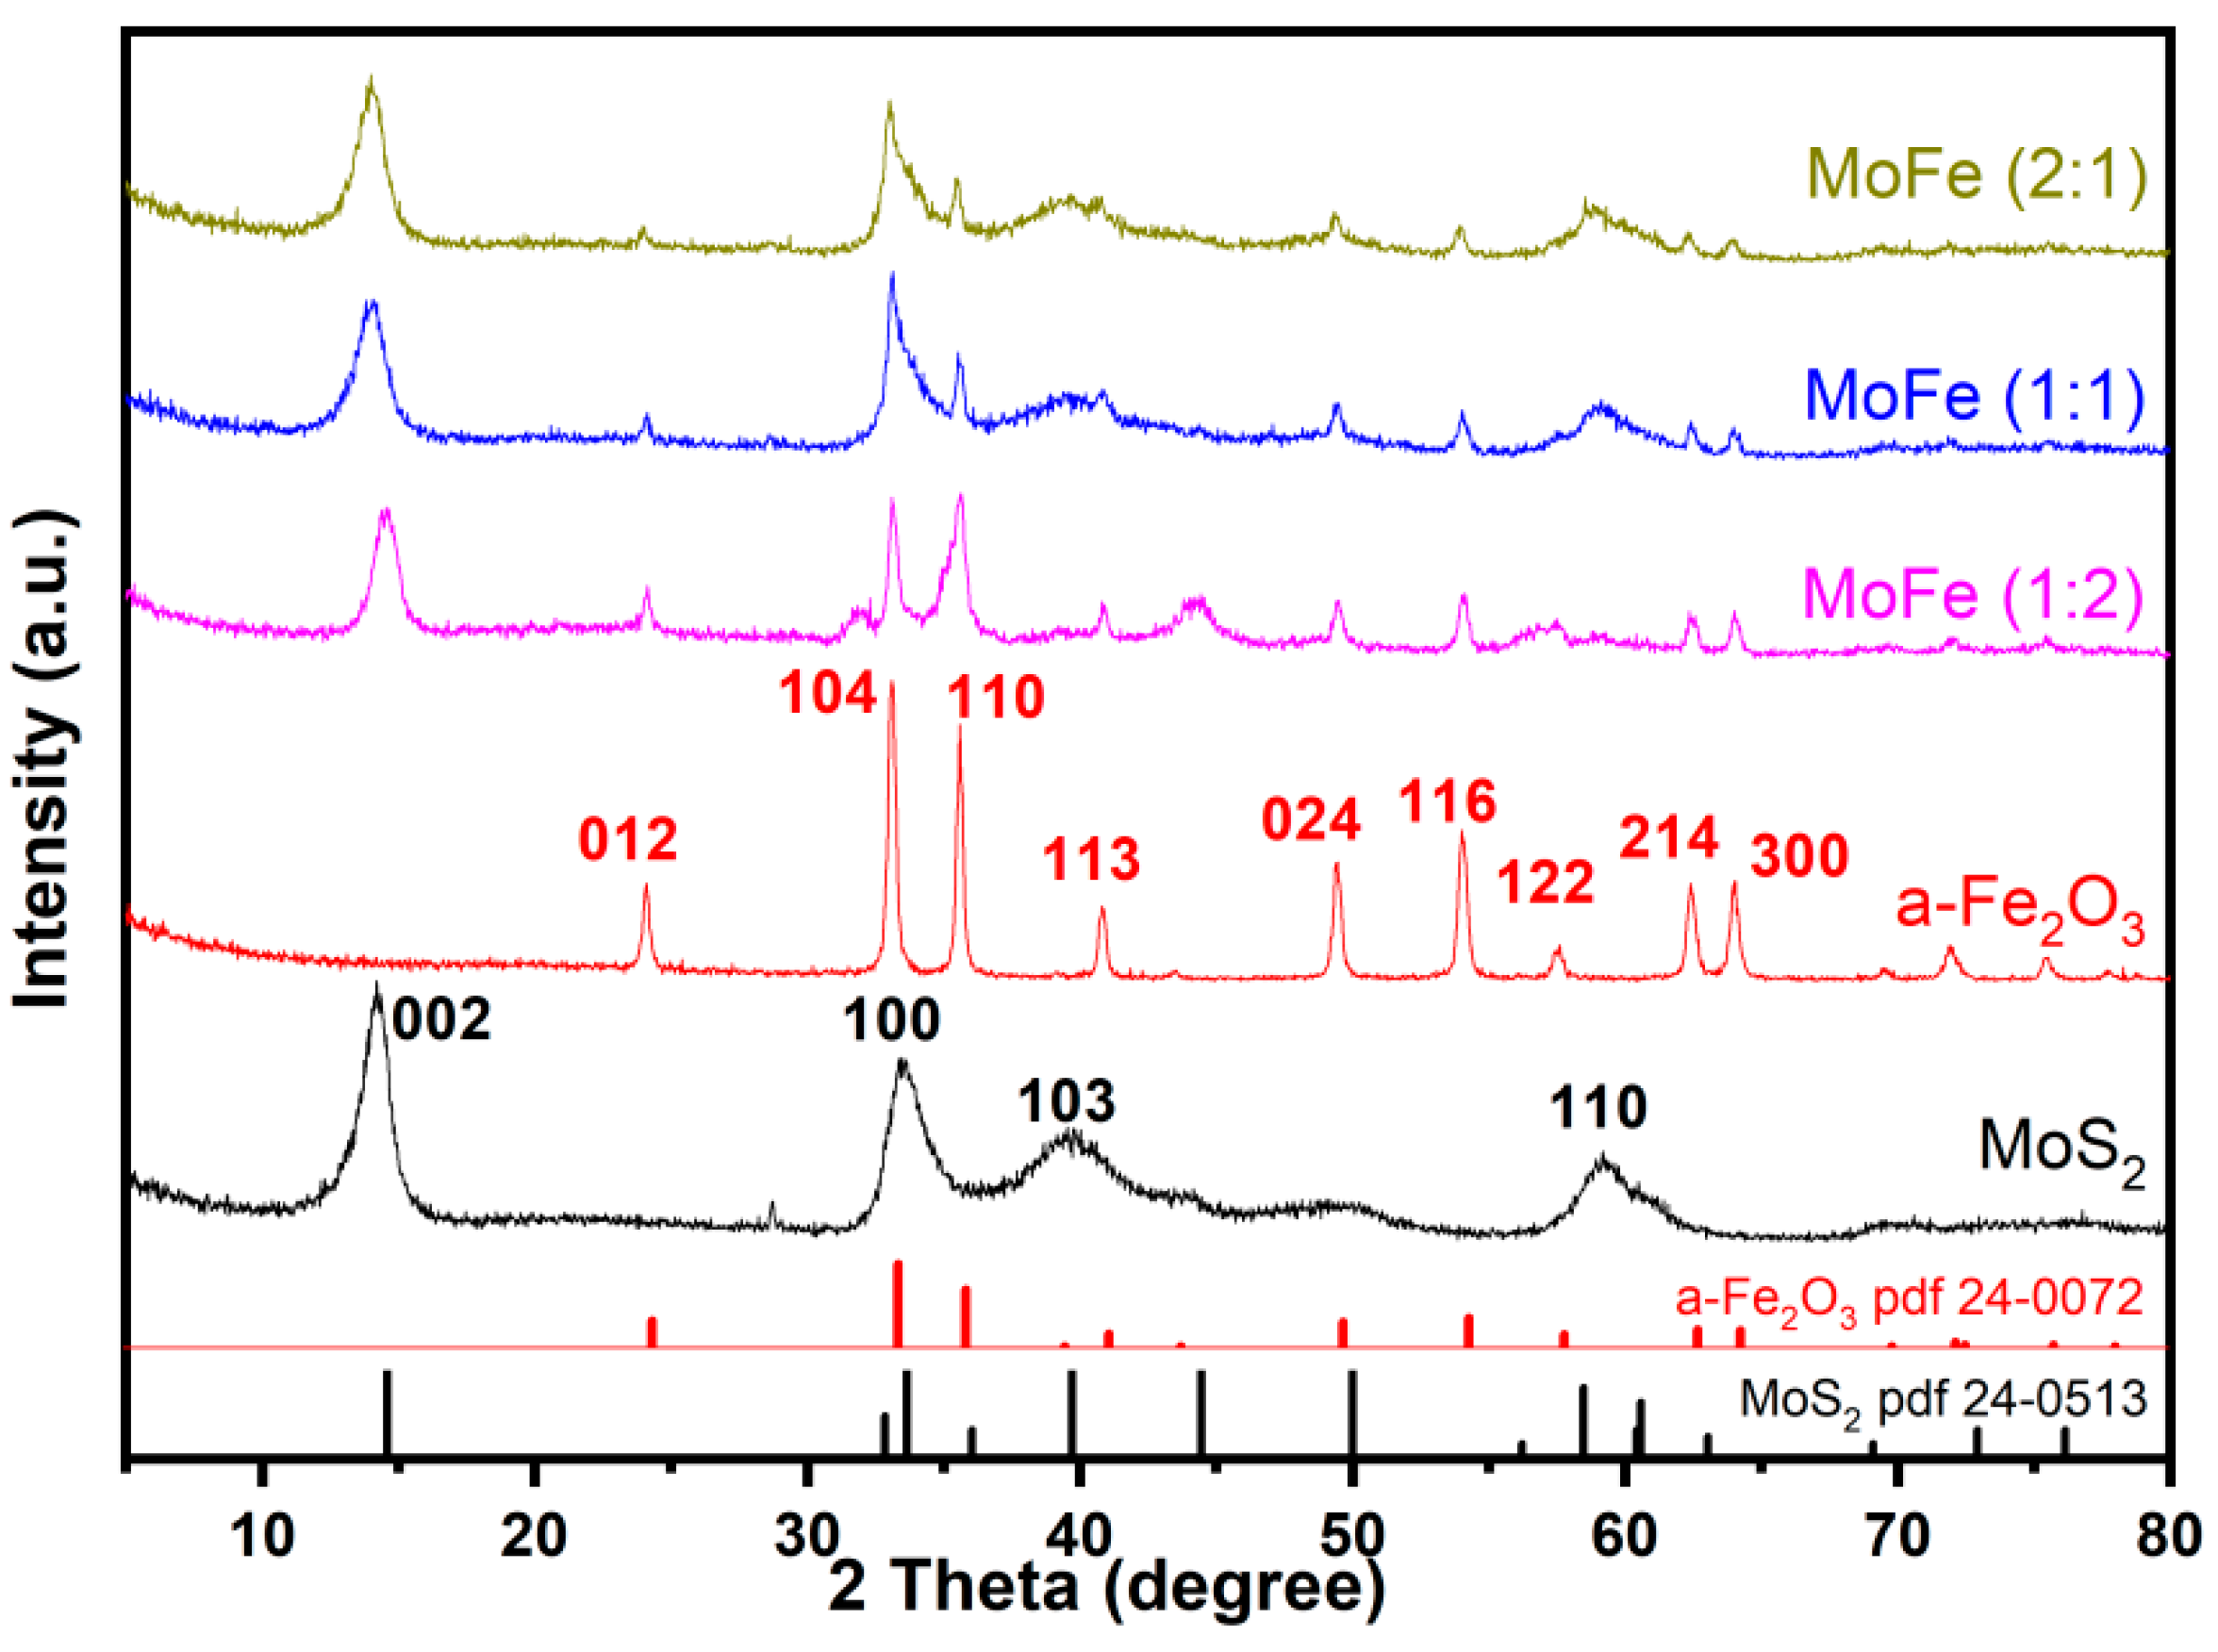
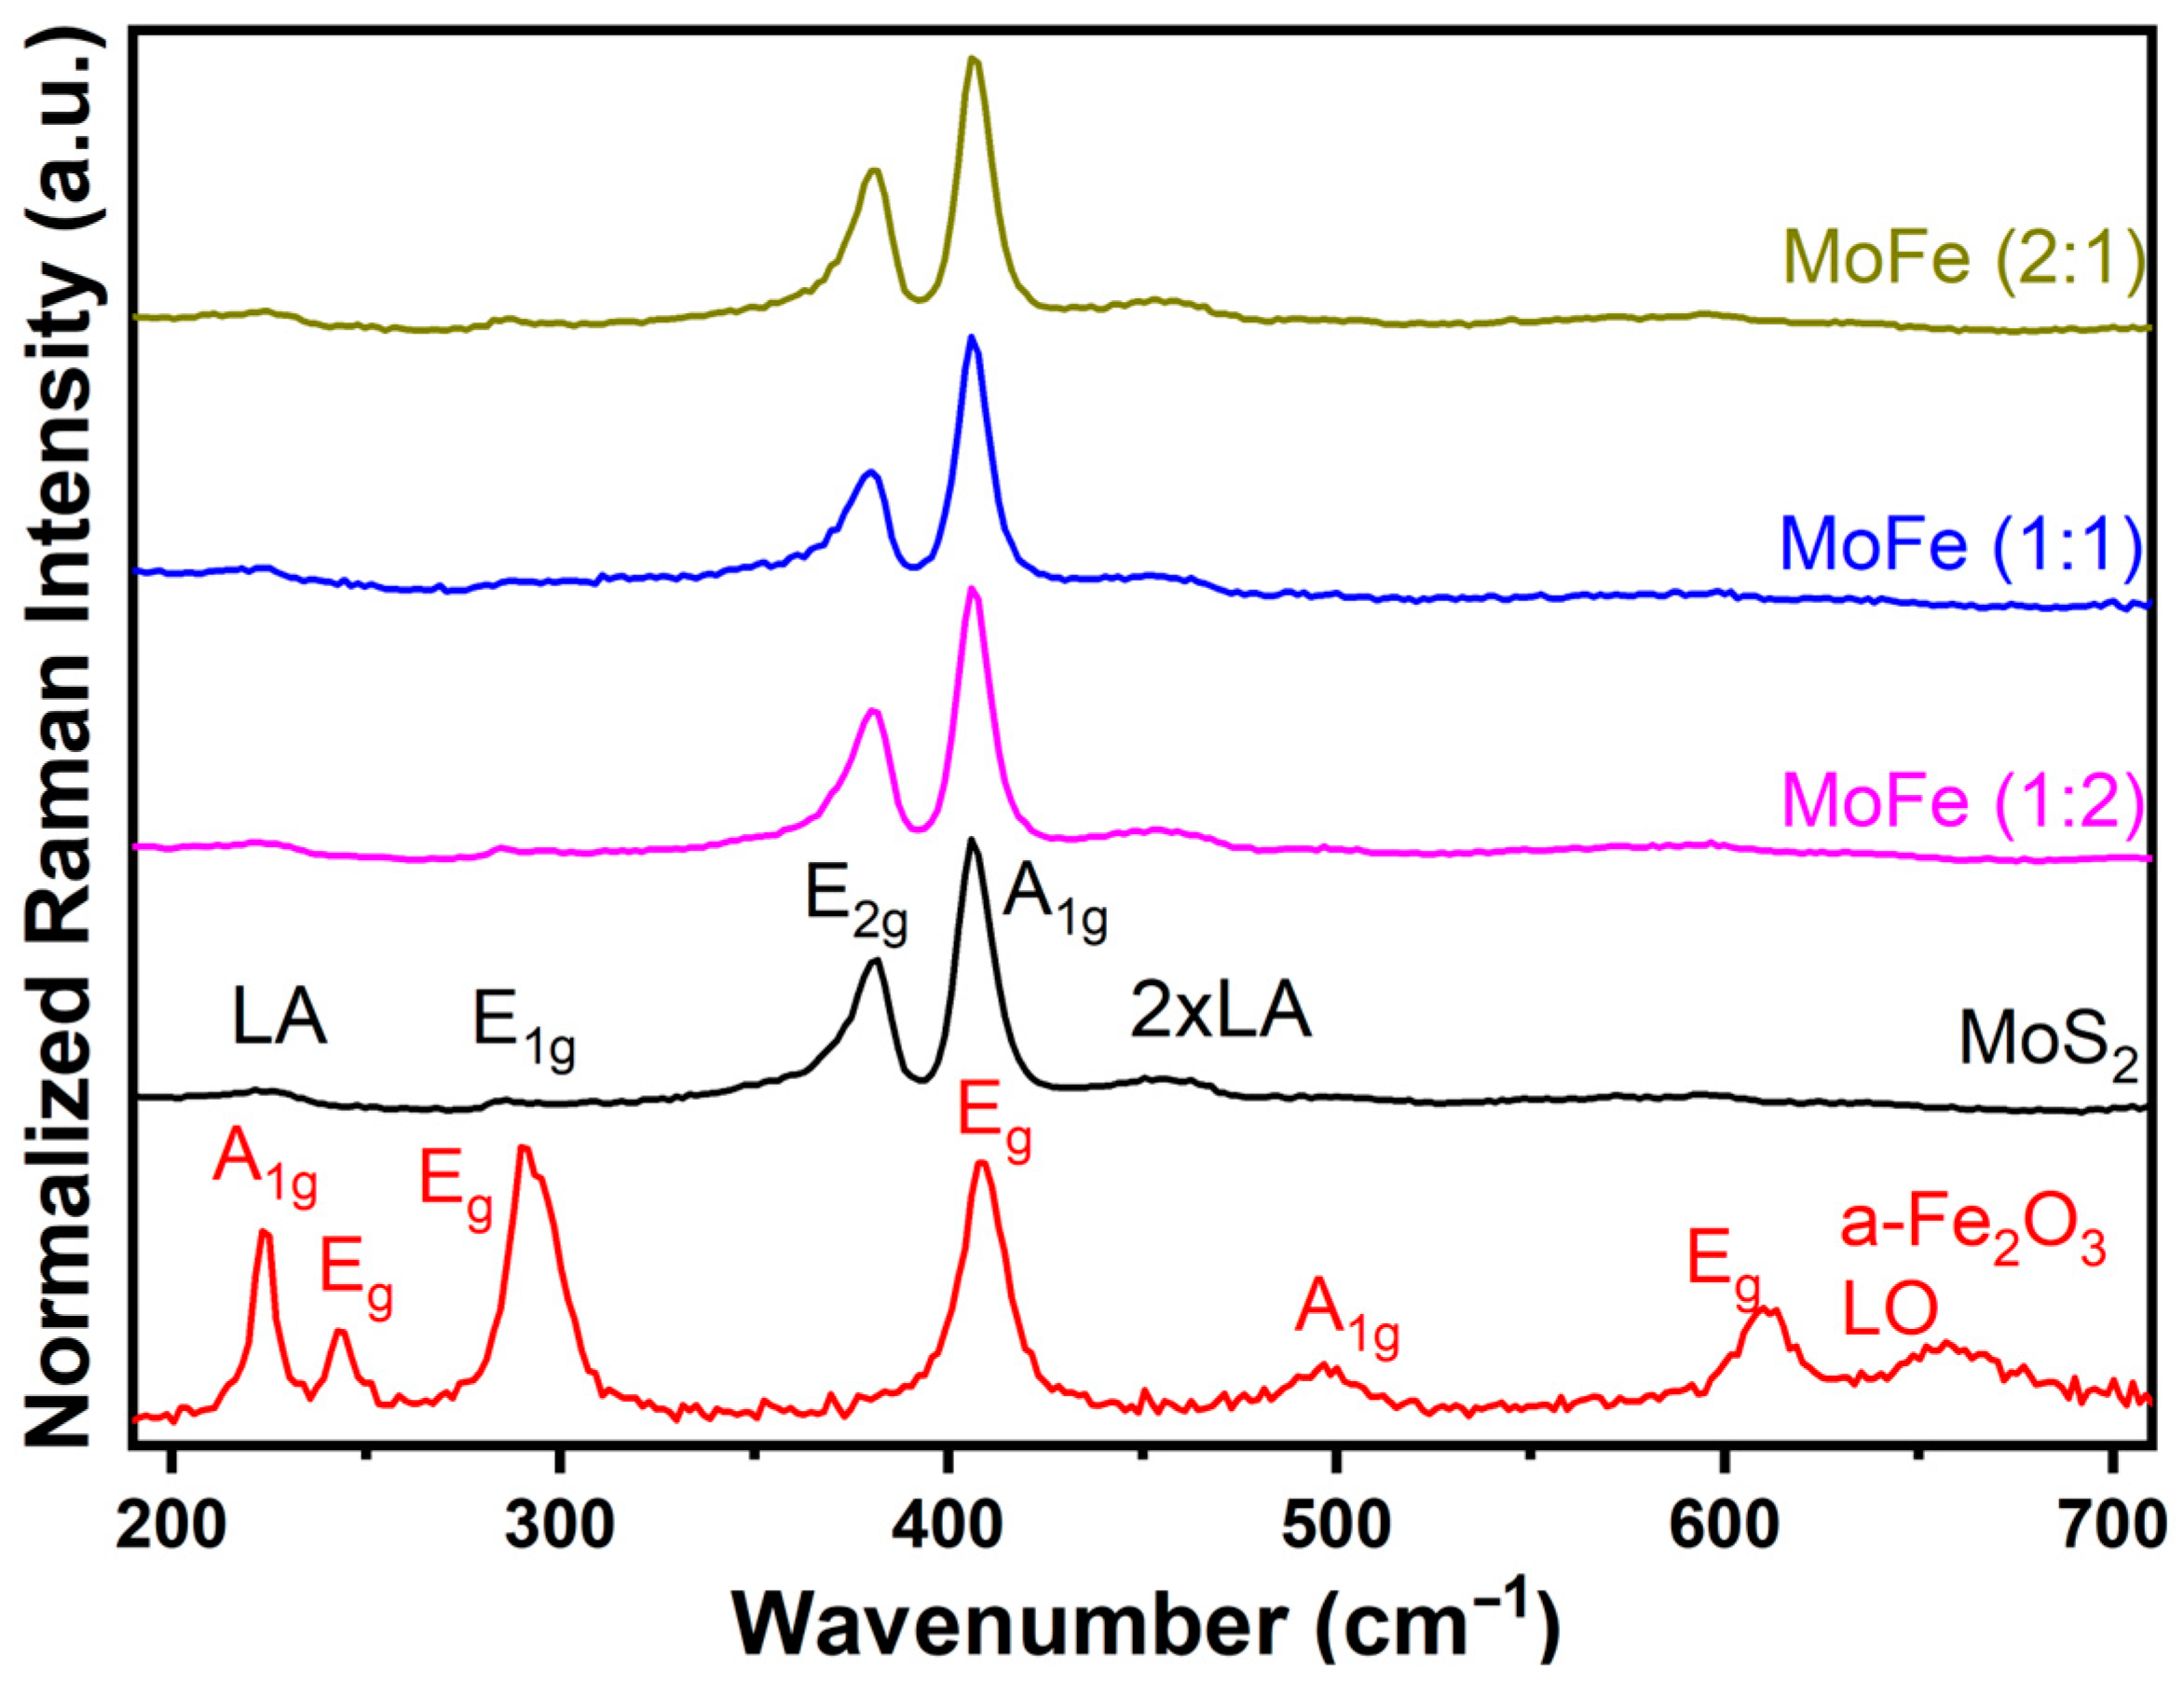
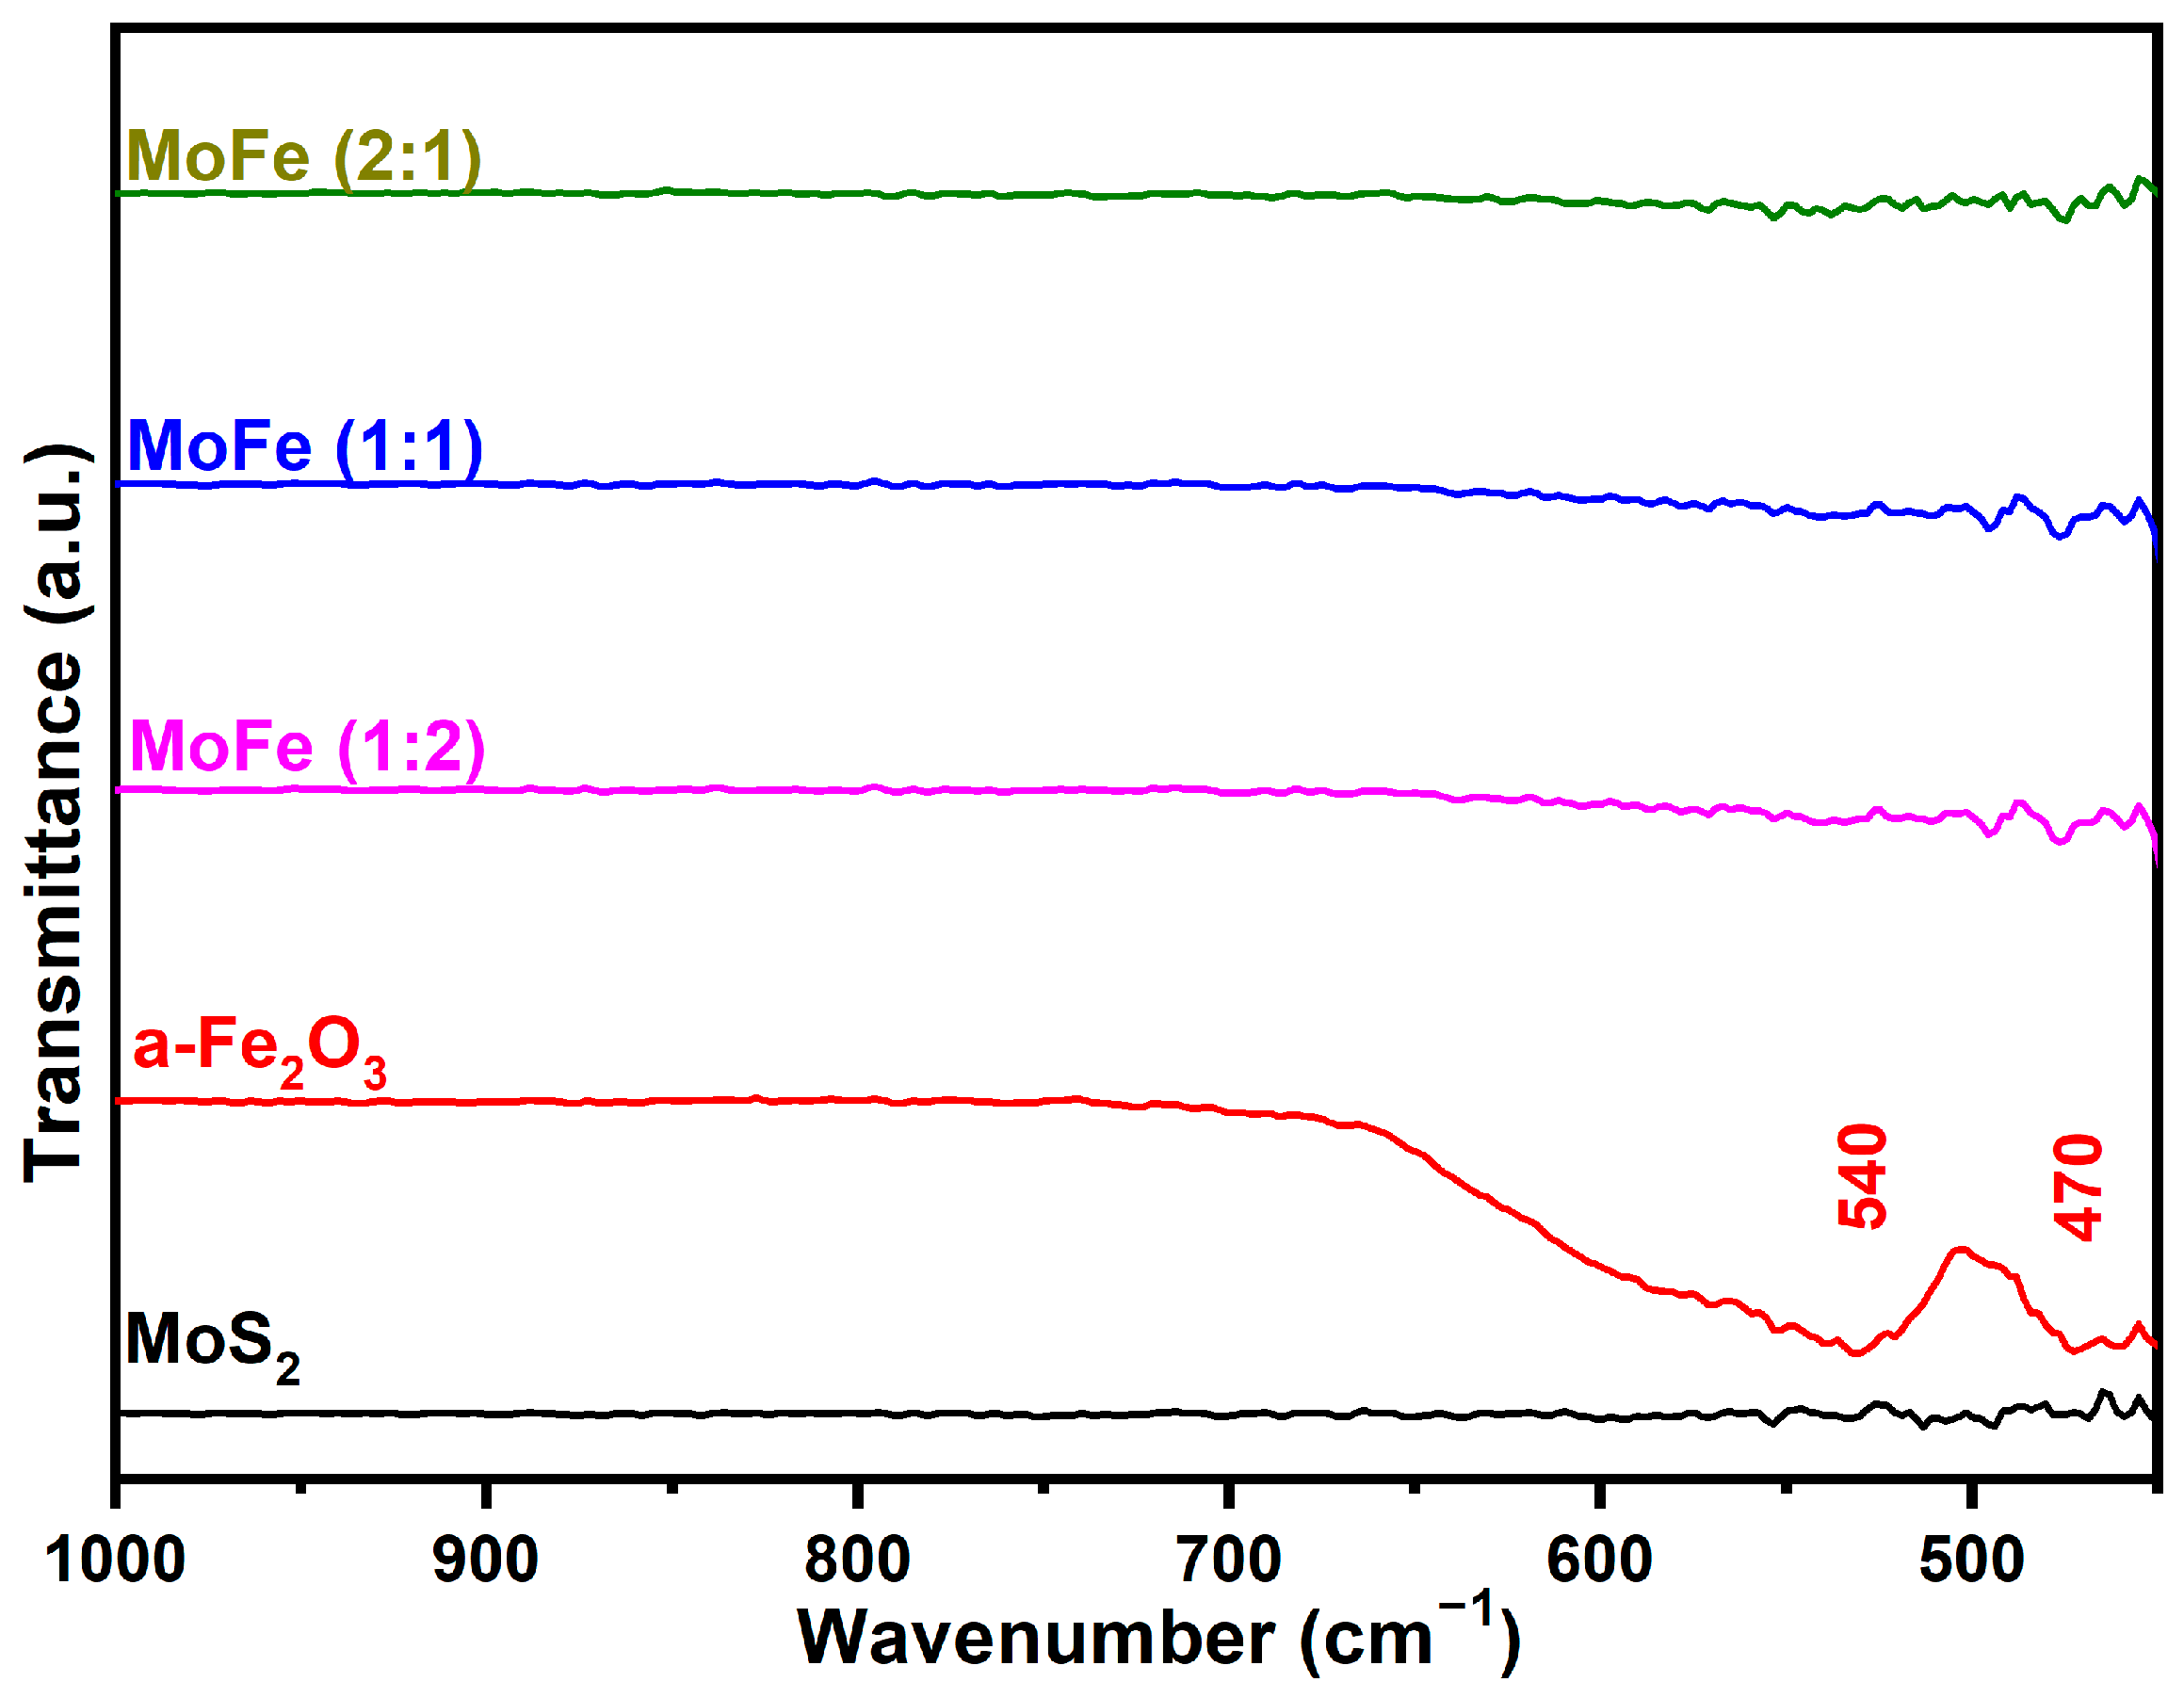
3.2. Structural Characterization

The XRD patterns of the synthesized MoS2, α-Fe2O3, and MoFe nanocomposites are presented in Figure 3. Starting with the XRD pattern of MoS2, diffractions are shown as peaks at 2θ = 14.37°, 33.5°, 39.53°, and 58.33°, which correspond to the (002), (100), (103), and (110) crystal planes of hexagonal MoS2 (pdf 24-0513), respectively. Next, the pattern of the α-Fe2O3 nanoparticles reveals the characteristic diffractions of (012), (104), (110), (113), (024), (116), (122), (214), and (300) at 2θ = 24.13°, 33.15°, 35.61°, 40.85°, 49.47°, 54.08°, 57.42°, 62.44°, and 63.98°, respectively, which are assigned to the standard pure hexagonal hematite (pdf 24-0072). All these crystallographic findings are in agreement with the TEM analysis, confirming the main crystal system and crystal planes of each material. Last, the XRD patterns of the nanocomposites indicate that the formed MoS2 nanoparticles were successfully incorporated with the α-Fe2O3 materials, as the diffractions of both α-Fe2O3 and MoS2 co-exist in the composites patterns. In particular, hematite diffractions are always present in these composites’ patterns, although the oxide diffraction was more intense in the case of the α-Fe2O3-rich MoFe (1:2) sample.
The examination with vibrational Raman spectroscopy also confirmed the successful fabrication of molybdenum disulfide and hematite (Figure 4). First, the acquired spectrum of MoS2 revealed a typical fingerprint of hexagonal 2H MoS2 materials: the in-plane E2g band of two S atoms vibrated in the opposite direction in respect to the Mo atom (381 cm−1) and the out-of-plane A1g band of the of S atoms along the c axis (407 cm−1) [30]. Interestingly, the frequency difference between the two bands exceeds 20 cm−1, suggesting that sulfide is multi-layered [31]. Moreover, the E1g band at 286 cm−1 is Raman-active in bulk 2H MoS2 materials, providing more evidence for the bulk nature of the material [32]. On the other hand, the presence of a longitudinal acoustic phonon mode at 224 cm−1 and its resonance enhanced overtone at 457 cm−1 might correspond to lattice disorders or structural changes, which are related to the co-existence of the octahedral T1 MoS2 phase [32,33]. The analysis of the hematite presented characteristic vibration A1g bands at 224 and 499 cm−1 (related to octahedral Fe(O)6 motions), and Eg bands at 244, 294–298 (double mode), 409, and 412 cm−1 (related to the rotations and translations of the Fe2O3 lattice), and displayed a longitudinal optical phonon (LO) at 661 cm−1 [34]. Regarding the MoFe composites, their diagrams did not have significant differences compared to the pristine MoS2 because the Fe-O modes were absent. The only indirect proof of the semiconductors’ incorporation was the slight redshifts of the E2g band and the blueshifts of A2g, which are associated with the coupling of MoS2 with oxide [35]. Nevertheless, some random aggregates were detected in the case of the α-Fe2O3-rich samples comprising MoFe (1:1) and MoFe (1:2), in which localized α-Fe2O3 formations could be identified (Figure S3a,b). The extent and size of these formations were more easily detected across the MoFe (1:2) samples. These spectroscopic observations are in accordance with the morphological findings, as long as the 2H bulk MoS2 is mainly identified on the surface and the α-Fe2O3 vibrations are not detected, and when either the hematite is nano-sized or well-distributed across the sulfide, or when it is located in the internal part of the MoFe structures.
Figure 5 shows the FTIR spectra of as-synthesized MoS2, α-Fe2O3, and MoFe nanocomposites. In general, molybdenum disulfide crystals might present a very weak Mo-S vibration mode at the skeletal region; therefore, its absence at ~600 cm−1 does not affect the materials’ evaluation [36]. However, it is remarkable that that neither covalent bonds of carbon with C, N, O, and/or H, nor the sulfur complexes, were observed at the skeletal and the functional group regions [36], implying that thiourea was totally consumed during the hydrothermal process and pure MoS2 was formed. In the case of the α-Fe2O3 nanoparticle, the presence of Fe2O3 was confirmed with two dominant bands at 470 and 540 cm−1, which are related to metal–oxygen stretching vibrations (Fe-O) [37]. These bands were also present in all MoFe samples, especially in the Fe-rich composite.

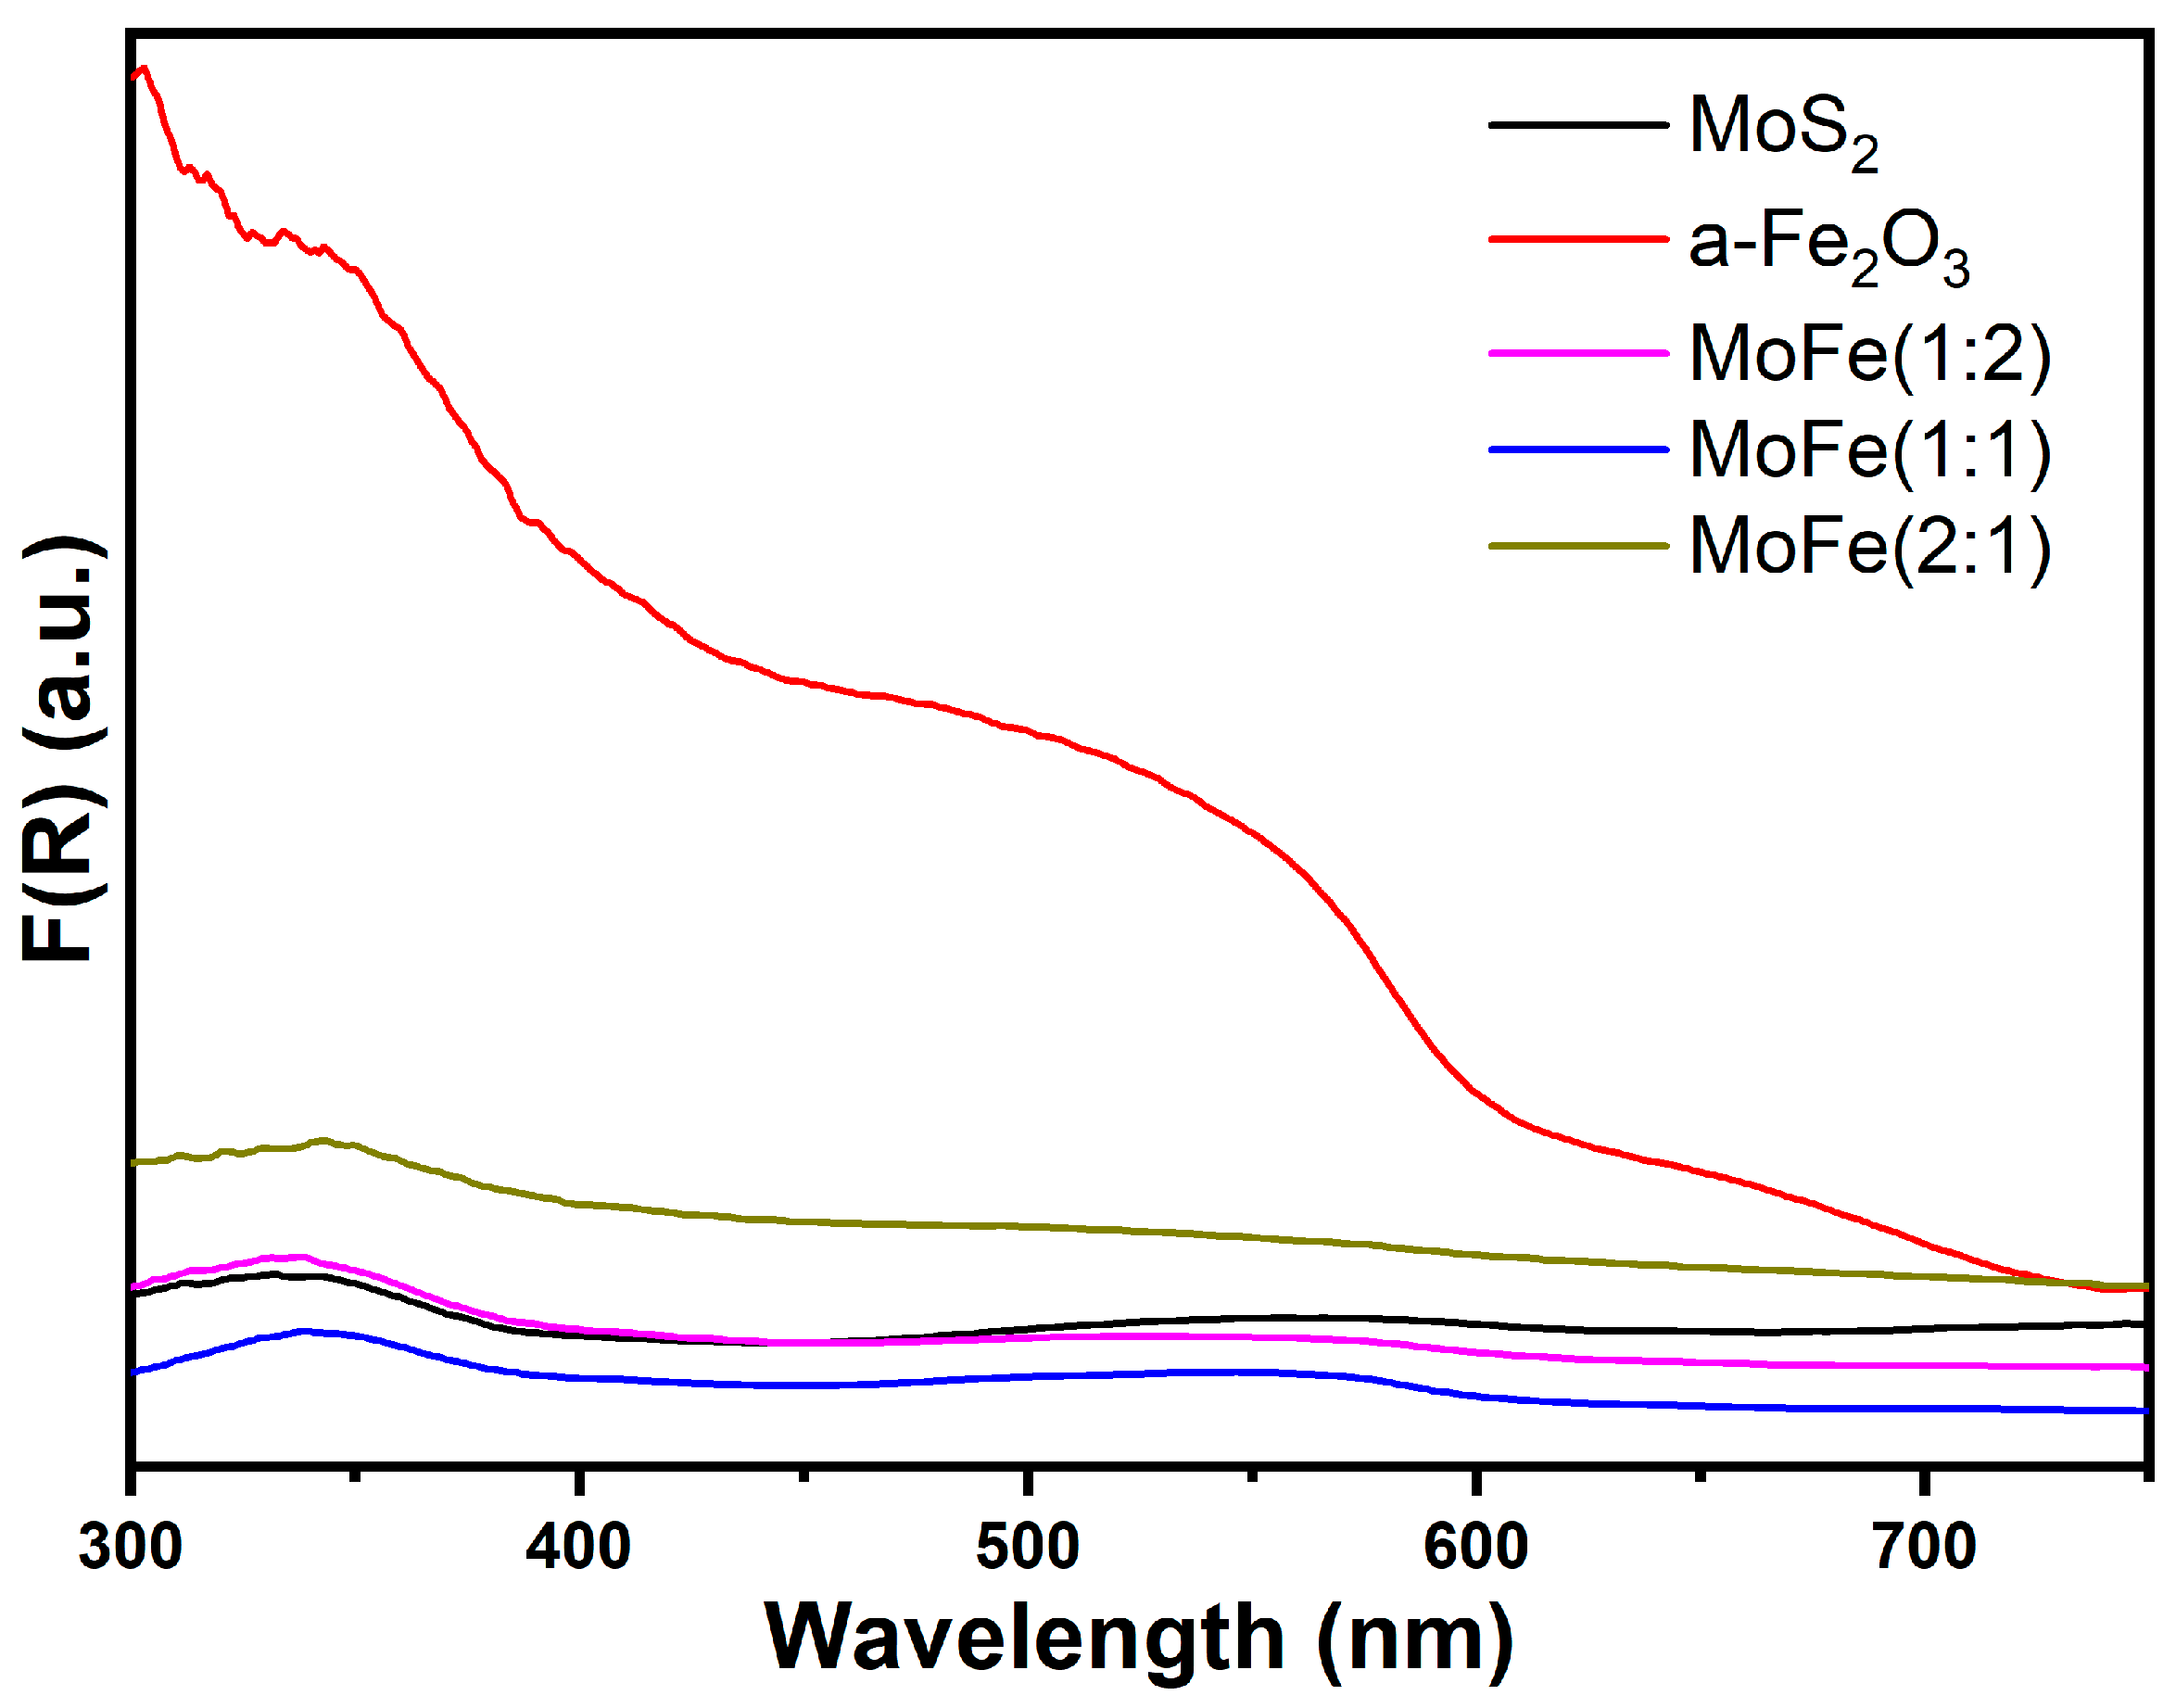
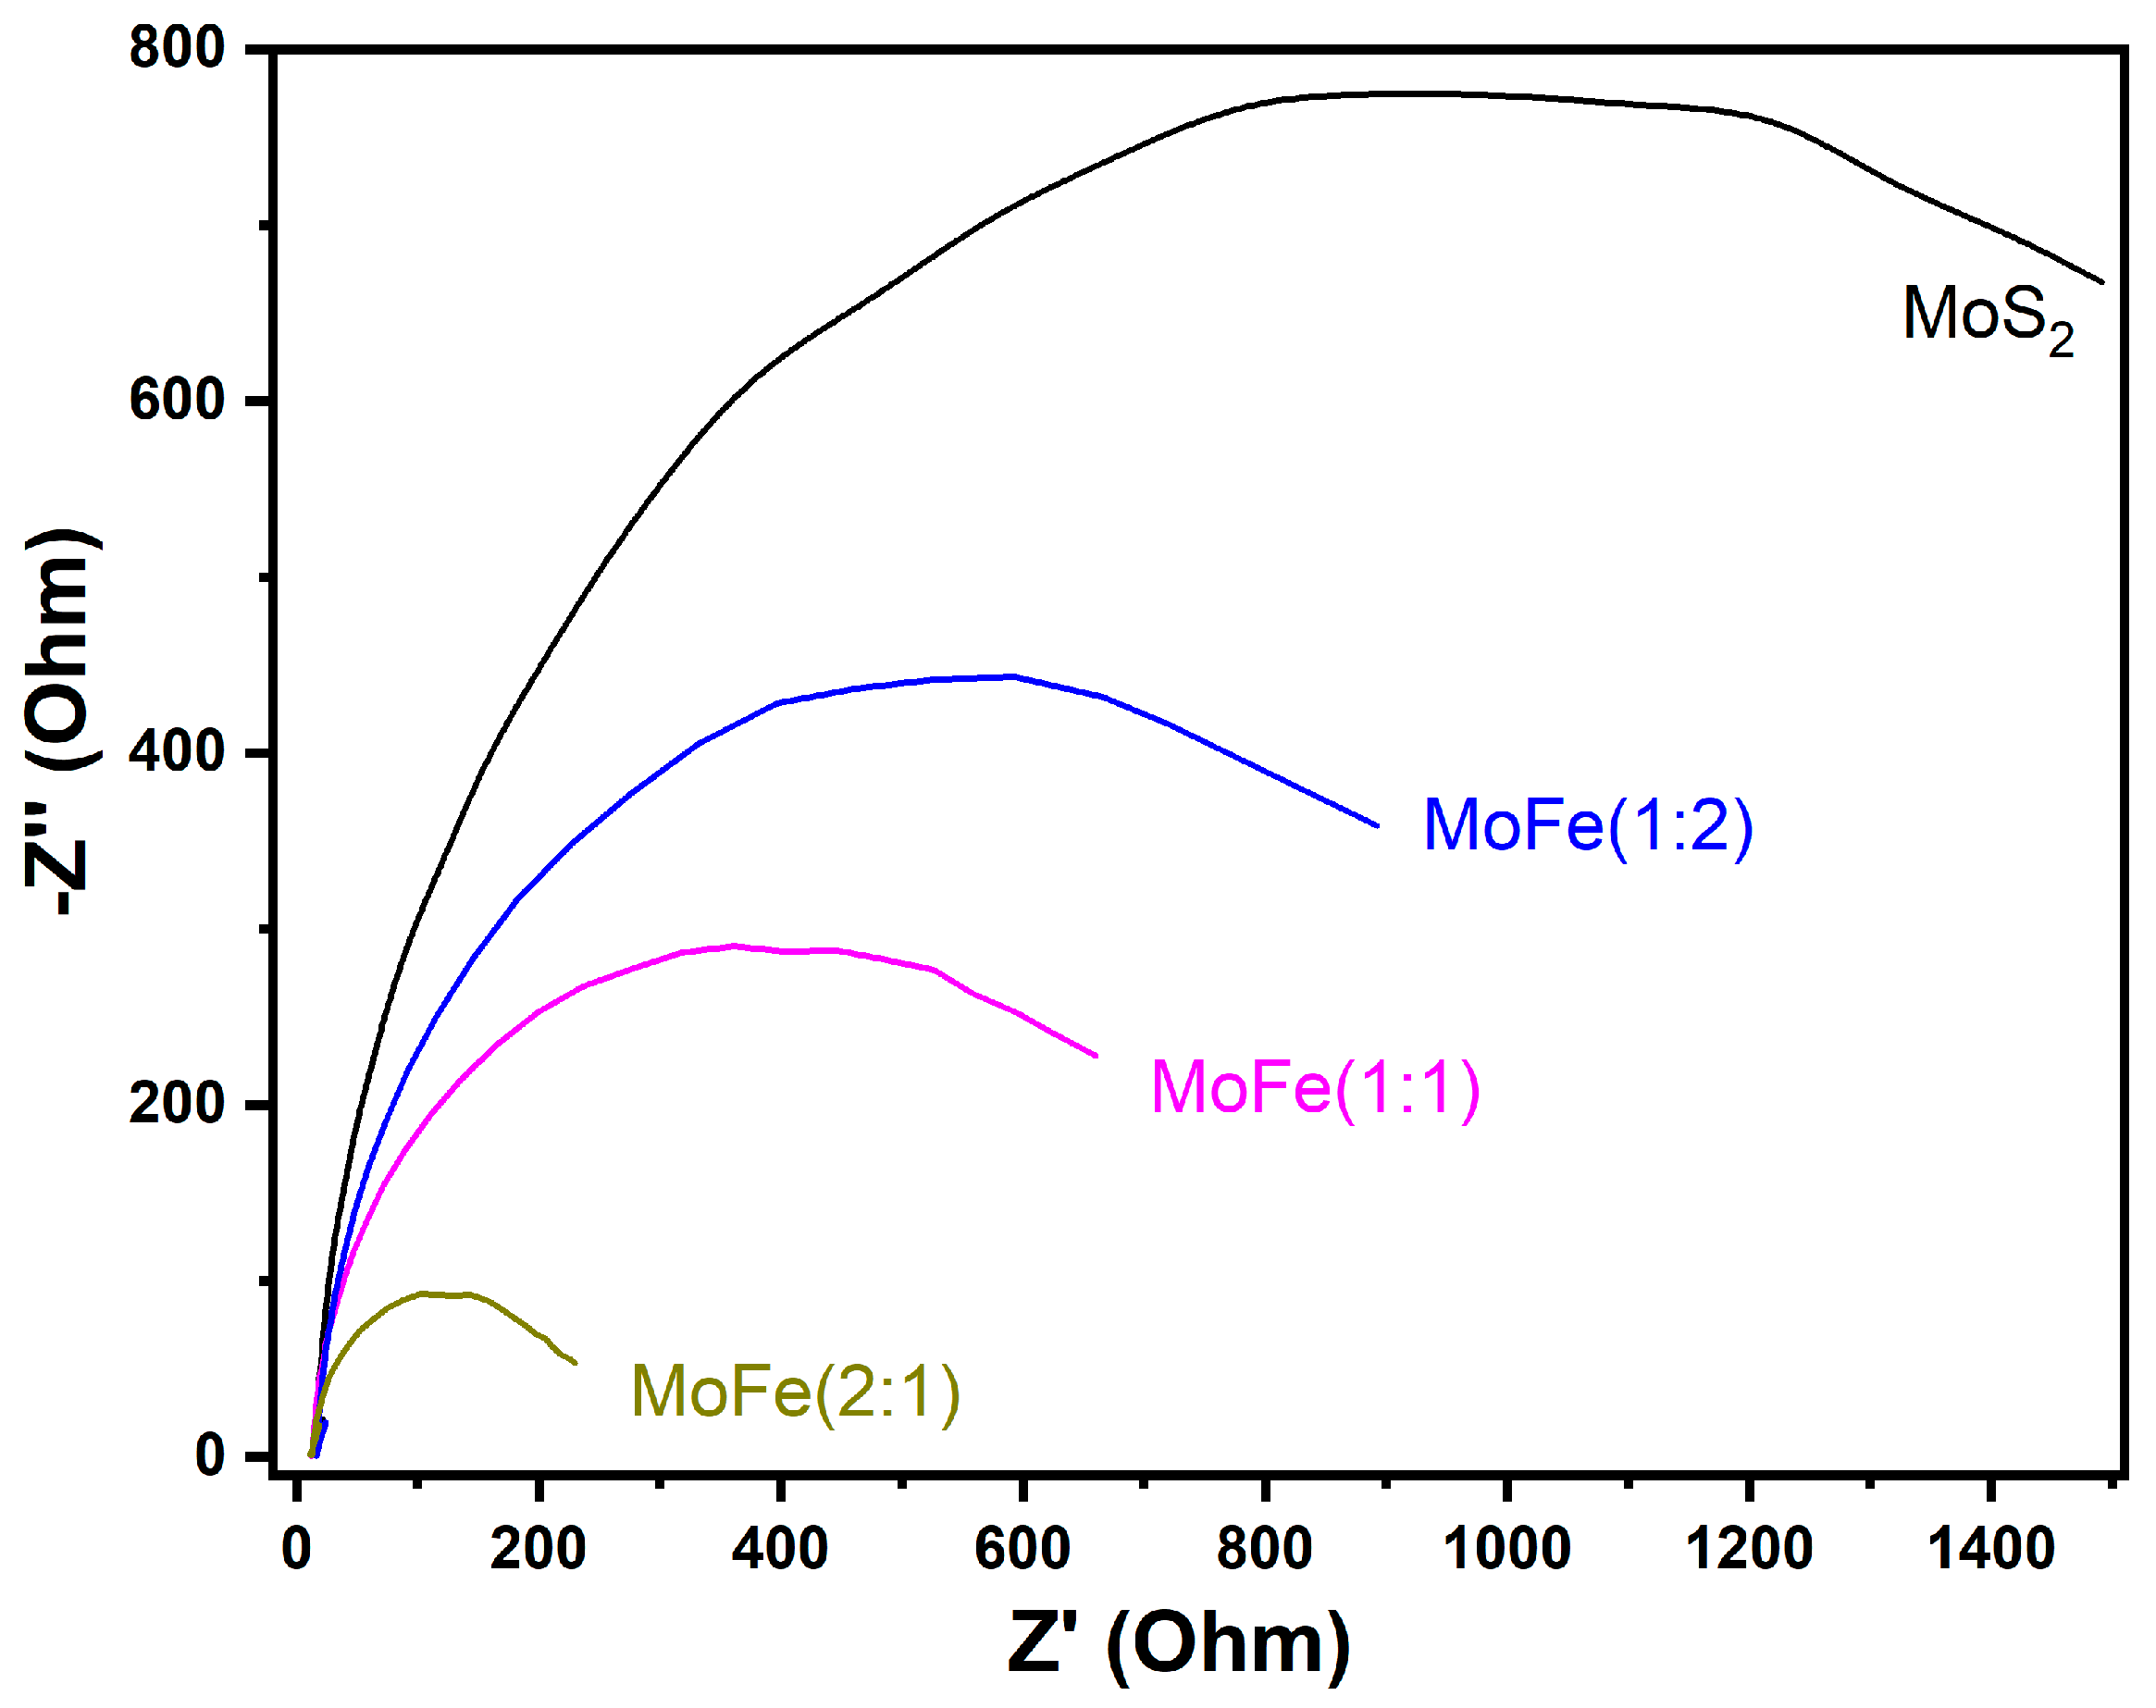
3.3. Optoelectronic Properties

Concerning the optical properties and the estimated band gaps of the synthesized composite, it should be first mentioned that the MoS2 band gap is correlated with the material’s morphology. In particular, if MoS2 is synthesized in the form of a monolayer, then the respective band gap is direct, while multilayered MoS2 structures have indirect gaps [10,11]. Based on the SEM images, it is apparent that the flower-like structures consist of aggregated MoS2 thin flakes, so both band gap types could be expected in all samples. Indeed, the obtained absorption spectra in Figure 6, expressed in Kubelka–Munk units (F(R)), reveal that two intense peaks in the regions of 300–400 nm and 500–600 nm co-exist and are attributed to the indirect and direct transitions of the photo-charge carries [38]. On the other hand, the reference hematite material presented a typical absorbance spectrum, where both O2p→Fe3d (~400 nm) and Fe3d→Fe3d (~540 nm) transitions were detected [39].
Next, the acquired Nyquist plots from impedance spectroscopy (Figure 7) provide insights into the charge transfer resistance of the photoexcited electron–hole pairs. The shorter semicircle diameters of the composite materials demonstrate that the incorporation of α-Fe2O3 with MoS2 improves the charge carriers’ separation and limits the recombination effects [29]. Even if there is no specific tendency between the oxide quantity in the composites and reduced resistance, an obvious improvement is observed; therefore, the enhanced generation of reactive radicals is also predicted during photocatalysis compared to the reference molybdenum disulfide sample.

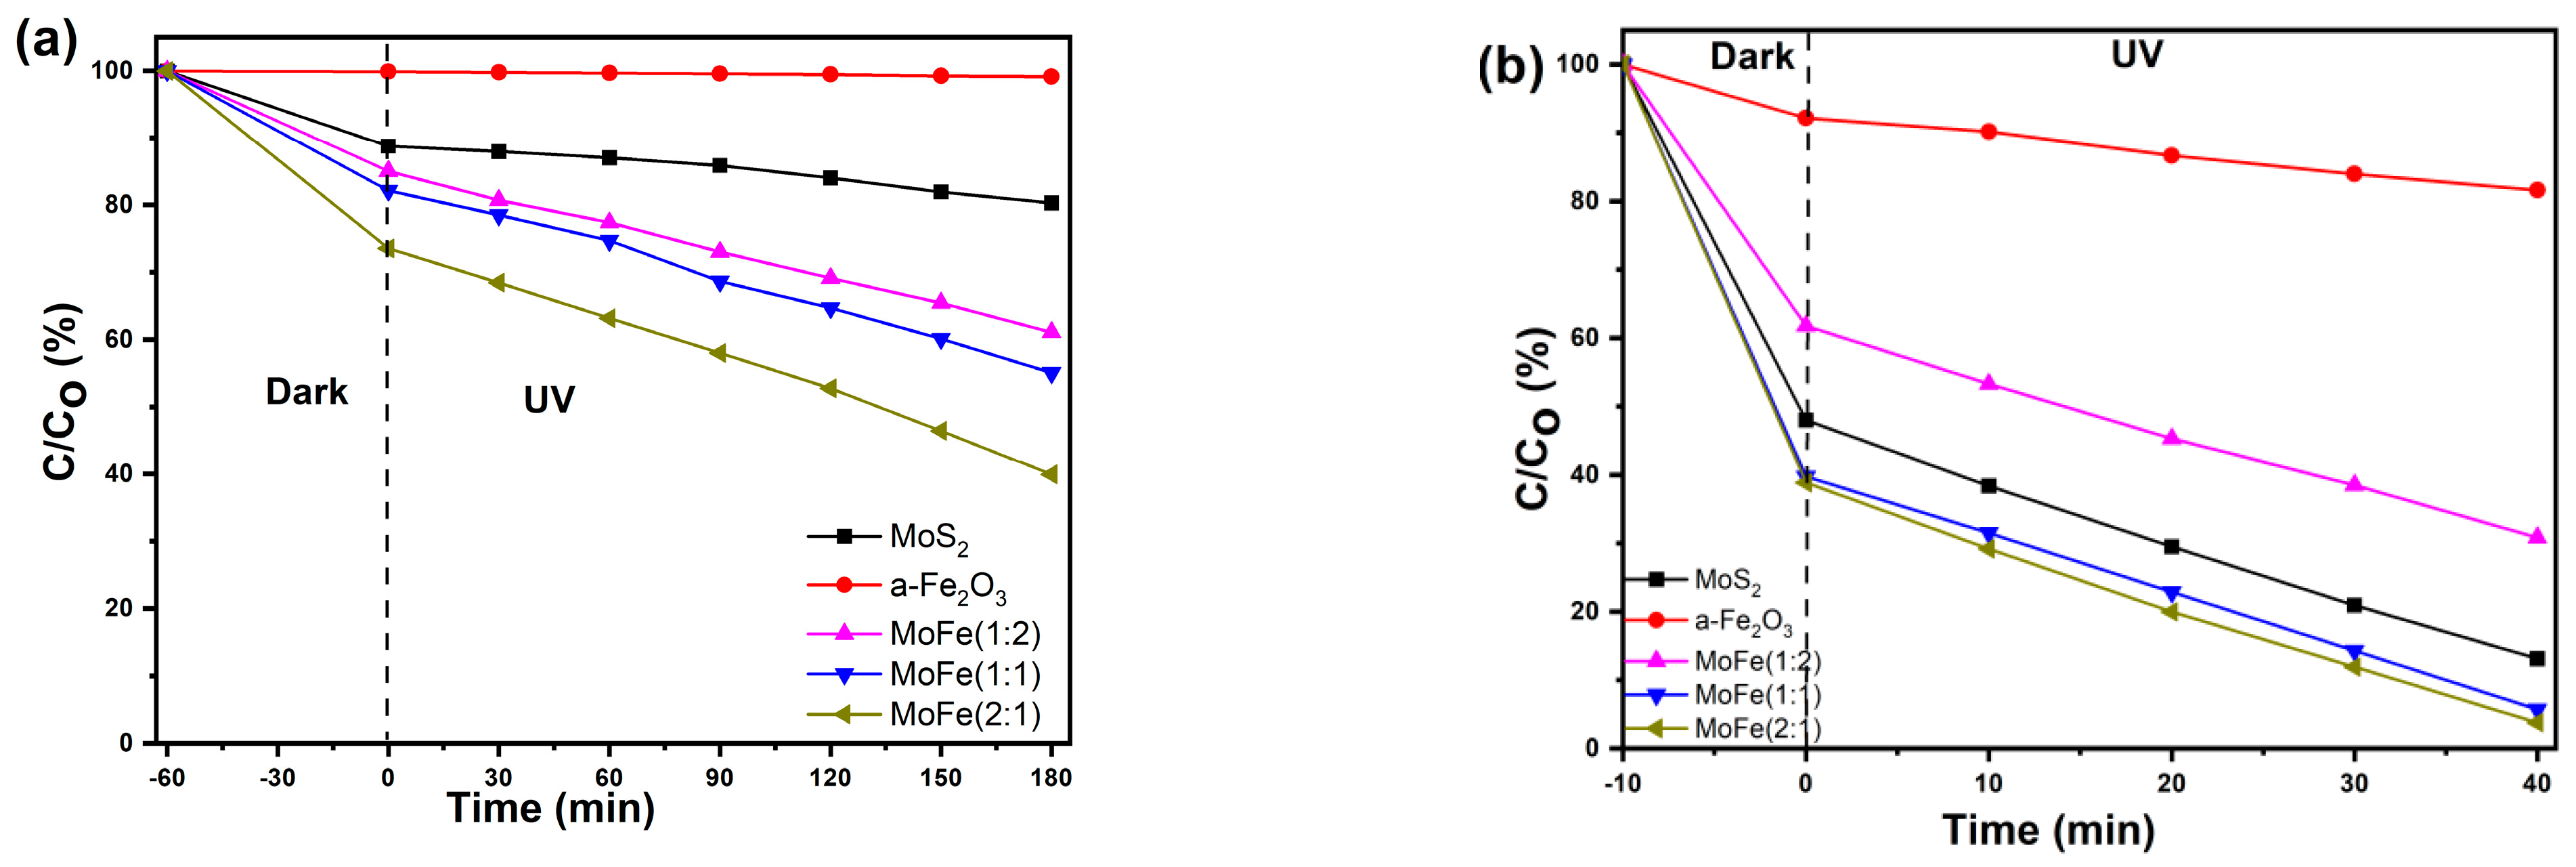
3.4. Photocatalytic Performance

The photocatalytic performance of the synthesized samples was examined with a tetracycline pharmaceutical and hexavalent chromium industrial additive in order to investigate the materials’ performance on oxidation and reduction mechanism pathways, respectively. Starting with TC (Figure 8a), the ferrite was totally inactive, implying that neither adsorption nor photocatalytic and Fenton reactions take place. Similarly, the MoS2 reference material presented poor removal activity after reaching the adsorption–desorption equilibrium of ~80%. On the other hand, the TC photodegradation with MoFe composites improved remarkably; the TC concentration decreased to 40% with MoFe (2:1) after 3 h of UV illumination, 55% with MoFe (2:1), and 62% with MoFe (1:2). This trend must be related to the interaction of hematite with the MoS2 because the Fenton reactions cannot be activated under experimental conditions; hydrogen peroxide additives were not used as solutions during UV irradiation, while the photocatalytic generation of H2O2 for Fe2O3/MoS2 systems has been already excluded from previous studies [40]. Based on this investigation, the optoelectronic properties of the composites and the existence of localized α-Fe2O3 formations are the most important factors in photocatalysis. First, the charge transfer resistance of the samples is in line with the photodegradation rates of TC, suggesting that the samples’ efficacy to separate photo-charged carriers has resulted in an enhanced generation of ROS. Moreover, the simultaneous presence of both direct and indirect energy gaps on the MoS2 samples increases the materials’ responses during incident illumination, producing higher numbers of ROS [38]. Interestingly, MoFe (2:1) was the only sample without any α-Fe2O3 impurities across its surface, implying that the material’s purity is related to its enhanced photocatalytic efficiency. On the contrary, MoFe (1:1) and MoFe (1:2) contain α-Fe2O3 impurities all across their surface, which are able to affect e/h+ separation, ROS production, and their photocatalytic performance.
Concerning the photocatalytic conversion of Cr(VI) to a trivalent with MoFe materials, the findings are in accordance with the above-mentioned results (Figure 8b). In particular, MoFe (2:1) was the best photocatalyst, reaching an almost 100% hexavalent chromium reduction, while MoFe (1:2) presented poor activity, which was close to 30%. Compared to the reference MoS2 sample, the MoFe composites performed equally well, implying that the incorporation of α-Fe2O3 did not alter the photoreduction yields. In particular, the deterioration of Cr(VI) photoreduction with MoFe samples should be expected because the addition of hematite lessens the composites’ specific surface area and the pore volume, compared to the reference MoS2 [12]. Nevertheless, the composites’ effectiveness was maintained close to the reference material. Raman analysis and impedance spectroscopy implied that crystallinity and e/h+ separation may have a higher impact in photocatalysis compared to SSA, meaning that the improved optoelectronic properties have balanced the SSA decrement.

4. Conclusions

The results of this study established the efficient incorporation and fabrication of photocatalytic MoS2/α-Fe2O3 composites (noted as MoFe) under a convenient two-step hydrothermal route. The formed flakes of the hexagonal molybdenum disulfide were packed in an extended 3D flower-like network, which was decorated with well-dispersed nanoparticulate α-Fe2O3 crystals. The alteration of the precursors’ ratio during synthesis influenced the morphology, surface area, and charge transfer resistance of the produced MoFe samples, while the structural and optical properties remained intact. Remarkably, the two-step synthesis process produced homogeneous materials, especially in the case of the MoFe(2:1) sample, as no organic or inorganic impurity domains were detected during the examination with vibrational spectroscopic techniques. The photocatalytic activity of the synthesized composites revealed that MoFe (2:1) achieved 60% removal for the tetracycline pharmaceutical and complete removal of the hexavalent chromium industrial additive, suggesting that the material’s high purity and the limited recombination of the photogenerated charge carriers are the key parameters for its superior performance.

Supplementary Materials

The following supporting information can be downloaded at: https://www.mdpi.com/article/10.3390/chemengineering8010020/s1, Figure S1: SEM images of hematite in ×20,000 (a) and ×50,000 (b) magnification; Figure S2: HAADF_STEM image of MoFe (2:1) (a) and the corresponding elemental mapping images of Fe K- edge (b; blue), Mo K-edge (c; red), and S K-edge (d; green); Figure S3: Raman examination of MoFe (1:1) (a) and MoFe (1:2) (b) at different spots across their surface; Figure S4: N2 adsorption–desorption isotherms (a,c,e,g,i) and pore size distribution (b,d,f,h,j) curves of the prepared photocatalysts.

Author Contributions

Conceptualization, I.I. and M.K.A.; validation and methodology, I.I., P.P.F., E.S., M.A., C.A. and M.K.A.; investigation and writing—original draft preparation, I.I., C.A. and M.K.A.; writing—review and editing, M.K.A.; supervision, C.A. All authors have read and agreed to the published version of the manuscript.

Funding

This work was funded by the EC, Environment, LIFE17 ENV/GR/000387 PureAgroH2O Programme. I. Ibrahim was financially supported by the Science Achievement Scholarship of High Education Ministry of Egypt in cooperation with the Hellenic Ministry of Foreign Affairs for his PhD Scholarship.

Institutional Review Board Statement

Not applicable.

Data Availability Statement

Data are contained within the article and Supplementary Materials.

Conflicts of Interest

The authors declare no conflicts of interest. The funders had no role in the design of the study; in the collection, analyses, or interpretation of data; in the writing of the manuscript; or in the decision to publish the results.

References

  1. Pelaez, M.; Nolan, N.T.; Pillai, S.C.; Seery, M.K.; Falaras, P.; Kontos, A.G.; Dunlop, P.S.M.; Hamilton, J.W.J.; Byrne, J.A.; KO’Shea Entezari, M.H.; et al. A review on the visible light active titanium dioxide photocatalysts for environmental applications. Appl. Catal. B 2012, 125, 331–349. [Google Scholar] [CrossRef]
  2. Theodorakopoulos, G.; Arfanis, M.K.; Pérez, J.S.; Agüera, A.; Aponte, F.X.C.; Markellou, E.; Romanos, G.; Em Falaras, P. Novel pilot-scale photocatalytic nanofiltration reactor for agricultural wastewater treatment. Membranes 2023, 13, 202. [Google Scholar] [CrossRef] [PubMed]
  3. Antoniadou, M.; Falara, P.P.; Likodimos, V. Photocatalytic degradation of pharmaceuticals and organic contaminants of emerging concern using nanotubular structures. Curr. Opin. Green Sustain. Chem. 2021, 29, 100470. [Google Scholar] [CrossRef]
  4. Wang, D.; Yin, F.X.; Cheng, B.; Xia, Y.; Yu, J.G.; Ho, W.K. Enhanced photocatalytic activity and mechanism of CeO2 hollow spheres for tetracycline degradation. Rare Met. 2021, 40, 2369–2380. [Google Scholar] [CrossRef]
  5. Cheng, Y.H.; Chen, J.; Che, H.N.; Ao, Y.H.; Liu, B. Ultrafast photocatalytic degradation of nitenpyram by 2D ultrathin Bi2WO6: Mechanism, pathways and environmental factors. Rare Met. 2022, 41, 2439–2452. [Google Scholar] [CrossRef]
  6. Ibrahim, I.; Athanasekou, C.; Manolis, G.; Kaltzoglou, A.; Nasikas, N.K.; Katsaros, F.; Devlin, E.; Kontos, A.G.; Falaras, P. Photocatalysis as an advanced reduction process (ARP): The reduction of 4-nitrophenol using titania nanotubes-ferrite nanocomposites. J. Hazard. Mater. 2019, 372, 37–44. [Google Scholar] [CrossRef]
  7. Liu, J.; Wang, S.L.; Xuan, J.L.; Shan, B.F.; Luo, H.; Deng, L.P.; Yang, P.; Qi, C.Z. Preparation of tungsten–iron composite oxides and application in environmental catalysis for volatile organic compounds degradation. Tungsten 2022, 4, 38–51. [Google Scholar] [CrossRef]
  8. Ibrahim, I.; Kaltzoglou, A.; Athanasekou, C.; Katsaros, F.; Devlin, E.; Kontos, A.G.; Ioannidis, N.; Perraki, M.; Tsakiridis, P.; Sygellou, L.; et al. Magnetically separable TiO2/CoFe2O4/Ag nanocomposites for the photocatalytic reduction of hexavalent chromium pollutant under UV and artificial solar light. Chem. Eng. J. 2020, 381, 122730. [Google Scholar] [CrossRef]
  9. Zhao, M.; Zhu, X.Y.; Li, Y.Z.; Chang, J.N.; Li, M.X.; Ma, L.H.; Guo, X.Y. A Lindqvist-type [W6O19]2 organic–inorganic compound: Synthesis, characterization, antibacterial activity and preliminary studies on the mechanism of action. Tungsten 2022, 4, 121–129. [Google Scholar] [CrossRef]
  10. Zhang, G.; Liu, H.; Qu, J.; Li, J. Two-dimensional layered MoS2: Rational design, properties and electrochemical applications. Energy Environ. Sci. 2016, 9, 1190. [Google Scholar] [CrossRef]
  11. Xu, Z.; Lu, J.; Zheng, X.; Chen, B.; Luo, Y.; Tahir, M.N.; Huang, B.; Xia, X.; Pan, X. A critical review on the applications potential risks of emerging MoS2 nanomaterials. J. Hazard. Mater. 2020, 399, 123057. [Google Scholar] [CrossRef]
  12. Gao, Y.; Chen, C.L.; Tan, X.L.; Xu, H.; Zhu, K.R. Polyaniline-modified 3D-flower-like molybdenum disulfide composite for efficient adsorption/photocatalytic reduction of Cr(VI). J. Colloid Interface Sci. 2016, 476, 62–70. [Google Scholar] [CrossRef]
  13. Deng, X.; Yang, Y.; Mei, Y.; Li, J.; Guo, C.; Yao, T.; Guo, Y.; Xin, B.; Wu, J. Construction of Fe3O4@FeS2@C@MoS2 Z-scheme heterojunction with sandwich-like structure: Enhanced catalytic performance in photo-Fenton reaction and mechanism insight. J. Alloys Compd. 2022, 901, 163437. [Google Scholar] [CrossRef]
  14. Zhang, Y.; Chen, P.; Wen, F.; Meng, Y.; Yuan, B.; Wang, H. Synthesis of S-rich flower-like Fe2O3-MoS2 for Cr(VI) removal. Sep. Sci. Technol. 2016, 11, 1779–1786. [Google Scholar] [CrossRef]
  15. Tao, Q.; Bi, J.; Huang, X.; Wei, R.; Wang, T.; Zhou, Y.; Hao, H. Fabrication, application, optimization and working mechanism of Fe2O3 and its composites for contaminants elimination from wastewater. Chemosphere 2021, 263, 127889. [Google Scholar] [CrossRef] [PubMed]
  16. Mishra, M.; Chun, D.M. α-Fe2O3 as a photocatalytic material: A review. Appl. Catal. A Gen. 2015, 498, 126–141. [Google Scholar] [CrossRef]
  17. Li, J.; You, J.; Wang, Z.; Zhao, Y.; Xu, J.; Li, X.; Zhang, H. Application of α-F1-x2O3-based heterogeneous photo-Fenton catalyst in wastewater treatment: A review of recent advances. J. Environ. Chem. Eng. 2022, 10, 108329. [Google Scholar] [CrossRef]
  18. Yang, X.; Sun, H.; Zhang, L.; Zhao, L.; Lian, J.; Jiang, Q.; Cong, Y. High Efficient Photo-Fenton Catalyst of α-Fe2O3/MoS2 Hierarchical Nanoheterostructures: Reutilization for Supercapacitors. Sci. Rep. 2016, 6, 31591. [Google Scholar] [CrossRef] [PubMed]
  19. Zhang, T.; Zhang, H.; Ji, Y.; Chi, N.; Cong, Y. Preparation of a novel Fe2O3-MoS2-CdS ternary composite film and its photoelectrocatalytic performance. Electrochim. Acta 2018, 285, 230–240. [Google Scholar] [CrossRef]
  20. Cong, Y.; Ding, W.; Zhang, W.; Zhang, T.; Wang, Q.; Zhang, Y. Fabrication of a novel 3D E-Fe2O3-Pi-MoS2 film with highly enhanced carrier mobility and photoelectrocatalytic activity. Electrochim. Acta 2020, 337, 135748. [Google Scholar] [CrossRef]
  21. Li, A.; Liu, Y.; Xu, X.; Zhang, Y.; Si, Z.; Wu, X.; Ran, R.; Weng, D. MOF-derived (MoS2, g-Fe2O3)/graphene Z-scheme photocatalysts with excellent activity for oxygen evolution under visible light irradiation. RSC Adv. 2020, 10, 17154. [Google Scholar] [CrossRef]
  22. Tama, A.M.; Das, S.; Dutta, S.; Bhuyan, M.D.I.; Islam, M.N.; Basith, M.A. MoS2 nanosheet incorporated α-Fe2O3/ZnO nanocomposite with enhanced photocatalytic dye degradation and hydrogen production ability. RSC Adv. 2019, 9, 40357–40367. [Google Scholar] [CrossRef]
  23. Zhao, Y.; Cai, W.; Shi, Y.; Tang, J.; Gong, Y.; Chen, M.; Zhong, Q. Construction of Nano-Fe2O3-Decorated Flower-Like MoS2 with Fe–S Bonds for Efficient Photoreduction of CO2 under Visible-Light Irradiation. ACS Sustain. Chem. Eng. 2020, 8, 12603–12611. [Google Scholar] [CrossRef]
  24. Khabiri, G.; Aboraia, A.M.; Soliman, M.; Guda, A.A.; Butova, V.V.; Yahia, I.S.; Soldatov, A.V. A novel α-Fe2O3@MoS2 QDs heterostructure for enhanced visible-light photocatalytic performance using ultrasonication approach. Ceram. Int. 2020, 46, 19600–19608. [Google Scholar] [CrossRef]
  25. Mu, D.; Chen, Z.; Shi, H.; Tan, N. Construction of flower-like MoS2/Fe3O4/rGO composite with enhanced photo-Fenton like catalyst performance. RSC Adv. 2018, 8, 36625–36631. [Google Scholar] [CrossRef]
  26. Wang, H.; Li, X.; Ge, Q.; Chong, Y.; Zhang, Y. A multifunctional Fe2O3@MoS2@SDS Z-scheme nanocomposite: NIR enhanced bacterial inactivation, degradation antibiotics and inhibiting ARGs dissemination. Colloids Surf. B 2022, 219, 112833. [Google Scholar] [CrossRef]
  27. Ibrahim, I.; Ali, I.O.; Salama, T.M.; Bahgat, A.A.; Mohamed, M.M. Synthesis of magnetically recyclable spinel ferrite (MFe2O4, M = Zn, Co, Mn) nanocrystals engineered by sol gel-hydrothermal technology: High catalytic performances for nitroarenes reduction. Appl. Catal. B-Environ. 2016, 181, 389–402. [Google Scholar] [CrossRef]
  28. Mohammadpour, E.; Asadpour-Zeynali, K. α-Fe2O3@MoS2 nanostructure as an efficient electrochemical catalyst for water oxidation. Microchem. J. 2020, 157, 104939. [Google Scholar] [CrossRef]
  29. Falara, P.P.; Ibrahim, I.; Zourou, A.; Sygellou, L.; Sanchez, D.E.; Romanos, G.; Em Givalou, L.; Antoniadou, M.; Arfanis, M.K.; Han, C.; et al. Bi-functional photocatalytic heterostructures combining titania thin films with carbon quantum dots (C-QDs/TiO2) for effective elimination of water pollutants. Environ. Sci. Pollut. Res. 2023, 30, 124976–124991. [Google Scholar] [CrossRef]
  30. Reddy, D.A.; Park, H.; Hong, S.; Kumar, D.P.; Kim, T.K. Hydrazine-assisted formation of ultrathin MoS2 nanosheets for enhancing their co-catalytic activity in photocatalytic hydrogen evolution. J. Mater. Chem. A 2017, 5, 6981–6991. [Google Scholar] [CrossRef]
  31. Luo, R.; Xu, W.W.; Zhang, Y.; Wang, Z.; Wang, X.; Gao, Y.; Liu, P.; Chen, M. Van der Waals interfacial reconstruction in monolayer transition-metal dichalcogenides and gold heterojunctions. Nat. Commun. 2020, 11, 1011. [Google Scholar] [CrossRef] [PubMed]
  32. Blanco, E.; Afanasiev, P.; Berhault, G.; Uzio, D.; Loridan, S. Resonance Raman spectroscopy as a probe of the crystallite size of MoS2 nanoparticles. Comptes Rendus Chim. 2016, 19, 1310–1314. [Google Scholar] [CrossRef]
  33. Yao, Y.; Ao, K.; Lv, P.; Wei, Q. MoS2 Coexisting in 1T and 2H Phases Synthesized by Common Hydrothermal Method for Hydrogen Evolution Reaction. Nanomaterials 2019, 9, 844. [Google Scholar] [CrossRef] [PubMed]
  34. Marshall, C.P.; Dufresne, W.J.B.; Rufledt, C.J. Polarized Raman spectra of hematite assignment of external modes. J. Raman Spectrosc. 2020, 51, 1522–1529. [Google Scholar] [CrossRef]
  35. Wei, F.; Cui, X.; Wang, Z.; Dong, C.; Li, J.; Han, X. Recoverable peroxidase-like Fe3O4@MoS2-Ag nanozyme with enhanced antibacterial ability. Chem. Eng. J. 2021, 408, 127240. [Google Scholar] [CrossRef] [PubMed]
  36. Khawula, T.N.Y.; Raju, K.; Franklyn, P.J.; Sigalas, I.; Ozoemena, K.I. Symmetric pseudocapacitors based on molybdenum disulfide (MoS2)-modified carbon nanospheres: Correlating physicochemistry synergistic interaction on energy storage. J. Mater. Chem. A 2016, 4, 6411. [Google Scholar] [CrossRef]
  37. Theerthagiri, J.; Senthil, R.A.; Priya, A.; Madhavan, J.; Michael, R.J.V.; Ashokkumar, M. Photocatalytic and photoelectrochemical studies of visible-light active α-Fe2O3–g-C3N4 nanocomposites. RSC Adv. 2014, 4, 38222–38229. [Google Scholar] [CrossRef]
  38. Saha, N.; Sarkar, A.; Ghosh, A.B.; Dutta, A.K.; Bhadu, G.R.; Parimal, P.; Adhikary, B. Highly active spherical amorphous MoS2: Facile synthesis and application in photocatalytic degradation of rose bengal dye and hydrogenation of nitroarenes. RSC Adv. 2015, 5, 88848–88856. [Google Scholar] [CrossRef]
  39. Cai, J.; Li, S.; Pan, H.; Liu, Y.; Qin, G. c-In2O3/α-Fe2O3 heterojunction photoanodes for water oxidation. J. Mater. Sci. 2016, 51, 8148–8155. [Google Scholar] [CrossRef]
  40. Yang, Y.; Wang, Q.; Zhang, X.; Deng, X.; Guan, Y.; Wu, M.; Liu, L.; Wu, J.; Yao, T.; Yin, Y. Photocatalytic generation of H2O2 over a Z-scheme Fe2O3@C@1T/2H-MoS2 heterostructured catalyst for high-performance Fenton reaction. J. Mater. Chem. A 2023, 11, 1991. [Google Scholar] [CrossRef]
Figure 1. SEM images of MoS2 and MoFe nanoparticles in ×20,000 and ×100,000 magnification.
Chemengineering 08 00020 g001
Figure 2. HR-TEM of MoS2 (a,b), α-Fe2O3 (c,d), and MoFe (2:1) (e) in different magnifications.
Chemengineering 08 00020 g002
Figure 3. XRD patterns of MoS2, α-Fe2O3, and MoFe nanoparticles.
Chemengineering 08 00020 g003
Figure 4. Raman spectra of α-Fe2O3, MoS2, and MoFe nanoparticles.
Chemengineering 08 00020 g004
Figure 5. IR spectra of the prepared photocatalysts.
Chemengineering 08 00020 g005
Figure 6. Absorbance spectra of α-Fe2O3, MoS2, and MoFe nanoparticles, expressed in Kubelka–Munk units.
Chemengineering 08 00020 g006
Figure 7. Nyquist plots of the reference MoS2 and MoFe samples.
Chemengineering 08 00020 g007
Figure 8. Photocatalytic oxidation of tetracycline (a) and reduction of hexavalent Cr (b) with α-Fe2O3, MoS2, and the MoFe composites.
Chemengineering 08 00020 g008
Table 1. Textural properties of the prepared photocatalysts.
α-Fe2O3MoS2MoFe (1:2)MoFe (1:1)MoFe (2:1)
BET surface area (m2/g)70.039.527.537.828.8
Total pore volume (cm3/g)0.1850.1200.1040.1340.093
Disclaimer/Publisher’s Note: The statements, opinions and data contained in all publications are solely those of the individual author(s) and contributor(s) and not of MDPI and/or the editor(s). MDPI and/or the editor(s) disclaim responsibility for any injury to people or property resulting from any ideas, methods, instructions or products referred to in the content.

