
Computational Fluid Dynamics Modeling of the Filtration of 2D Materials Using Hollow Fiber Membranes

Abstract
:1. Introduction
2. Methods
2.1. Governing Equations
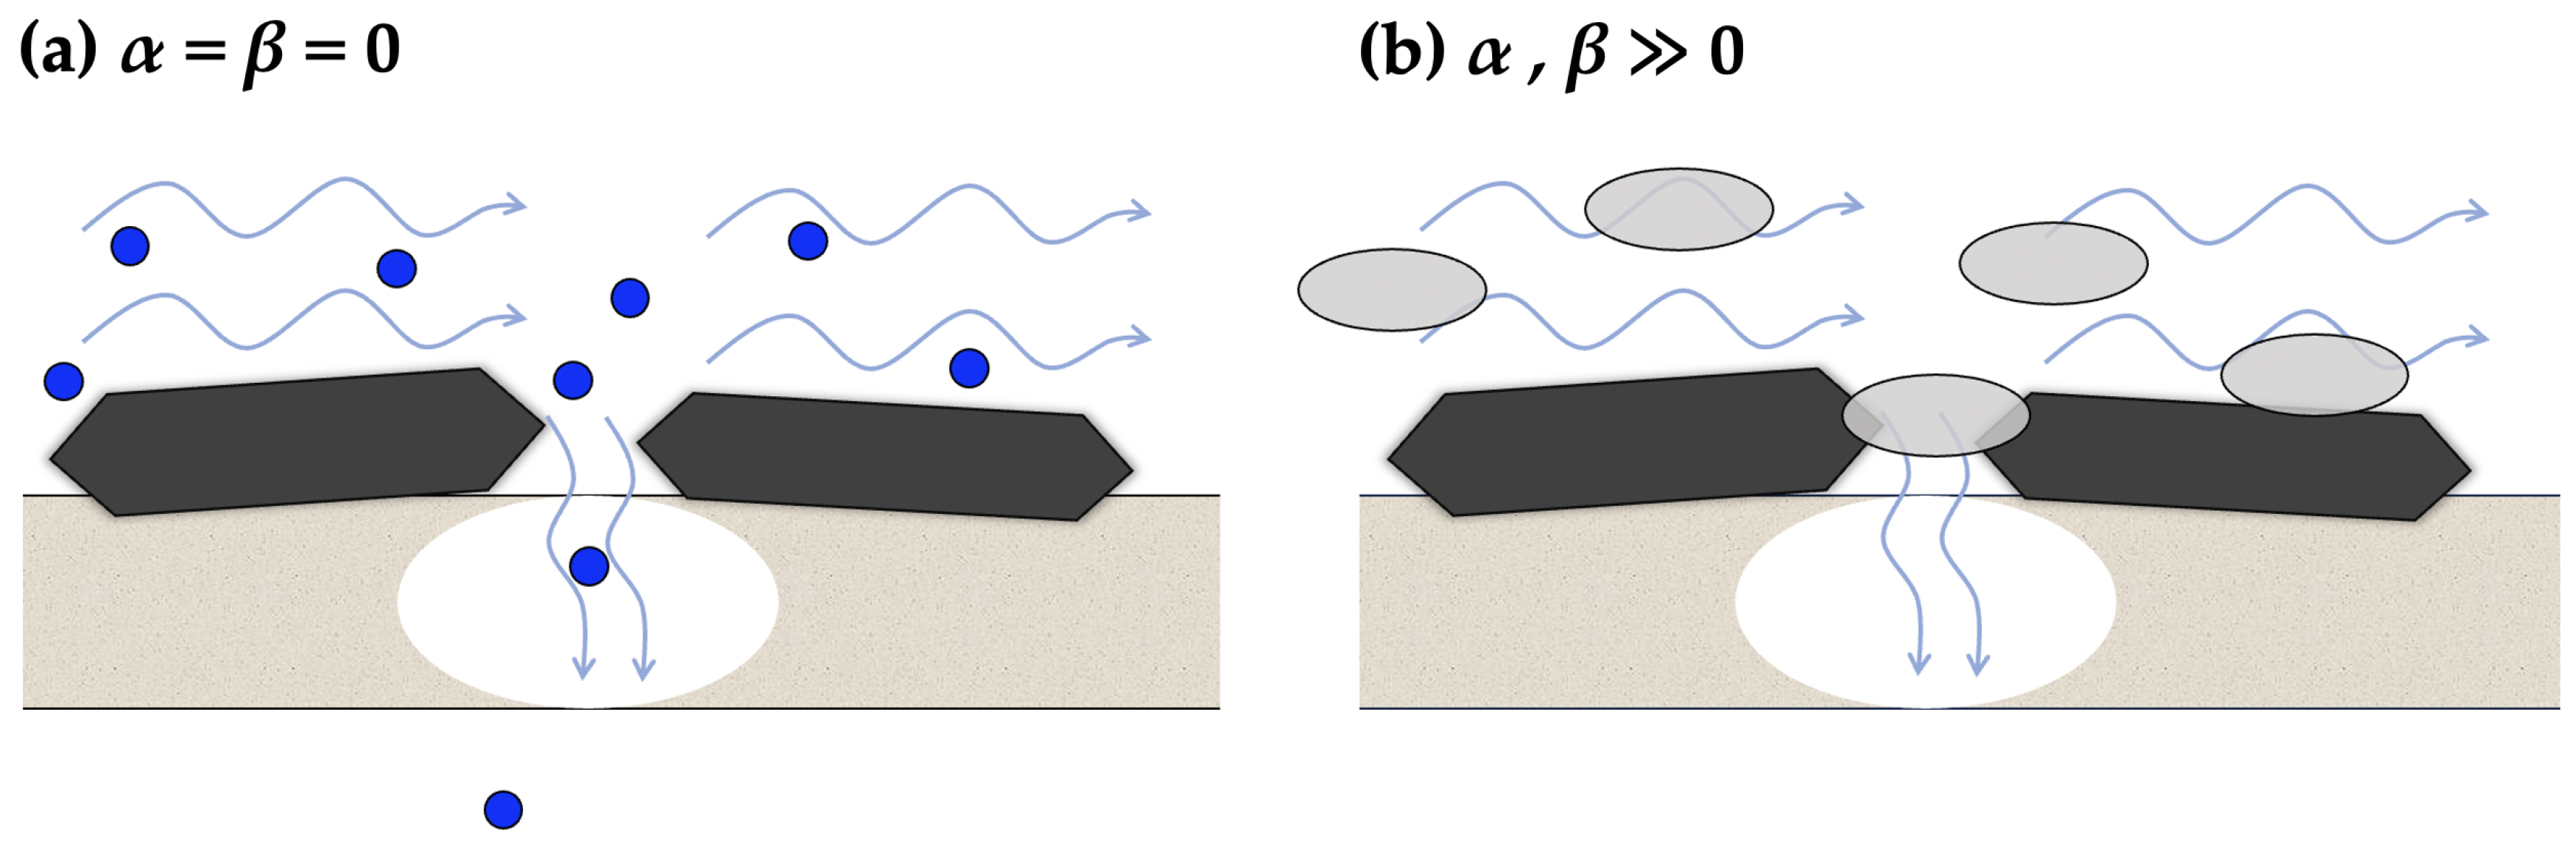
2.2. Resistance Parameters
2.3. Permeate Flux Concentration
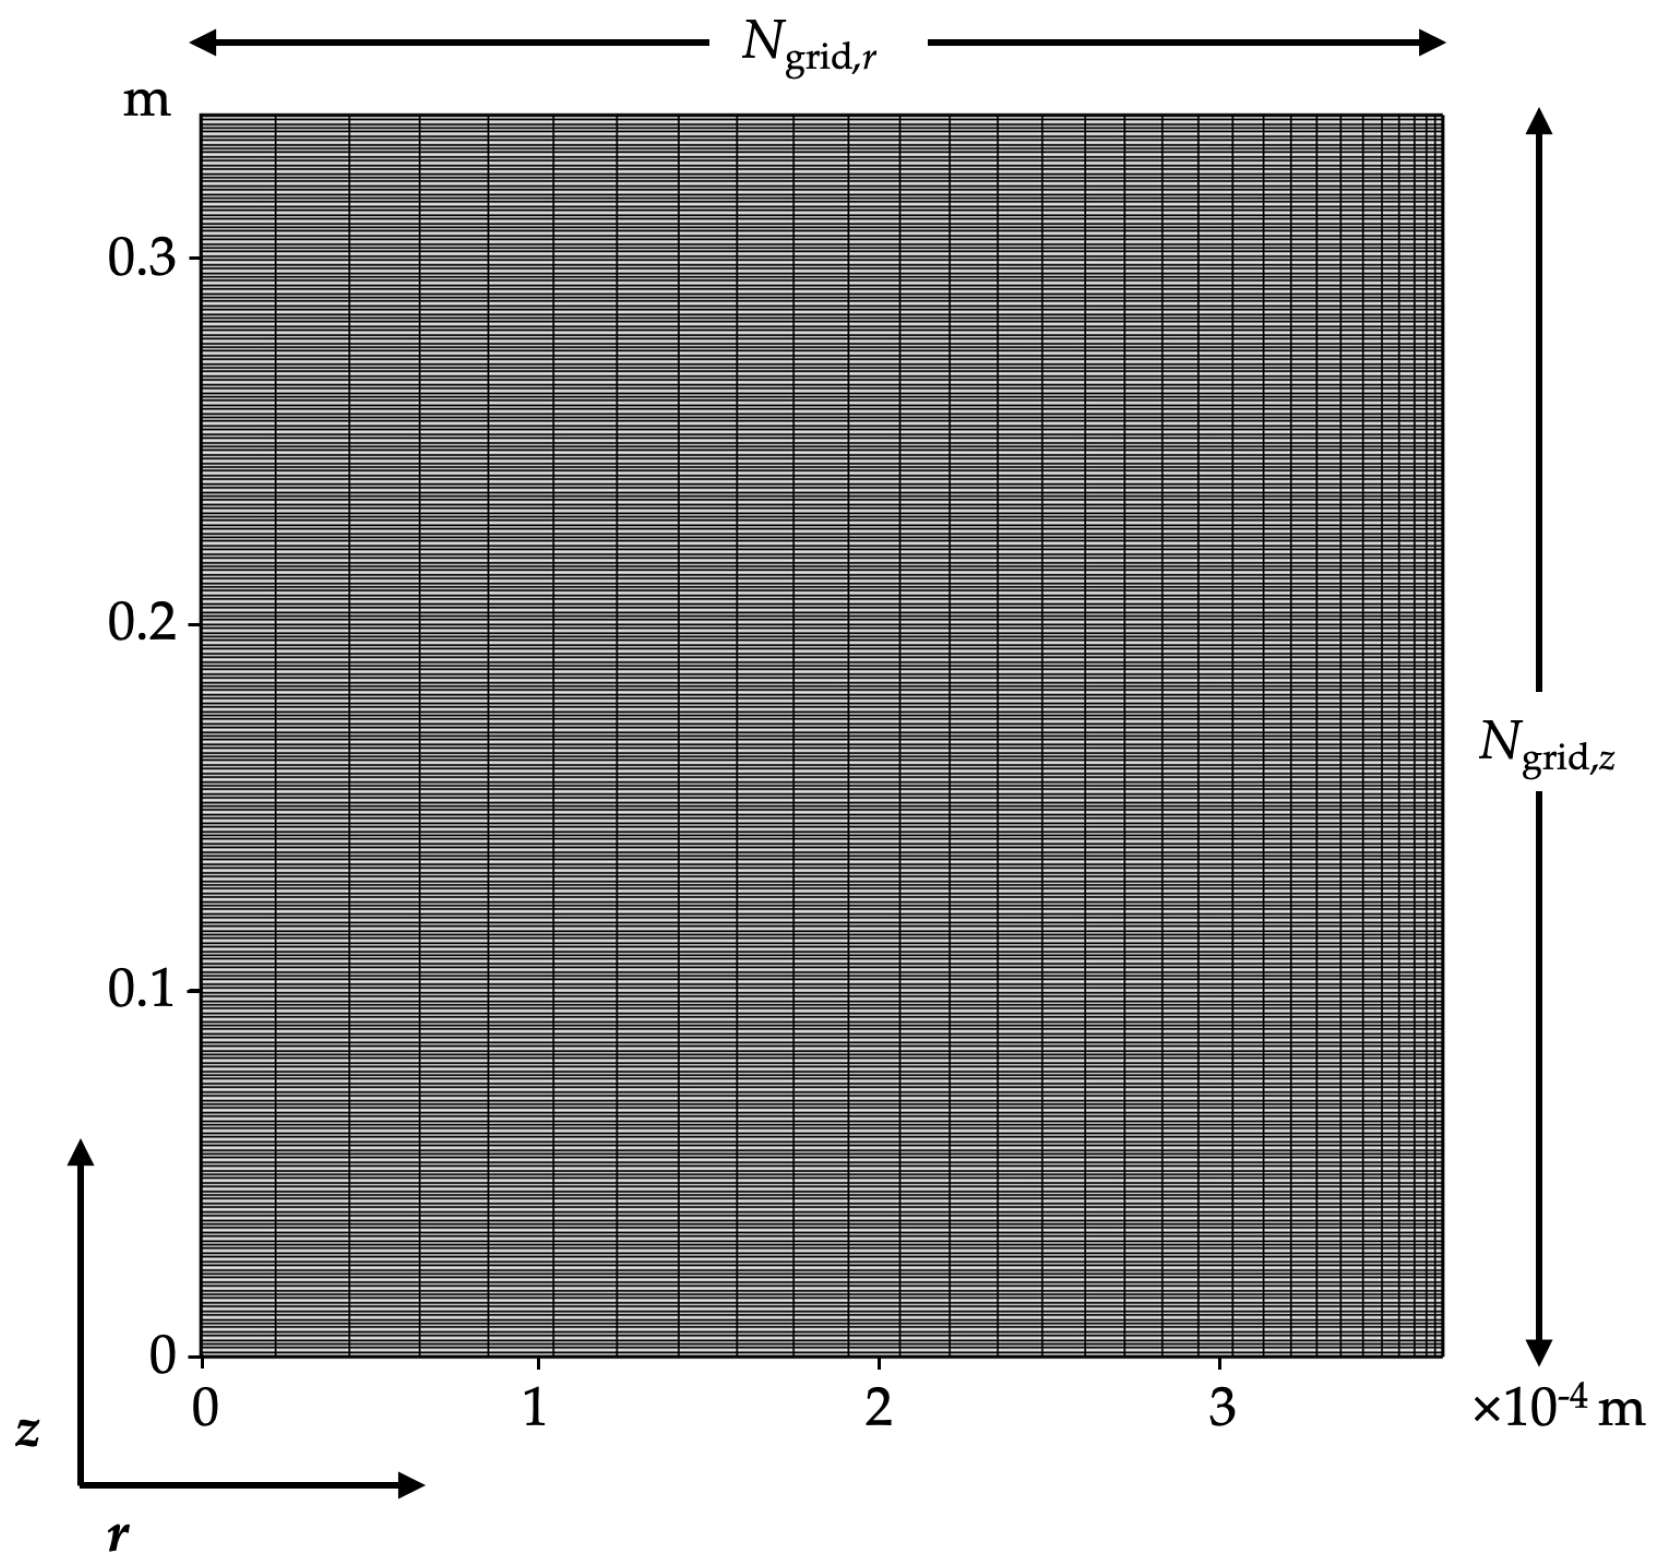
2.4. Numerical Solution
3. Results
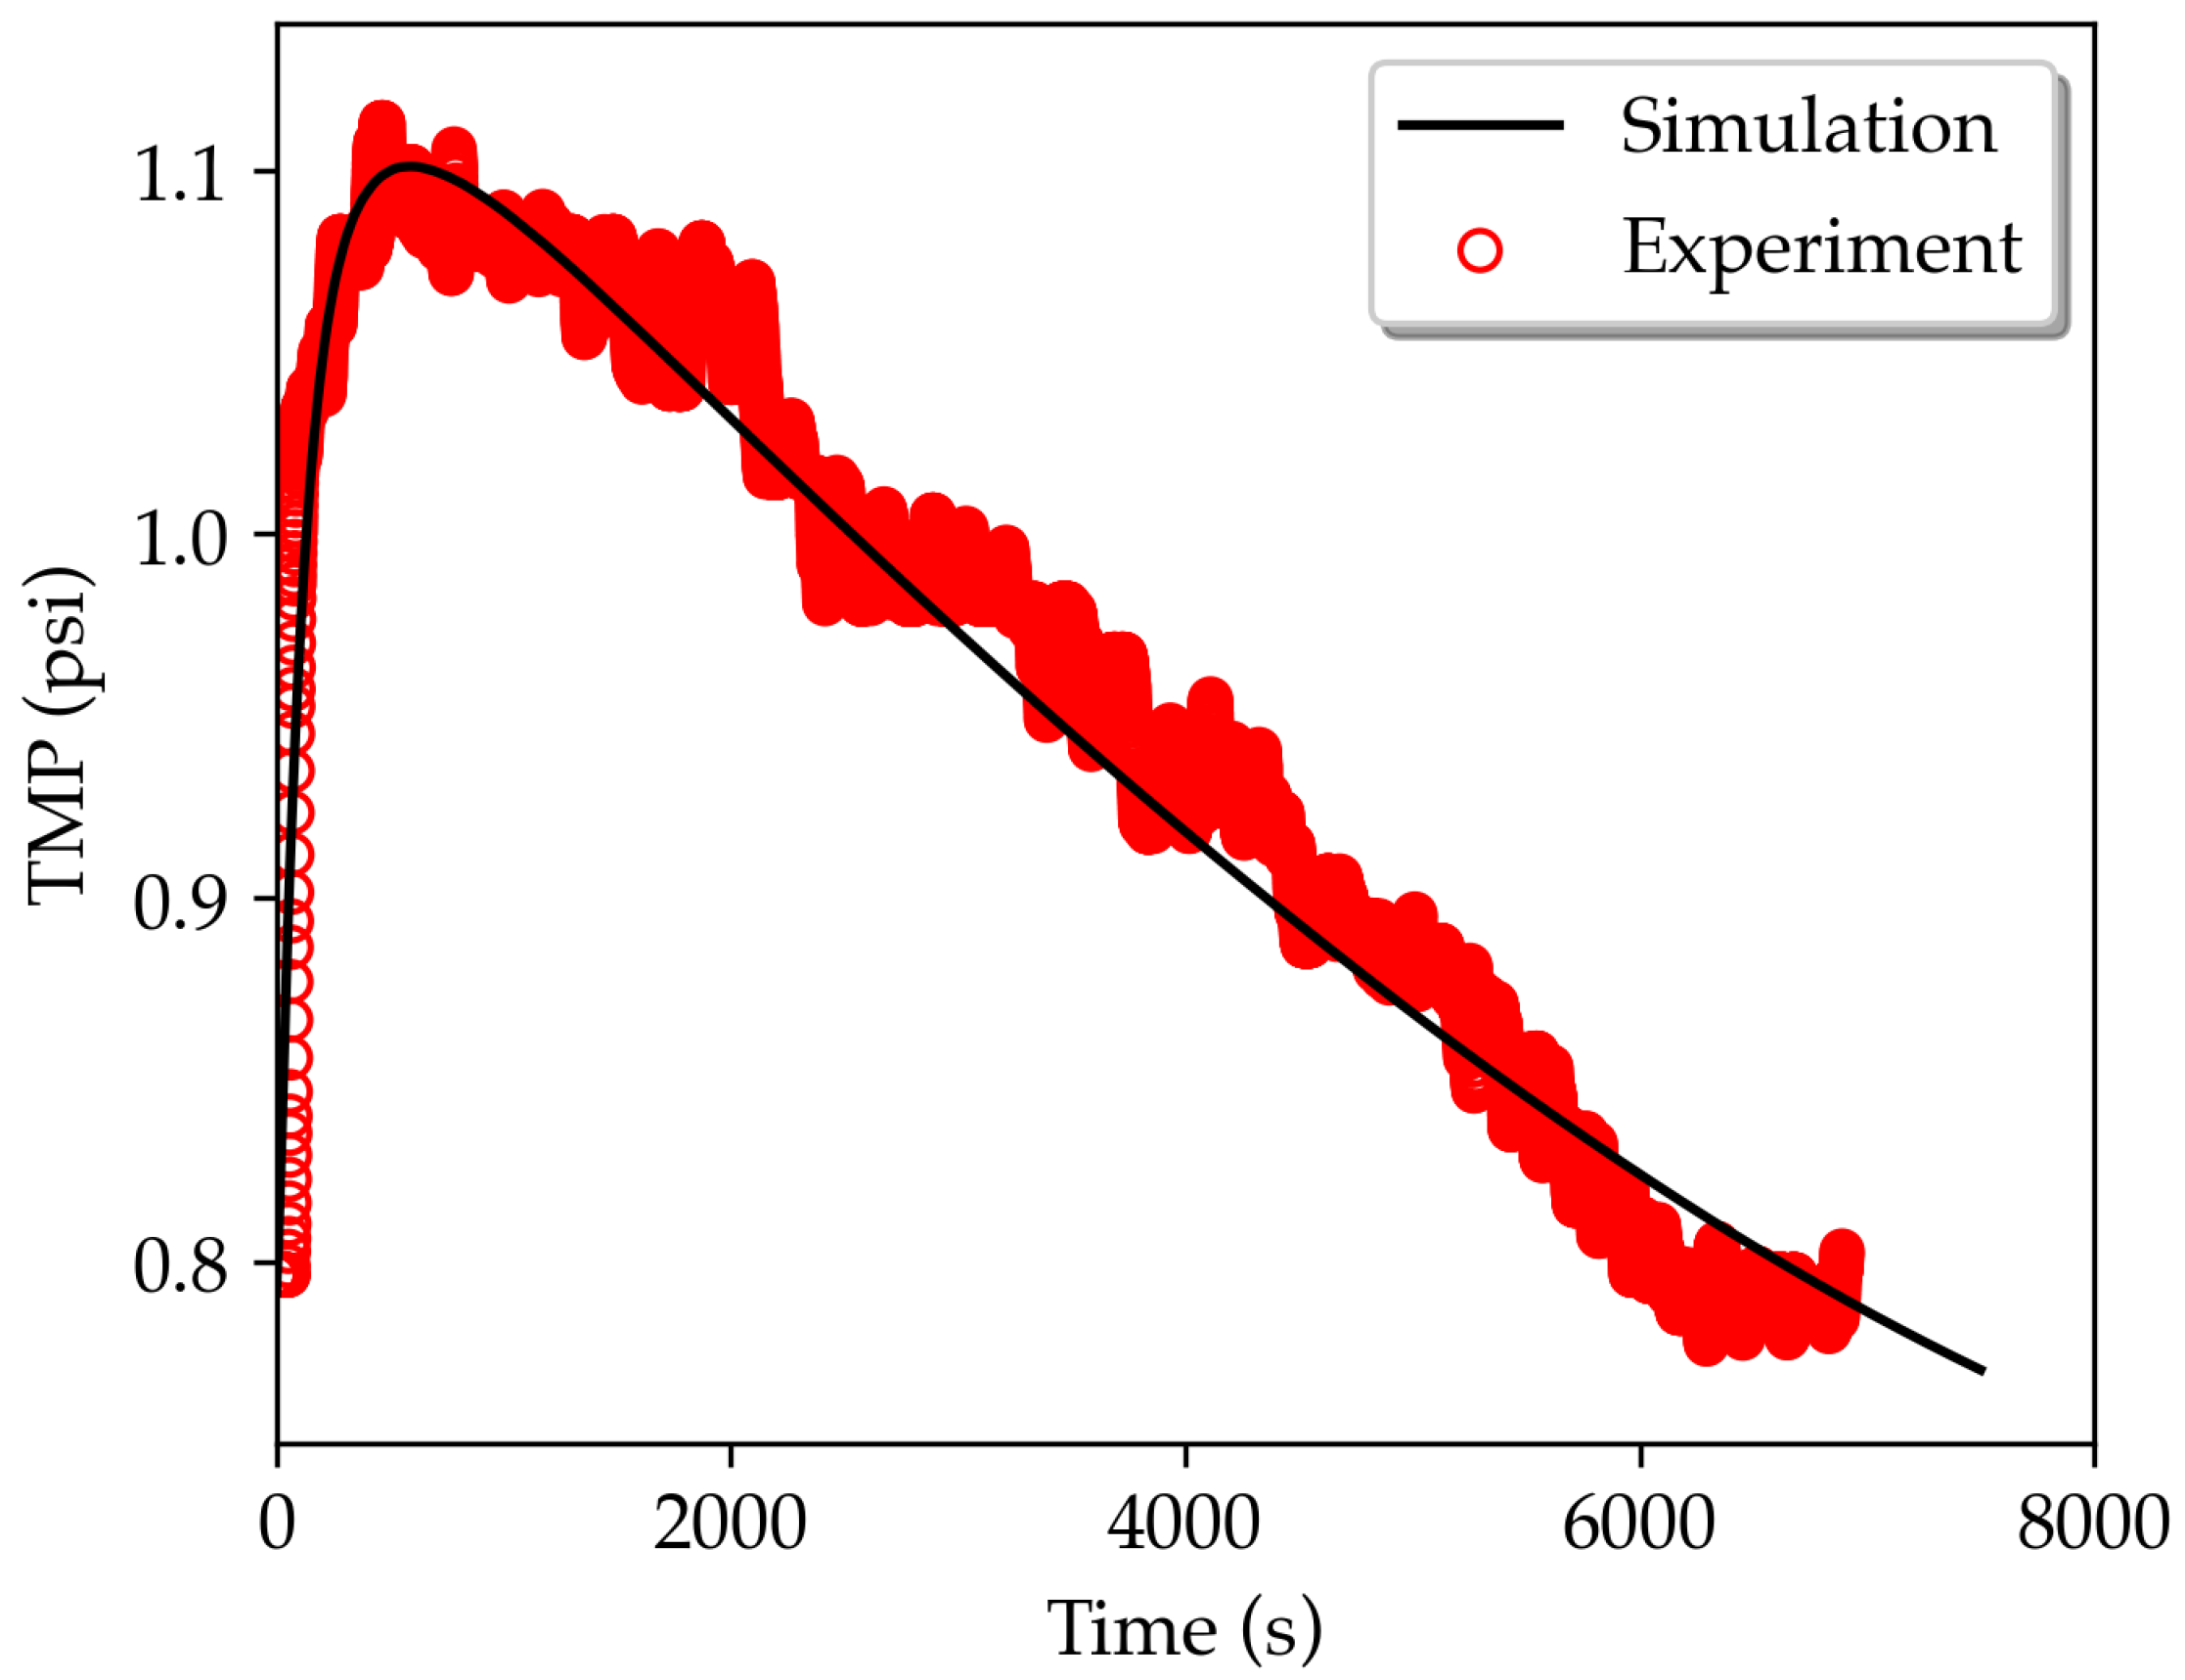
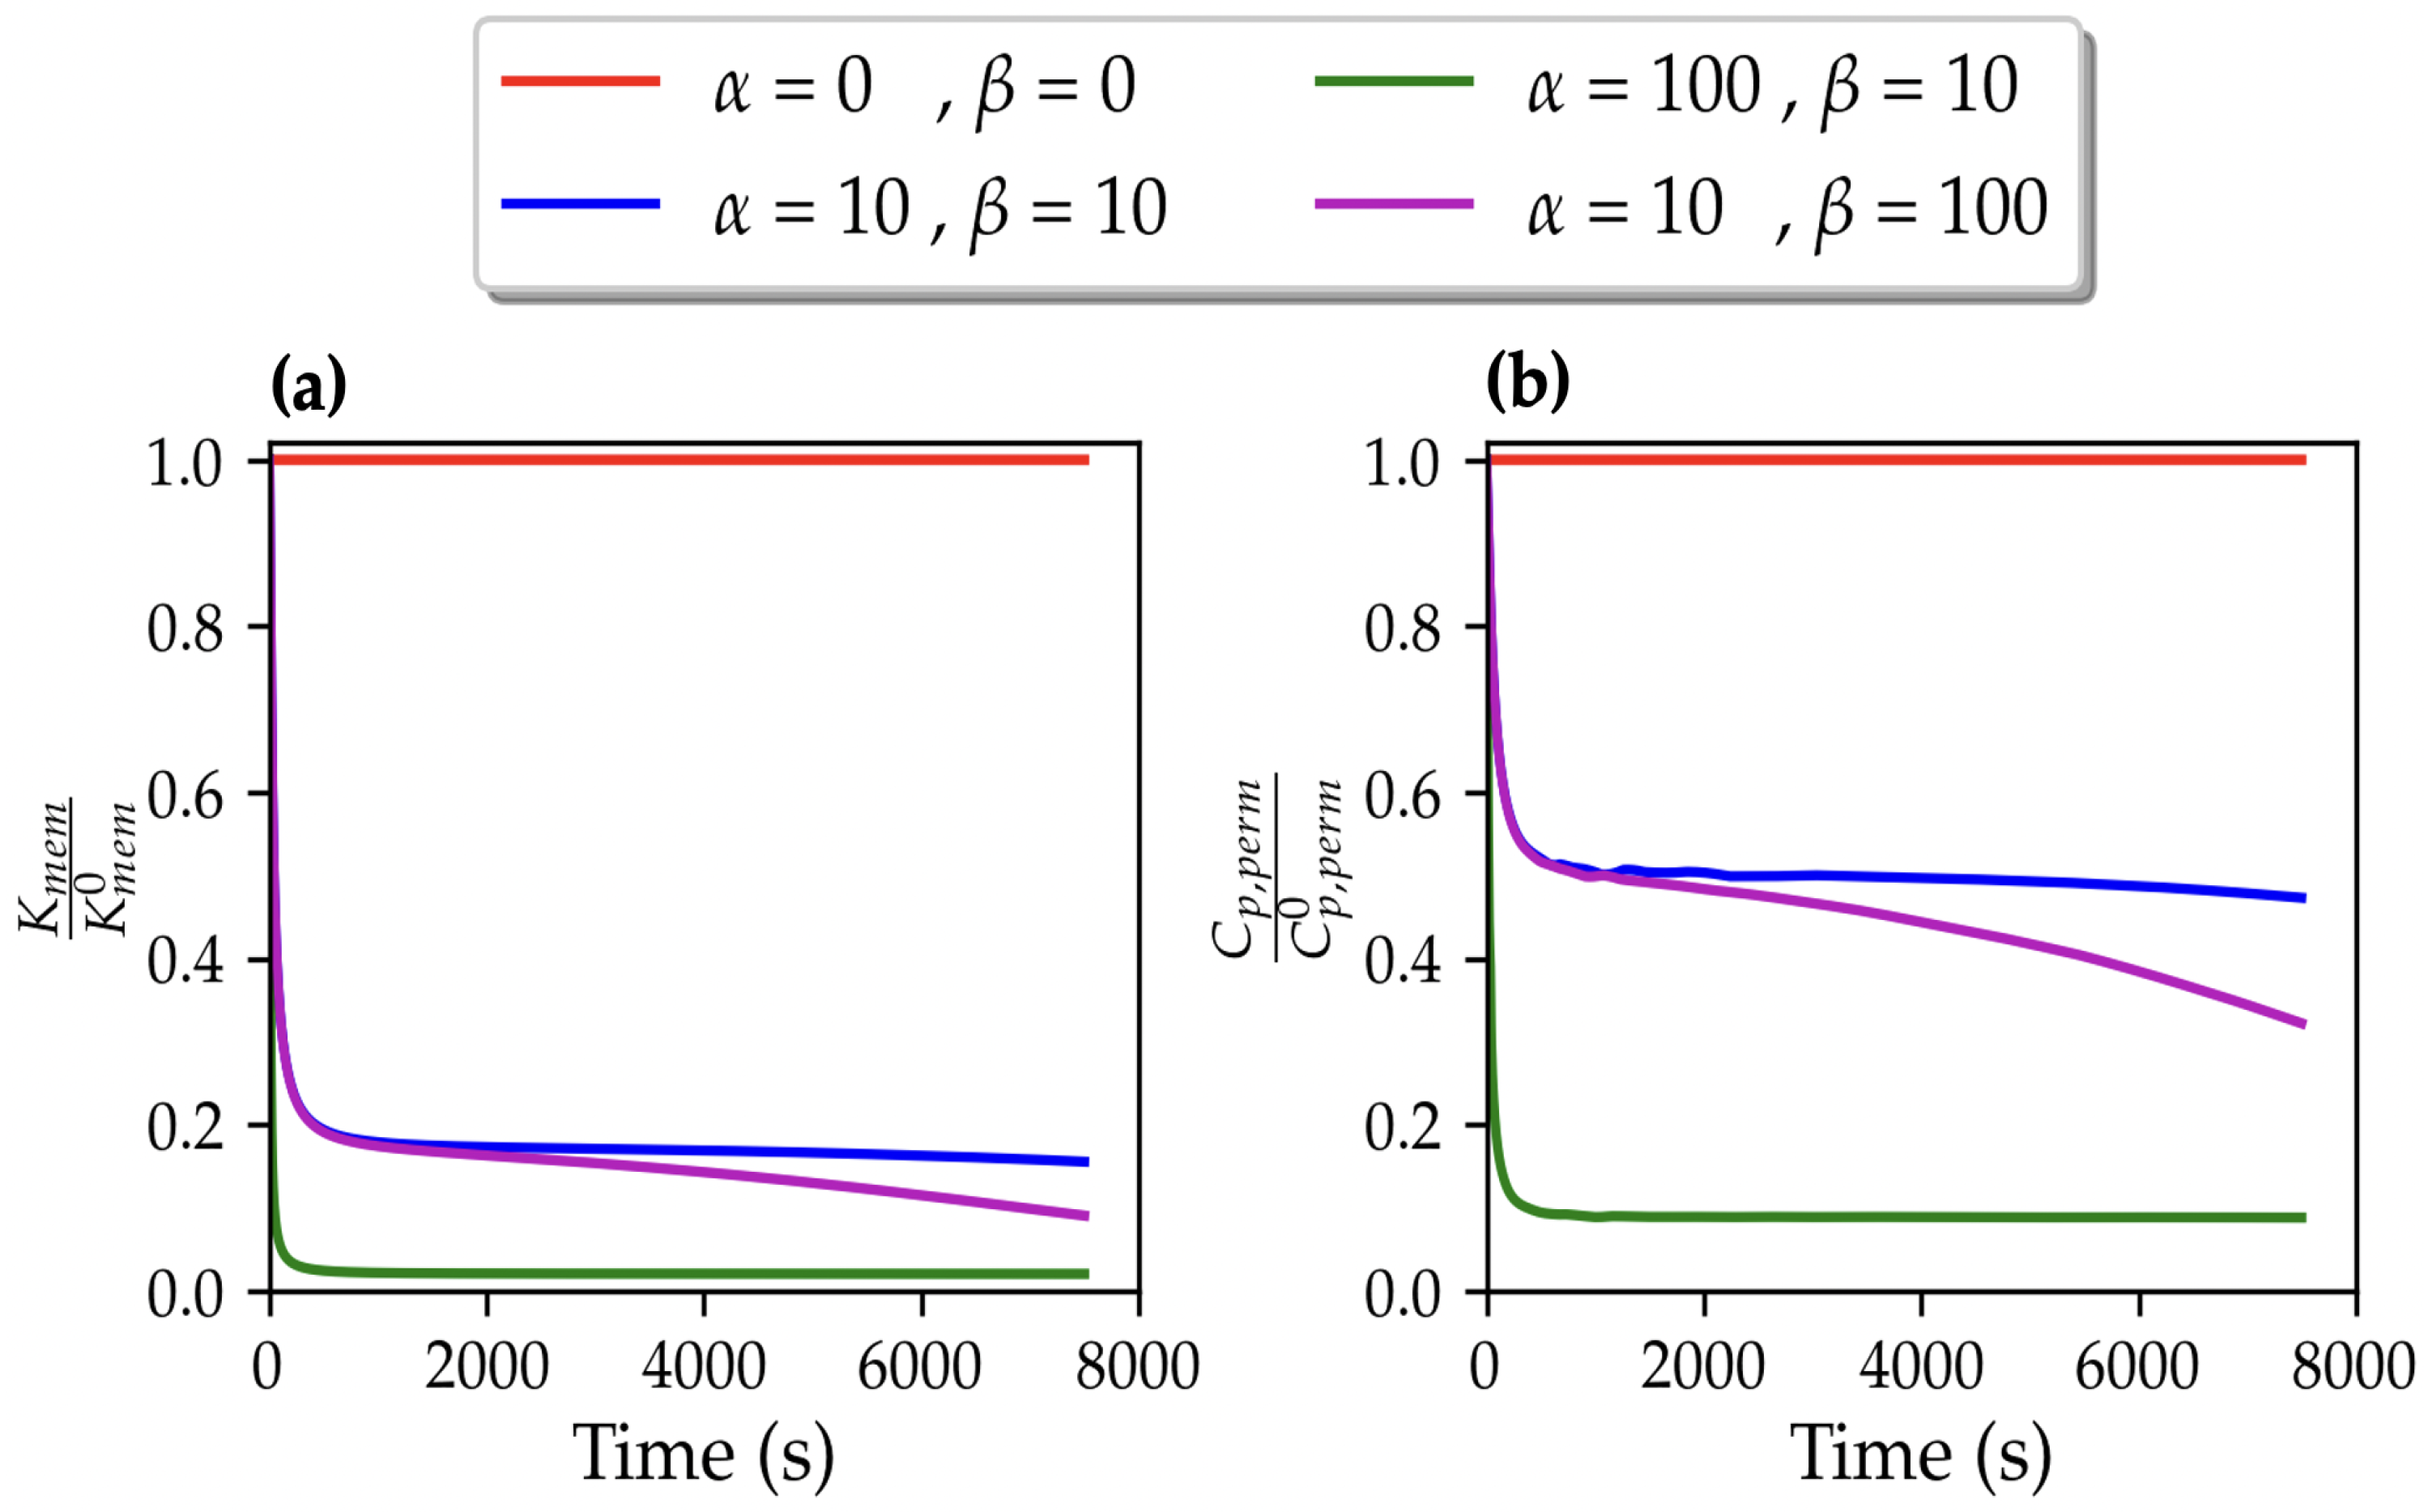
3.1. TMP Dynamics
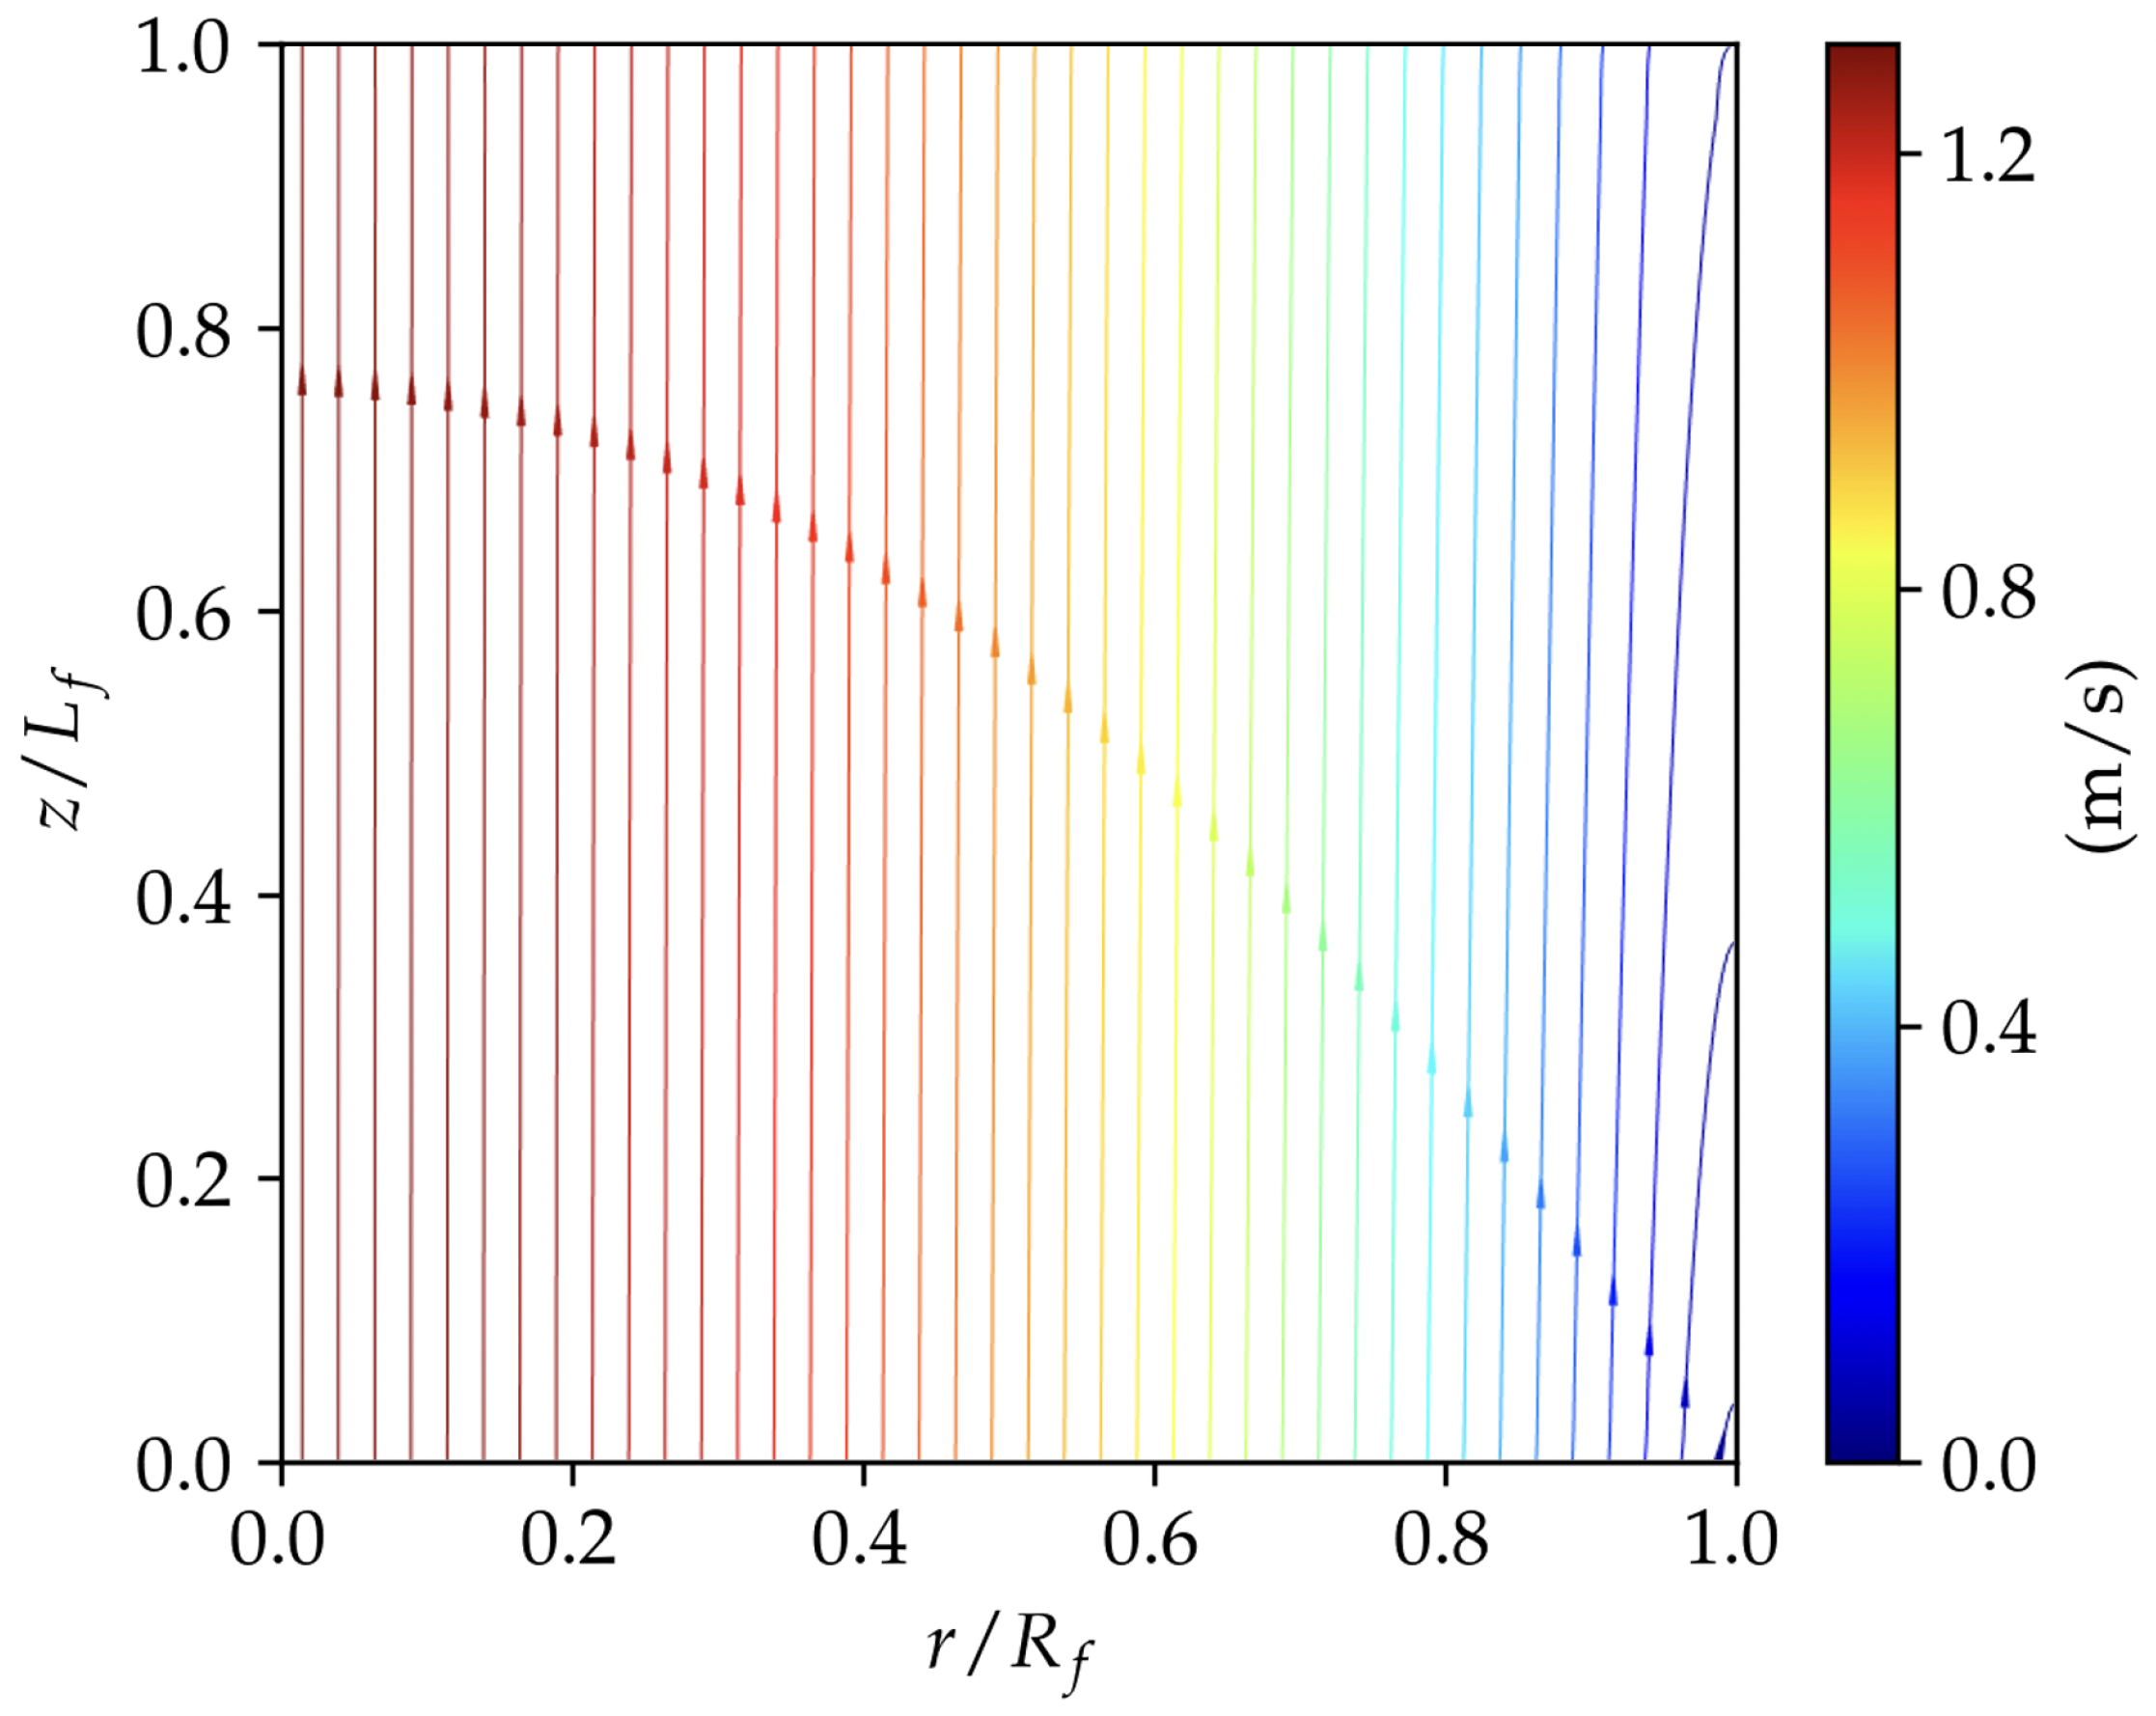
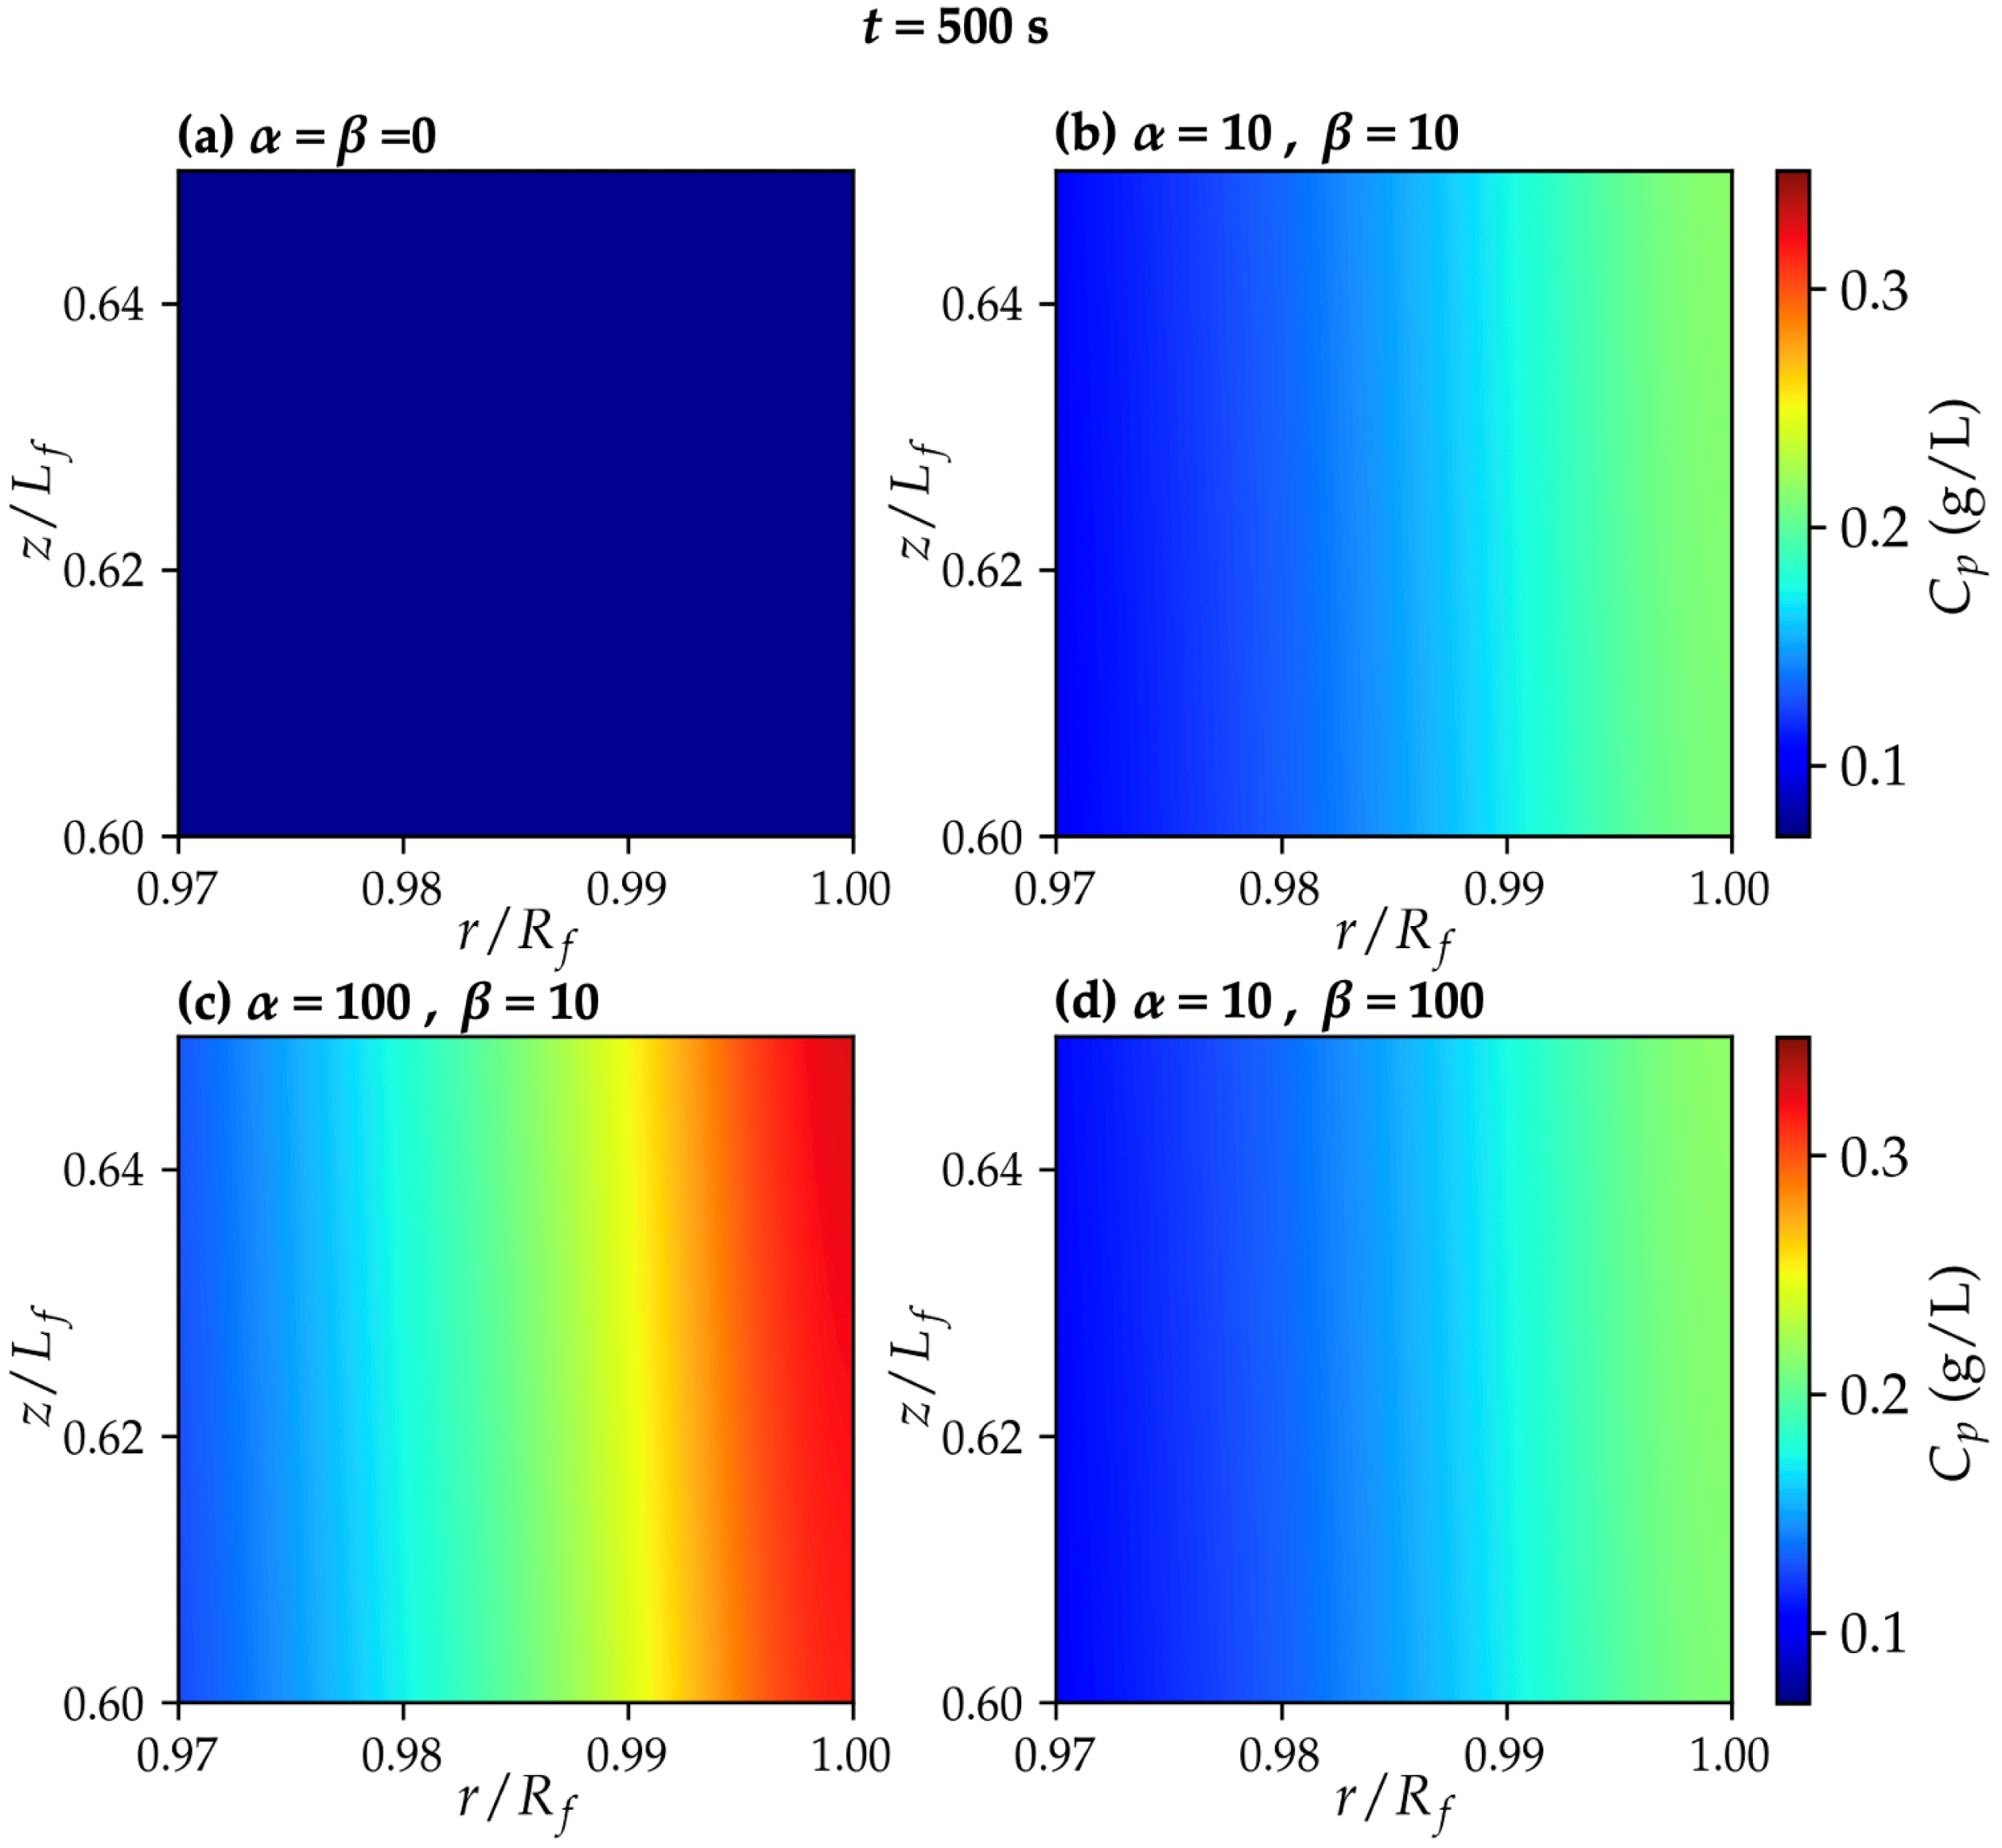
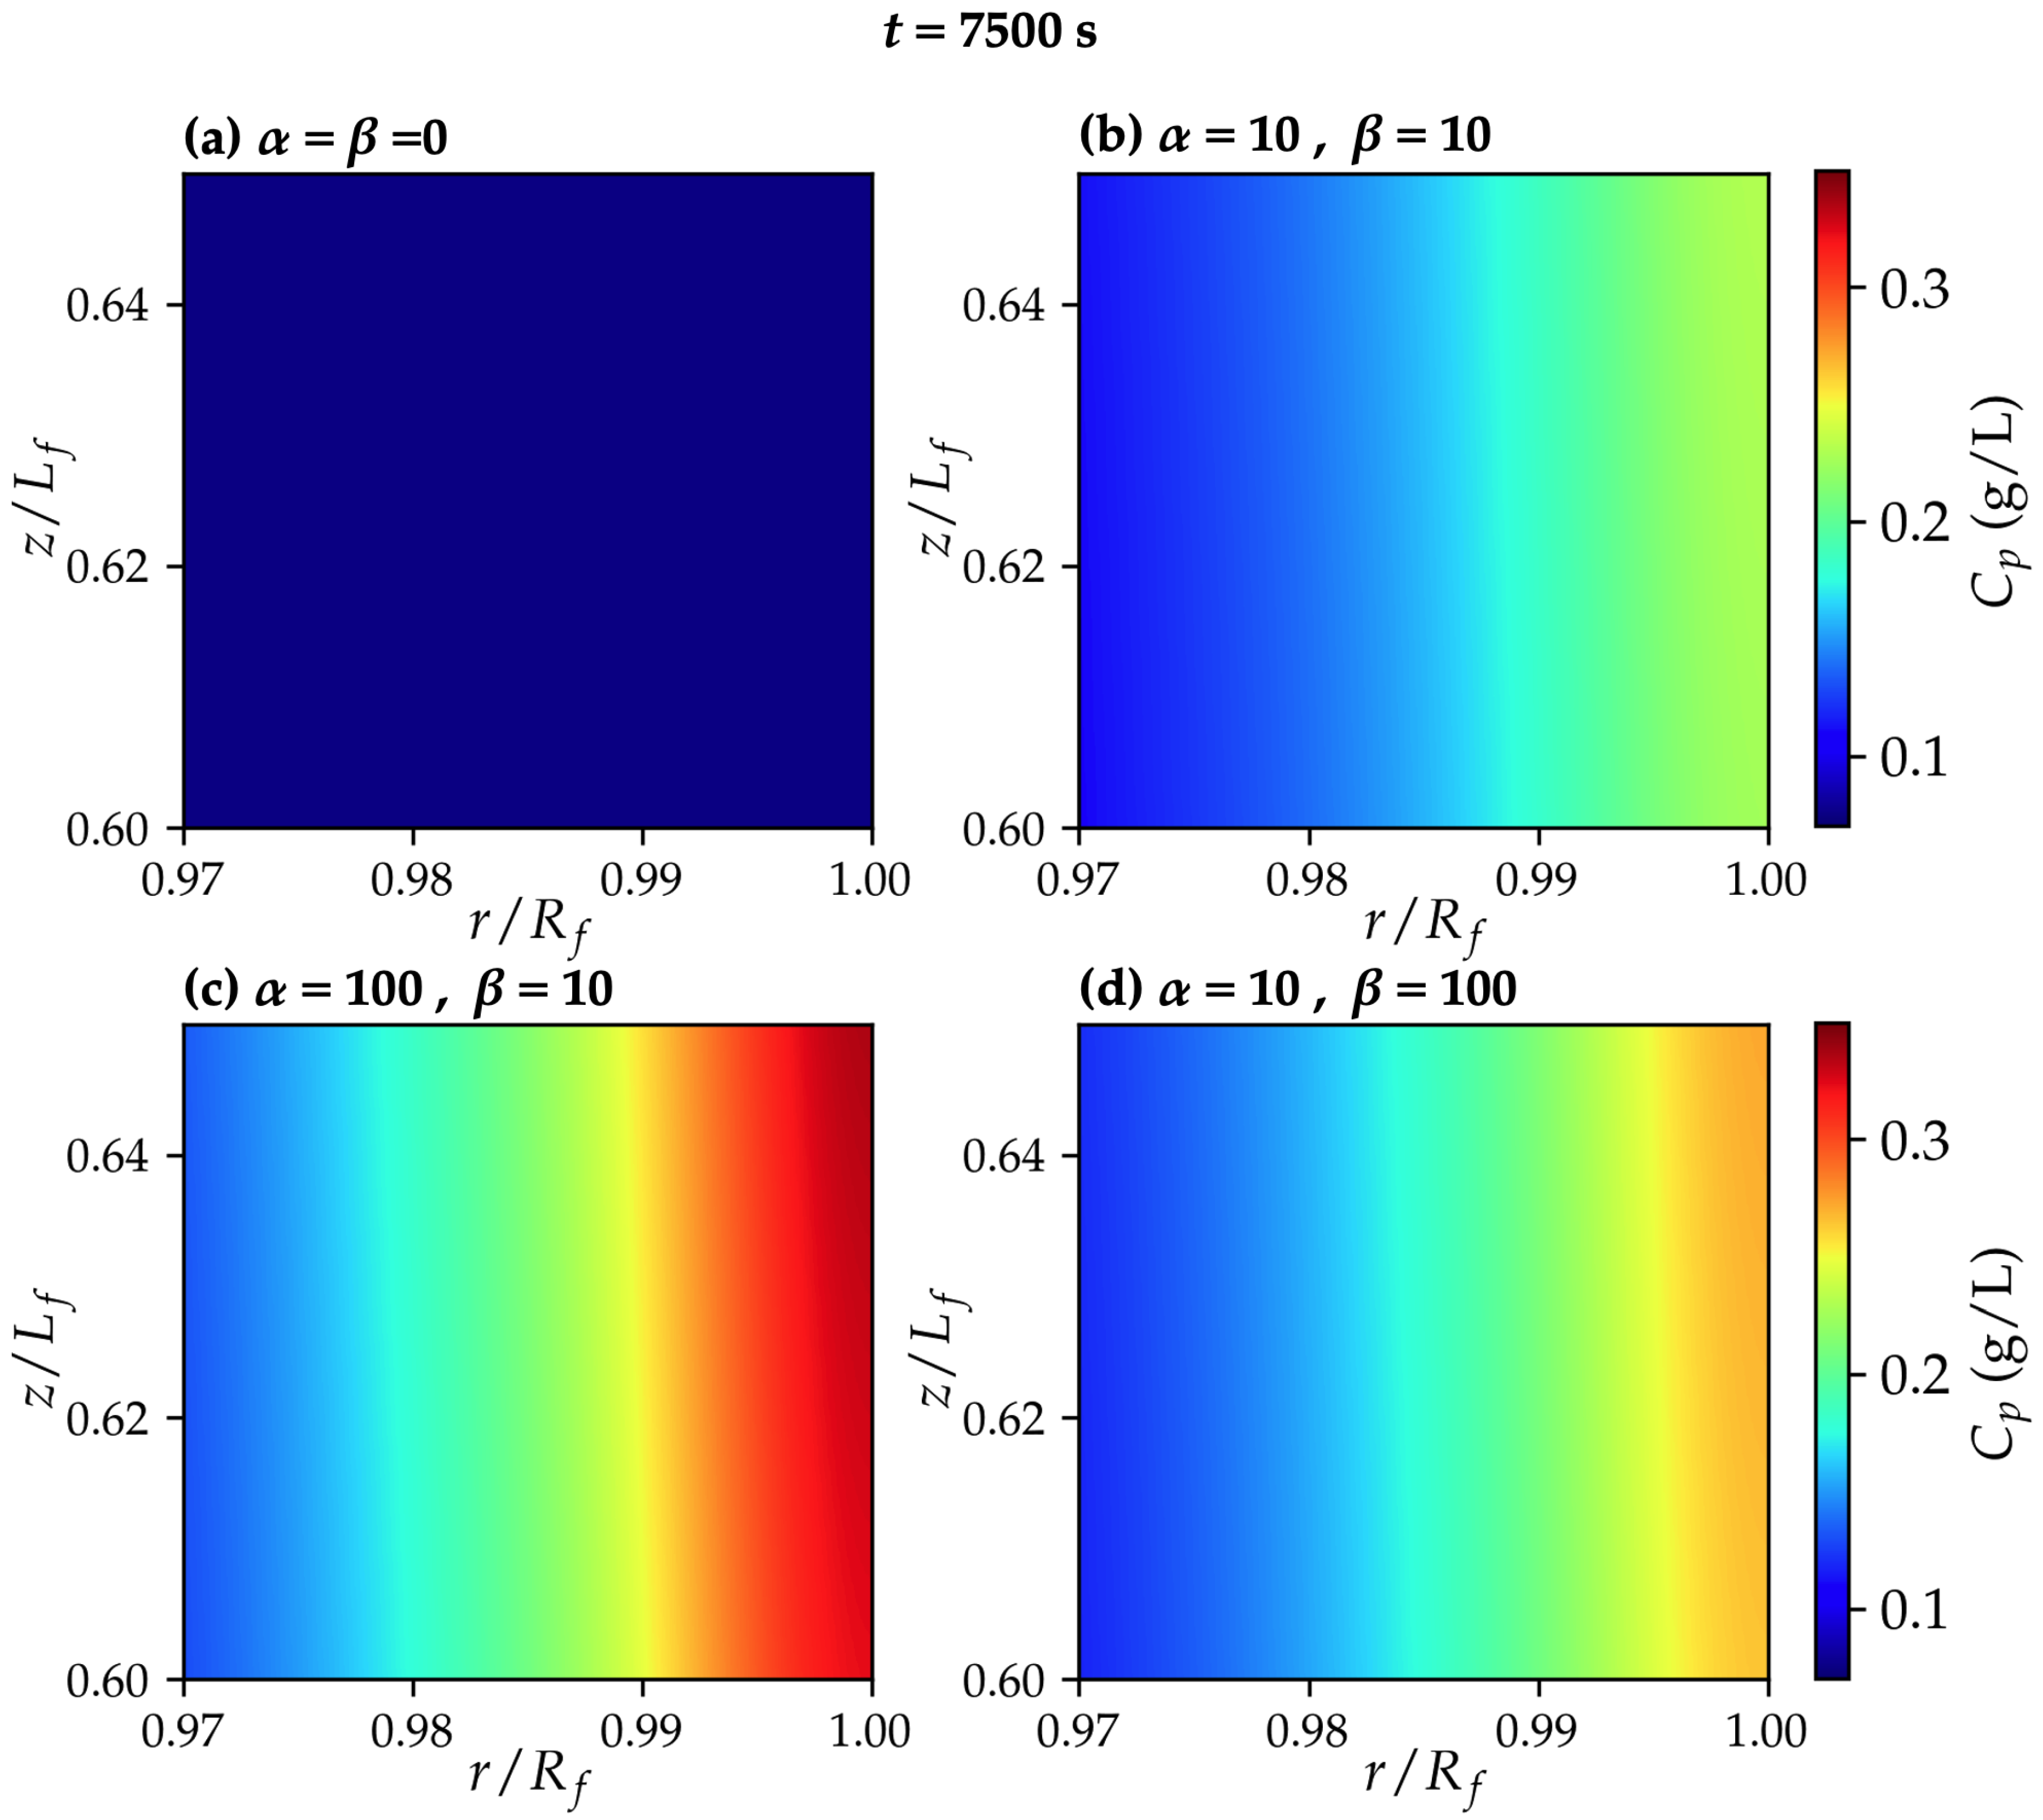
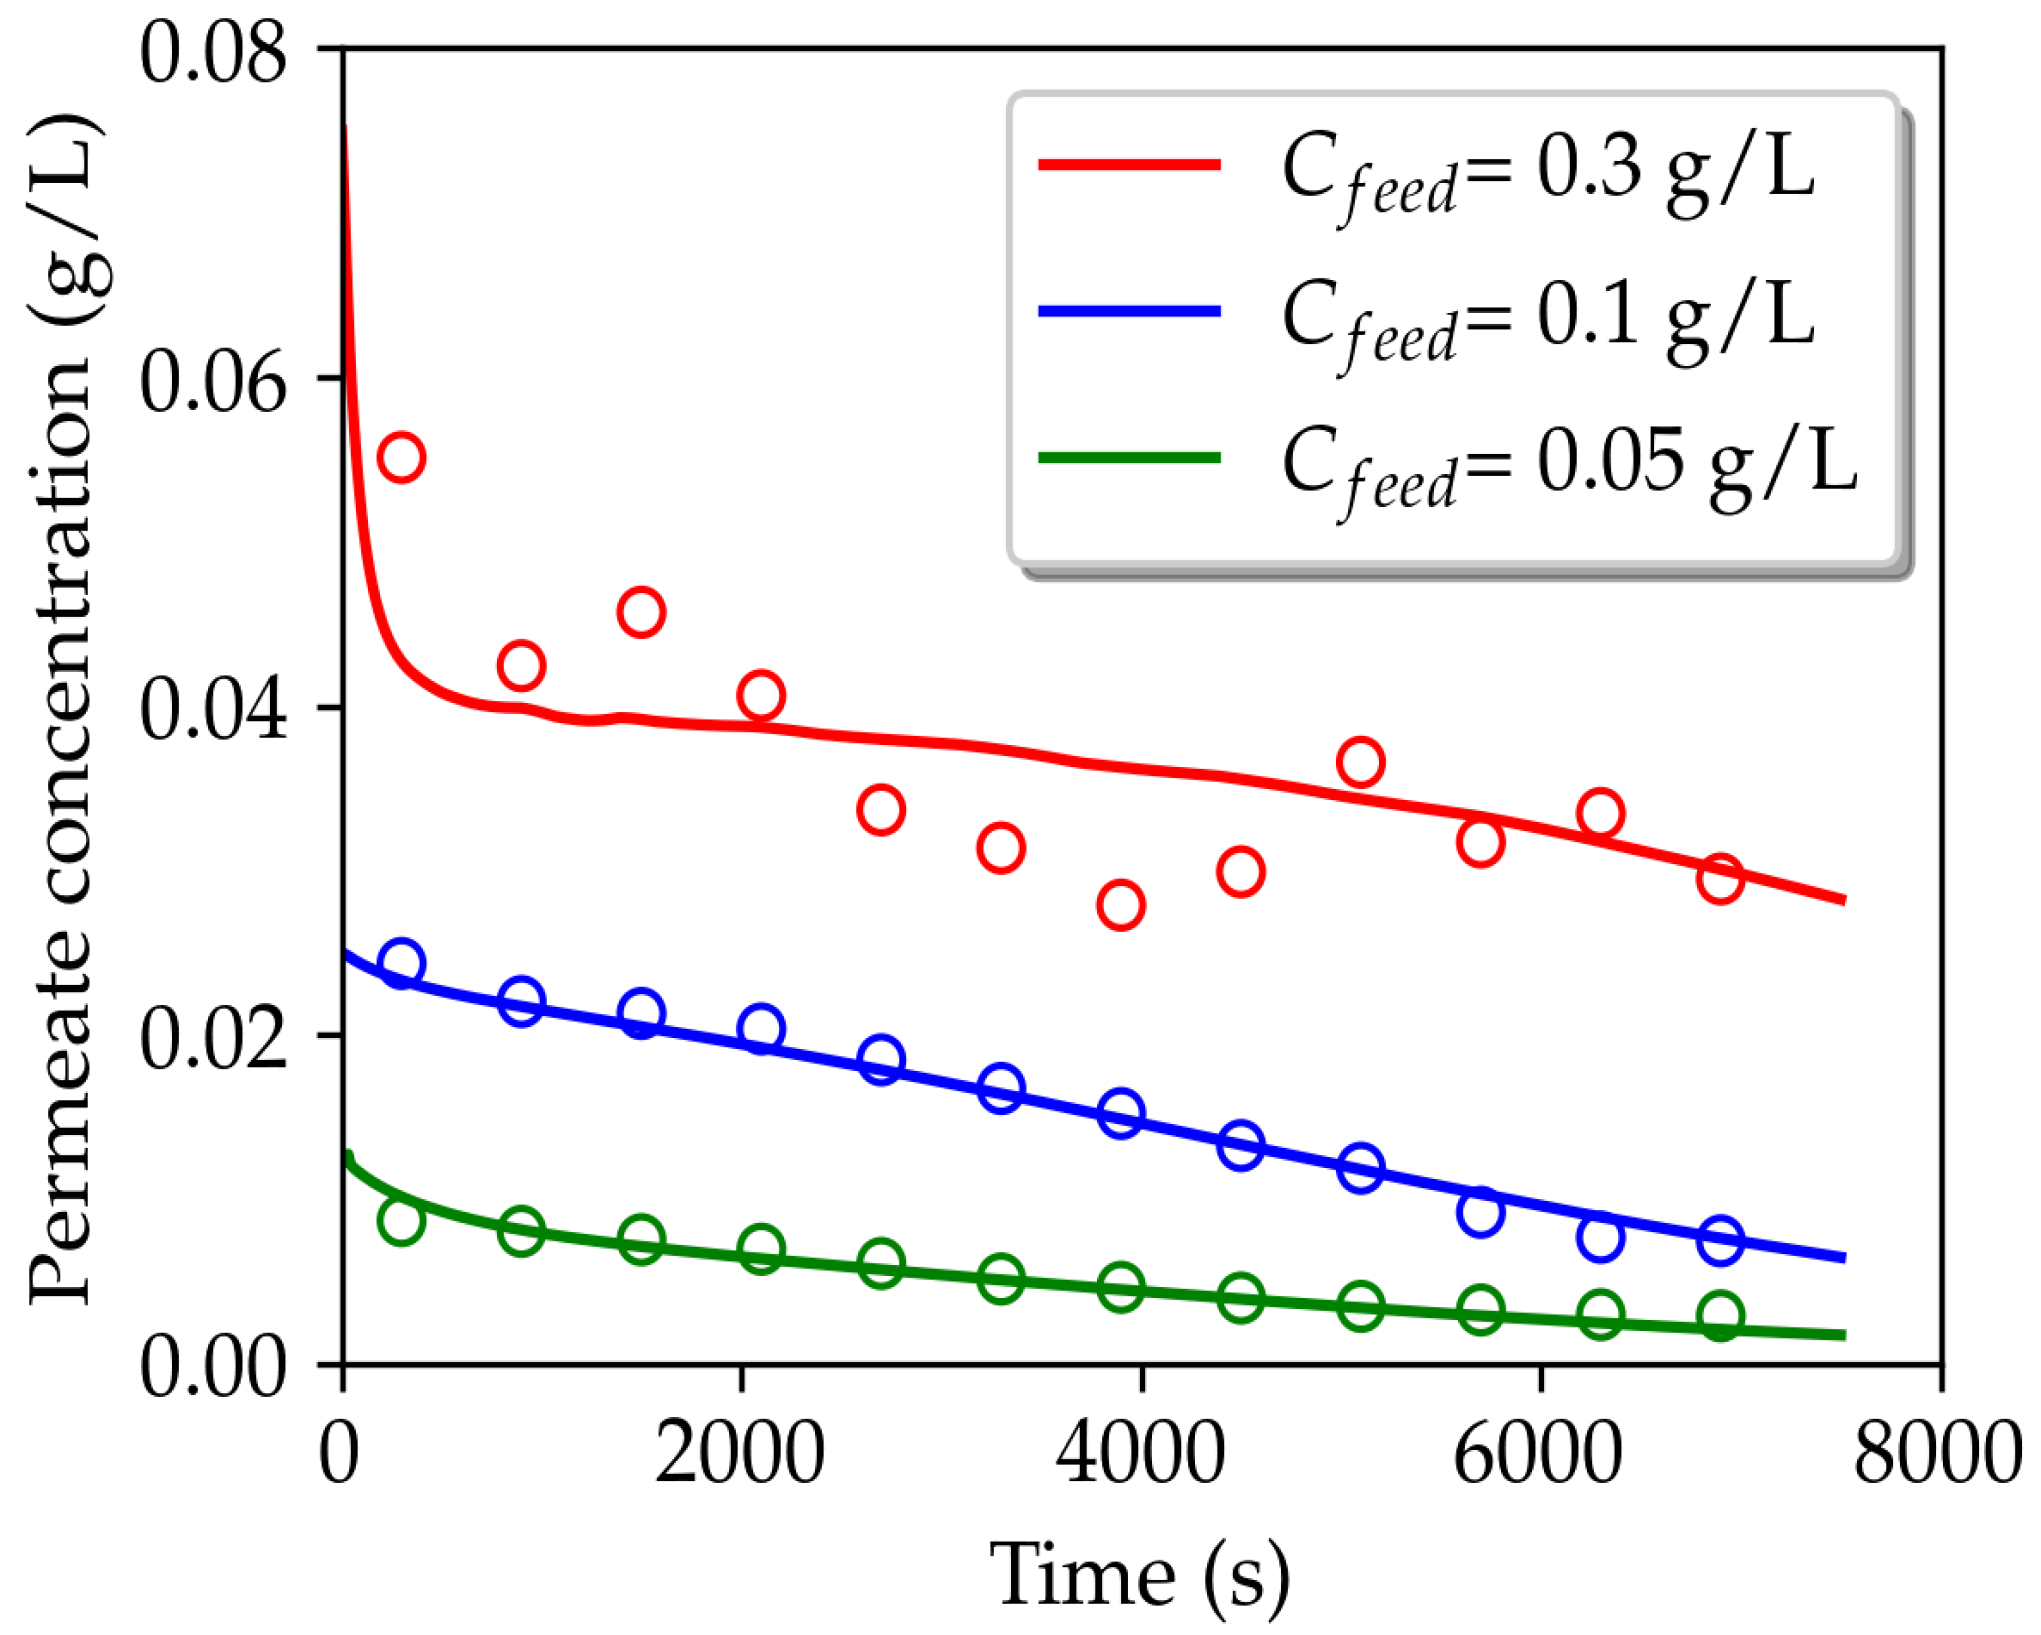
3.2. Permeating Particle Dynamics
4. Conclusions
Author Contributions
Funding
Data Availability Statement
Acknowledgments
Conflicts of Interest
Nomenclature
| symbols | |
| feed concentration of combined fouling and permeating particles (g/L) | |
| diameter of the fiber (m) | |
| fouling solute concentration (g/L) | |
| permeating solute concentration (g/L) | |
| permeating solute concentration at the permeate stream (g/L) | |
| permeating solute concentration at the permeate stream (g/L) at the initial time step | |
| diffusion coefficient of fouling particle (m/s) | |
| diffusion coefficient of permeating particle (m/s) | |
| mass flux of permeating particles through the membrane (g/(m·s)) | |
| polarization time constant coefficient (s g/L) | |
| wettability effect time constant coefficient (s g/L) | |
| membrane partition coefficient | |
| membrane partition coefficient at the initial time step | |
| initial membrane partition coefficient | |
| length of the fiber (m) | |
| inlet hollow fiber pressure (Pa) | |
| retentate pressure (Pa) | |
| permeate pressure (Pa) | |
| number of fibers | |
| inlet flow rate (m/s) | |
| experimentally set permeate flow rate (m/s) | |
| radius of the fiber (m) | |
| steady-state cake formation resistance (m) | |
| clean membrane resistance (m) | |
| steady-state polarization resistance (m) | |
| steady state wettability effect on reducing the resistance(m) | |
| Reynolds number (dimensionless) | |
| u | fluid velocity in the r-direction of the domain (m/s) |
| u | fluid velocity in the z-direction of the domain (m/s) |
| permeate velocity (m/s) | |
| inlet mean velocity (m/s) | |
| Greek letters | |
| dimensionless parameter in the partition coefficient, Equation (15) | |
| dimensionless parameter in the partition coefficient, Equation (15) | |
| dynamic viscosity of the fluid (Pa · s) | |
| density of the fluid (kg/m) | |
| polarization time constant (s) | |
| cake formation time constant (s) | |
| wettability effect time constant (s) |
References
- Zhao, S.; Zou, L.; Tang, C.Y.; Mulcahy, D. Recent developments in forward osmosis: Opportunities and challenges. J. Membr. Sci. 2012, 396, 1–21. [Google Scholar] [CrossRef]
- Wang, P.; Chung, T.S. Recent advances in membrane distillation processes: Membrane development, configuration design and application exploring. J. Membr. Sci. 2015, 474, 39–56. [Google Scholar] [CrossRef]
- Bera, S.P.; Godhaniya, M.; Kothari, C. Emerging and advanced membrane technology for wastewater treatment: A review. J. Basic Microbiol. 2022, 62, 245–259. [Google Scholar] [CrossRef] [PubMed]
- Lasseuguette, E.; Comesaña-Gándara, B. Polymer Membranes for Gas Separation. Membranes 2022, 12, 207. [Google Scholar] [CrossRef]
- Dai, Y.; Niu, Z.; Luo, W.; Wang, Y.; Mu, P.; Li, J. A review on the recent advances in composite membranes for CO2 capture processes. Sep. Purif. Technol. 2023, 307, 122752. [Google Scholar] [CrossRef]
- Nazir, A.; Khan, K.; Maan, A.; Zia, R.; Giorno, L.; Schroën, K. Membrane separation technology for the recovery of nutraceuticals from food industrial streams. Trends Food Sci. Technol. 2019, 86, 426–438. [Google Scholar] [CrossRef]
- Conidi, C.; Castro-Muñoz, R.; Cassano, A. Membrane-based operations in the fruit juice processing industry: A review. Beverages 2020, 6, 18. [Google Scholar] [CrossRef]
- Reig, M.; Vecino, X.; Cortina, J.L. Use of membrane technologies in dairy industry: An overview. Foods 2021, 10, 2768. [Google Scholar] [CrossRef] [PubMed]
- Hooshyar, S.; Yoshikawa, H.N.; Mirbod, P. The impact of imposed Couette flow on the stability of pressure-driven flows over porous surfaces. J. Eng. Math. 2022, 132, 15. [Google Scholar] [CrossRef]
- Lin, H.; Gao, W.; Meng, F.; Liao, B.Q.; Leung, K.T.; Zhao, L.; Chen, J.; Hong, H. Membrane bioreactors for industrial wastewater treatment: A critical review. Crit. Rev. Environ. Sci. Technol. 2012, 42, 677–740. [Google Scholar] [CrossRef]
- Vanneste, J.; Ormerod, D.; Theys, G.; Gool, D.V.; Camp, B.V.; Darvishmanesh, S.; der Bruggen, B.V. Towards high resolution membrane-based pharmaceutical separations. J. Chem. Technol. Biotechnol. 2013, 88, 98–108. [Google Scholar] [CrossRef]
- Rana, D.; Matsuura, T. Surface modifications for antifouling membranes. Chem. Rev. 2010, 110, 2448–2471. [Google Scholar] [CrossRef]
- Wang, Y.N.; Tang, C.Y. Nanofiltration membrane fouling by oppositely charged macromolecules: Investigation on flux behavior, foulant mass deposition, and solute rejection. Environ. Sci. Technol. 2011, 45, 8941–8947. [Google Scholar] [CrossRef]
- Nthunya, L.N.; Bopape, M.F.; Mahlangu, O.T.; Mamba, B.B.; der Bruggen, B.V.; Quist-Jensen, C.A.; Richards, H. Fouling, performance and cost analysis of membrane-based water desalination technologies: A critical review. J. Environ. Manag. 2022, 301, 113922. [Google Scholar] [CrossRef]
- Kovacs, D.J.; Li, Z.; Baetz, B.W.; Hong, Y.; Donnaz, S.; Zhao, X.; Zhou, P.; Ding, H.; Dong, Q. Membrane fouling prediction and uncertainty analysis using machine learning: A wastewater treatment plant case study. J. Membr. Sci. 2022, 660, 120817. [Google Scholar] [CrossRef]
- Pervez, M.N.; Mishu, M.R.; Stylios, G.K.; Hasan, S.W.; Zhao, Y.; Cai, Y.; Zarra, T.; Belgiorno, V.; Naddeo, V. Sustainable treatment of food industry wastewater using membrane technology: A short review. Water 2021, 13, 3450. [Google Scholar] [CrossRef]
- Zaman, N.K.; Rohani, R.; Mohammad, A.W.; Isloor, A.M.; Jahim, J.M. Investigation of succinic acid recovery from aqueous solution and fermentation broth using polyimide nanofiltration membrane. J. Environ. Chem. Eng. 2020, 8, 101895. [Google Scholar] [CrossRef]
- He, Y.; Bagley, D.M.; Leung, K.T.; Liss, S.N.; Liao, B.Q. Recent advances in membrane technologies for biorefining and bioenergy production. Biotechnol. Adv. 2012, 30, 817–858. [Google Scholar] [CrossRef]
- Downing, J.R.; Diaz-Arauzo, S.; Chaney, L.E.; Tsai, D.; Hui, J.; Seo, J.W.T.; Cohen, D.R.; Dango, M.; Zhang, J.; Williams, N.X.; et al. Centrifuge-Free Separation of Solution-Exfoliated 2D Nanosheets via Cross-Flow Filtration. Adv. Mater. 2023, 35, e2212042. [Google Scholar] [CrossRef]
- Rajabzadeh, A.R. Membrane Fouling During Hollow Fiber Ultrafiltration of Protein Solutions: Computational Fluid Modeling and Physicochemical Properties. Ph.D. Thesis, University of Waterloo, Waterloo, ON, Canada, 2010. [Google Scholar]
- Quezada, C.; Estay, H.; Cassano, A.; Troncoso, E.; Ruby-Figueroa, R. Prediction of permeate flux in ultrafiltration processes: A review of modeling approaches. Membranes 2021, 11, 368. [Google Scholar] [CrossRef]
- Kumar, N.S.K.; Yea, M.K.; Cheryan, M. Ultrafiltration of soy protein concentrate: Performance and modelling of spiral and tubular polymeric modules. J. Membr. Sci. 2004, 244, 235–242. [Google Scholar] [CrossRef]
- Marcos, B.; Moresoli, C.; Skorepova, J.; Vaughan, B. CFD modeling of a transient hollow fiber ultrafiltration system for protein concentration. J. Membr. Sci. 2009, 337, 136–144. [Google Scholar] [CrossRef]
- Das, B.; Bhattacharjee, S.; Bhattacharjee, C. Recovery of Whey Proteins and Enzymatic Hydrolysis of Lactose Derived from Casein Whey Using a Tangential Flow Ultrafiltration Module. J. Inst. Eng. (India) Ser. E 2013, 94, 79–84. [Google Scholar] [CrossRef]
- Mondal, M.; De, S. Purification of Polyphenols from Green Tea Leaves and Performance Prediction Using the Blend Hollow Fiber Ultrafiltration Membrane. Food Bioprocess Technol. 2019, 12, 933–953. [Google Scholar] [CrossRef]
- Hosseini, M.K.; Liu, L.; Hosseini, P.K.; Lee, K.; Miao, J. Performance evaluation of a pilot-scale membrane filtration system for oily wastewater treatment: CFD modeling and scale-up design. J. Water Process. Eng. 2023, 52, 103570. [Google Scholar] [CrossRef]
- Straub, A.P.; Bergsman, D.S.; Getachew, B.A.; Leahy, L.M.; Patil, J.J.; Ferralis, N.; Grossman, J.C. Highly Conductive and Permeable Nanocomposite Ultrafiltration Membranes Using Laser-Reduced Graphene Oxide. Nano Lett. 2021, 21, 2429–2435. [Google Scholar] [CrossRef] [PubMed]
- Ding, A.; Ren, Z.; Zhang, Y.; Ma, J.; Bai, L.; Wang, B.; Cheng, X. Evaluations of holey graphene oxide modified ultrafiltration membrane and the performance for water purification. Chemosphere 2021, 285, 131459. [Google Scholar] [CrossRef]
- Kumar, M.; Sreedhar, N.; Thomas, N.; Mavukkandy, M.; Ismail, R.A.; Aminabhavi, T.M.; Arafat, H.A. Polydopamine-coated graphene oxide nanosheets embedded in sulfonated poly(ether sulfone) hybrid UF membranes with superior antifouling properties for water treatment. Chem. Eng. J. 2022, 433, 133526. [Google Scholar] [CrossRef]
- Likhi, F.H.; Singh, M.; Chavan, S.V.; Cao, T.; Shanbedi, M.; Karim, A. Effects of Film Confinement on Dielectric and Electrical Properties of Graphene Oxide and Reduced Graphene Oxide-Based Polymer Nanocomposites: Implications for Energy Storage. ACS Appl. Nano Mater. 2023, 6, 11699–11714. [Google Scholar] [CrossRef]
- Choi, W.; Choi, J.; Bang, J.; Lee, J.H. Layer-by-layer assembly of graphene oxide nanosheets on polyamide membranes for durable reverse-osmosis applications. ACS Appl. Mater. Interfaces 2013, 5, 12510–12519. [Google Scholar] [CrossRef]
- Lee, J.; Chae, H.R.; Won, Y.J.; Lee, K.; Lee, C.H.; Lee, H.H.; Kim, I.C.; Lee, J.-m. Graphene oxide nanoplatelets composite membrane with hydrophilic and antifouling properties for wastewater treatment. J. Membr. Sci. 2013, 448, 223–230. [Google Scholar] [CrossRef]
- Miao, W.; Li, Z.K.; Yan, X.; Guo, Y.J.; Lang, W.Z. Improved ultrafiltration performance and chlorine resistance of PVDF hollow fiber membranes via doping with sulfonated graphene oxide. Chem. Eng. J. 2017, 317, 901–912. [Google Scholar] [CrossRef]
- Yu, C.; Song, Y.S. Enhancing energy harvesting efficiency of form stable phase change materials by decreasing surface roughness. J. Energy Storage 2023, 58, 106360. [Google Scholar] [CrossRef]
- Lundgren, M.; Allan, N.L.; Cosgrove, T.; George, N. Wetting of water and water/ethanol droplets on a non-polar surface: A molecular dynamics study. Langmuir 2002, 18, 10462–10466. [Google Scholar] [CrossRef]
- Metya, A.K.; Khan, S.; Singh, J.K. Wetting transition of the ethanol-water droplet on smooth and textured surfaces. J. Phys. Chem. C 2014, 118, 4113–4121. [Google Scholar] [CrossRef]
- Fang, H.H.; Shi, X. Pore fouling of microfiltration membranes by activated sludge. J. Membr. Sci. 2005, 264, 161–166. [Google Scholar] [CrossRef]
- Yi, Z.; Zhu, L.P.; Xu, Y.Y.; Zhao, Y.F.; Ma, X.T.; Zhu, B.K. Polysulfone-based amphiphilic polymer for hydrophilicity and fouling-resistant modification of polyethersulfone membranes. J. Membr. Sci. 2010, 365, 25–33. [Google Scholar] [CrossRef]
- Li, X.; Li, J.; Wang, J.; Wang, H.; He, B.; Zhang, H.; Guo, W.; Ngo, H.H. Experimental investigation of local flux distribution and fouling behavior in double-end and dead-end submerged hollow fiber membrane modules. J. Membr. Sci. 2014, 453, 18–26. [Google Scholar] [CrossRef]
- Gonalves, F.A.; Trindade, A.R.; Costa, C.S.; Bernardo, J.C.; Johnson, I.; Fonseca, I.M.; Ferreira, A.G. PVT, viscosity, and surface tension of ethanol: New measurements and literature data evaluation. J. Chem. Thermodyn. 2010, 42, 1039–1049. [Google Scholar] [CrossRef]


| System Parameters | Value | |
|---|---|---|
| Membrane properties | (mm) | 0.75 |
| (cm) | 33.7 | |
| 20 | ||
| Operating conditions | (mL/min) | 343 |
| (mL/min) | 5 | |
| (m/s) | 0.65 | |
| (m/s) | 5.5 × 10 | |
| Solute and solvent properties | (g/L) | 0.3 |
| (Pa·s) | 2 × 10 | |
| (kg/m) | 789 | |
| Resistance parameters | ||
| (s g/L) | 1000 | |
| (s g/L) | ||
| (s) | 2825 | |
| (g/L) | Total Permeate Concentration (g/L) | |||
|---|---|---|---|---|
| Simulation | Experiment [19] | |||
| 0.05 | 6 | 400 | 0.0050 | 0.0053 |
| 0.1 | 1 | 250 | 0.0151 | 0.0156 |
| 0.3 | 9 | 70 | 0.0363 | 0.0360 |
Disclaimer/Publisher’s Note: The statements, opinions and data contained in all publications are solely those of the individual author(s) and contributor(s) and not of MDPI and/or the editor(s). MDPI and/or the editor(s) disclaim responsibility for any injury to people or property resulting from any ideas, methods, instructions or products referred to in the content. |
© 2023 by the authors. Licensee MDPI, Basel, Switzerland. This article is an open access article distributed under the terms and conditions of the Creative Commons Attribution (CC BY) license (https://creativecommons.org/licenses/by/4.0/).
Share and Cite
Elahi, A.; Chaudhuri, S. Computational Fluid Dynamics Modeling of the Filtration of 2D Materials Using Hollow Fiber Membranes. ChemEngineering 2023, 7, 108. https://doi.org/10.3390/chemengineering7060108
Elahi A, Chaudhuri S. Computational Fluid Dynamics Modeling of the Filtration of 2D Materials Using Hollow Fiber Membranes. ChemEngineering. 2023; 7(6):108. https://doi.org/10.3390/chemengineering7060108
Chicago/Turabian StyleElahi, Arash, and Santanu Chaudhuri. 2023. "Computational Fluid Dynamics Modeling of the Filtration of 2D Materials Using Hollow Fiber Membranes" ChemEngineering 7, no. 6: 108. https://doi.org/10.3390/chemengineering7060108