Article

Numerical Study of Dry Reforming of Methane in Packed and Fluidized Beds: Effects of Key Operating Parameters

by
Fahad Al-Otaibi
1,2,
Hongliang Xiao
1,3,
Abdallah S. Berrouk
1,2,* and
Kyriaki Polychronopoulou
1,2
1
Department of Mechanical Engineering, Khalifa University of Science and Technology, Abu Dhabi P.O. Box 127788, United Arab Emirates
2
Center for Catalysis and Separation (CeCas), Khalifa University of Science and Technology, Abu Dhabi P.O. Box 127788, United Arab Emirates
3
College of Mechanical and Transportation Engineering, China University of Petroleum, Beijing 102249, China
*
Author to whom correspondence should be addressed.
ChemEngineering 2023, 7(3), 57; https://doi.org/10.3390/chemengineering7030057
Submission received: 28 October 2022 / Revised: 25 April 2023 / Accepted: 8 May 2023 / Published: 20 June 2023
(This article belongs to the Topic Chemical and Biochemical Processes for Energy Sources)

Abstract

:
Replacing the conventionally used steam reforming of methane (SRM) with a process that has a smaller carbon footprint, such as dry reforming of methane (DRM), has been found to greatly improve the industry’s utilization of greenhouse gases (GHGs). In this study, we numerically modeled a DRM process in lab-scale packed and fluidized beds using the Eulerian–Lagrangian approach. The simulation results agree well with the available experimental data. Based on these validated models, we investigated the effects of temperature, inlet composition, and contact spatial time on DRM in packed beds. The impacts of the side effects on the DRM process were also examined, particularly the role the methane decomposition reaction plays in coke formation at high temperatures. It was found that the coking amount reached thermodynamic equilibrium after 900 K. Additionally, the conversion rate in the fluidized bed was found to be slightly greater than that in the packed bed under the initial fluidization regime, and less coking was observed in the fluidized bed. The simulation results show that the adopted CFD approach was reliable for modeling complex flow and reaction phenomena at different scales and regimes.

1. Introduction

Carbon dioxide (CO2) reformation (also known as dry reformation) is a method of producing synthesis gas, a mixture of hydrogen (H2) and carbon monoxide (CO), from the reaction of carbon dioxide with hydrocarbons such as methane (CH4) [1,2]. Synthesis gas is conventionally produced via a steam reforming reaction. Alarming concerns have grown over the last several years on the global warming caused by the influence of greenhouse gases (GHGs) and there has been elevated interest in replacing the reactant steam with CO2 [3].
The most common commercial method and least expensive process for industrial hydrogen production is steam reforming of methane (SRM) [4]. Over 50% of the produced hydrogen comes from the SRM process. Despite its cost competitiveness and operational maturity, SRM still suffers from the drawback of producing high quantities of greenhouse gases (GHGs). As a result, many researchers and scientists have been investigating alternatives to SRM that can adequately address the challenging GHG emissions problem while maintaining the process’s functionality in the petroleum refining and petrochemical industries.
In order to meet the current and future demand for syngas and hydrogen, it is necessary to produce it while maintaining minimal GHGs and cost competitiveness in OPEX and CAPEX simultaneously. Samantha Hillard [5] conducted an economic analysis of green hydrogen and found that green hydrogen technology is the most promising option for the far future, especially for electrolysis of the water splitting process, which requires enormous energy input, and the cost trend analysis showed that it had much higher costs compared to methane reforming. Therefore, the technology is still immature and needs intensive research and development.
Consequently, due to its volume and efficiency, natural gas reforming continues to be the primary source of hydrogen production. SRM, a mature technology, has endured as the primary driver of hydrogen production because of its capacity and minimized CAPEX and OPEX costs [6]. However, despite the wide industrial experience of SRM, it still has the highest reforming emissions compared to other natural-gas-reforming technologies, with a capacity of 7.05 kg CO2/kg H2, in addition to energy efficiency issues due to the need for water evaporation as feed steam for the process [7]. Thus, dry reforming of methane (DRM) has gained the attention of scientists as a possible replacement for SRM because of the attractiveness of CO2 utilization, energy efficiency, and the minimization of GHG- and CO-rich syngas production for Fischer–Tropsch synthesis [8].
Despite DRM’s positive environmental, economic, and energy aspects, it still suffers from high catalyst coking and rapid deactivation at prominent pressures using the industrial nickel-oxide-based catalyst [9]. Accordingly, extensive research has been carried out on experimentally developing DRM catalysts over the last few years [10,11,12,13,14,15,16,17,18]. The advancement of computational fluid dynamics (CFD) allows for the visualization of micro-reaction data and significantly lowers the cost of calculations [19]. The accessibility to powerful software and processors nowadays has reshaped the research and development of the field of gas–solid multiphase flow in various bed settings, making possible CFD simulations of DRM in packed- and fluidized-bed reactors.
Parker et al. emphasized the importance of selecting the proper numerical method in CFD to precisely capture a particle’s interaction with other particles and the vessel’s internal walls [20]. The two main approaches in CFD are the Eulerian–Eulerian and Eulerian–Lagrangian methods, and many existing CFD models and software can be used to estimate gas–solid multiphase flows. Each approach has its advantages and limitations.
In the Eulerian–Eulerian method, continuous phases are assumed for the whole domain, such that the solid particles are considered as a discretized phase, and both solid and gas phases are modeled as Navier–Stokes. This treatment takes much less computational time due to the solids’ behavior acting as a pseudo fluid, and the sum of the solid and fluid volume fractions is unity [21,22]. However, not accounting for particle physical properties is a major disadvantage and cannot be overlooked in modeling gas–solid multiphase flow [23]. The Eulerian–Lagrangian method treats the fluid phase similarly to the Eulerian–Eulerian approach, and the differentiation is depicted in their treatment of the solid phase.
The computational particle fluid dynamics–multiphase particle in cell method (CPFD–MP-PIC) operates within the Eulerian–Lagrangian method and takes advantage of continuum and discrete models by mapping the particle properties from the Lagrangian coordinate to the Eulerian grid, where continuum terms are assessed and particle properties are mapped to the individual particles [24]. Thus, MP-PIC is practical for dense large-scale beds with less computational time. Barracuda is CPFD software that groups particles into parcels, making particle tracking slightly implicit. It has proven to be attractive in modeling circulating fluidized beds (CFBs) in recent years, due to its ability to account for an industrial-scale number of particles and design complexity, which effectively predicts the fluid structure [25,26,27,28]. Chen et al. simulated CFB risers using CPFD for Geldart B and compared them with Eulerian–Eulerian simulations. It was found that Barracuda correctly captured the riser’s axial and radial fluid structure and gave a better prediction than the Eulerian–Eulerian method [29]. Berrouk et al. adopted the MP-PIC approach in modeling a real industrial FCC riser and reached good agreement with actual plant data in addition to performing various parametric studies on the riser design and operating conditions using Barracuda CPFD software [30]. Further studies have demonstrated the effectiveness of this method in describing the interaction and flow characteristics between gas and solid phases [31,32,33,34].
Packed-bed reactors are the most widely used in the refining and petrochemical industries, which hold merit advantages of a simpler design and lower capital cost. However, the thriving demand for valuable refining products and profitability was the main driving force for developing fluidized-bed reactors for catalytic cracking over packed-bed cracking. This determination resulted in the establishment of the FCC process [35]. Enos JL [36] described it as the largest research effort ever undertaken after the atomic bomb. The following advantages have been depicted in utilizing fluidized beds over packed beds:
  • The catalyst moving in liquified form has enhanced the continuous operation process, which gives flexibility in temperature control and smoothly responds to changes in operation;
  • Improvements in gas and solid mixing have led to isothermal operations free of cold and hot spots;
  • More contact between the catalyst and reactant gases increases the conversion, mass, and heat rates;
  • Lower pressure drop;
  • Suitable for large-scale operation.
Due to the successful operation of beds, many other processes have adopted them. Some of them have reached commercial operation, and in this study, a bed-hosting chemical process was simulated to investigate and tap into its promising potential at a foundational level.
In this study, the Eulerian–Lagrangian approach was used to simulate the reaction of DRM in a packed bed and a fluidized bed. We first investigated how the temperature, inlet composition, and contact spatial time affected the DRM process in a packed bed. The coke formation was linked to the side reaction under various operating conditions, which helped include the coke amount and reactant conversion in the comparison of the reforming effects of the packed and fluidized beds.

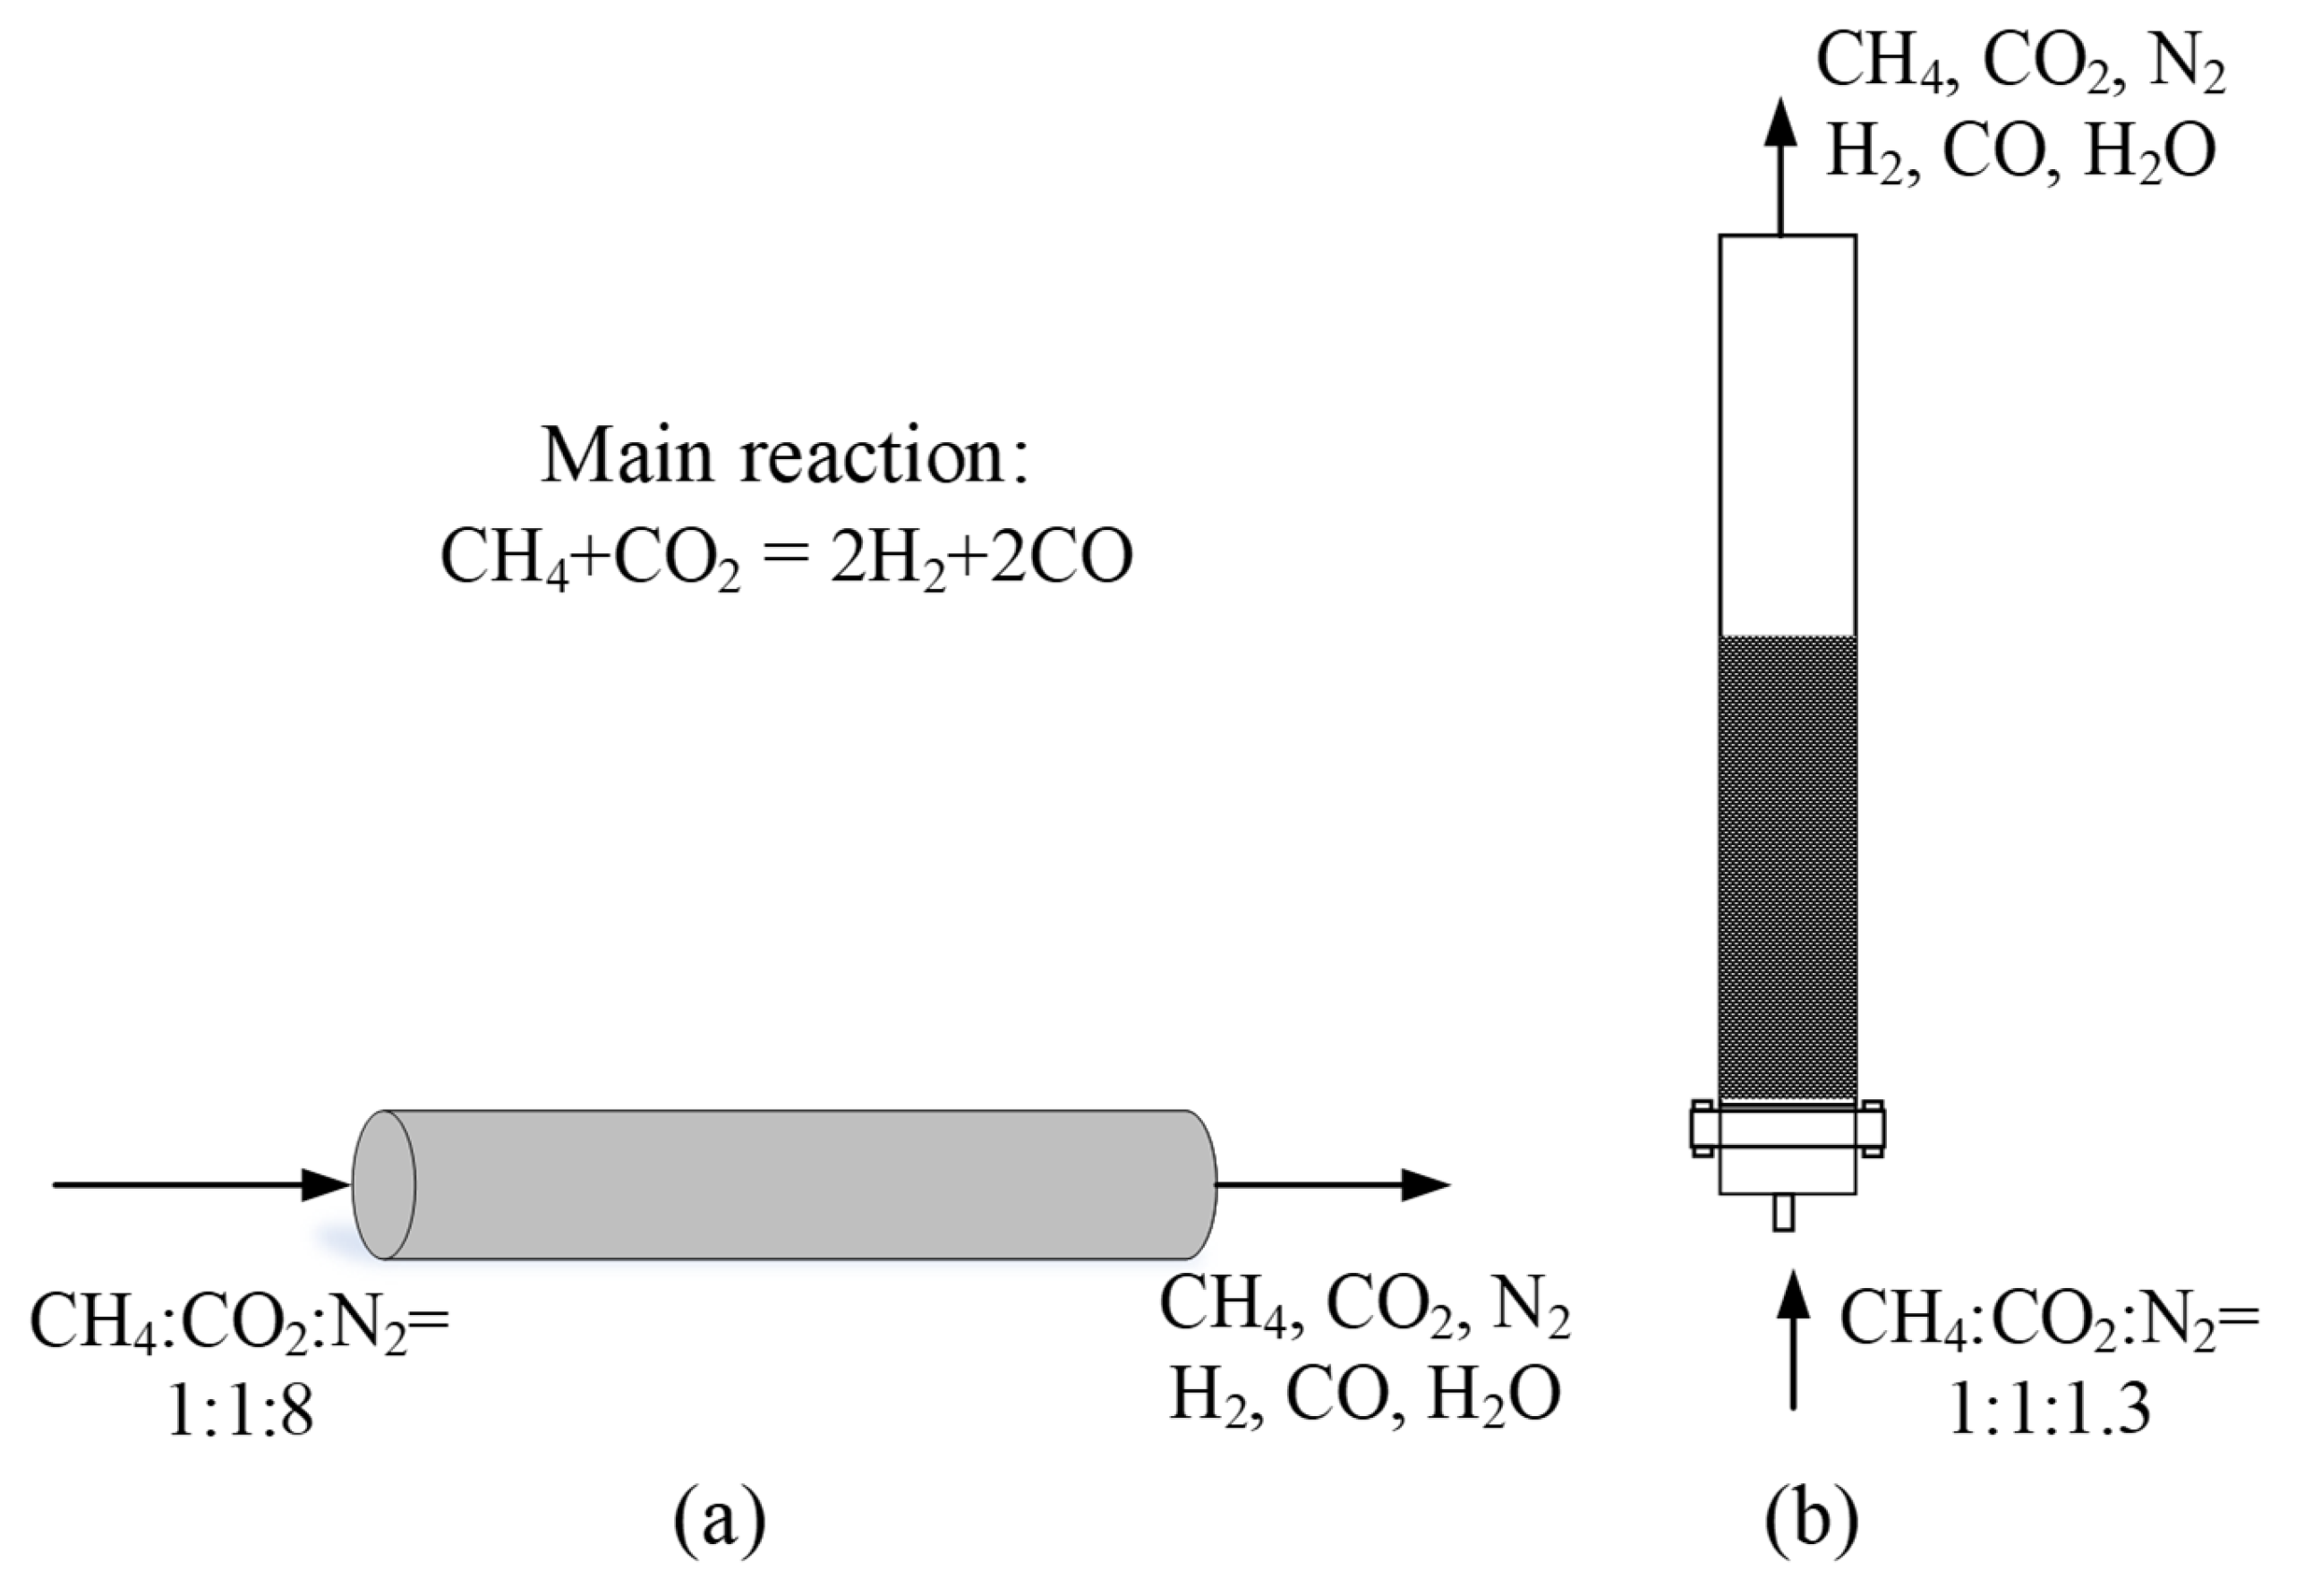
2. Numerical Simulation

2.1. CFD Model and Simulation Setup

This simulation employed Barracuda Ver. 21.0 software [37], which is based on the MP-PIC method and operates within the Eulerian–Lagrangian framework. In addition, solid phase stress was employed to substitute the particle collision in order to further reduce the computational resources. MP-PIC simulations are carried out with the energy minimization sub-grid drag model to capture the mesoscale structures in a DRM reactor. Details of the energy minimization sub-grid drag model can be found in the literature [24,26,38,39]. The governing equations for the gas and the solid phases are summarized in Table 1.

2.1.1. Gas-Species Transport Equations

Each gas species is described by a transport equation. The entire fluid phase characteristics are solved from the individual gas-species mass fractions, Yg,i. By convention, mass is exchanged between the gas species, and this is accounted for via the chemical source terms δ m ˙ i , chem in the discrete gas-species transport equation:
( θ g ρ g Y g , i ) t + · θ g ρ g Y g , i u g = · θ g D ρ g Y g , i + δ m ˙ i , chem
where θg is the gas volume fraction, u g is the gas velocity, ρg is the gas density, and D is the turbulent mass diffusivity, which can be derived from the relation between the gas viscosity μg and the Schmidt number Sc:
S c = μ g ρ g D
In this study, Sc was set to 0.9, a default value that is consistent with values published in the literature [25].
Table 1. Governing equations of the MP-PIC approach.
(1)
Continuity equation of gas phase:
θ g ρ g t + · θ g ρ g u g = 0 (3)
(2)
Momentum equation of gas phase:
θ g ρ g u g t + · θ g ρ g u g u g = θ g p F + θ g μ g 2 u g + θ g ρ g g (4)
(3)
Interphase momentum exchange rate per volume:
F = f V p ρ p D u g u p 1 ρ p p d V p d ρ p d u p (5)
(4)
Liouville equation for finding the particle distribution function f at each time:
f t + u p f A + f u p = 0 (6)
(5)
Particle acceleration equation:
A = D u g u p 1 ρ p p + g 1 θ p ρ p τ p (7)
(6)
Particle normal stress model:
τ p = 10 P s θ p β max θ cp θ p , ε 1 θ p (8)
(7)
Particle volume fraction description:
θ p = f V p d V p d ρ p d u p (9)

2.1.2. Equations of Energy Conservation

Snider [39] presented the energy conservation equation of the gas phase:
( θ g ρ g h g ) t + · θ g ρ g h g u g = θ g p t + u g · p + Φ · θ g q + Q ˙ + S h + q ˙ D
where hg is the gas enthalpy, Φ is the viscous dissipation, and Q ˙ is the energy source per volume. Sh is the conservative energy transfer from the solid phase to the fluid phase. The gas heat flux
q = λ g T g
where λg is the gas thermal conductivity, which is the sum of the molecular and eddy conductivities from Reynolds stress mixing. The eddy conductivity λ t t is calculated based on the turbulent Prandtl number:
P r t = C p λ t
Prt is set to 0.9, denoting the default value.
The enthalpy diffusion term q ˙ D is
q ˙ D = i = 1 N s · h g , i θ g ρ g D Y g , i
where Ns is the sum of all gas species and hg,i is the enthalpy of gas-phase species i.
Furthermore, the pressure, enthalpy, temperature, density, and mass fractions of the gas phase are closely related via the state equation. In the MP-PIC method, the partial pressure of a gas species is obtained using the ideal gas state equation:
P i = ρ g Y g , i R T g M w i
where R is the universal gas constant, Tg is the gas mixture temperature, and Mwi is the molecular weight of gas species i. The relation between the gas thermodynamic pressure of the total average flow and the pressures of the gas species is
P = i = 1 N s P i
The relation between the mixture enthalpy and the gas species enthalpies is
h g = i = 1 N s Y g , i h g , i
The term Cp in Equation (17) is the mixture specific heat at constant pressure. It is defined as
C p = i = 1 N s Y g , i C p , i
where Cp,i denotes the specific heat of gas species i. The gas species enthalpies hg,i is a function of the gas temperature Tg:
h g , i = T ref T g C p , i d T + Δ h g , i ,
where Δhg,i is the heat formation of gas species i at the reference temperature Tref.
During the chemical reactions, no heat is released within a particle, which is an assumption required for the particle energy conservation equation. In addition, the heat liberated at the surfaces of the particles during chemical reactions is directly tied to the gas-phase energy and does not affect the surface energy balance. As a result, the lumped particle heat equation is
C v d T p d t = 1 m p λ g N u g , p 2 r p A p T g T p
where Tp is the solid catalyst temperature, Tg is the gas mixture temperature, Cv is the specific heat of the particle, Nug,p is the Nusselt number for heat exchange between the gas and the solid particle, and λg is the gas thermal conductivity.
The energy exchanged between the solid and fluid phases is expressed as
S h = f m p D p u p u g 2 C v d T p d t d m p d t h p + 1 2 u p u g 2 d m p d u p d T p
where hp is the solid enthalpy:
h p = 2.0 + 1.2 R e 0.5 P r 0.33 × λ g d p
The packed bed’s schematic diagram is shown in Figure 1a, and it comes from the experimental apparatus of Benguerba et al. [40]. Atmospheric pressure mixed gas with a molar ratio of CH4:CO2:N2 = 1:1:8 controlled the device’s inlet. This reactor had a diameter and length of 0.008 m and 0.22 m, respectively. Figure 1b displays the schematic diagram of the fluidized bed, which was taken from Durán et al.’s experimental setup [41]. Its diameter and height were 0.03 m and 0.3 m, respectively. Table 2 lists the packed- and fluidized-bed geometries, the main physical characteristics of the gas and solids phases, and the operating conditions.

2.2. Reaction Kinetics

In modeling and simulating the dry reforming of methane, there are thousands of associated elementary chemical reaction steps with the heterogeneous catalyst. The involvement of the excess species and reaction intermediates in the detailed surface kinetic mechanism leads to an enormous network; this is called the microkinetic approach [44,45,46,47]. Microkinetic models give a precise report of the chemical system at the atomic level for varieties of operating conditions and concentrations since it avoids RDS assumptions. However, this large-scale network is impractical to imbed in CFD due to its expensive computational cost and inactive reaction path calculations. Another classification of kinetic modeling that avoids detailed information about all side reactions is the macrokinetic approach. Macrokinetic models are characterized in the form of a globalized power law that treats the chemical system at the molecular level as a black box, offering less computational time and power. The black box system risks overprediction, although it has been used in the scale-up designs of reactors for several years due to its straightforward implementation in CFD. The most widely used macrokinetic model in the industry has been the Langmuir–Hinshelwood–Hougen–Watson (LHHW) model. Built on continuum models that include simplifications in the assumption of a single rate-limiting step, the LHHW model is a more detailed assembly model than the black box system and can be derived from micro-kinetic models [48,49,50].
The following are the primary DMR reactions:
Main reaction:
CH4 + CO2 ↔ 2H2 +2CO
Reverse of water–gas shift (RWGS):
CO2 + H2 ↔ H2O +CO
Methane decomposition:
CH4 ↔ 2H2 +C(s)
Boudouard reaction:
C(s) + CO2 ↔ 2CO
Carbon gasification:
C(s) + H2O ↔ CO + H2
The following are the equations used to calculate the conversions of CH4 and CO2 and the yields of H2, CO, and H2O in DRM:
X C H 4 = F C H 4 i n F C H 4 o u t F C H 4 i n × 100 %
X C O 2 = F C O 2 i n F C O 2 o u t F C O 2 i n × 100 %
Y H 2 = F H 2 o u t 2 F C H 4 i n × 100 %
Y C O = F C O o u t F C H 4 i n + F C O 2 i n × 100 %
Y H 2 O = F H 2 O o u t F C H 4 i n × 100 %
where [FCH4]in and [FCO2]in are the inlet molar flow rates of CH4 and CO2, respectively, and [FCO]out, [FH2]out, and [FH2O]out are the outlet molar flow rates of CO, H2, and H2O, respectively. The yields of steam and coke were neglected as they were very negligible.
Although the SRM process has a high methane conversion rate and a low carbon deposition, it cannot help reduce global carbon dioxide emissions. DRM has attracted many researchers due to its vast capability to effectively valorize both natural gas and CO2 without the need for water vaporization to produce the required syngas with a valuable ratio of H2/CO that can be exploited in various refining processes. However, early investigations have shown that DRM’s potential to replace SRM is challenged by some operational issues, such as excessive catalyst deactivation and difficult conversion to the desired product amount and ratio. The latter issues are particularly true for packed-bed DRM. To tackle these issues, the development of the DRM process in fluidized beds appears to be one of the solutions since fluidization is known for its high mass and heat transfers and better control over catalyst and gas flows. Therefore, this study researched each of them separately in order to study the difference in DRM between the packed bed and the fluidized bed.

3. Results and Discussion

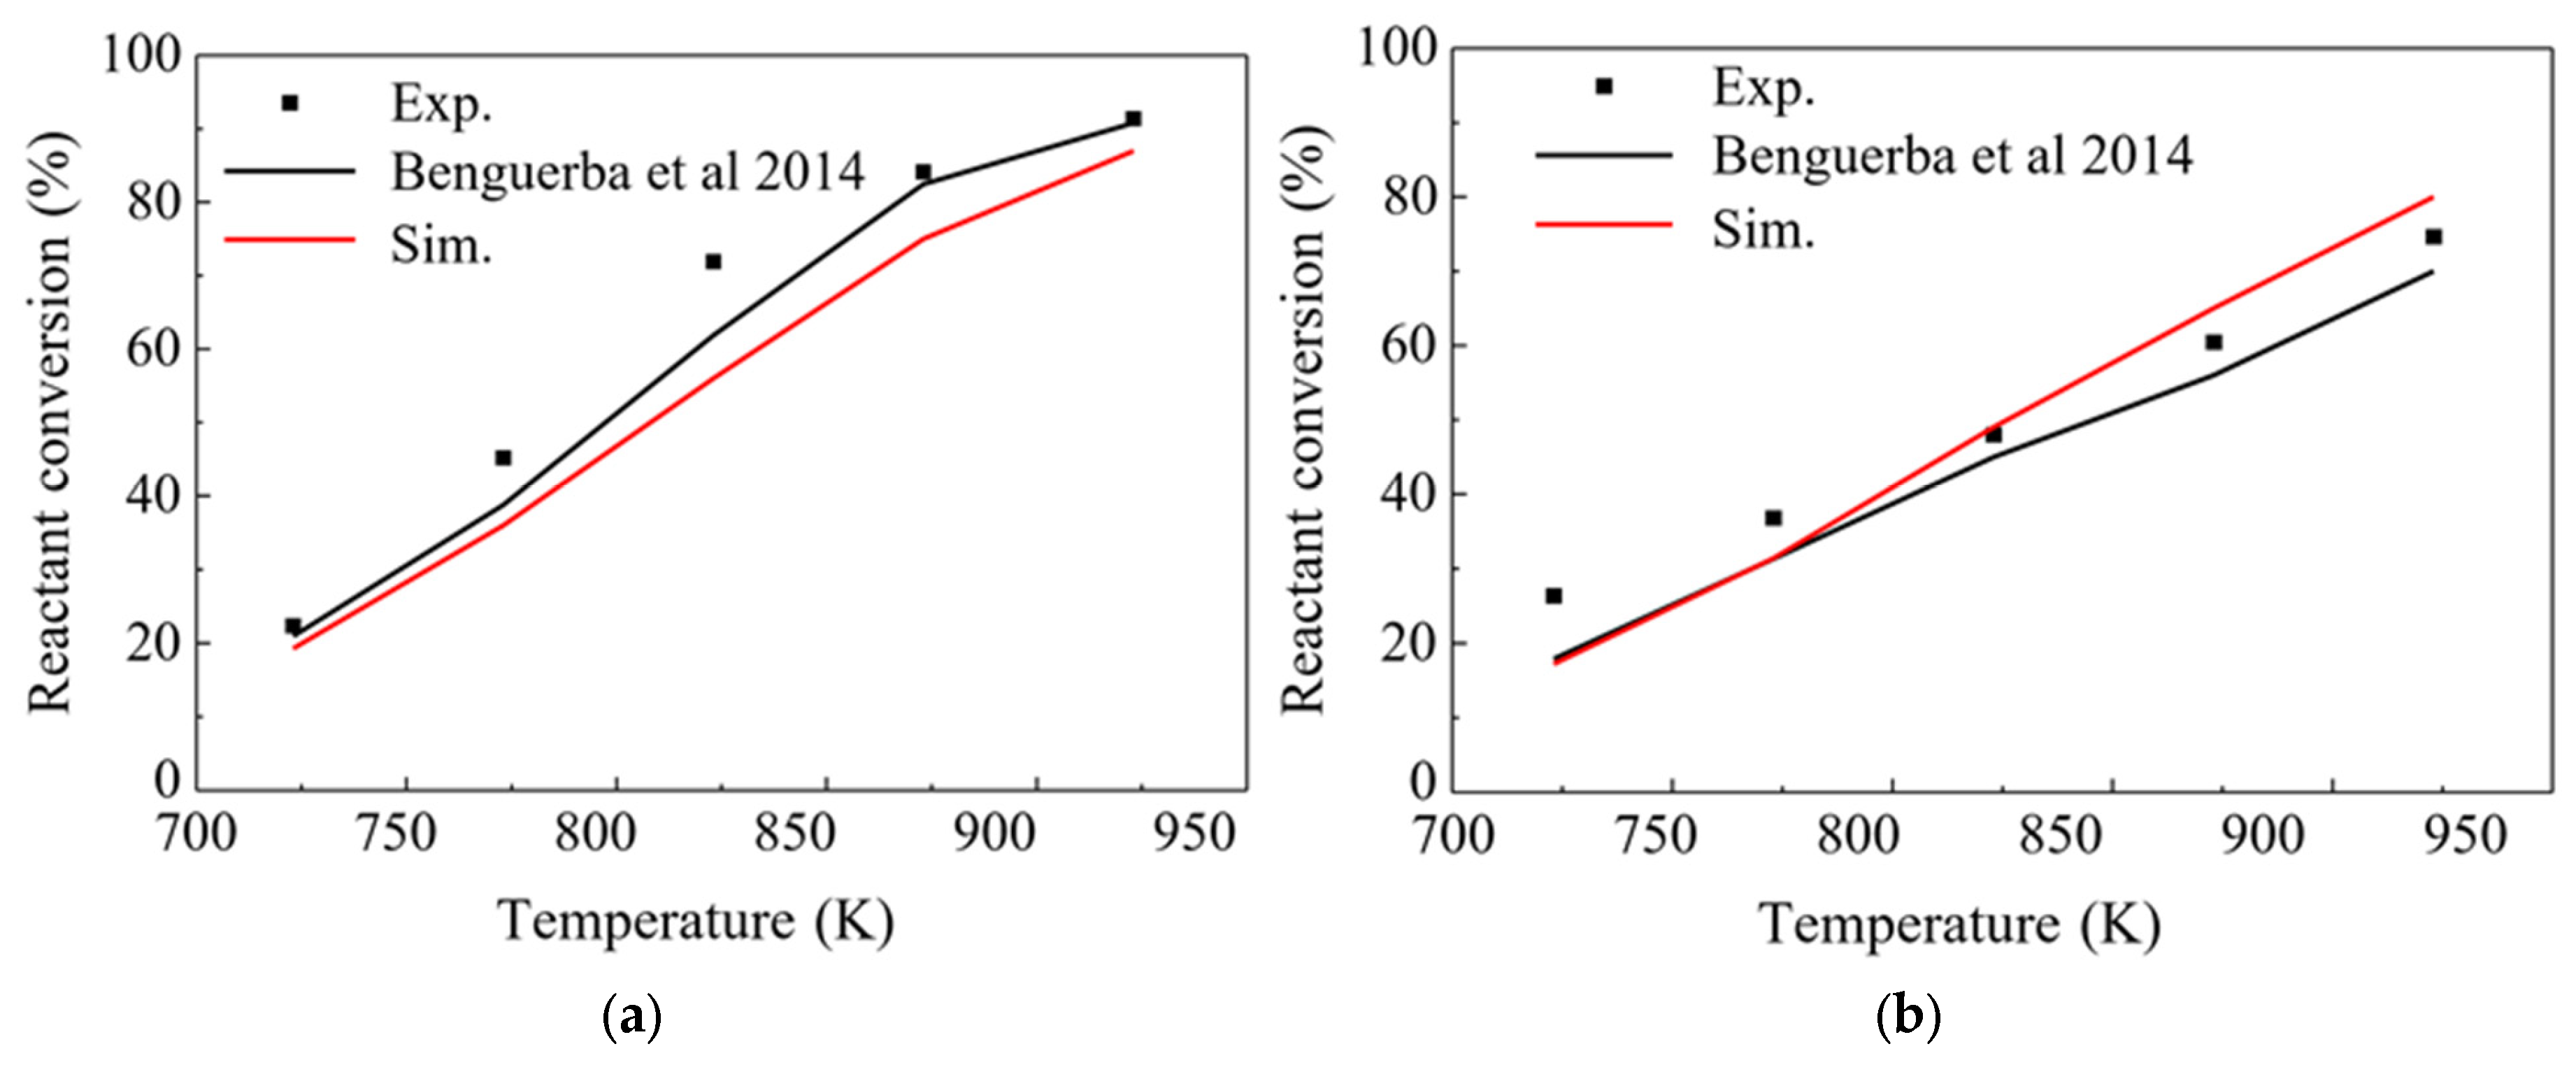
3.1. Model Validation of Packed Bed

Figure 2 shows the conversions and yields of DRM over time under different temperatures. It should be noted that the conversion rates of CH4 and CO2 were close to one because only a few gases can be detected at the outlet at the start of the reaction. The conversions of CH4/CO2 and the yields of H2/CO reached stable operations after 10 min, indicating the total reaction arrived at thermodynamic equilibrium. However, the author did not provide details of the simulation time. Hence, the data selected for this study were for after 15 min of operations for modal verification.

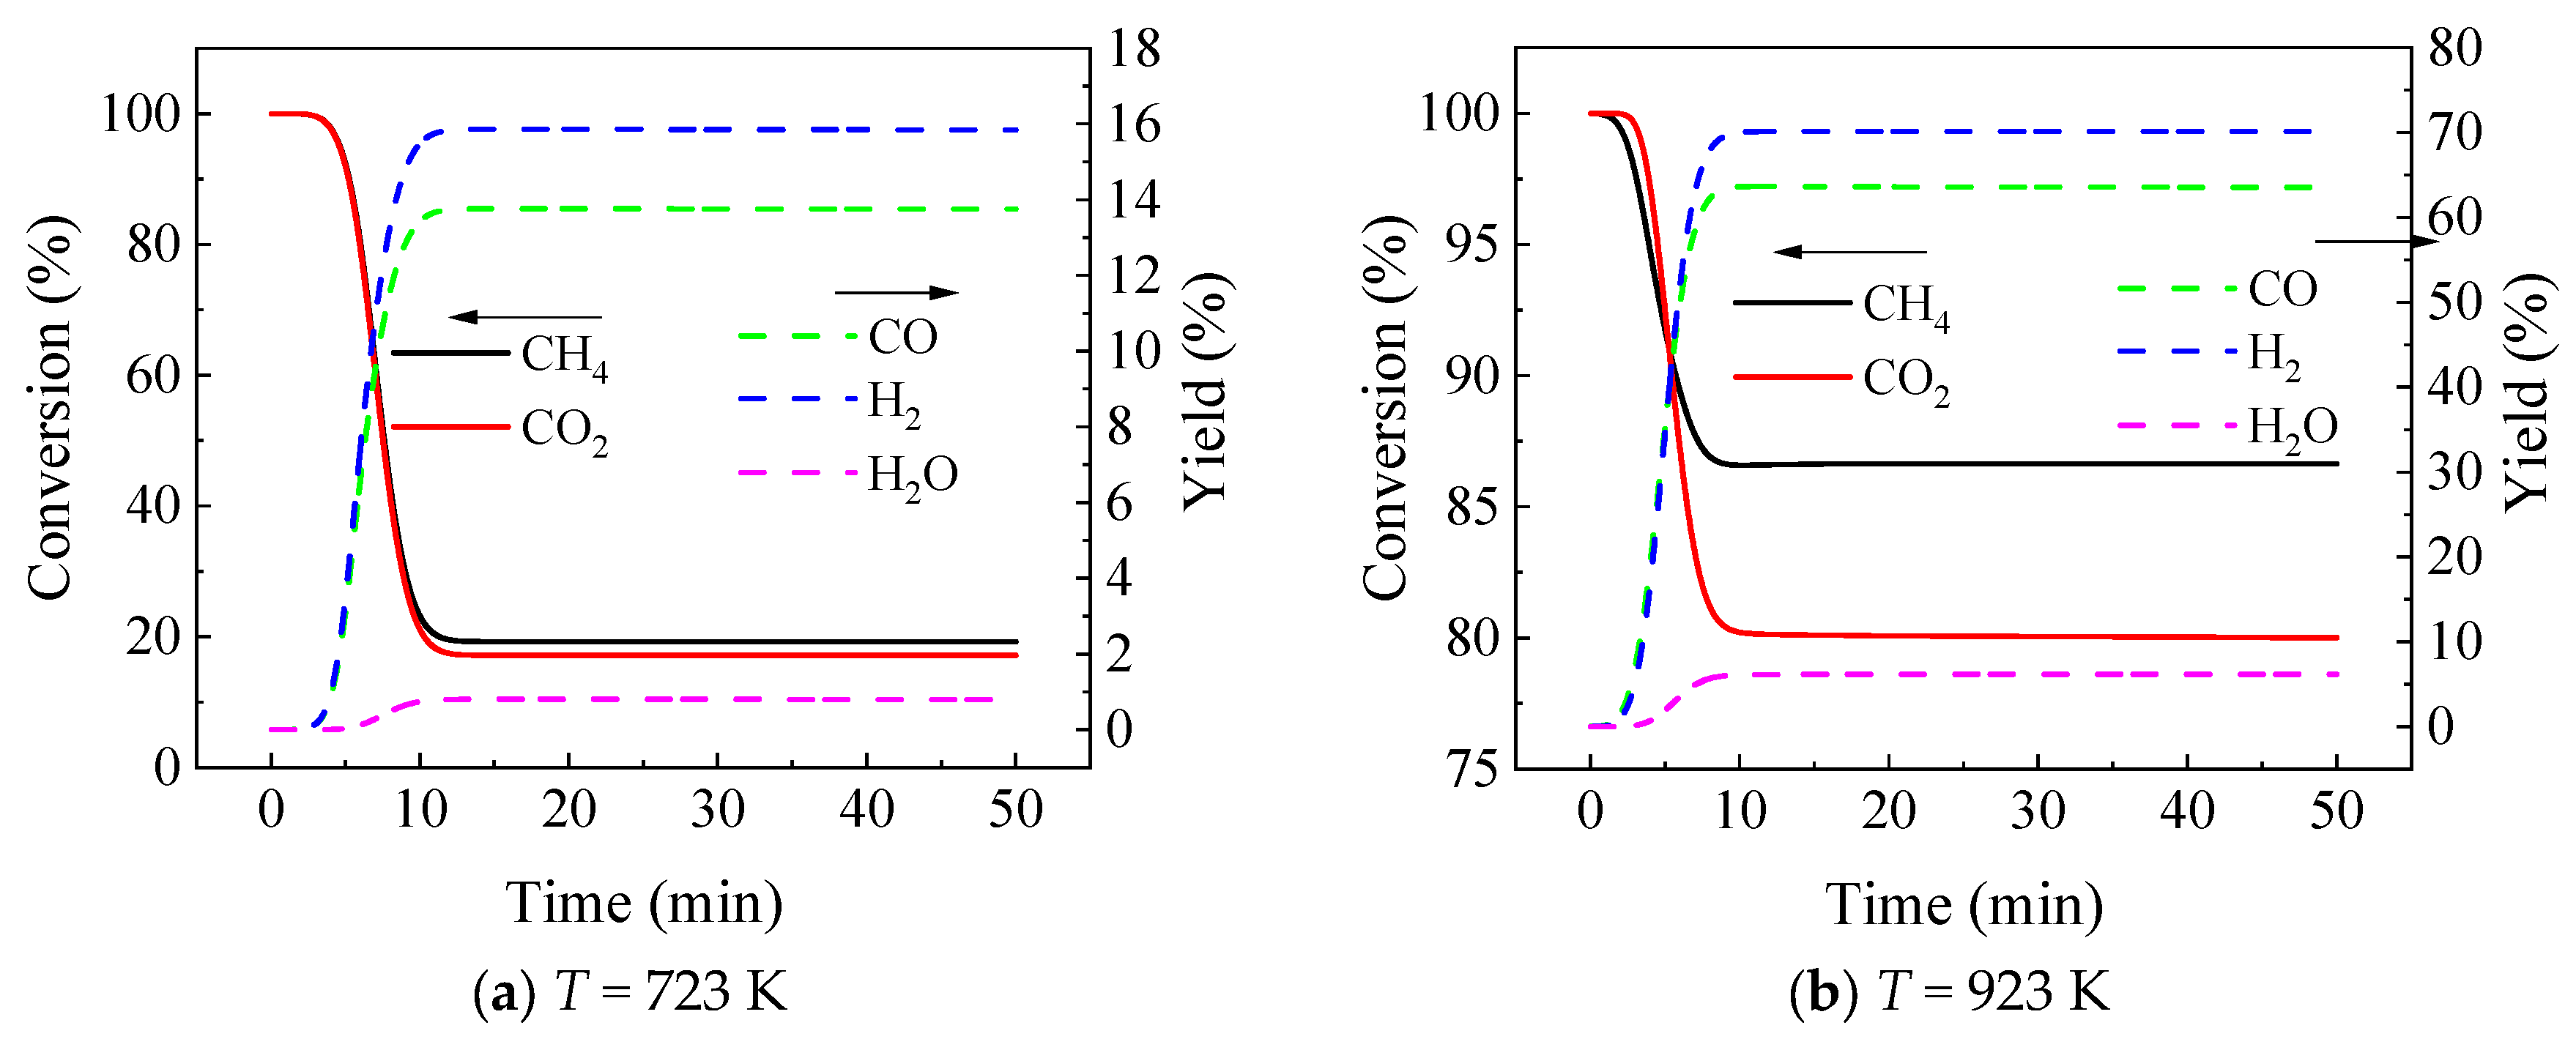
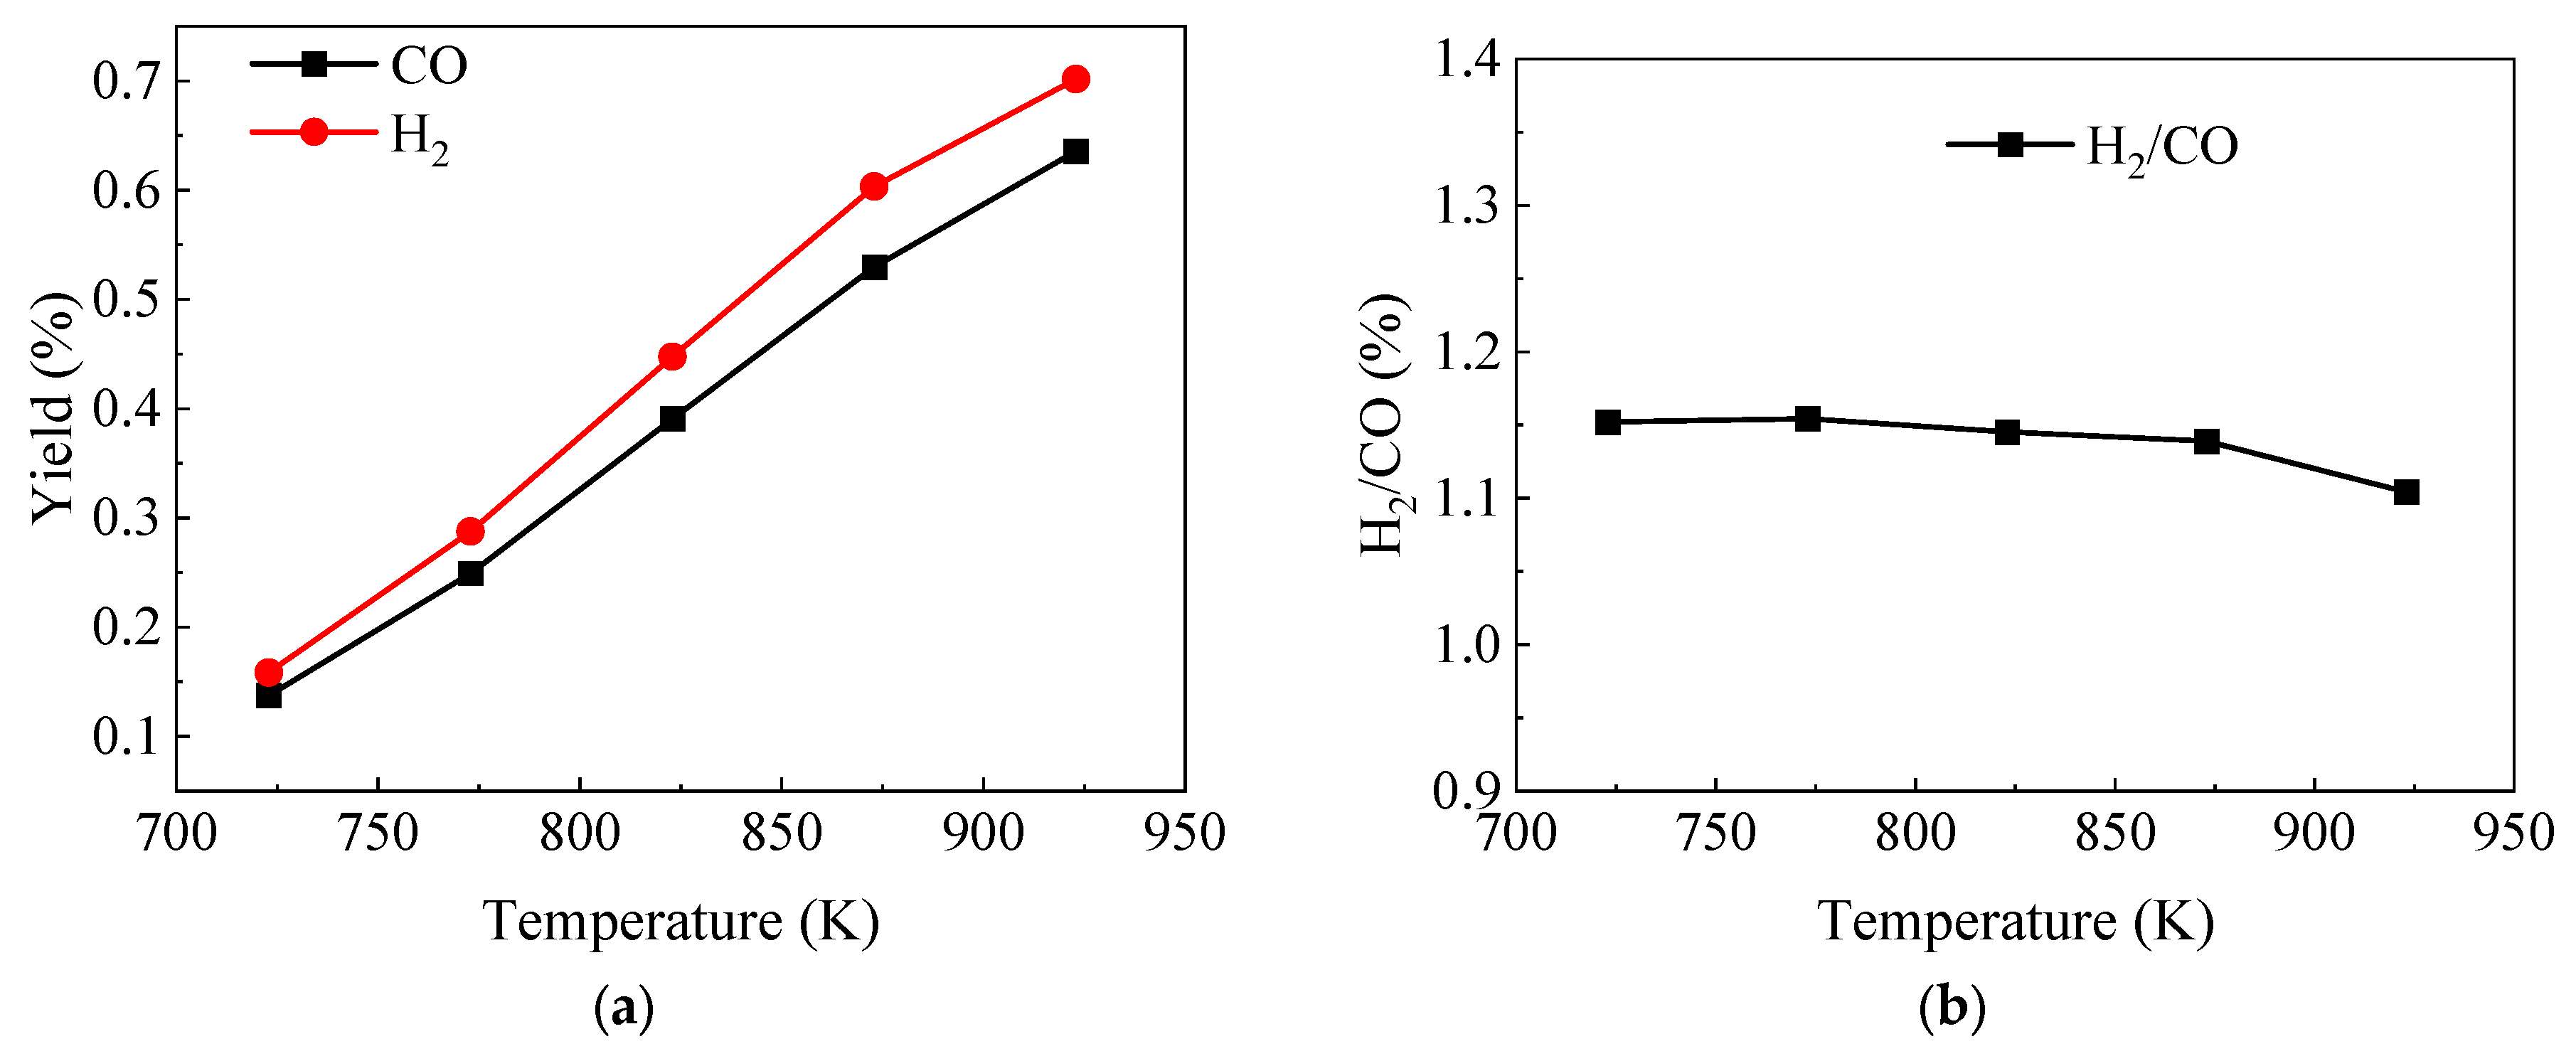
3.2. Effect of Temperature

The conversion, yield, and ratio of H2/CO are more susceptible to the reactant temperature. It is necessary to compare the simulation and experiment settings used in this study, particularly concerning how the reaction temperature affected the DRM process.
Figure 3 shows a comparison of the experimental and simulated CH4 and CO2 conversion at various temperatures. In the DRM process at equilibrium, the temperature affected the reactant conversion favorably within a given temperature range. Additionally, the obtained simulation conversions were close to Benguerba’s numerical data and experimental results [40]. Although the CH4 conversions in this study were slightly lower than the experimental data, the CO2 conversions were very close to the experiment. Figure 3a shows that the methane conversion rate was lower than the experimental value regardless of our simulation value or Benguerba et al.’s simulation value. The kinetic equation explains why the simulated methane conversion was less than the observed measurement. The lower stoichiometric coefficient of the primary reaction of DRM was the most likely cause. Both employed DRM kinetic models were derived from various sources in the literature. The simulated materials, however, cannot be wholly equal to the catalysts described in the literature, and slight differences in the reaction coefficient could be a result of different catalysts.
As shown in Figure 4a, we immediately observed a change in the simulated yield with the change in temperature since the simulated reactant conversion rate in the example above is consistent with the experimental trend. The increased yields of CO and H2 with the temperature are consistent with the trend shown in Figure 3, because the conversions of the reactants increased as the temperature rose. The molar ratio of H2/CO is presented in Figure 4b. The obtained values were slightly greater than unity. This demonstrates that, in addition to the main reaction (reaction 1), the methane decomposition (reaction 3) contributed to hydrogen production. Methane decomposition is an endothermic reaction that becomes stronger as the temperature rises. Thermal methane cracking occurs as the temperature rises above 400 °C for most catalysts [18,51,52,53].
Numerous studies have demonstrated that carbon deposition on the catalyst is a necessary part of the DRM process and the primary cause of catalyst deactivation [18,40,54]. In the DRM process, the methane decomposition (3), Boudouard reaction (4), and carbon gasification (5) are the primary contributors to coke formation. Of these reactions, methane decomposition (3) produces substantially more coke than the other reactions [18,55,56], especially at high reaction temperatures. Because methane decomposition tends to have a more violent reaction in high-temperature environments, coke formation is facilitated by higher reaction temperatures. This correspondingly explains why, in most cases, the ratio of H2/CO is slightly greater than one.
The trend of carbon deposition at various temperatures is depicted in Figure 5, showing that the amount of carbon deposition increased with an increasing reaction temperature. As the temperature reached 850 °C, the carbon deposition barely shifted. The Boudouard reaction (4) and carbon gasification (5) consumed some coke even though the temperature rise accelerated methane cracking. This indicates that the momentum, mass, and energy exchange between particles and the surrounding environment achieved a relatively stable equilibrium. Therefore, once the system reached a stable state, it was in a thermodynamic equilibrium condition.

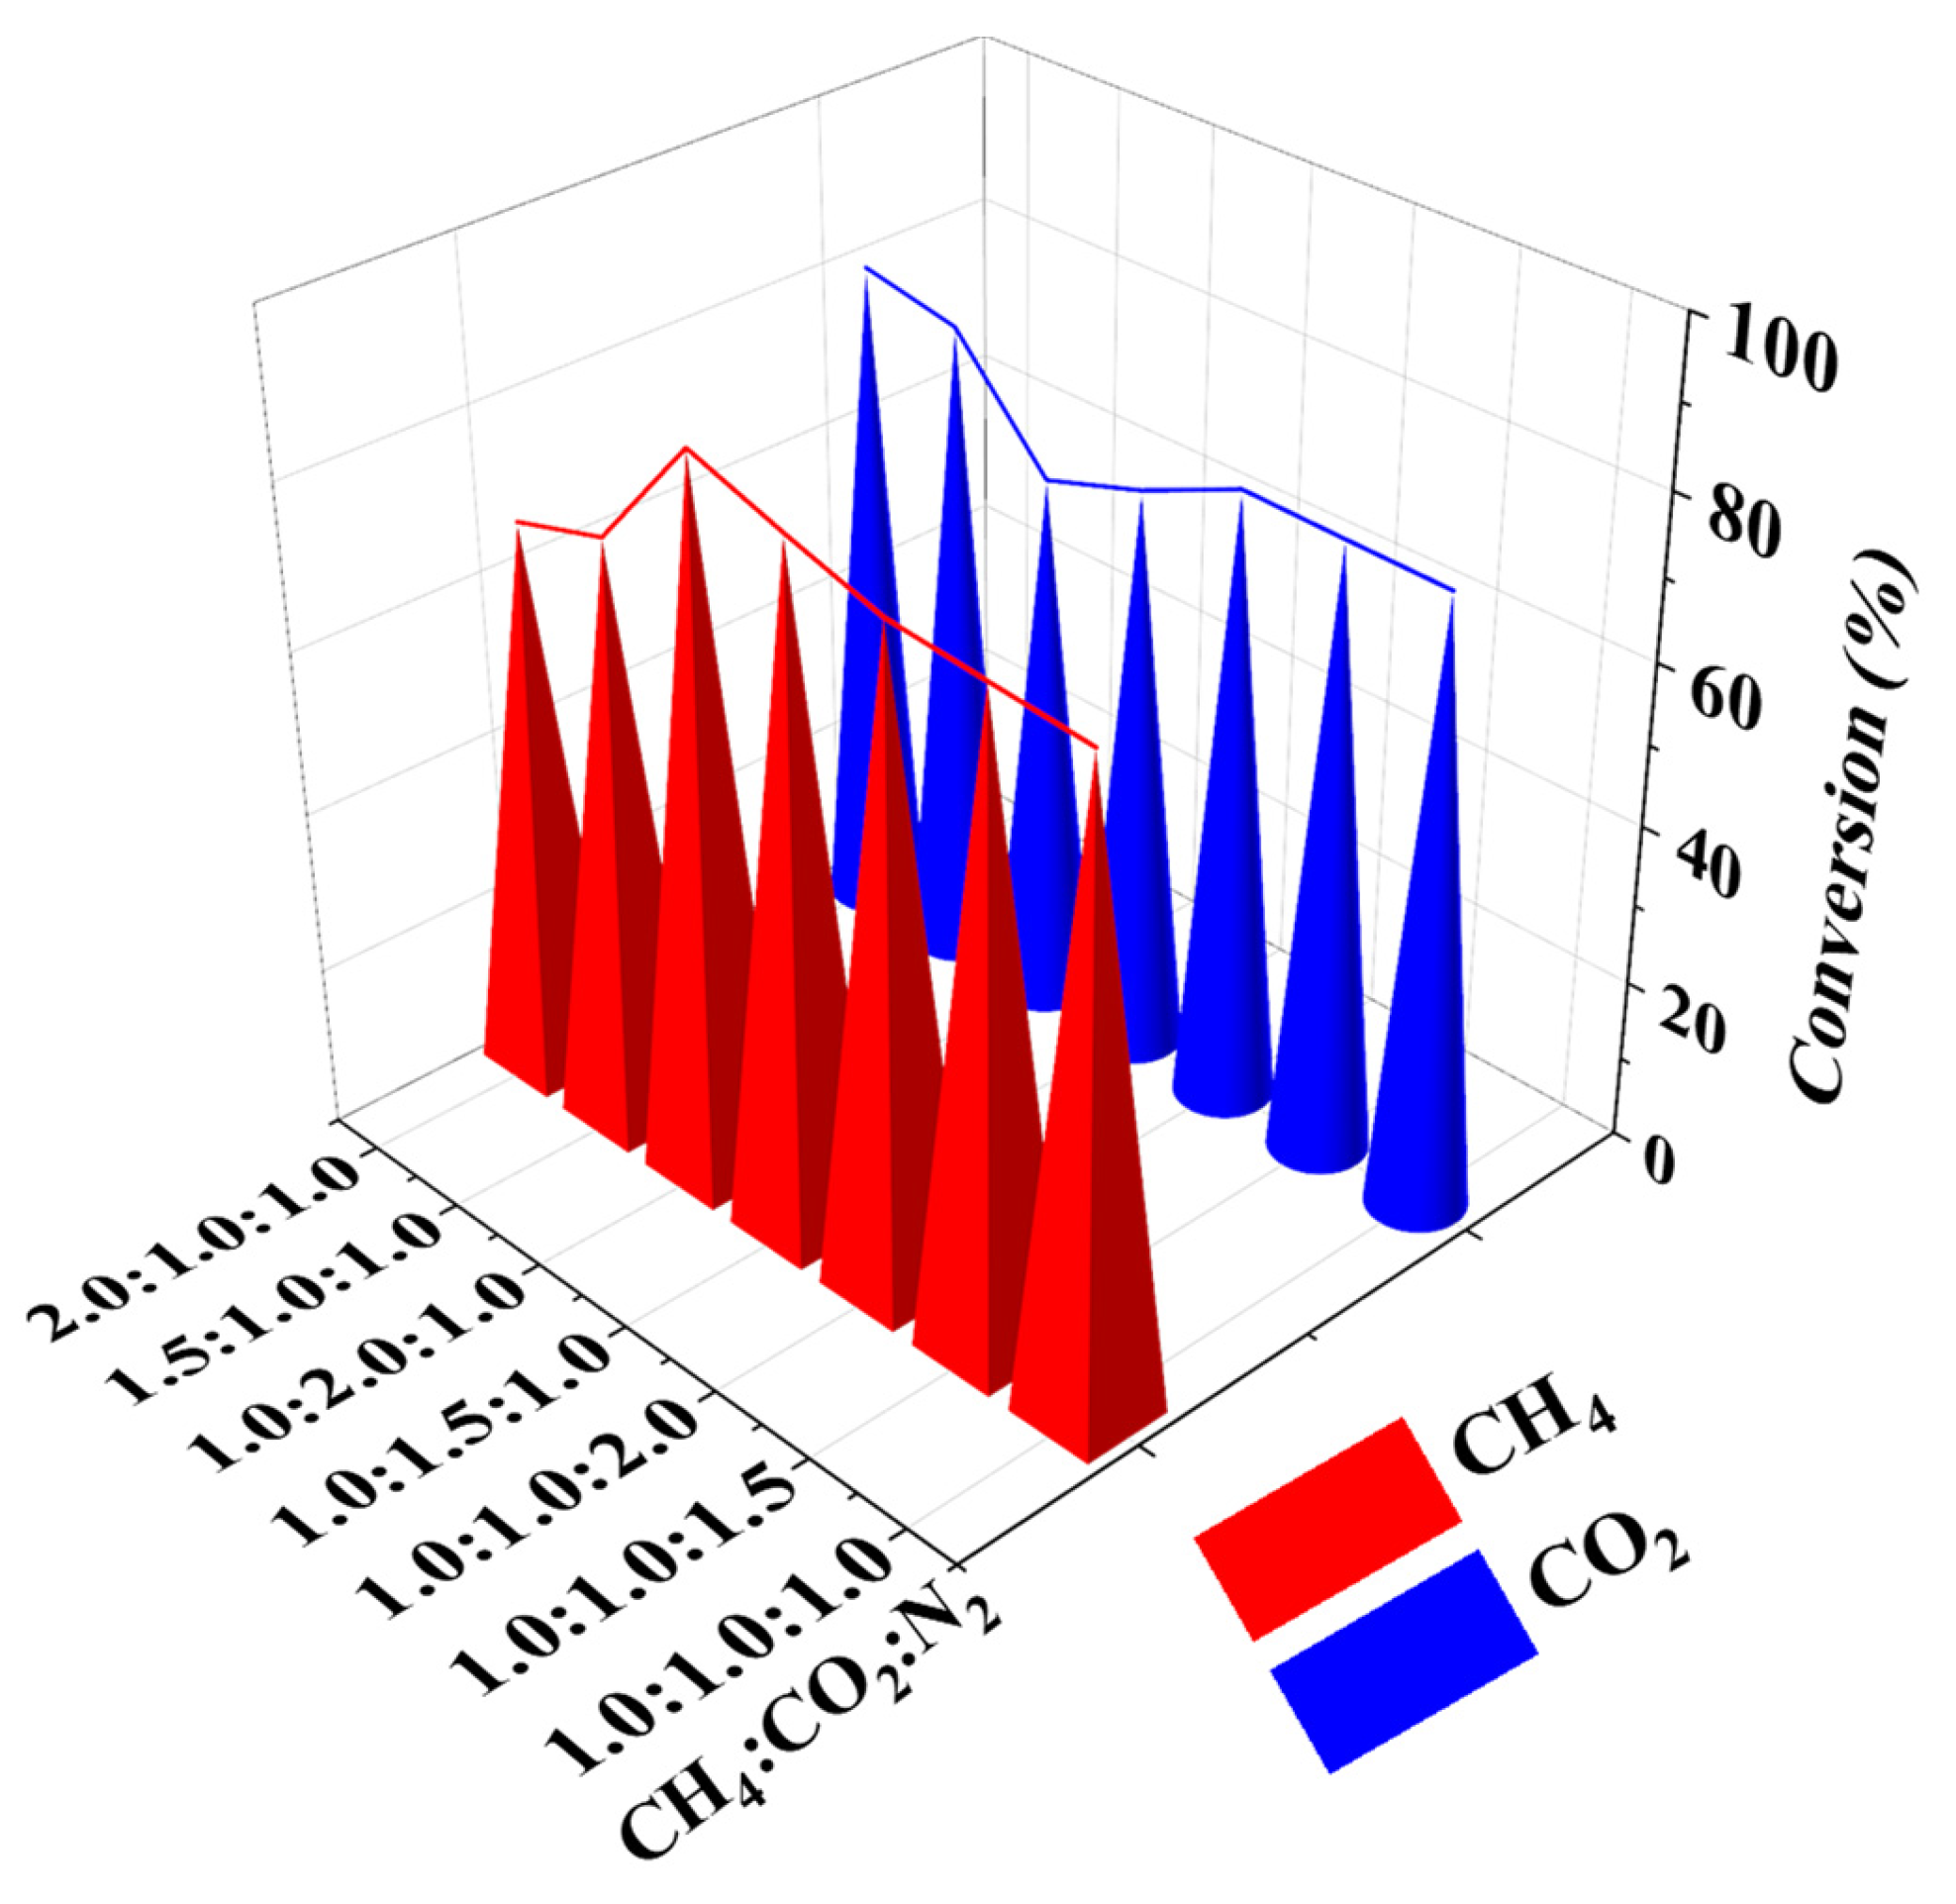
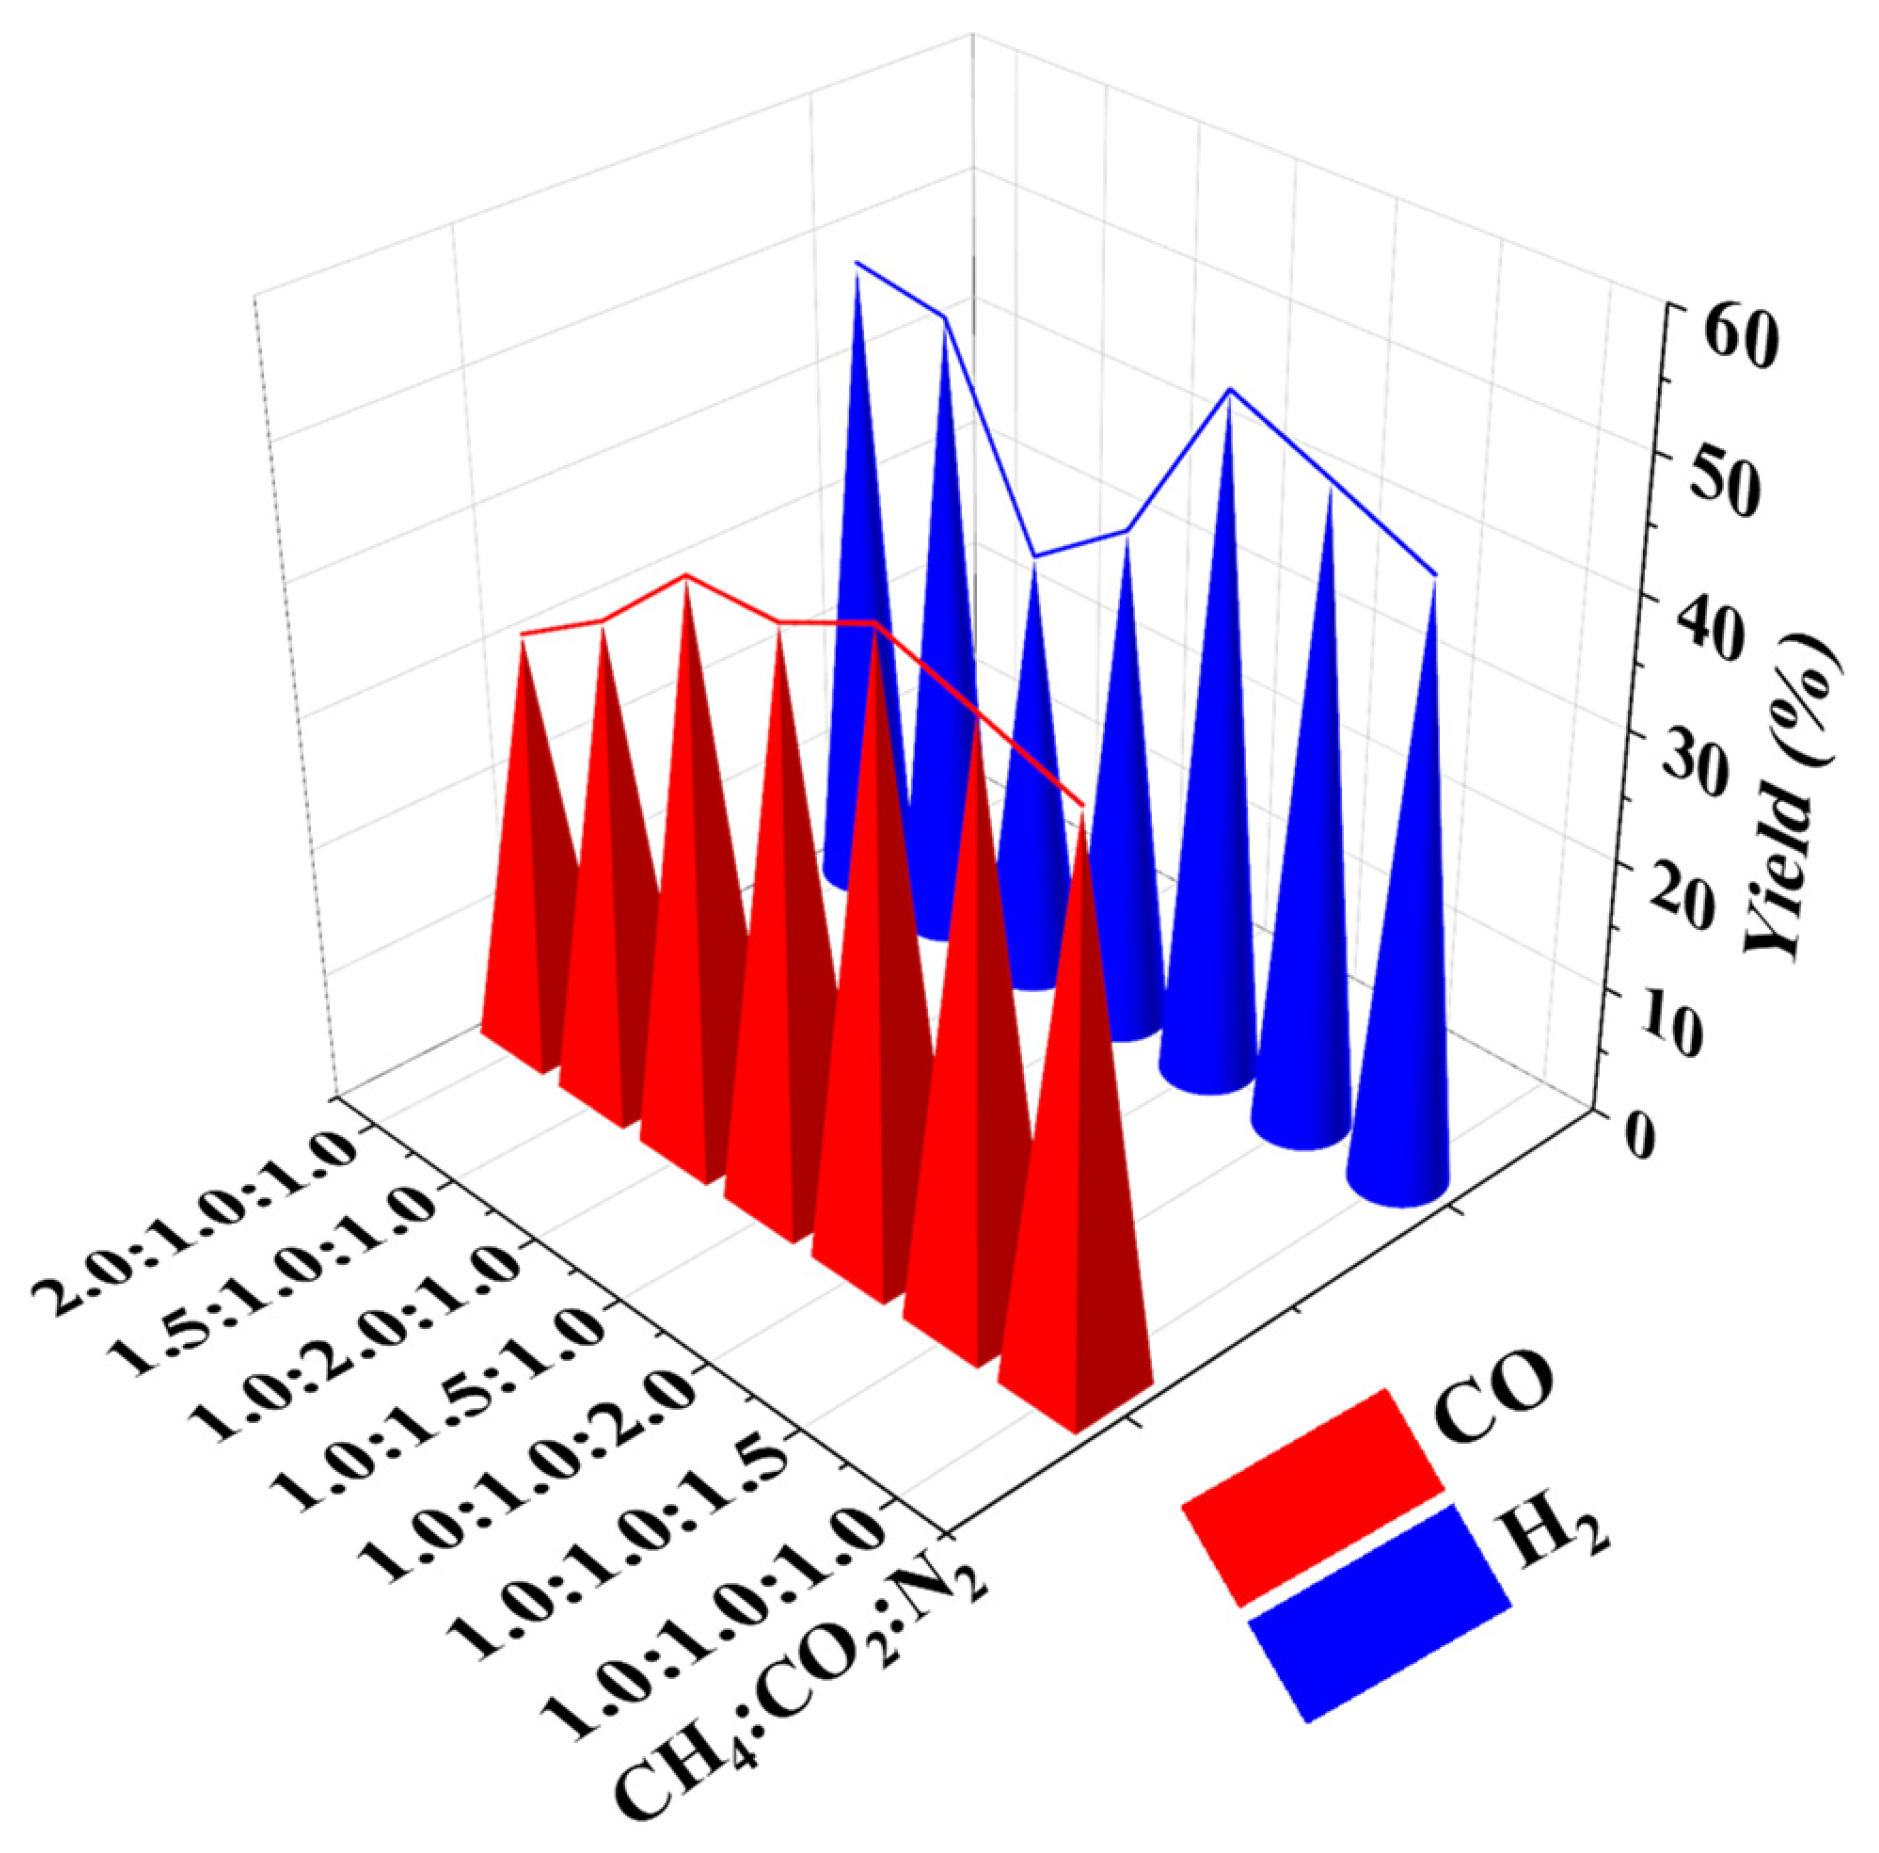
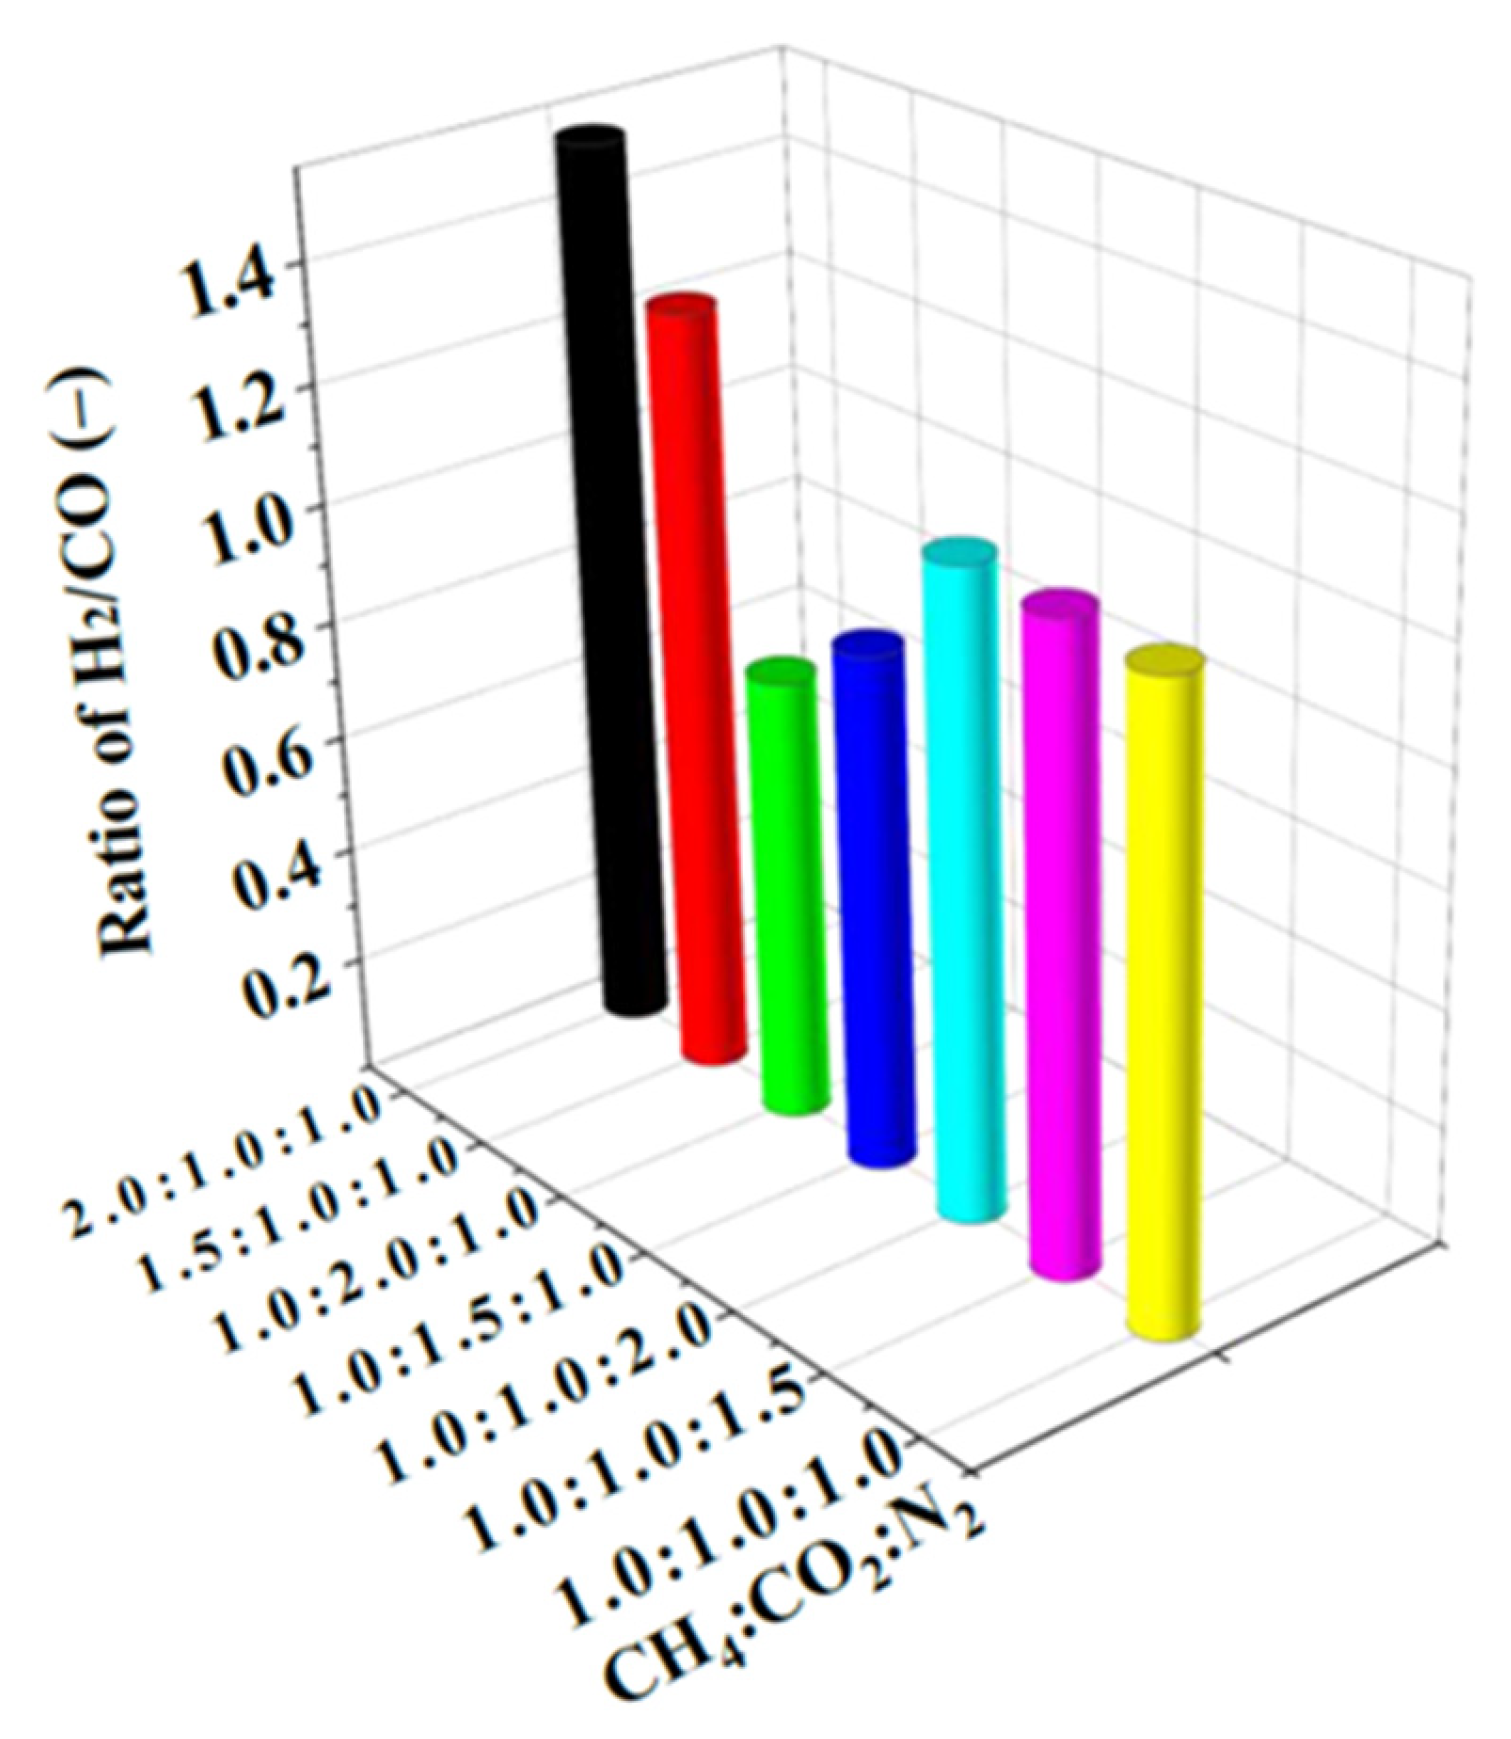
3.3. Effect of Components
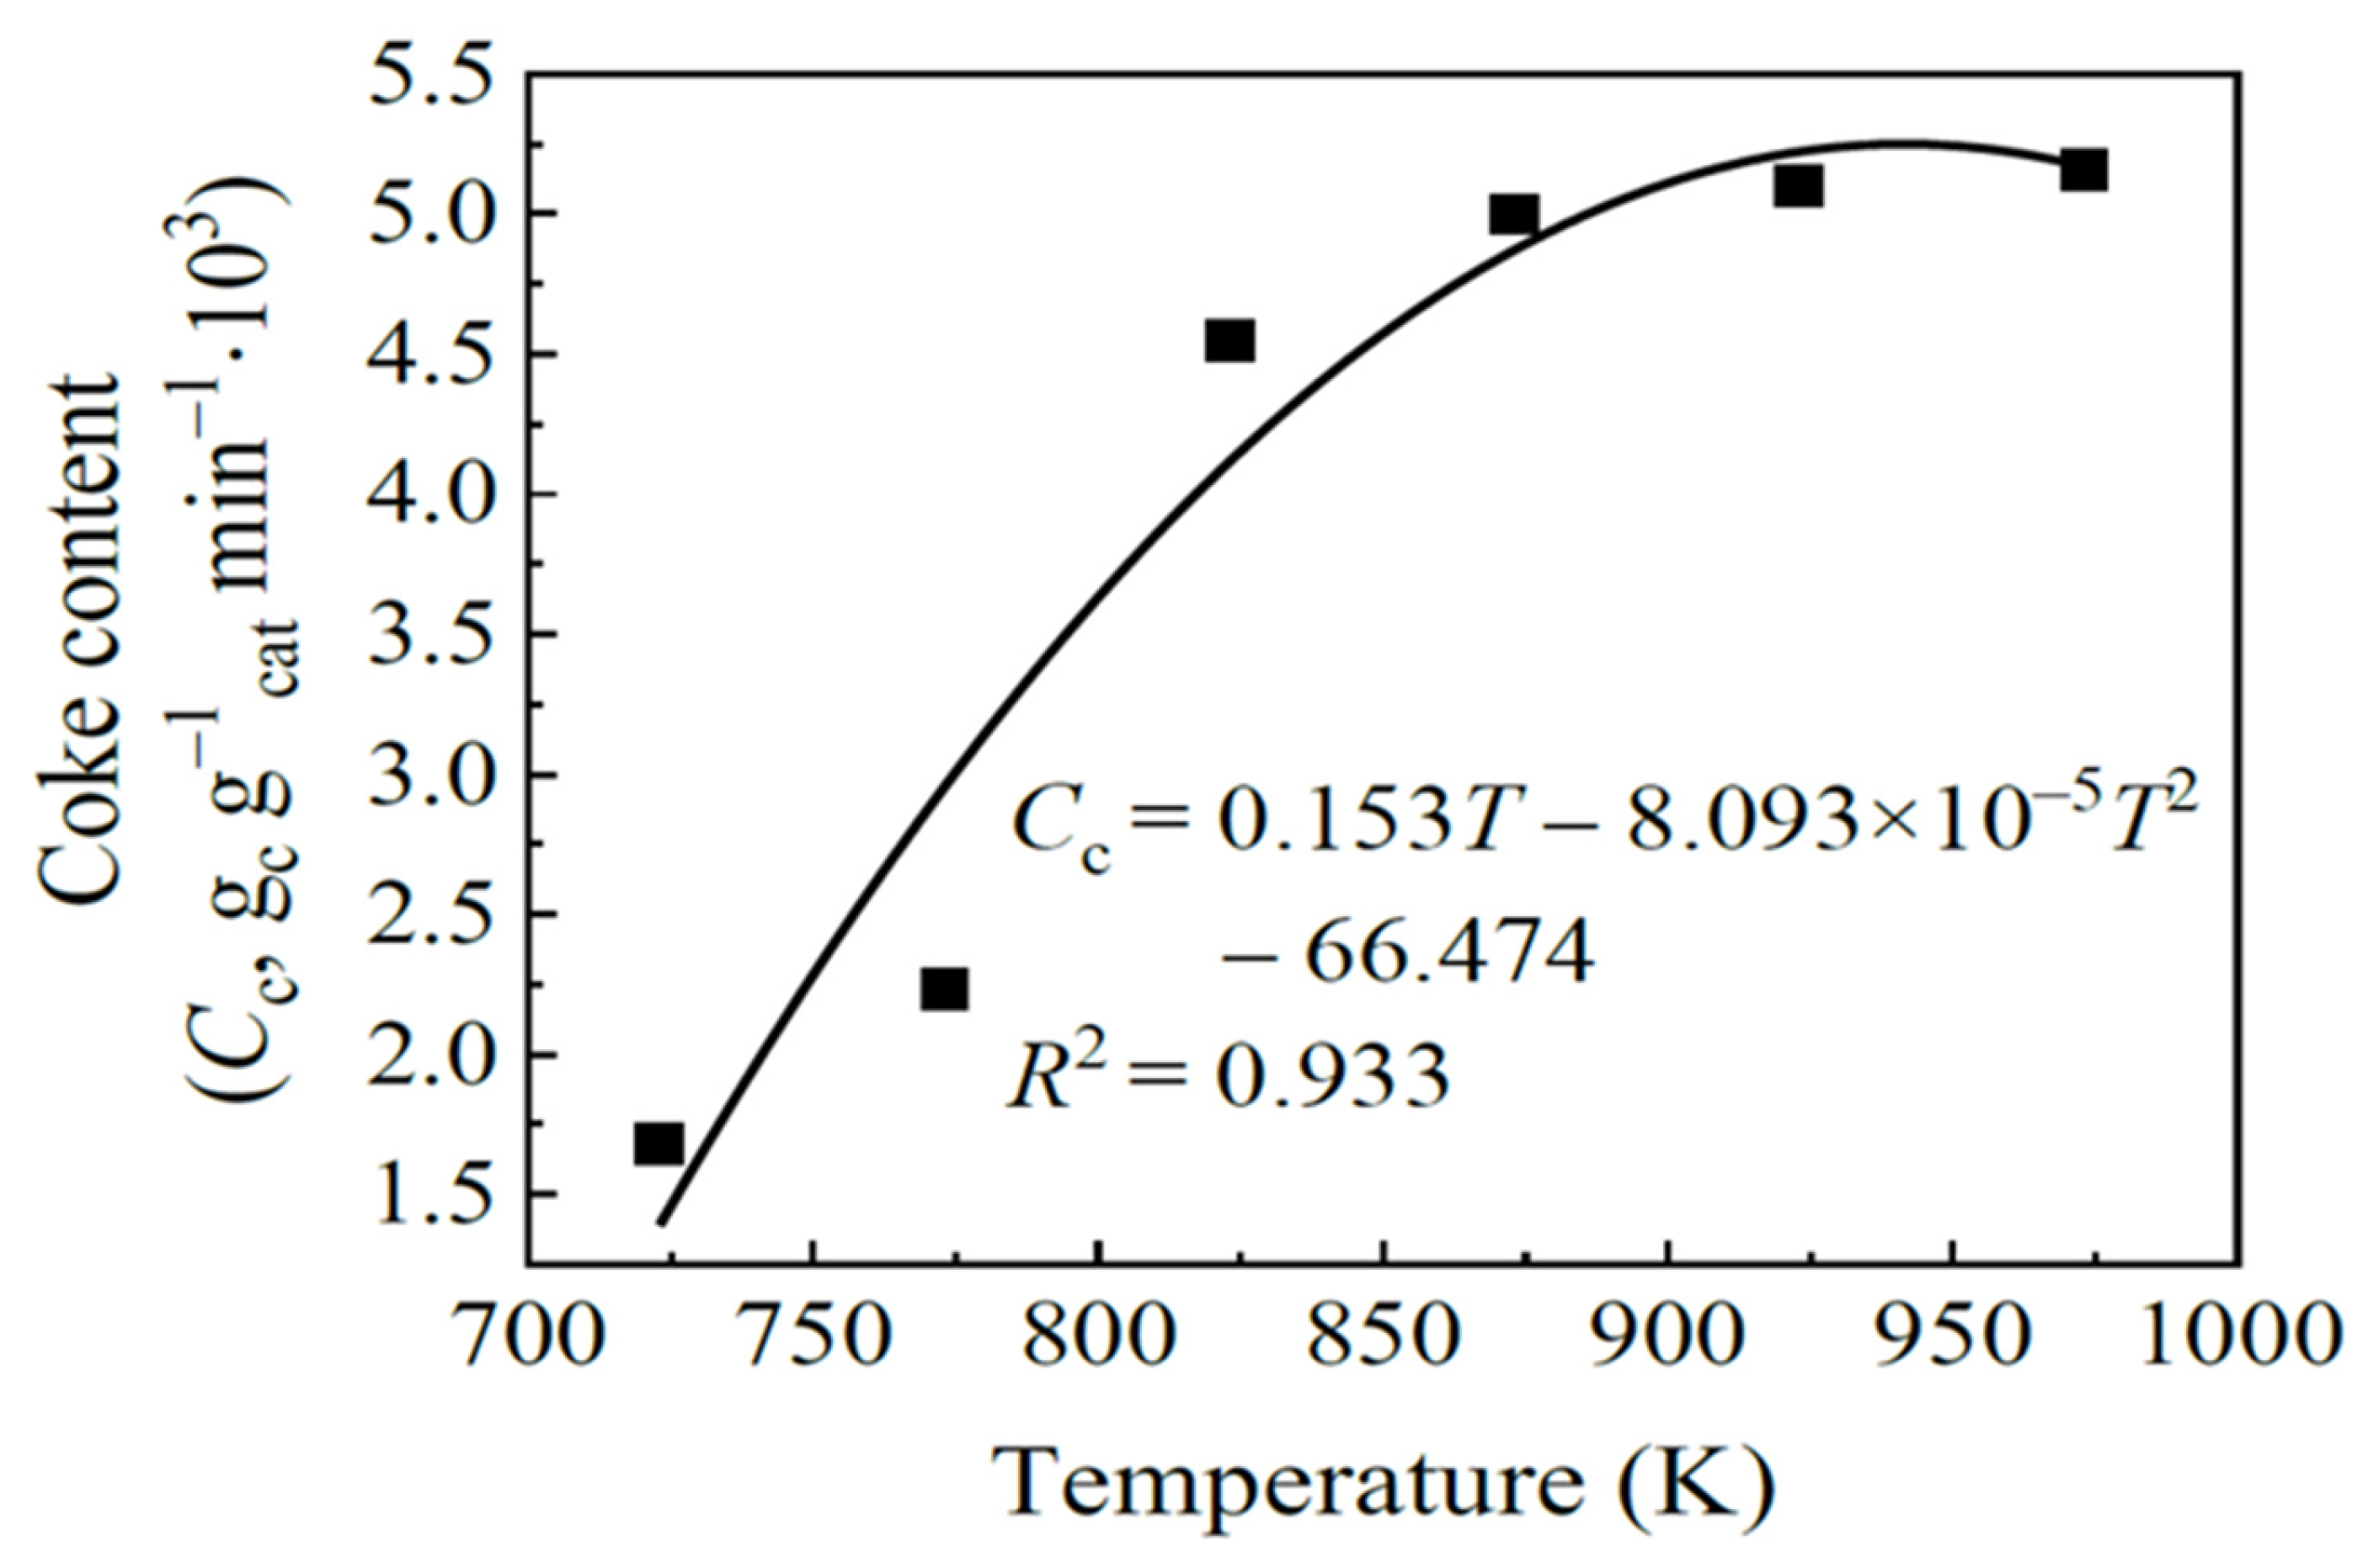
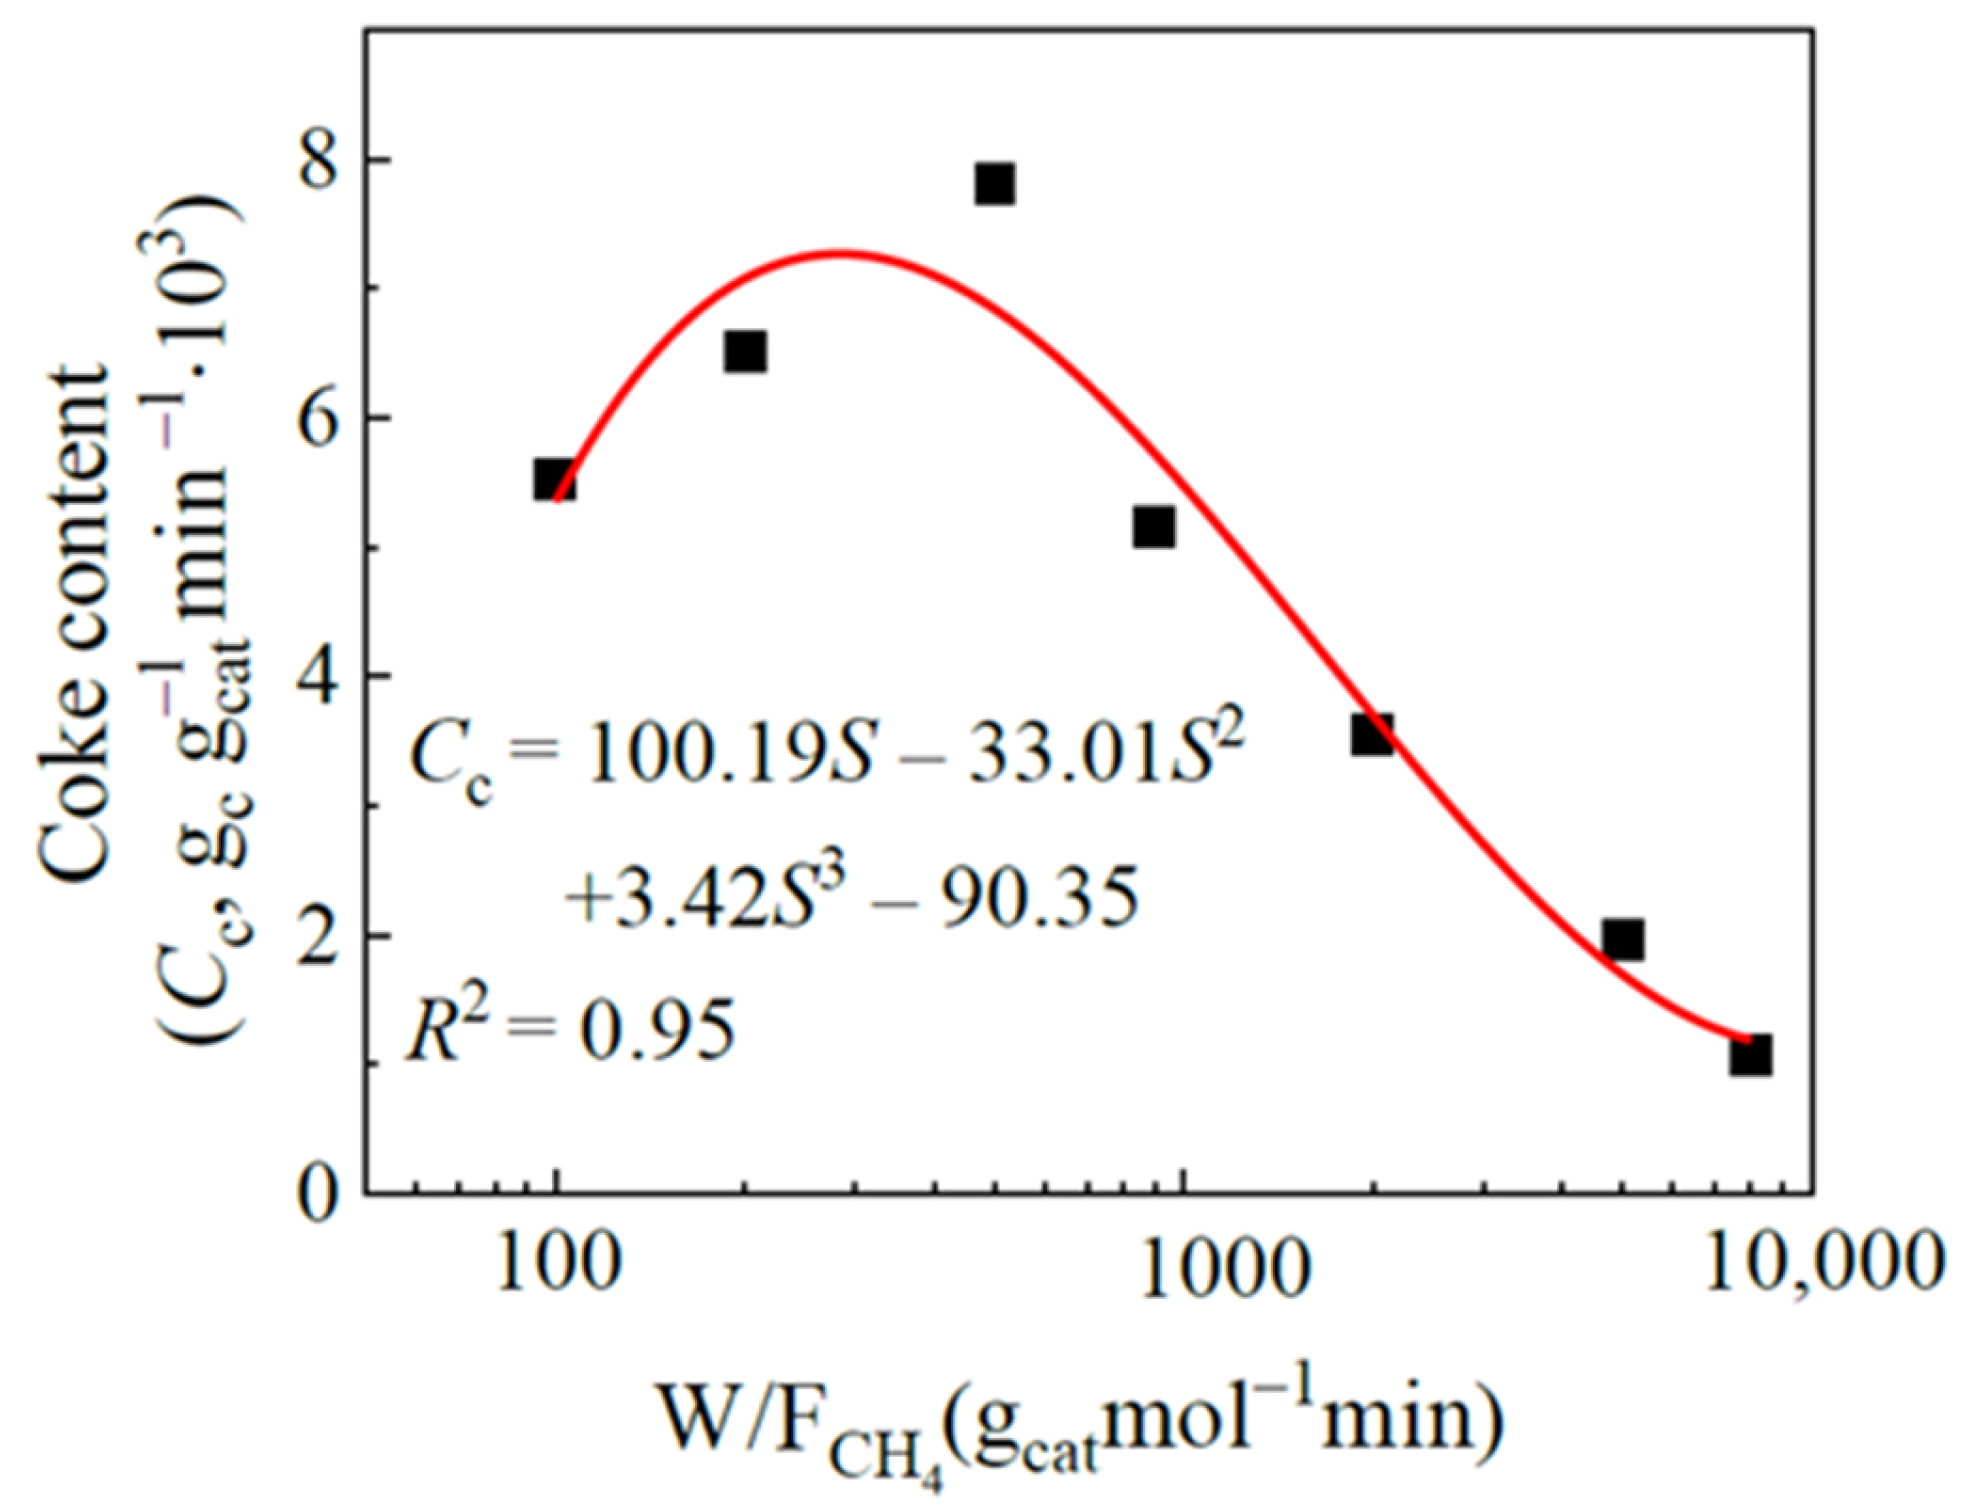
One of the most critical parameters in the DRM process is the composition of the gas inlet. The leading gases at the reactor inlet are methane and carbon dioxide, with nitrogen serving as an inert gas. Nitrogen oxides were not produced because the reaction temperature was generally less than 1500 K. As shown in Figure 5, the carbon deposition was the lowest at 923 K, so the following simulation conditions were all at this temperature.
As shown in Figure 6, the first set of gas composition data was CH4:CO2:N2= 1:1:1, and it was used as a baseline to study the effect of each component on the reaction by changing a single gas. The conversion of reactants was essentially unaffected by altering the nitrogen content at the fixed molar ratio of CH4/CO2. Nitrogen is typically exclusively employed as a reaction’s dilution gas or shielding gas.
Figure 6 also depicts the effect of the ratio of CH4/CO2 on the reactant conversion. The ratio of CH4/CO2 was 0.50:0.67:1.0, and the corresponding CH4 and CO2 conversions were 88.1%:84.2%:78.6% and 66.1%:70.3%:75.4%, respectively. As a result, the inlet components had significant control over the pace at which the reactants converted. The ratio of CH4/CO2 may be increased to achieve a higher carbon dioxide conversion rate; it may be decreased to achieve a higher methane conversion rate. The CH4 and CO2 had a near conversion rate when the ratio was around unity.
Products, in general, tend to be more focused on the DRM process. Figure 7 shows the effects of the ratio of CH4/CO2 on the yields of H2 and CO. The highest results for H2 and CO occurred when the component was CH4:CO2:N2= 1:1:2, and the corresponding yields were 51.8% and 47.1%. The following component was CH4:CO2:N2= 1:1:1.5, with matching yields of 48.7% and 44.7%. Thus, both yields were not significantly different when the molar ratio CH4/CO2 was at unity. The molar rates of CH4 and CO2 at the inlet should be kept constant or close to each other from a balance standpoint to have a higher yield. Although a lower ratio of CH4/CO2 resulted in a higher CH4 conversion rate, it did not effectively increase the amount of product; therefore, side reactions, i.e., reactions (2)–(5), should be considered.
Figure 8 shows the ratio of H2/CO under the different inlet components; obviously, this value can be controlled by a variety of elements. The proportions of H2/CO were 0.76, 1.31, and 1.53, while the ratios of CH4/CO2 were 0.5, 1.0, and 2.0. Therefore, if DRM had a high H2/CO ratio, it would have to run on more CH4. Similarly, it would be essential to function with excess CO2 if DRM had a low H2/CO ratio, and the product ratio would be close to unity at CH4:CO2 = 1:1. As a result, the desired balance of H2/CO can be obtained by adjusting the feed percentage of the reactant gases.

3.4. Coke Formation

The catalyst channel will be blocked after coking on the catalyst surface, resulting in catalyst deactivation. As a result, coke formation is the primary cause of catalyst deactivation [50,57]. Coke is primarily produced by methane cracking in a high-temperature environment, though the Boudouard reaction and carbon gasification will consume some coke as well. The contact spatial time is crucial to the DRM process in a packed bed. In this study, different contact spatial times were obtained by changing the inlet flow rate of CH4 but keeping the solid mass constant.
Figure 9 depicts the coke content as a function of the contact spatial time. The coke content was significantly affected by the contact spatial time; when the coke increased with the contact spatial time, it reached a maximum and then decreased. Many researchers have identified this phenomenon [18,58]. This complex phenomenon was related to methane decomposition, indicating a maximum coking range between the methane flow and catalyst loading. The contact spatial time may need to be appropriately increased if the coke formation is severe.

3.5. Comparison of Conversion in Packed and Fluidized Beds

As discussed above, the issue of carbon deposition is particularly true for packed-bed DRM. To tackle these issues, the development of a DRM process in fluidized beds appears to be one of the solutions since fluidization is known for its high mass and heat transfers and better control over catalyst and gas flows [49,59,60,61,62,63]. In addition to the catalytic performance, mechanical stability is crucial for use in the fluidized bed [48]. Comparing the differences in the DRM process between the packed bed and fluidized bed under proximate operating conditions was therefore another purpose of this study.
Using Abrahamsen and Geldart’s correlation [64], the minimum fluidization velocity was estimated as follows:
U mf = 0.0009 ( ρ p ρ g ) 0.934 g 0.934 d p 1 . 8 μ 0.87 ρ g 0.066 = 0.0055   m / s
Durán et al.’s fluidized-bed experimental setup served as the basis for the simulation. Figure 1b displays the experimental schematic diagram, and Table 2b lists the simulation parameters.
Table 3 contrasts the two reactors’ typical results. Because the kinetic equation employed in this study was developed from other catalyst materials, it may explain why the simulation results for the methane conversion are slightly bigger than the experimental values. Notably, the focus was to compare the reforming effects of packed and fluidized beds. It can be noticed that, under the initial fluidization regime, the conversion rate in the fluidized bed was higher than in the packed bed with less coking. In order to provide practical direction for the design, scale-up, and industrial application of the fluidized-bed DRM process, the next task is to traverse more fluidized beds and examine the conversion rates, yields, and coking phenomena under various flow regimes.

4. Conclusions

In this study, the Eulerian–Lagrangian approach was used to simulate the reaction of DRM in packed- and fluidized-bed settings. The simulation results agree well with the published experimental data. The validated models were used to study the impact of the temperature, inlet composition, and contact spatial time on the performance of the DRM process. The key element that directly influenced the conversion and yield was found to be the temperature, as the methane cracking worsened as it rose. The impact of the side effects on the DRM process was analyzed. It was demonstrated that the excess of carbon dioxide greatly influenced the methane conversion rate. The DRM yields were not significantly affected when the molar ratio of CH4/CO2 was close to unity for different operating conditions. The desired ratio of H2/CO could be obtained by adjusting the feed percentage of the reactant gases. Furthermore, coke formation could properly be reduced by changing the contact spatial time. Finally, it was found that the conversion rate in a fluidized-bed setting was marginally higher than that in the packed-bed setting, but less coking was formed in the case of the fluidized bed.

Author Contributions

Conceptualization, F.A.-O. and A.S.B.; methodology, F.A.-O. and H.X.; software, F.A.-O. and H.X.; validation, F.A.-O. and H.X.; formal analysis, F.A.-O., H.X. and A.S.B.; investigation, F.A.-O. and H.X.; resources, A.S.B. and K.P.; data curation, F.A.-O.; writing—original draft preparation, F.A.-O.; writing—review and editing, A.S.B.; visualization, F.A.-O. and H.X.; supervision, A.S.B.; project administration, A.S.B. and K.P.; funding acquisition, A.S.B. and K.P. All authors have read and agreed to the published version of the manuscript.

Funding

This research was funded by Khalifa University grant number [RC2-2018-024] And The APC was funded by [RC2-2018-024].

Data Availability Statement

The data presented in this study are available on request from the corresponding author. The data are not publicly available due to restrictions imposed by RC2 on sharing data generated by projects sponsored by the Center.

Acknowledgments

The authors acknowledge the financial support from the Center for Catalysis and Separation, Khalifa University of Science and Technology, through grant No. RC2-2018-024. The second author acknowledges the financial support (travel fund) of China Scholarships Council (No. 202106440082).

Conflicts of Interest

The authors declare no conflict of interest.

References

  1. Fan, M.-S.; Abdullah, A.Z.; Bhatia, S. Catalytic Technology for Carbon Dioxide Reforming of Methane to Synthesis Gas. ChemCatChem 2009, 1, 192–208. [Google Scholar] [CrossRef]
  2. Wang, S.; Lu, G.Q.; Millar, G.J. Carbon Dioxide Reforming of Methane To Produce Synthesis Gas over Metal-Supported Catalysts:  State of the Art. Energy Fuels 1996, 10, 896–904. [Google Scholar] [CrossRef]
  3. Sazali, N. Emerging technologies by hydrogen: A review. Int. J. Hydrogen Energy 2020, 45, 18753–18771. [Google Scholar] [CrossRef]
  4. Noh, Y.S.; Lee, K.-Y.; Moon, D.J. Hydrogen production by steam reforming of methane over nickel based structured catalysts supported on calcium aluminate modified SiC. Int. J. Hydrogen Energy 2019, 44, 21010–21019. [Google Scholar] [CrossRef]
  5. Hilliard, S. Water Splitting Photoelectrocatalysis: The Conception and Construction of a Photoelectrocatalytic Water Splitting Cell. Doctoral Dissertation, Université Pierre et Marie Curie-Paris VI, Paris, France, 2016. [Google Scholar]
  6. Turner, J.A. Sustainable hydrogen production. Science 2004, 305, 972–974. [Google Scholar] [CrossRef]
  7. Bahzad, H.; Shah, N.; Dowell, N.M.; Boot-Handford, M.; Soltani, S.M.; Ho, M.; Fennell, P.S. Development and techno-economic analyses of a novel hydrogen production process via chemical looping. Int. J. Hydrogen Energy 2019, 44, 21251–21263. [Google Scholar] [CrossRef]
  8. Gangadharan, P.; Kanchi, K.C.; Lou, H.H. Evaluation of the economic and environmental impact of combining dry reforming with steam reforming of methane. Chem. Eng. Res. Des. 2012, 90, 1956–1968. [Google Scholar] [CrossRef]
  9. Şener, A.N.; Günay, M.E.; Leba, A.; Yıldırım, R. Statistical review of dry reforming of methane literature using decision tree and artificial neural network analysis. Catal. Today 2018, 299, 289–302. [Google Scholar] [CrossRef]
  10. Al-Fatesh, A.S.; Naeem, M.A.; Fakeeha, A.H.; Abasaeed, A.E. Role of La2O3 as Promoter and Support in Ni/γ-Al2O3 Catalysts for Dry Reforming of Methane. Chin. J. Chem. Eng. 2014, 22, 28–37. [Google Scholar] [CrossRef]
  11. Aramouni, N.A.K.; Touma, J.G.; Tarboush, B.A.; Zeaiter, J.; Ahmad, M.N. Catalyst design for dry reforming of methane: Analysis review. Renew. Sustain. Energy Rev. 2018, 82, 2570–2585. [Google Scholar] [CrossRef]
  12. Arora, S.; Prasad, R. An overview on dry reforming of methane: Strategies to reduce carbonaceous deactivation of catalysts. RSC Adv. 2016, 6, 108668–108688. [Google Scholar] [CrossRef]
  13. Bang, S.; Hong, E.; Baek, S.W.; Shin, C.-H. Effect of acidity on Ni catalysts supported on P-modified Al2O3 for dry reforming of methane. Catal. Today 2018, 303, 100–105. [Google Scholar] [CrossRef]
  14. Chen, X.; Sheng, Z.; Murata, S.; Zen, S.; Kim, H.-H.; Nozaki, T. CH4 dry reforming in fluidized-bed plasma reactor enabling enhanced plasma-catalyst coupling. J. CO2 Util. 2021, 54, 101771. [Google Scholar] [CrossRef]
  15. Fujitsuka, H.; Kobayashi, T.; Tago, T. Development of Silicalite-1-encapsulated Ni nanoparticle catalyst from amorphous silica-coated Ni for dry reforming of methane: Achieving coke formation suppression and high thermal stability. J. CO2 Util. 2021, 53, 101707. [Google Scholar] [CrossRef]
  16. Pakhare, D.; Spivey, J. A review of dry (CO2) reforming of methane over noble metal catalysts. Chem. Soc. Rev. 2014, 43, 7813–7837. [Google Scholar] [CrossRef]
  17. Yusuf, M.; Farooqi, A.S.; Alam, M.A.; Keong, L.K.; Hellgardt, K.; Abdullah, B. Response surface optimization of syngas production from greenhouse gases via DRM over high performance Ni–W catalyst. Int. J. Hydrogen Energy 2021, 47, 31058–31071. [Google Scholar] [CrossRef]
  18. Zambrano, D.; Soler, J.; Herguido, J.; Menéndez, M. Kinetic Study of Dry Reforming of Methane Over Ni–Ce/Al2O3 Catalyst with Deactivation. Top. Catal. 2019, 62, 456–466. [Google Scholar] [CrossRef] [Green Version]
  19. Wang, J. Continuum theory for dense gas-solid flow: A state-of-the-art review. Chem. Eng. Sci. 2020, 215, 115428. [Google Scholar] [CrossRef]
  20. Parker, J.; LaMarche, K.; Chen, W.; Williams, K.; Stamato, H.; Thibault, S. CFD simulations for prediction of scaling effects in pharmaceutical fluidized bed processors at three scales. Powder Technol. 2013, 235, 115–120. [Google Scholar] [CrossRef]
  21. Zhang, Y.; Lan, X.; Gao, J. Modeling of gas-solid flow in a CFB riser based on computational particle fluid dynamics. Pet. Sci. 2012, 9, 535–543. [Google Scholar] [CrossRef] [Green Version]
  22. Abbasi, A.; Islam, M.A.; Ege, P.E.; de Lasa, H.I. CPFD flow pattern simulation in downer reactors. AIChE J. 2013, 59, 1635–1647. [Google Scholar] [CrossRef]
  23. Chen, X.; Wang, J. A comparison of two-fluid model, dense discrete particle model and CFD-DEM method for modeling impinging gas–solid flows. Powder Technol. 2014, 254, 94–102. [Google Scholar] [CrossRef]
  24. Andrews, M.J.; O’Rourke, P.J. The multiphase particle-in-cell (MP-PIC) method for dense particulate flows. Int. J. Multiph. Flow 1996, 22, 379–402. [Google Scholar] [CrossRef]
  25. Zhao, P.; O’Rourke, P.J.; Snider, D. Three-dimensional simulation of liquid injection, film formation and transport, in fluidized beds. Particuology 2009, 7, 337–346. [Google Scholar] [CrossRef]
  26. Snider, D.; Banerjee, S. Heterogeneous gas chemistry in the CPFD Eulerian–Lagrangian numerical scheme (ozone decomposition). Powder Technol. 2010, 199, 100–106. [Google Scholar] [CrossRef]
  27. Karimipour, S.; Pugsley, T. Application of the particle in cell approach for the simulation of bubbling fluidized beds of Geldart A particles. Powder Technol. 2012, 220, 63–69. [Google Scholar] [CrossRef]
  28. Abbasi, A.; Ege, P.E.; de Lasa, H.I. CPFD simulation of a fast fluidized bed steam coal gasifier feeding section. Chem. Eng. J. 2011, 174, 341–350. [Google Scholar] [CrossRef]
  29. Chen, C.; Werther, J.; Heinrich, S.; Qi, H.-Y.; Hartge, E.-U. CPFD simulation of circulating fluidized bed risers. Powder Technol. 2013, 235, 238–247. [Google Scholar] [CrossRef]
  30. Berrouk, A.S.; Pornsilph, C.; Bale, S.S.; Du, Y.; Nandakumar, K. Simulation of a Large-Scale FCC Riser Using a Combination of MP-PIC and Four-Lump Oil-Cracking Kinetic Models. Energy Fuels 2017, 31, 4758–4770. [Google Scholar] [CrossRef]
  31. Oloruntoba, A.; Zhang, Y.; Xiao, H. Study on effect of gas distributor in fluidized bed reactors by hydrodynamics-reaction-coupled simulations. Chem. Eng. Res. Des. 2022, 177, 431–447. [Google Scholar] [CrossRef]
  32. Oloruntoba, A.; Zhang, Y.; Xiao, H. Hydrodynamics-reaction-coupled simulations in a low-scale batch FCC regenerator: Comparison between an annular and a free-bubbling fluidized beds. Powder Technol. 2022, 407, 117608. [Google Scholar] [CrossRef]
  33. Xiao, H.; Zhang, Y.; Wang, J. Virtual error quantification of cross-correlation algorithm for solids velocity measurement in different gas fluidization regimes. Chem. Eng. Sci. 2021, 246, 117013. [Google Scholar] [CrossRef]
  34. Xiao, H.; Zhang, Y.; Wang, J. Correlating measurement qualities of cross-correlation based solids velocimetry with solids convection-mixing competing mechanism in different gas fluidization regimes. Chem. Eng. Sci. 2022, 253, 117602. [Google Scholar] [CrossRef]
  35. Yates, J.; Lettieri, P. Fluidized-Bed Reactors: Processes and Operating Conditions; Springer: Cham, Switzerland, 2016; Volume 26. [Google Scholar]
  36. Enos, J.L. Petroleum, Progress and Profits: A History of Process Innovation; MIT Press: Cambridge, MA, USA, 1962. [Google Scholar]
  37. CPFD Software. Available online: https://cpfd-software.com/ (accessed on 12 January 2023).
  38. Snider, D.M. Three fundamental granular flow experiments and CPFD predictions. Powder Technol. 2007, 176, 36–46. [Google Scholar] [CrossRef]
  39. Snider, D.M. An Incompressible Three-Dimensional Multiphase Particle-in-Cell Model for Dense Particle Flows. J. Comput. Phys. 2001, 170, 523–549. [Google Scholar] [CrossRef]
  40. Benguerba, Y.; Dehimi, L.; Virginie, M.; Dumas, C.; Ernst, B. Modelling of methane dry reforming over Ni/Al2O3 catalyst in a fixed-bed catalytic reactor. React. Kinet. Mech. Catal. 2014, 114, 109–119. [Google Scholar] [CrossRef]
  41. Durán, P.; Sanz-Martínez, A.; Soler, J.; Menéndez, M.; Herguido, J. Pure hydrogen from biogas: Intensified methane dry reforming in a two-zone fluidized bed reactor using permselective membranes. Chem. Eng. J. 2019, 370, 772–781. [Google Scholar] [CrossRef] [Green Version]
  42. Wen, C.-Y. Mechanics of Fluidization. In Chemical Engineering Progress Symposium Series; American Institute of Chemical Engineers: New York, NY, USA, 1966. [Google Scholar]
  43. Yang, N.; Wang, W.; Ge, W.; Li, J. CFD simulation of concurrent-up gas–solid flow in circulating fluidized beds with structure-dependent drag coefficient. Chem. Eng. J. 2003, 96, 71–80. [Google Scholar] [CrossRef]
  44. Wehinger, G.D.; Eppinger, T.; Kraume, M. Detailed numerical simulations of catalytic fixed-bed reactors: Heterogeneous dry reforming of methane. Chem. Eng. Sci. 2015, 122, 197–209. [Google Scholar] [CrossRef]
  45. Wehinger, G.D.; Eppinger, T.; Kraume, M. Evaluating Catalytic Fixed-Bed Reactors for Dry Reforming of Methane with Detailed CFD. Chem. Ing. Tech. 2015, 87, 734–745. [Google Scholar] [CrossRef]
  46. Wehinger, G.D.; Kraume, M.; Berg, V.; Korup, O.; Mette, K.; Schlögl, R.; Behrens, M.; Horn, R. Investigating dry reforming of methane with spatial reactor profiles and particle-resolved CFD simulations. AIChE J. 2016, 62, 4436–4452. [Google Scholar] [CrossRef]
  47. Karst, F.; Maestri, M.; Freund, H.; Sundmacher, K. Reduction of microkinetic reaction models for reactor optimization exemplified for hydrogen production from methane. Chem. Eng. J. 2015, 281, 981–994. [Google Scholar] [CrossRef] [Green Version]
  48. Olsbye, U.; Wurzel, T.; Mleczko, L. Kinetic and Reaction Engineering Studies of Dry Reforming of Methane over a Ni/La/Al2O3 Catalyst. Ind. Eng. Chem. Res. 1997, 36, 5180–5188. [Google Scholar] [CrossRef]
  49. Wurzel, T.; Malcus, S.; Mleczko, L. Reaction engineering investigations of CO2 reforming in a fluidized-bed reactor. Chem. Eng. Sci. 2000, 55, 3955–3966. [Google Scholar] [CrossRef]
  50. Yin, L.; Wang, S.; Lu, H.; Ding, J.; Mostofi, R.; Hao, Z. Simulation of effect of catalyst particle cluster on dry methane reforming in circulating fluidized beds. Chem. Eng. J. 2007, 131, 123–134. [Google Scholar] [CrossRef]
  51. Abbas, S.Z.; Dupont, V.; Mahmud, T. Kinetics study and modelling of steam methane reforming process over a NiO/Al2O3 catalyst in an adiabatic packed bed reactor. Int. J. Hydrogen Energy 2017, 42, 2889–2903. [Google Scholar] [CrossRef]
  52. de la Cruz-Flores, V.G.; Martinez-Hernandez, A.; Gracia-Pinilla, M.A. Deactivation of Ni-SiO2 catalysts that are synthetized via a modified direct synthesis method during the dry reforming of methane. Appl. Catal. A Gen. 2020, 594, 117455. [Google Scholar] [CrossRef]
  53. Mark, M.F.; Maier, W.F.; Mark, F. Reaction kinetics of the CO2 reforming of methane. Chem. Eng. Technol. 1997, 20, 361–370. [Google Scholar] [CrossRef]
  54. Benguerba, Y.; Dehimi, L.; Virginie, M.; Dumas, C.; Ernst, B. Numerical investigation of the optimal operative conditions for the dry reforming reaction in a fixed-bed reactor: Role of the carbon deposition and gasification reactions. React. Kinet. Mech. Catal. 2015, 115, 483–497. [Google Scholar] [CrossRef]
  55. Chen, S.; Zaffran, J.; Yang, B. Dry reforming of methane over the cobalt catalyst: Theoretical insights into the reaction kinetics and mechanism for catalyst deactivation. Appl. Catal. B Environ. 2020, 270, 118859. [Google Scholar] [CrossRef]
  56. Nikoo, M.K.; Amin, N.A.S. Thermodynamic analysis of carbon dioxide reforming of methane in view of solid carbon formation. Fuel Process. Technol. 2011, 92, 678–691. [Google Scholar] [CrossRef] [Green Version]
  57. Niu, J.; Liland, S.E.; Yang, J.; Rout, K.R.; Ran, J.; Chen, D. Effect of oxide additives on the hydrotalcite derived Ni catalysts for CO2 reforming of methane. Chem. Eng. J. 2019, 377, 119763. [Google Scholar] [CrossRef]
  58. Kumar, M.; Srivastava, V.C. Simulation of a Fluidized-Bed Reactor for Dimethyl Ether Synthesis. Chem. Eng. Technol. 2010, 33, 1967–1978. [Google Scholar] [CrossRef]
  59. Prasad, P.; Elnashaie, S.S.E.H. Novel Circulating Fluidized-Bed Membrane Reformer for the Efficient Production of Ultraclean Fuels from Hydrocarbons. Ind. Eng. Chem. Res. 2002, 41, 6518–6527. [Google Scholar] [CrossRef]
  60. Jing, Q.; Lou, H.; Mo, L.; Zheng, X. Comparative study between fluidized bed and fixed bed reactors in methane reforming with CO2 and O2 to produce syngas. Energy Convers. Manag. 2006, 47, 459–469. [Google Scholar] [CrossRef]
  61. Thiemsakul, D.; Kamsuwan, C.; Piemjaiswang, R.; Piumsomboon, P.; Chalermsinsuwan, B. Computational fluid dynamics simulation of internally circulating fluidized bed reactor for dry reforming of methane. Energy Rep. 2022, 8, 817–824. [Google Scholar] [CrossRef]
  62. Xiao, H.; Zhang, Y.; Hua, Y.; Oloruntoba, A. Quantitative comparison of measurement quality of cross-correlation based particle velocity instruments in different gas fluidization regimes. Adv. Powder Technol. 2021, 32, 3915–3926. [Google Scholar] [CrossRef]
  63. Aguedal, L.; Semmar, D.; Berrouk, A.S.; Azzi, A.; Oualli, H. 3D vortex structure investigation using large eddy simulation of flow around a rotary oscillating circular cylinder. Eur. J. Mech.-B Fluids 2018, 71, 113–125. [Google Scholar] [CrossRef]
  64. Abrahamsen, A.R.; Geldart, D. Behavior of gas-fluidized beds of fine powder part I: Homogeneous expansion. Powder Technol. 1980, 26, 35–46. [Google Scholar] [CrossRef]
Figure 1. The schematic diagram of the reactor.
Chemengineering 07 00057 g001
Figure 2. Rate of the conversion and yield over time at the reactor outlet. (a) T = 723 K, (b) T = 923 K.
Chemengineering 07 00057 g002
Figure 3. Conversion of experiment and simulation for different temperatures [40]. (a) CH4; (b) CO2.
Chemengineering 07 00057 g003
Figure 4. Effect of the reaction temperature on products. (a) Yield; (b) ratio of H2/CO.
Chemengineering 07 00057 g004
Figure 5. Effect of temperature on coke deposition, with the coke content represented by the coking amount per minute per gram of catalyst.
Chemengineering 07 00057 g005
Figure 6. Conversion of CH4 and CO2 at T = 923 K under the different inlet components.
Chemengineering 07 00057 g006
Figure 7. Yields of H2 and CO at T = 923 K under the different inlet components.
Chemengineering 07 00057 g007
Figure 8. Ratio of H2 over CO at T = 923 K under the different inlet components.
Chemengineering 07 00057 g008
Figure 9. Effects of contact spatial time on coke content (T = 923 K, CH4:CO2:N2 = 1:1:1.5). Here, the coke content represents the coking amount per minute per gram of catalyst. W represents the catalyst mass.
Chemengineering 07 00057 g009
Table 2. Gas and solid properties, operating conditions, and geometries of the simulated reactors. (a) Packed bed [40]; (b) fluidized bed [41].
(a)(b)
ParametersValueParametersValue
Operating pressure, P (Pa)101,325Operating pressure, P (Pa)101,325
Operating temperature, T (K)723–923Operating temperature, T (K)773
Gas density, ρg (kg/m3)1.2Gas density, ρg (kg/m3)0.456
Gas viscosity, μ (Pa·s)1.8 × 10⁻⁵Gas viscosity, μ (Pa·s)3.62 × 10⁻⁵
Particle density, ρp (kg/m3)1500Particle density, ρp (kg/m3)1250
Average particle diameter, d p ¯ (mm)0.32Particle diameter, dp (μm)106–180
Particle volume fraction at close pack0.6Particle volume fraction at close pack0.2
CH4/CO2 feed ratio1:1CH4/CO2 feed ratio1:1
CH4/N2 feed ratio1:8CH4/N2 feed ratio1:1.3
Diameter, D (m)0.008Diameter, D (m)0.03
Length, L (m)0.22Length, L (m)0.03
Inlet flow rate, mL/min52.2Column height, H (m)0.3
Drag modelWenYu-Ergun [42]Static bed height, Hs (m)0.15
-Superficial gas Ug velocity, (m/s)0.0064–0.15
Drag modelEMMS [43]
Table 3. Durán et al. [41] verified the fluidized bed’s performance against a packed bed with similar operating conditions.
BedP (bar)Ug (m/s)T (K)CH4:CO2:N2 (Mole)XCH4, Exp.XCH4, Sim.Coke Content (gc/gcat/min/103)
Packed bed1.0 0.005773.0 1:1:1.3-26.6%2.30
Bubbling fluidized bed 1.0 0.006773.0 1:1:1.321.0% 29.7%1.92
Disclaimer/Publisher’s Note: The statements, opinions and data contained in all publications are solely those of the individual author(s) and contributor(s) and not of MDPI and/or the editor(s). MDPI and/or the editor(s) disclaim responsibility for any injury to people or property resulting from any ideas, methods, instructions or products referred to in the content.

