Article

Heterogeneous Photodegradation Reaction of Phenol Promoted by TiO2: A Kinetic Study

Department of Chemical Sciences, University of Naples “Federico II”, IT-80126 Naples, Italy
*
Author to whom correspondence should be addressed.
ChemEngineering 2023, 7(2), 27; https://doi.org/10.3390/chemengineering7020027
Submission received: 8 February 2023 / Revised: 16 March 2023 / Accepted: 22 March 2023 / Published: 24 March 2023

Abstract

:
Phenol is widely used in industry. Due to its high stability and toxicity, it represents a threat to the environment and human health. In this study, a kinetic investigation of phenol heterogeneous photodegradation was conducted using commercial Aeroxide P-25, performing experiments in a wide range of conditions. In detail, a negligible adsorption effect was detected. An activation energy of Ea = 14.3 ± 0.5 kJ mol−1 was measured, and the catalyst loading effect indicated an optimal condition due to the shield of the catalyst particles to the UV irradiation. The catalyst was most active at pH = 7 and it was stable for 25 h of reaction time; thus, it will be worth to investigate its application in flow.

1. Introduction

Phenol is one of the most common building blocks in the chemical industry, with a global annual production of approximately 10 million tons [1]; its major applications are in the production of bisphenol A, phenolic resins, caprolactam, aniline, and alkylphenols [2], and it is also widely employed in petrol, pharmaceutical and metallurgic industries and in pesticides, explosives, dyes, and textiles production [3]. Phenol and its derivatives are extensively present in the environment; they can result from a wide range of natural processes, such as the decomposition of organic matter, biosynthesis by fungi and plants [2,4], or tyrosine transformation in mammalian digestive tracts [5]. A consistent aspect of the presence of phenols in the ecosystem is related to human activity. As mentioned above, phenols are widely used in the chemical, petrol, tinctorial, and pharmaceutical industries, and their presence is related to the use and production of phenoxy herbicides and phenolic biocides [6]. These pollutants can drain off municipal or industrial sewage to surface water or be emitted into the atmosphere as a result of combustion processes. The total phenol concentration of industrial effluents is typically in the range of 300–400 mg/L [7]. Every year in Europe, more than 1.6 million tons of phenol is consumed in manufacturing, of which 11,200 tons is discharged into the environment [8]. Phenol is a highly toxic substance, with peroxidative capacity, is hematotoxic and hepatotoxic, and causes histopathological changes and mutagenesis toward humans and other living organisms [6]. Moreover, phenol is toxic to marine lifeforms, including algae, protozoa, invertebrates, and vertebrates, with noxious effects which include reduced fertility, decreased survival of the young, and the inhibition of growth [9]. A value of 140 mg/kg was reported as the minimum lethal oral dose for humans [6]. Due to its toxicity, phenol disposal limits are strict: in Italy, the maximum phenol concentration in wastewater is 0.5 mg/L in superficial water and 1 mg/L in sewers [10]; the United States Environmental Protection Agency set a maximum concentration of phenol in wastewater of 0.1 mg/L [11]. Due to the refractory nature of phenol towards degradation by microorganisms, conventional biological methods are not effective for its removal from water [12]. For this reason, it is of great technological interest to develop methods capable of degrading phenol completely or converting this refractory species into smaller molecules, which can eventually be further oxidized by biological methods.
Wastewater treatment technologies are mainly based on phase separation techniques, such as adsorption processes and stripping, and destructive methods, such as biological and chemical oxidation and reduction. The problem with separation techniques is the necessity of the final disposal of the pollutants after their separation from the effluent. Appropriately developed methods based on oxidation, instead, generally give a complete solution to the problem of pollutant removal [9]. Oxidation methods aim to convert the pollutants to carbon dioxide, water, and inorganics (mineralization) or, at least, transform them into harmless products. Above concentrations of 300 mg/L, phenol exerts a bactericidal action, which prevents biological oxidation methods from being effective for its removal [13]. Nowadays, advanced oxidation processes (AOPs) have a prominent role in wastewater treatment research due to their potential to degrade recalcitrant compounds in mild conditions [14,15]. AOPs are defined as water treatment processes that involve the generation of hydroxyl radicals in sufficient quantity to affect water purification [16]. The hydroxyl radical (•OH) rapidly attacks most organic species and initiates a complex cascade of oxidative reactions that can lead to mineralization or to the formation of oxidation products that are sometimes less toxic and more susceptible to bioremediation than the starting species [17], making AOPs promising in the field of wastewater treatment. There are different kinds of AOPs, which can employ homogeneous or heterogeneous catalysis and different sources of energy (light radiation, ultrasound, and electrical) for the production of the hydroxyl radical. Among AOPs, heterogeneous photocatalysis has shown great potential as an efficient technique for the degradation of both aquatic and atmospheric organic contaminants [18,19].
One of the advantages of heterogeneous photocatalysis in comparison to the homogeneous phase processes is the possibility to readily separate and reuse the catalyst, thus reducing costs and environmental issues related to the process [20]. Heterogeneous photocatalysis involves the acceleration of a photochemical reaction on the surface of a photocatalyst, which is a semiconductor material; the only difference from conventional catalysis is the mode of activation of the catalyst: in photocatalysis, thermal activation is replaced by photonic activation. Photodegradation catalysts are typically semiconductor (SC) oxides or sulfides, characterized by a particular value of the band-gap energy, which is the energy difference between the conduction band and the valence band of the material [21,22]. Photocatalytic initiation takes place when the catalyst absorbs a photon whose energy, , is greater than the semiconductor band gap, thus promoting an electron (e) from the valence band to the conduction band, leaving an electron hole (h+) in the valence band (photoexcitation process). The fluid-phase molecules are then adsorbed on the solid and electron transfer takes place from solid surface to acceptor molecules (O2) and from donor molecules (H2O) to the solid [14], resulting in the formation of the radicals responsible for the oxidative degradation of the organic species present in the solution. Electron–hole recombination must be prevented because it reduces the process efficiency and brings photoelectric energy dispersion in the form of light or heat. The efficiency of the photodegradation reactions mainly depends on the following parameters: light intensity [23,24,25]; nature and concentration of the substrate [20,26,27]; nature, morphology, and concentration of the photocatalyst [27,28,29,30,31,32,33]; solution pH [28,34,35]; and the reaction temperature [36,37,38]. Non-selectivity, high activity, stability to high temperatures, mechanical stability, and resistance to poisoning are required for a photocatalyst to be employed for industrial applications [39]. Moreover, for a semiconductor photocatalyst to be efficient, the interfacial redox processes involving e and h+ must compete effectively with their recombination. Titanium dioxide displays almost all the above properties, with the downside that it does not absorb visible light [28,36]. This material has become a standard photocatalyst in environmental photodegradation processes for a wide variety of organics. The commercial TiO2 photocatalyst Aeroxide P-25 consists of a nano-powder comprising a mixture of a crystalline phase, containing the two crystalline structures anatase and rutile in an approximate proportion of 80/20, and a small amount of amorphous phase. In P-25, the average sizes of the anatase and rutile elementary particles are 85 and 25 nm, respectively, while the surface area is approximately 50 m2/g and the pore diameter is 14.3 nm [40]. This catalyst has been extensively used in the study of heterogeneous photodegradation processes and has been found to be more active than both the pure crystalline phases in many different systems [40], using both pure and modified P-25 [41]. The high activity arises from the increase in the efficiency of the electron–hole separation due to the multiphase nature of the particles [42]. Guo et al. [43] identified some phenol photodegradation intermediates and proposed the following reaction mechanism: the hydroxyl radicals attack the phenyl ring, yielding catechol, resorcinol, and hydroquinone; then, the phenyl rings in these compounds break up to give malonic acid; then, short-chain organic acids such as maleic, oxalic, acetic, and formic acid are produced; and finally, CO2 is emitted. Despite the interest, systematic kinetic investigations are still missing from the literature, to investigate the influence of the main operation conditions on the photodegradation reaction. This study is surely needed to scale up the photodegradation to a system in flow, as the kinetic parameters are needed to design a continuous device. Thus, this study was mainly focused on performing a kinetic analysis of the heterogeneous photodegradation reaction of phenol in the presence of the commercial photocatalyst Aeroxide P-25 in a discontinuous system, with the aim of providing the Arrhenius plot and the kinetic parameters (kinetic constant, frequency factor, and activation energy) for the process. Moreover, the effects of many operational parameters (temperature, initial phenol concentration, and solution pH) on the reaction kinetics were studied, with the aim of performing a system optimization.

2. Materials and Methods

2.1. Materials

Phenol solutions were obtained from crystalline phenol (C6H6O) ≥ 99% (Sigma-Aldrich, St. Louis, MO, USA); meanwhile, nitric acid (HNO3) aqueous solution ≥ 65%, and sodium hydroxide (NaOH) pellets ≥ 98% (Sigma-Aldrich) were used in pH-controlled experimental runs.
The catalyst used in most experimental runs was Aeroxide P-25, supplied by Evonik Industries. Table 1 lists the properties of this catalyst [44].

2.2. Methods

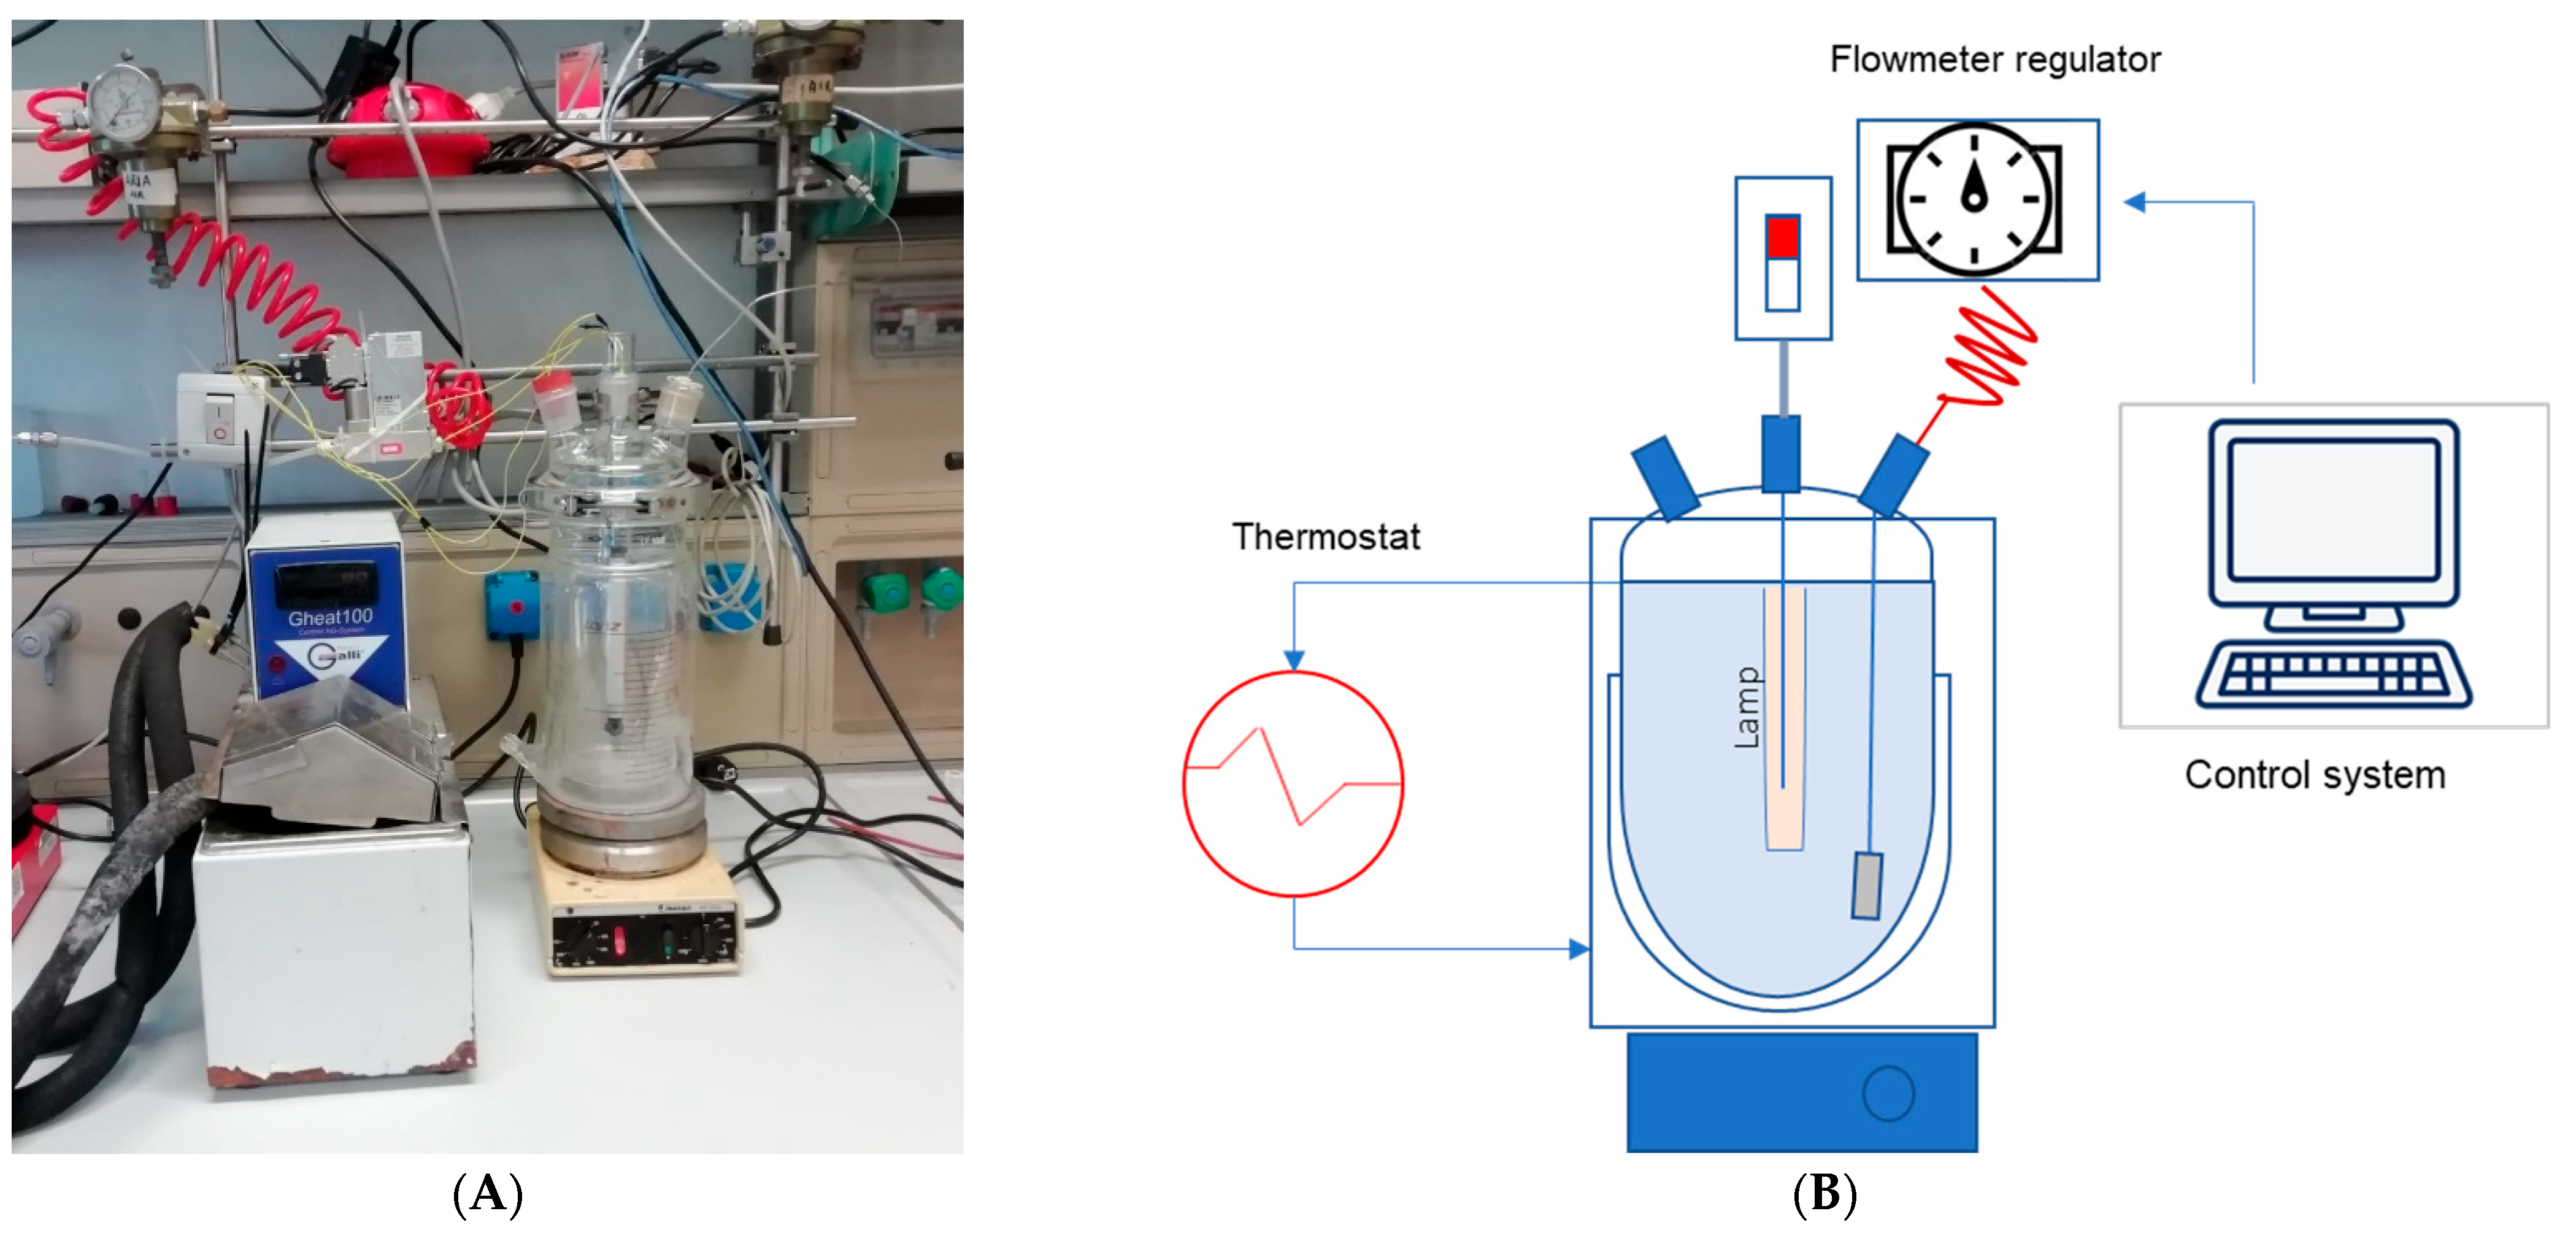
2.2.1. Experimental Procedures

The kinetic experiments were conducted in a 1 L capacity glassy jacketed reactor, characterized by an inner diameter of 10 cm and an inner length of 18 cm (see picture and sketch depicted in Appendix A, Figure A1). As demonstrated, the lamp was installed coaxially to the photoreactor, fixed in the central neck of the reactor head. A magnetic stirrer was used to ensure good mixing of the suspension, while air was fed to the liquid solution via a gas flowmeter regulator, connected to a 25 µm sintered filter, used as a sparger, immerged in the liquid solution. Temperature was controlled via an external ultra-thermostat connected to the jacket of the reactor.
The experiments were carried out using the following procedure: the necessary amount of phenol was weighted on an analytical balance under a fume hood and dissolved in water in a 1 L glass flask; the solution was transferred in the glass reactor with a capacity of 1.5 L and a sample was collected to check the initial phenol concentration of the solution. The magnetic stirrer was turned on at 750 rpm and the thermostat was set to the desired temperature (see Table 2). The air tank was opened, the air pressure was regulated at atmospheric pressure (1 bar) with a pressure reducer, and the digital flow meter was set to maximum in order to maintain the air flow rate in the system at 57.94 mL min−1. To start the photodegradation reaction, the necessary amount of catalyst was weighted on an analytical balance and transferred to the reactor. The lamp was turned on, representing the beginning of the photodegradation experiment, and aluminum foil was wrapped around the reactor to minimize light dispersion. The lamp used for irradiation was a Toshiba FL4BLB, with a power of 4 W and emission centered at the wavelength of 365 nm, potential difference of 220 V, length of 15 cm, and width of 1.5 cm. The irradiance of the lamp in the experimental apparatus was calculated to be 510 W/m2. All experimental runs had a duration of five hours, and eight samples were collected in the time (0, 30, 60, 90, 120, 180, 240, and 300 min) for each experiment to check the phenol concentration in the solution throughout the reaction. Before analysis, the samples were centrifuged at 3200 rpm for 30 min and filtered to separate the catalyst particles from the solution to perform chromatographic analyses. In some runs, it was necessary to control the solution pH: this was achieved using 0.05 M HNO3 and 5 × 10⁻⁴ M NaOH solutions. Each sample was analyzed three times to retrieve the experimental error bars, calculated as the standard deviation, reported in the figures in the Results and Discussion.
At the end of every test, the solution was cooled and then transferred into a 1 L glass bottle through a glass funnel. The solution was then vacuum filtered with a Büchner funnel and a flask for catalyst recovery. The digital flow meter was calibrated using a bubble counter in which soap was used to keep track of the flowing air to measure the airflow rate at different setpoints of the instrument. The flow rate was measured for 10% setpoint increments and a calibration curve was obtained by indicating the measured airflow rate as a function of the instrument’s setpoint.
Linear regression of the experimental data gave the following flow meter calibration (Equation (1)):
A i r   f l o w   r a t e   mL min = 0.579 ± 0.003   · S e t p o i n t %
For all the reported tests, the percent removal of phenol was calculated by Equation (2):
X p h e n o l = C 0 C C 0   · 100
where 𝐶0 and 𝐶 correspond to the phenol concentration (ppm) at the start and during the reaction.
The experimental conditions adopted in the present study are listed in Table 2.
The reusability of the catalyst was tested by conducting a dedicated experiment, adopting the experimental conditions of test 8. The catalyst at the end of each kinetic run was recovered by filtration, washed with water, and dried under vacuum at 70 °C prior its reutilization. The photocatalyst was then reused for a new kinetic experiment, for 5 cycles.

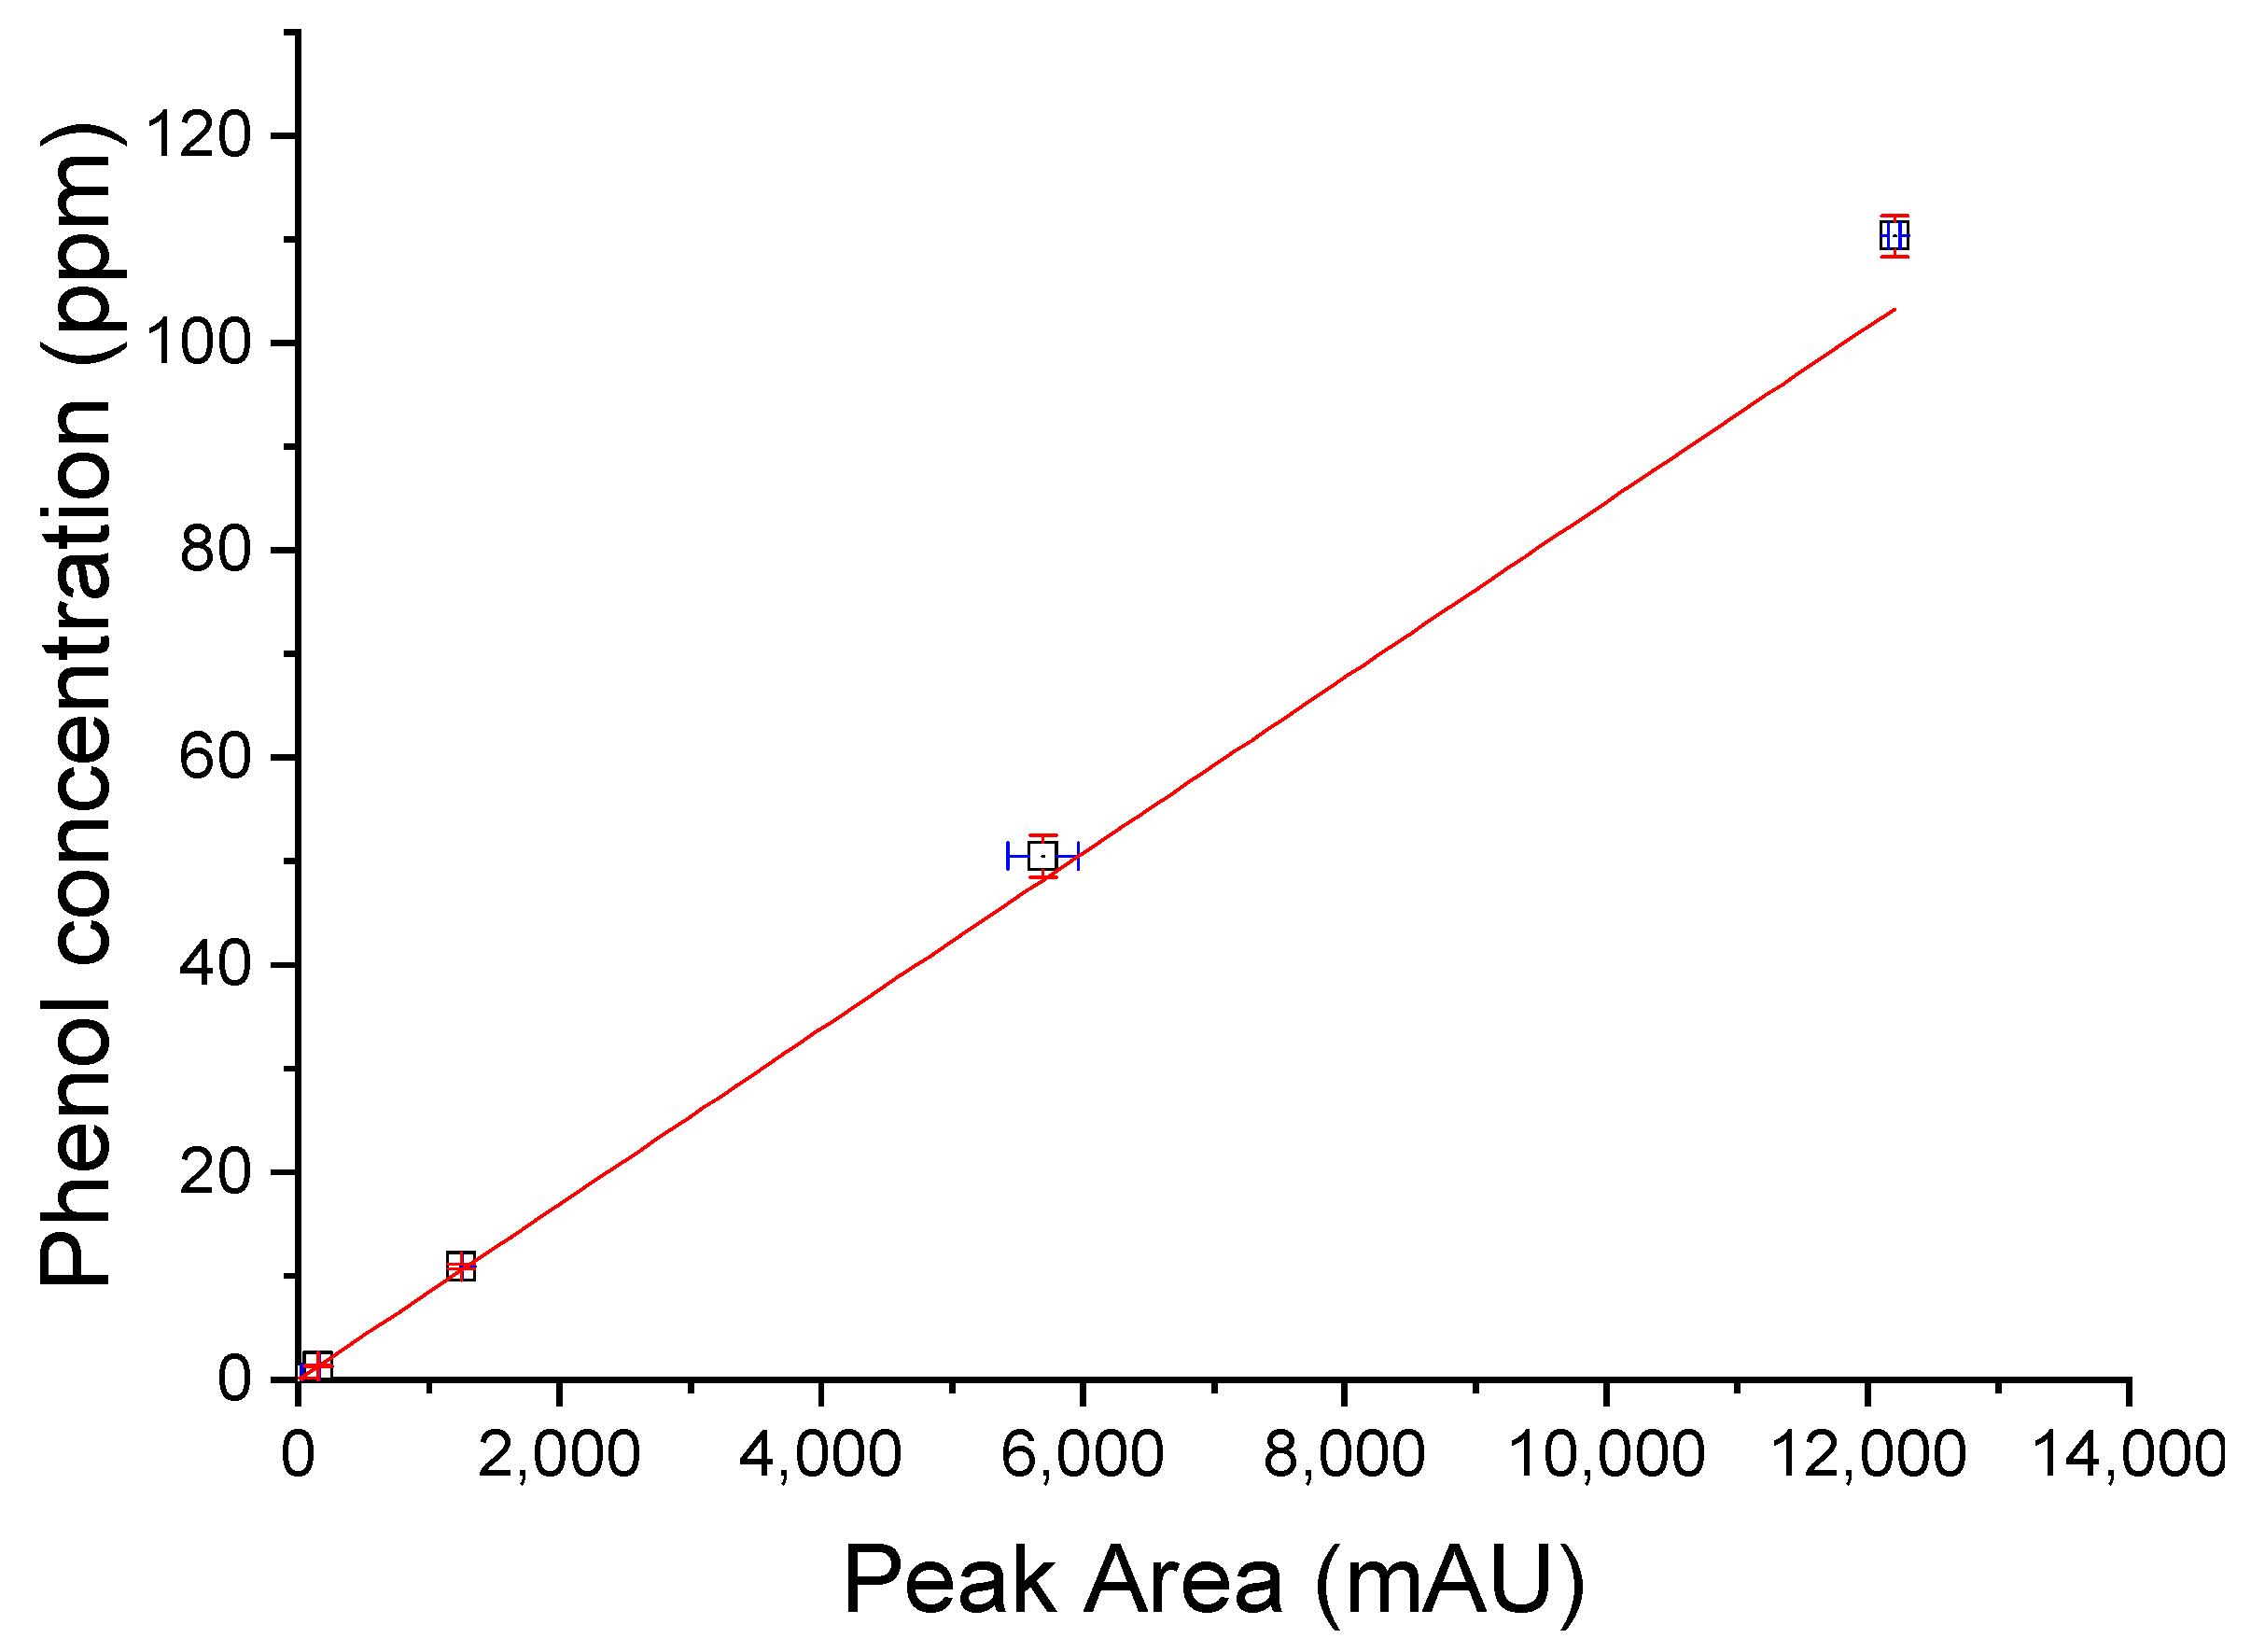
2.2.2. Analytical Method

Phenol concentration analyses were carried out using an Agilent 1100 High-Pressure Liquid Chromatography (HPLC) system, with a 70% w/w methanol, 30% w/w water mobile phase. The column used was a Phenomenex Luna C18, with a 5 μm particle size, 100 Å pore size, 250 mm length, and 4.6 mm internal diameter. A Diode Array Detector (DAD) was used, with a 1024-element photodiode array, deuterium, and tungsten lamps with a 190–950 nm wavelength range. The absorbance peak of phenol corresponded to λ = 270 nm.
The software used for apparatus control and data collection was Agilent ChemStation. This system was used to create a calibration curve to determine the phenol concentration over time. The curve was obtained by indicating the area of the chromatographic peaks of phenol standard as a function of phenol concentration for five different solutions: 0.1, 1.5, 10, 50, and 110 ppm (Figure 1).
The equation obtained by linear regression gives phenol concentration (C) as a function of the area of the chromatographic peak (Equation (3)):
C = 0.0085   ± 0.0005 · P e a k   A r e a
The R2 value obtained by linear regression is 0.98, confirming the goodness of fit.

2.2.3. Characterization of the Photocatalyst

The surface morphology of Aeroxide P-25 was examined by field emission scanning electron microscopy (SEM). SEM images were obtained with FEI Nova NanoSEM 450 emission SEM apparatus at an accelerating voltage of 5 kV (range of acceleration voltage: 50 V to 30 kV) equipped with a Through-Lens Detector (TLD). The sample was sputter-coated with a thin layer of Au–Pd before imaging. Morphological properties were also investigated using TEM: samples were prepared by placing a drop of the nanohybrid suspension on one side of a 200-mesh carbon-coated copper grid. Bright-field TEM images were obtained on the dried sample using an FEI TECNAI G2 200 kV s- twin microscope (Thermo Fisher Scientific, Waltham, MA, USA) equipped with lenses for high-resolution imaging. Wide-angle X-ray scattering measurements (WAXS) of P-25 samples were obtained using nickel-filtered CuKα radiation with a Philips automatic diffractometer (Empyrean by Panalytical, Malvern, UK).

3. Results and Discussion

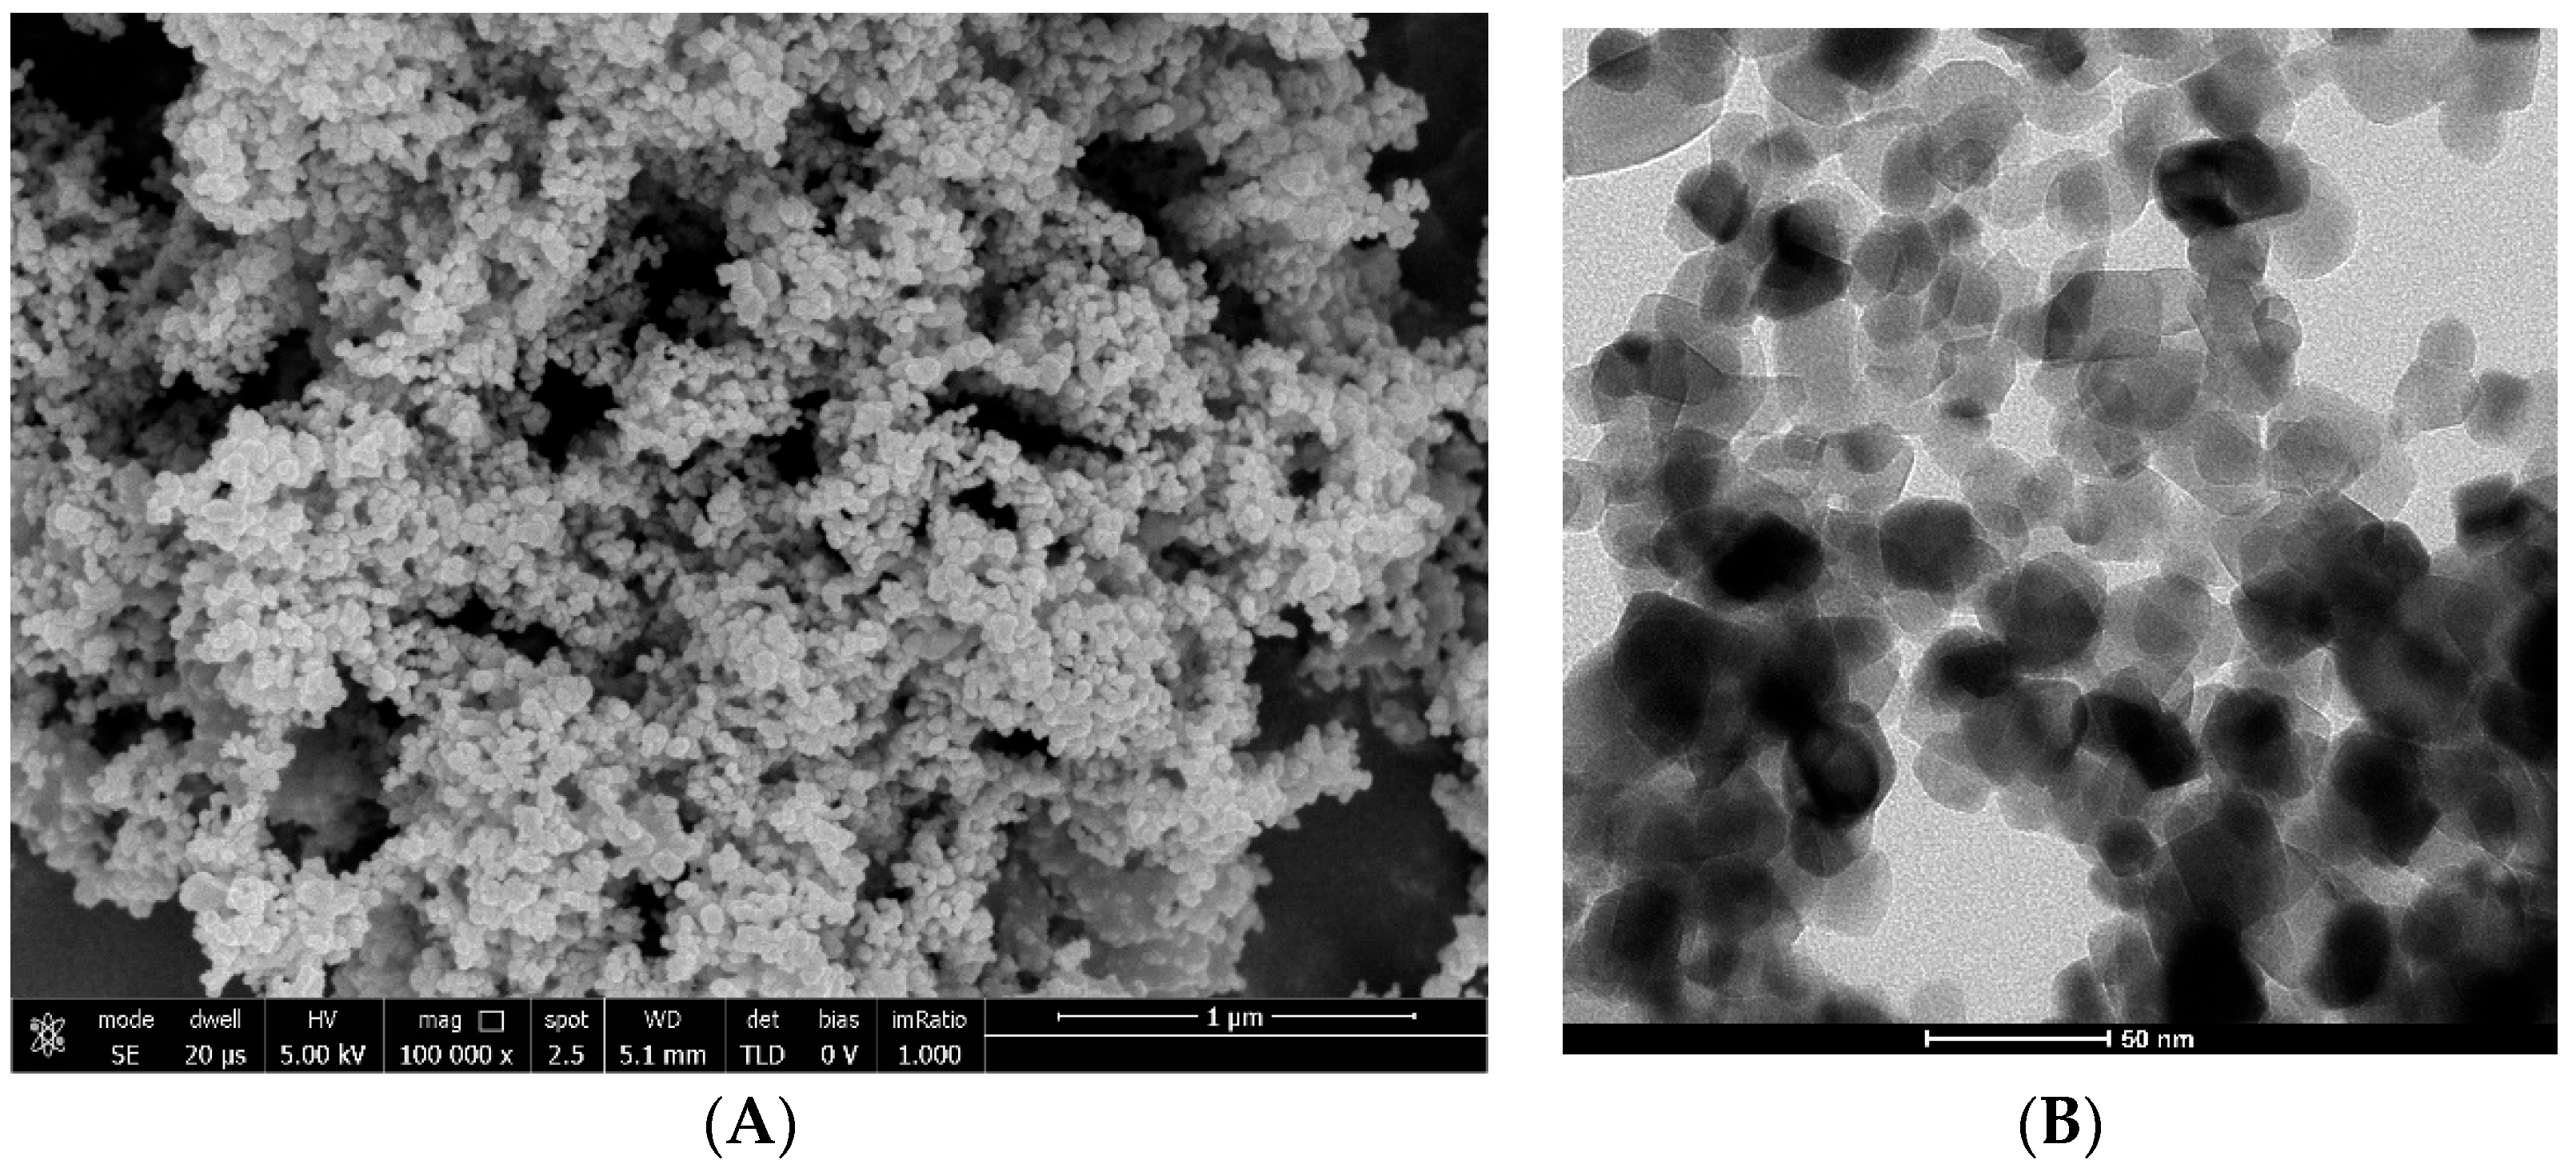
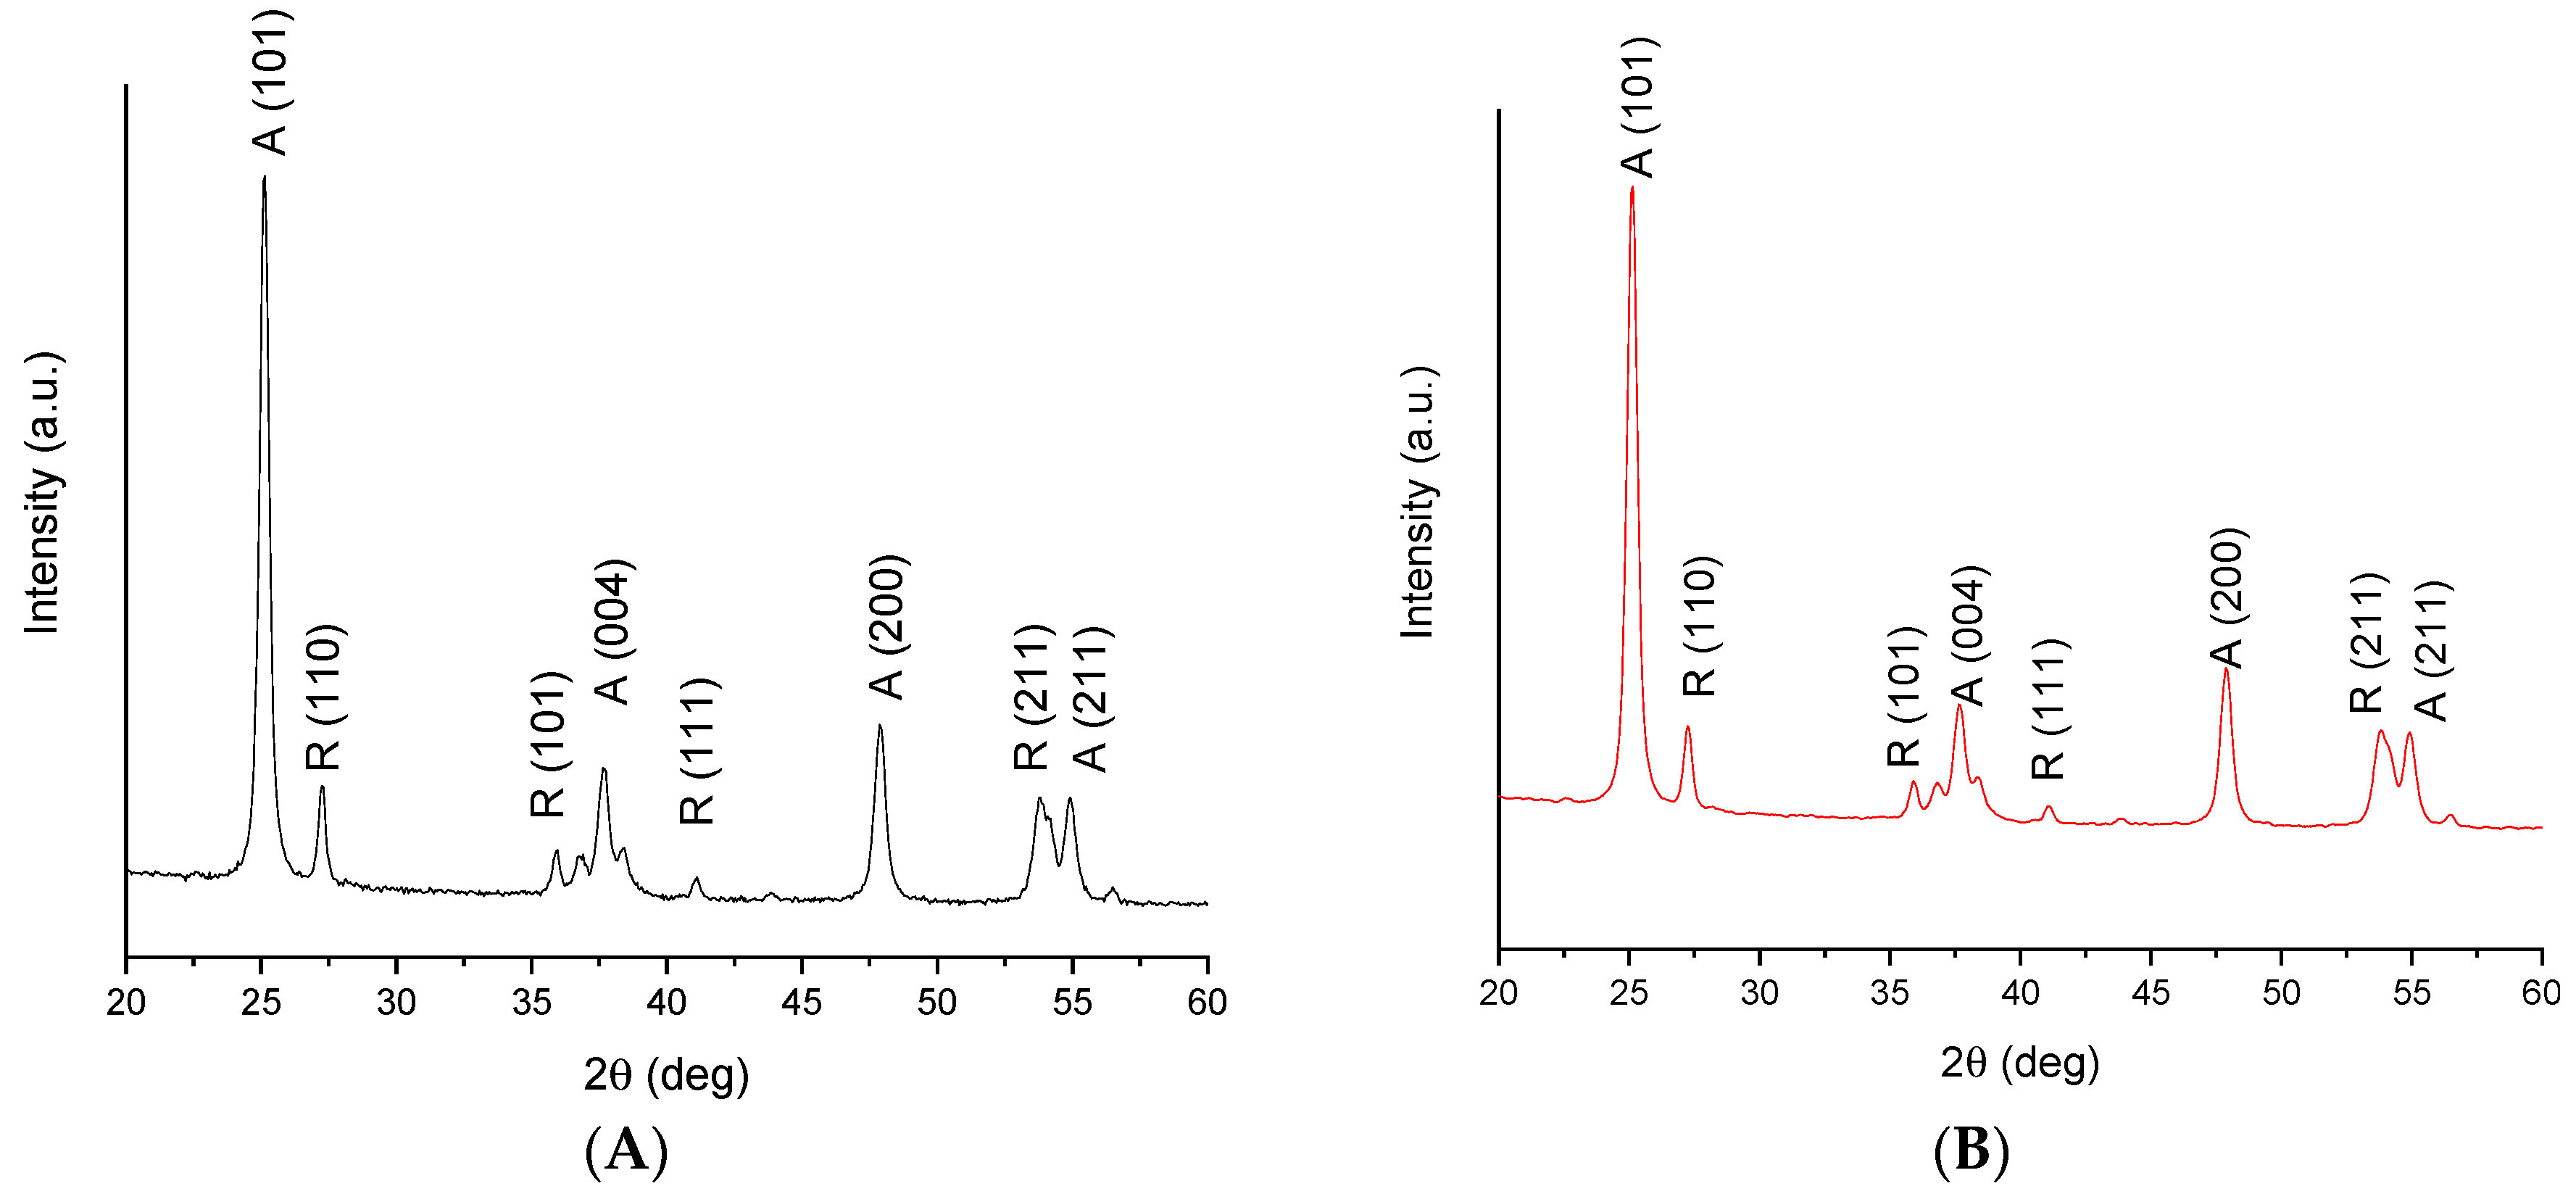
3.1. Aeroxide P-25 Characterization

The commercial sample of Aeroxide P-25 was characterized to verify the main morphological properties. SEM and TEM analyses confirmed that the sample consisted of sphere-like grains with average dimensions of 25 nm (Figure 2A,B).
The XRD pattern confirmed that the sample consisted of TiO2 (Figure 3). Several peaks were detected: peaks (1 1 0), (1 0 1), (1 1 1), and (2 1 1) can be attributed to the rutile crystalline phase (R); peaks (1 0 1), (0 0 4), and (2 0 0) can be attributed to the anatase phase (A) [45]. The average crystallite grain size was calculated using the Scherrer equation, obtaining 28 nm and 23 nm for rutile and anatase phases, respectively. Values were calculated from the diffraction peaks at 2θ = 54.1° and 25.3°, confirming the values estimated from TEM images.
The mass fraction of anatase phase (xA) was calculated adopting the following equation [46], Equation (4):
x A = 1 1 + 1.26 I R / I A
where, IR and IA correspond to the intensities of the strongest rutile and anatase peaks, respectively. From the calculations, a value of 0.79 was obtained, confirming the values reported in Table 1, given by the catalyst supplier.

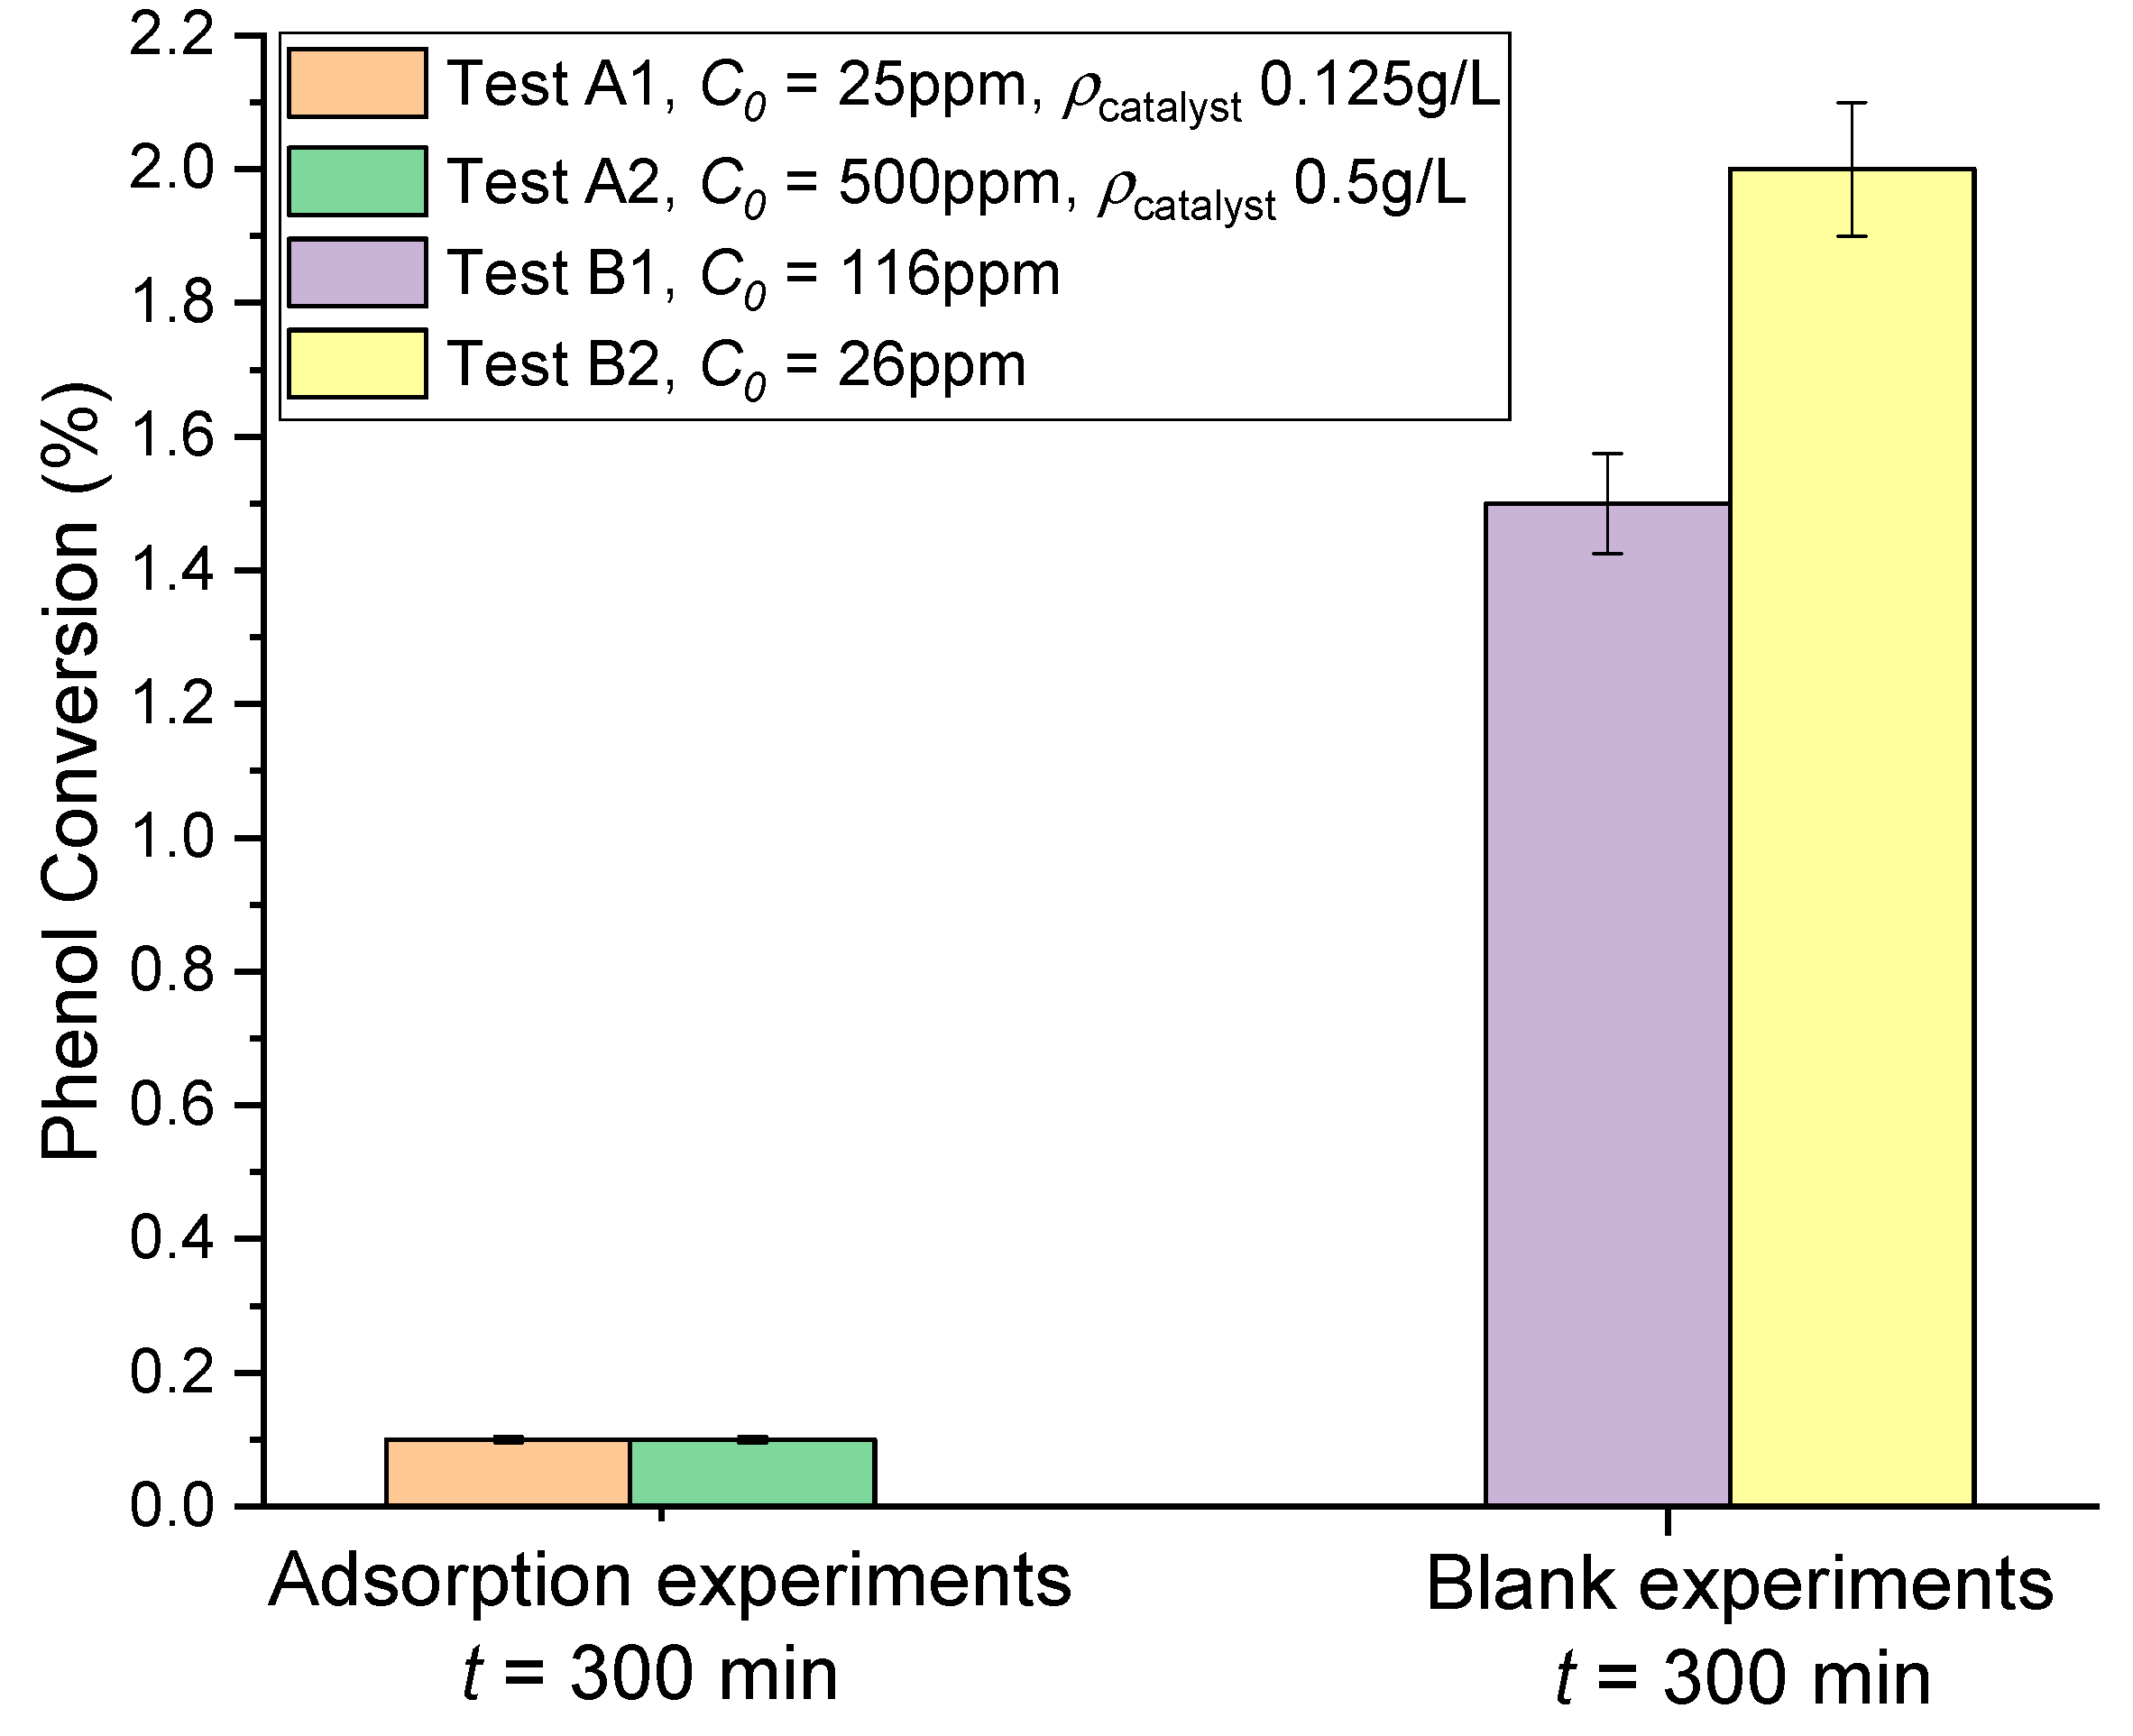
3.2. Adsorption and Blank Tests

Preliminary phenol adsorption tests in the presence of P-25 were carried out, showing no variation in phenol concentration after five hours. The results are reported in Figure 4 (tests A1 and A2 in Table 2).
To evaluate phenol degradation due solely to UV light irradiation, a first set of experimental tests was carried out in the absence of the catalyst using two different initial phenol concentrations: 26 ppm and 116 ppm at T = 40 °C (Figure 4, tests B1 and B2, Table 2).
The results indicate that phenol in 116 and 26 ppm aqueous solutions is not degraded by UV light emitted by a 4 W lamp after five hours of irradiation. Previous studies reported that phenol is totally or partially degraded by UV light in the absence of a catalyst [36,43]; this inconsistency is probably because the authors of these studies used more powerful UV lamps than that used in the experiments described here. No blank tests in the presence of visible light were carried out, because in the literature [47] it is reported that phenol is stable under visible light irradiation.

3.3. Photodegradation Tests

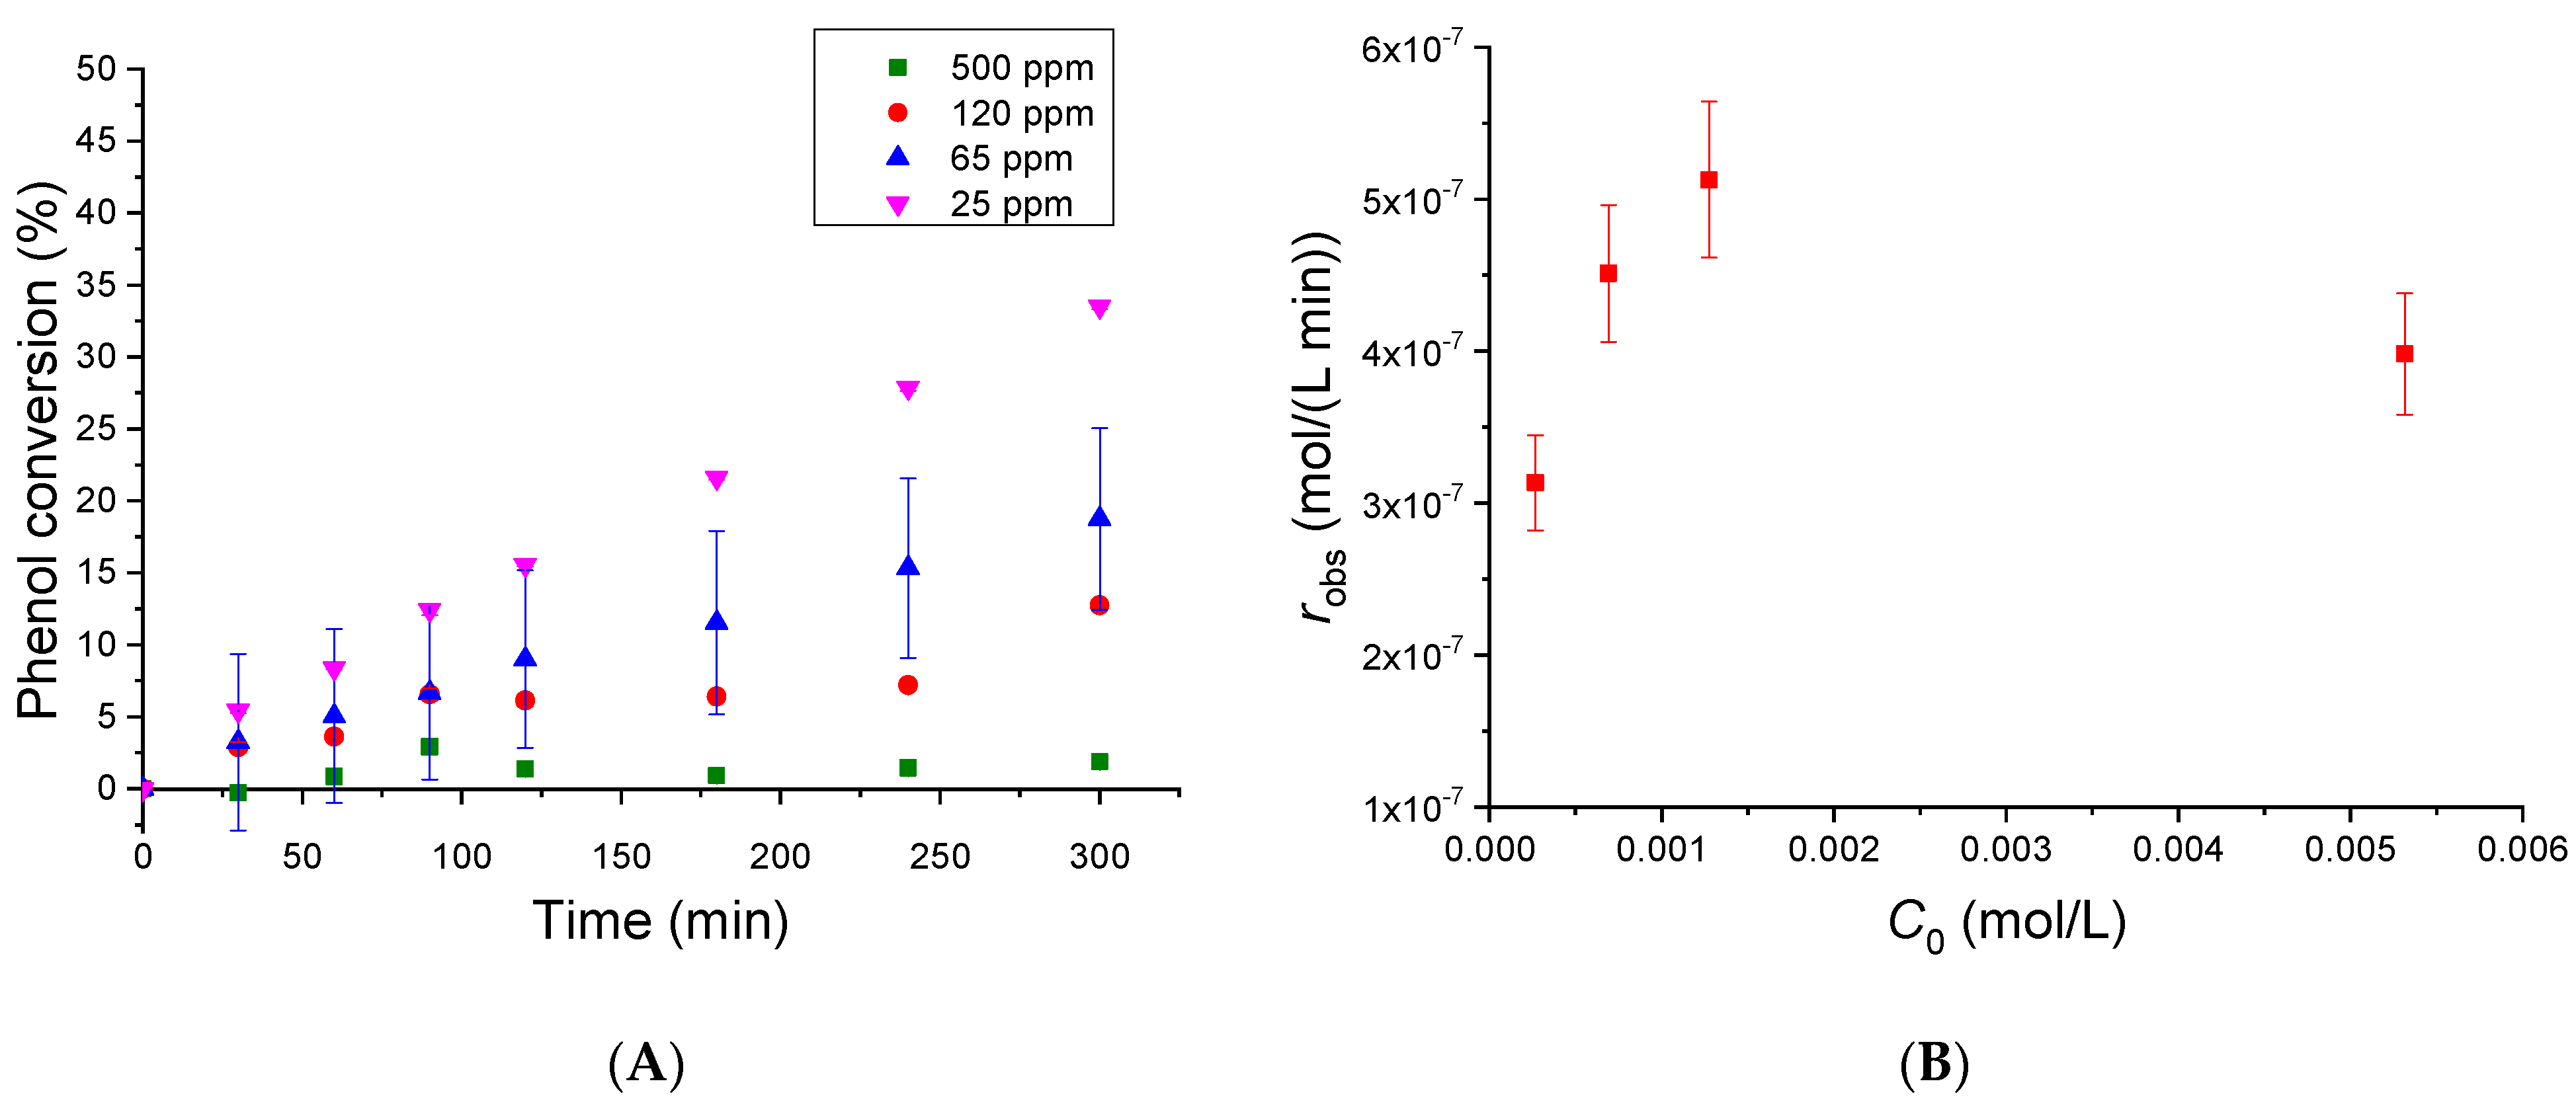
3.3.1. Initial Phenol Concentration Effect

To investigate the effect of the initial concentration of phenol on the photodegradation reaction rate, a set of experimental runs was carried out using approximately 0.50 g/L of catalyst loading at T = 40 °C, with different initial substrate concentrations: 25, 65, 120, and 500 ppm (Figure 5, tests 1–4 in Table 2).
These results are consistent with literature [36,48,49], in which it is reported that the phenol photodegradation reaction rate does not show a linear trend with the initial substrate concentration. It is reported in the literature that by increasing the phenol concentration, hydroxyl radical generation is inhibited by phenol occupation of the active sites of the catalyst; moreover, phenol adsorbs photons, so increasing its concentration results in greater shielding of the catalyst’s surface from light, inhibiting the formation of the active radicals [49].
It is interesting to plot the observed reaction rate (robs) trend vs. the initial phenol concentration (C0), Figure 5B. The observed reaction, robs, rate was calculated in agreement with Equation (5).
r o b s = d C d t
For instance, the derivative was calculated by only selecting the data in the linear region of the kinetic curve, drawn as molar concentration vs. time, expressed in minutes (see Figure 6 for the linear fit).
As revealed, the observed reaction trend with the initial phenol concentration passed through a maximum. This phenomenon is in line with a Langmuir–Hinshelwood surface reaction mechanism, considering a dual-site mechanism, where both phenol and oxygen must adsorb the prior reaction (Equation (6)).
r o b s = k C 0 C O 2 , 0 1 + K C 0 + K C O 2 , 0 2
For experiments conducted at fixed oxygen concentrations, the rate expression can be simplified as reported in Equation (7).
r o b s = a C 0 b + K C 0 2
By studying this function to the limits, it is possible to determine that at low initial phenol concentration, the trend in robs with C0 can be approximated to a straight line, as shown in Equation (8):
r o b s = a C 0
However, at high initial phenol contents, the observed reaction rate is proportional to the inverse of the initial phenol concentration (Equation (9)):
r o b s = a C 0
Thus, the overall trend passes through a maximum, as revealed in Figure 5B.
This is a novelty, because usually in the literature, the phenol degradation experimental data are treated with a Langmuir–Hinshelwood single-site mechanism [49], because researchers tend to work at lower phenol concentration compared with the present study.
During the test run with a starting phenol concentration of 500 ppm, the formation of a thick foam was observed in the reaction environment; this white foam inhibited the degradation reaction by shielding the catalyst particles from UV light.

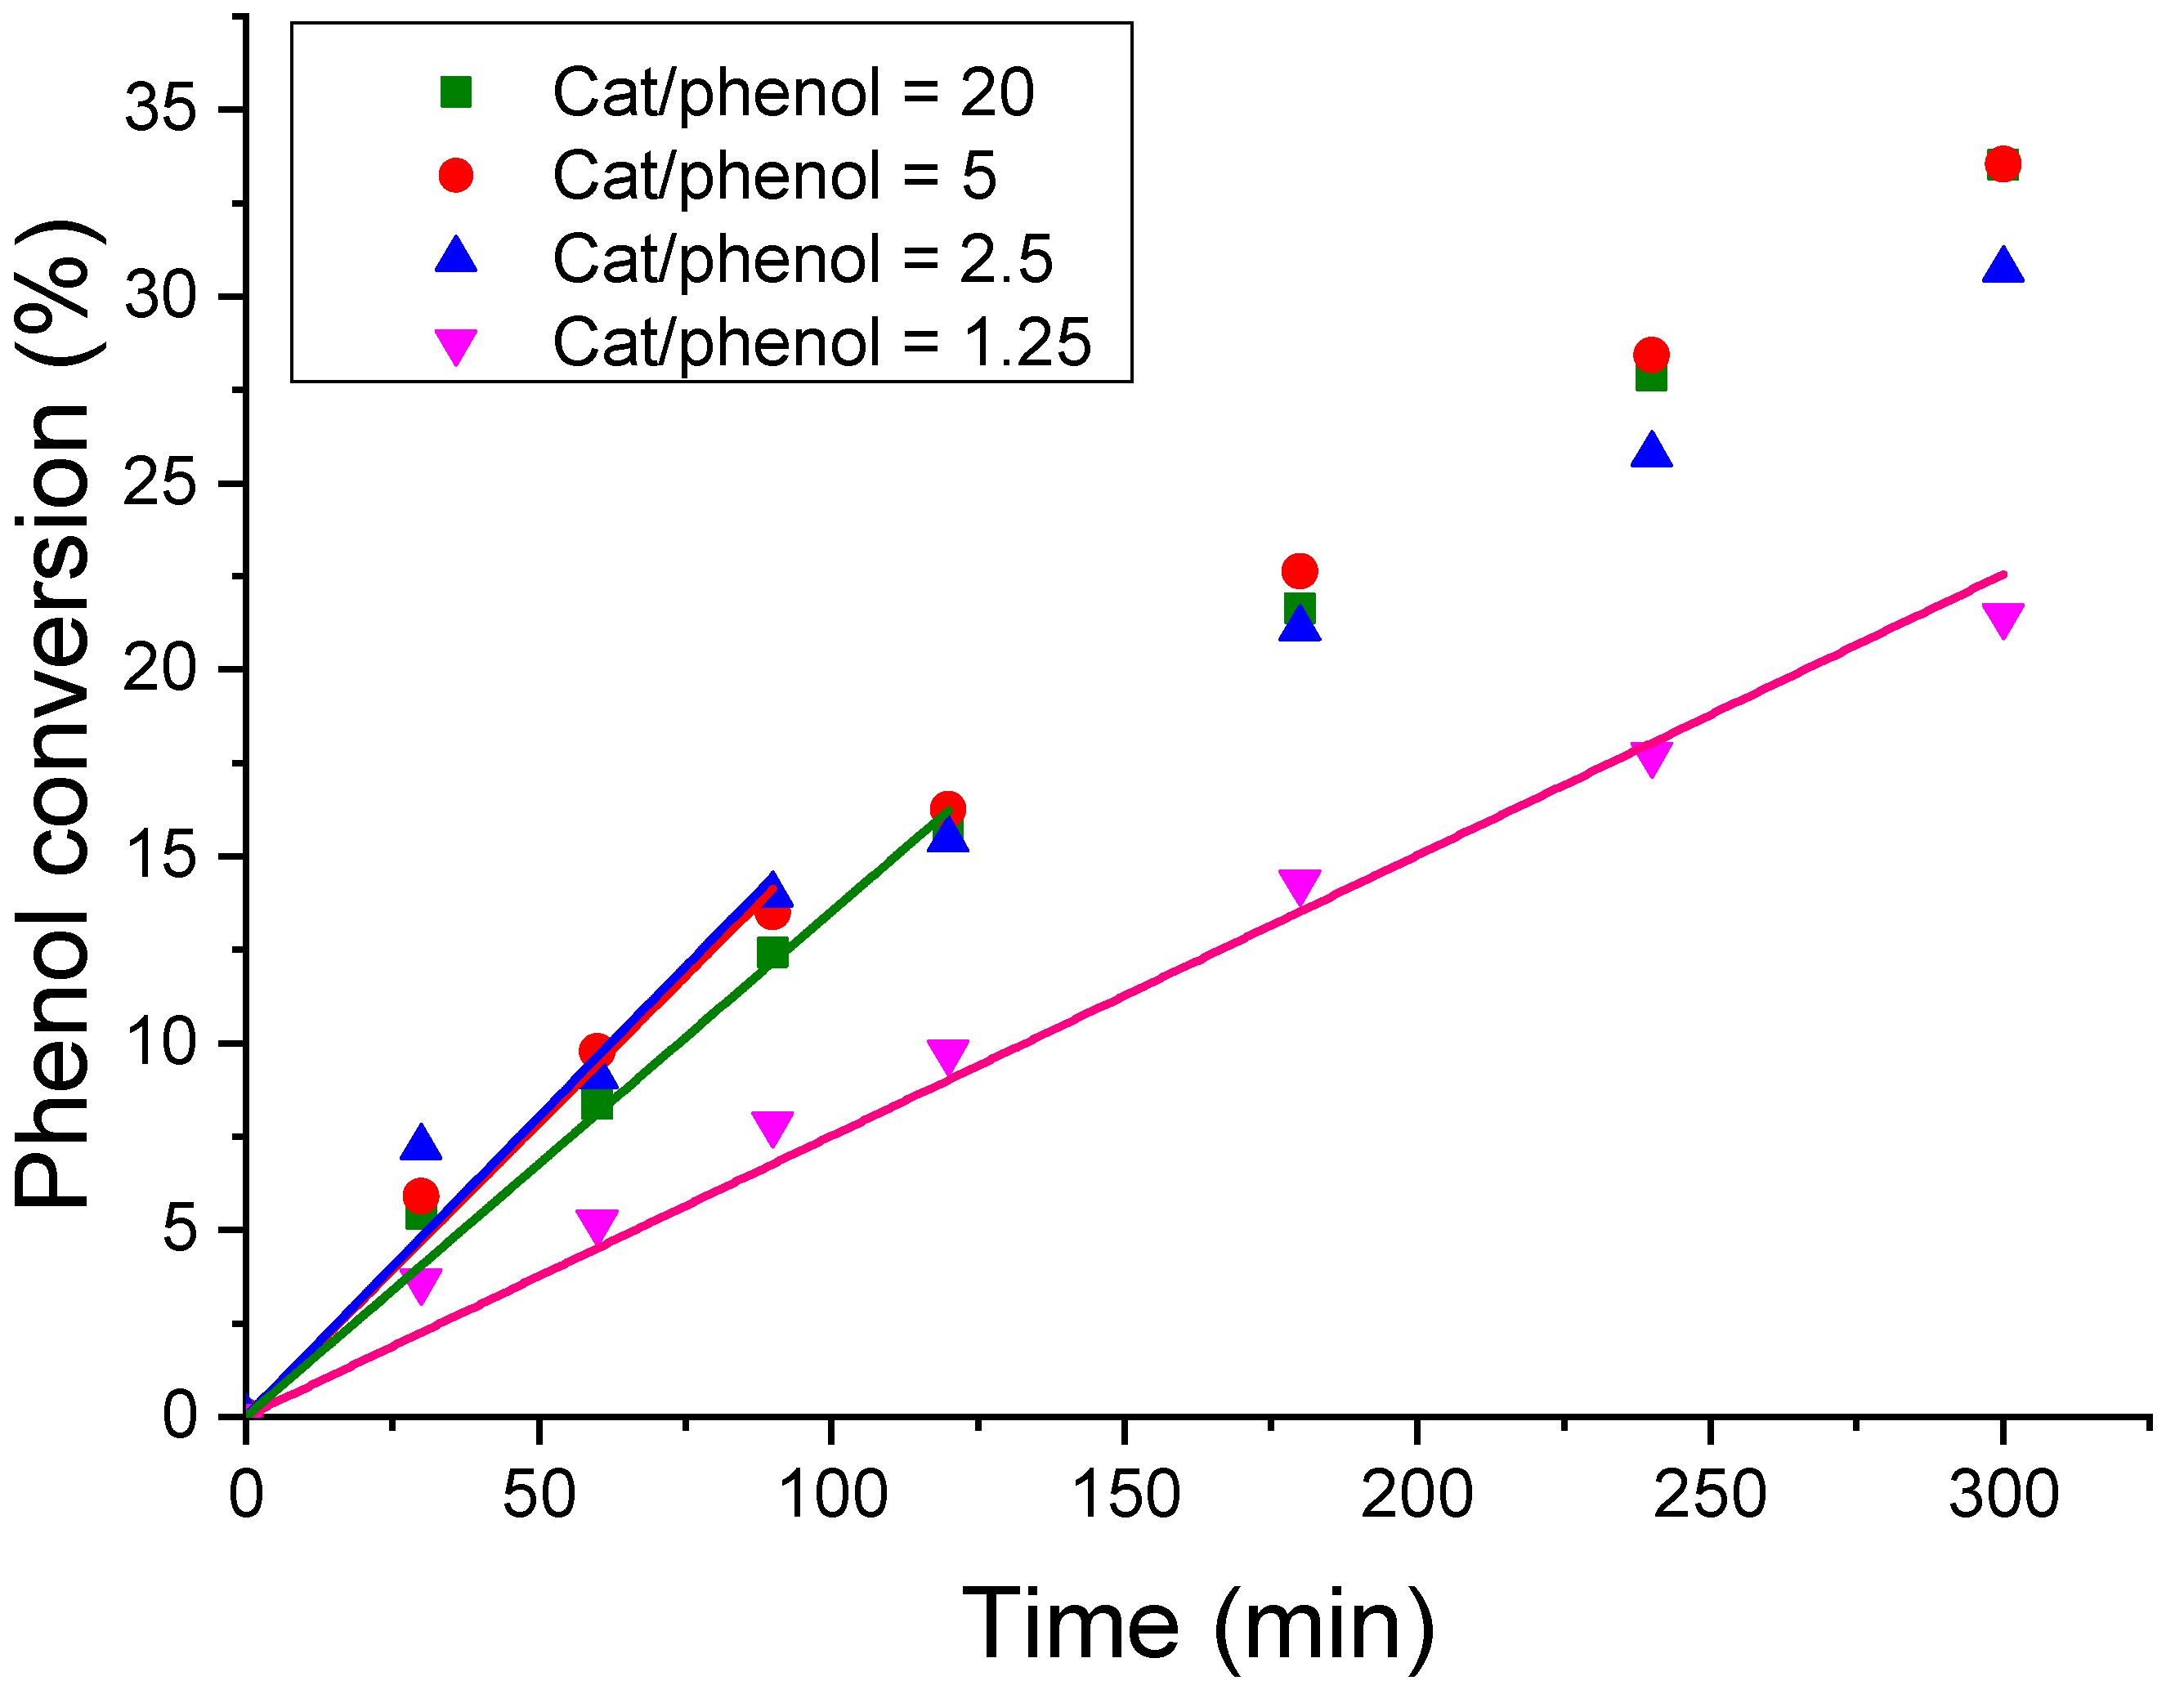
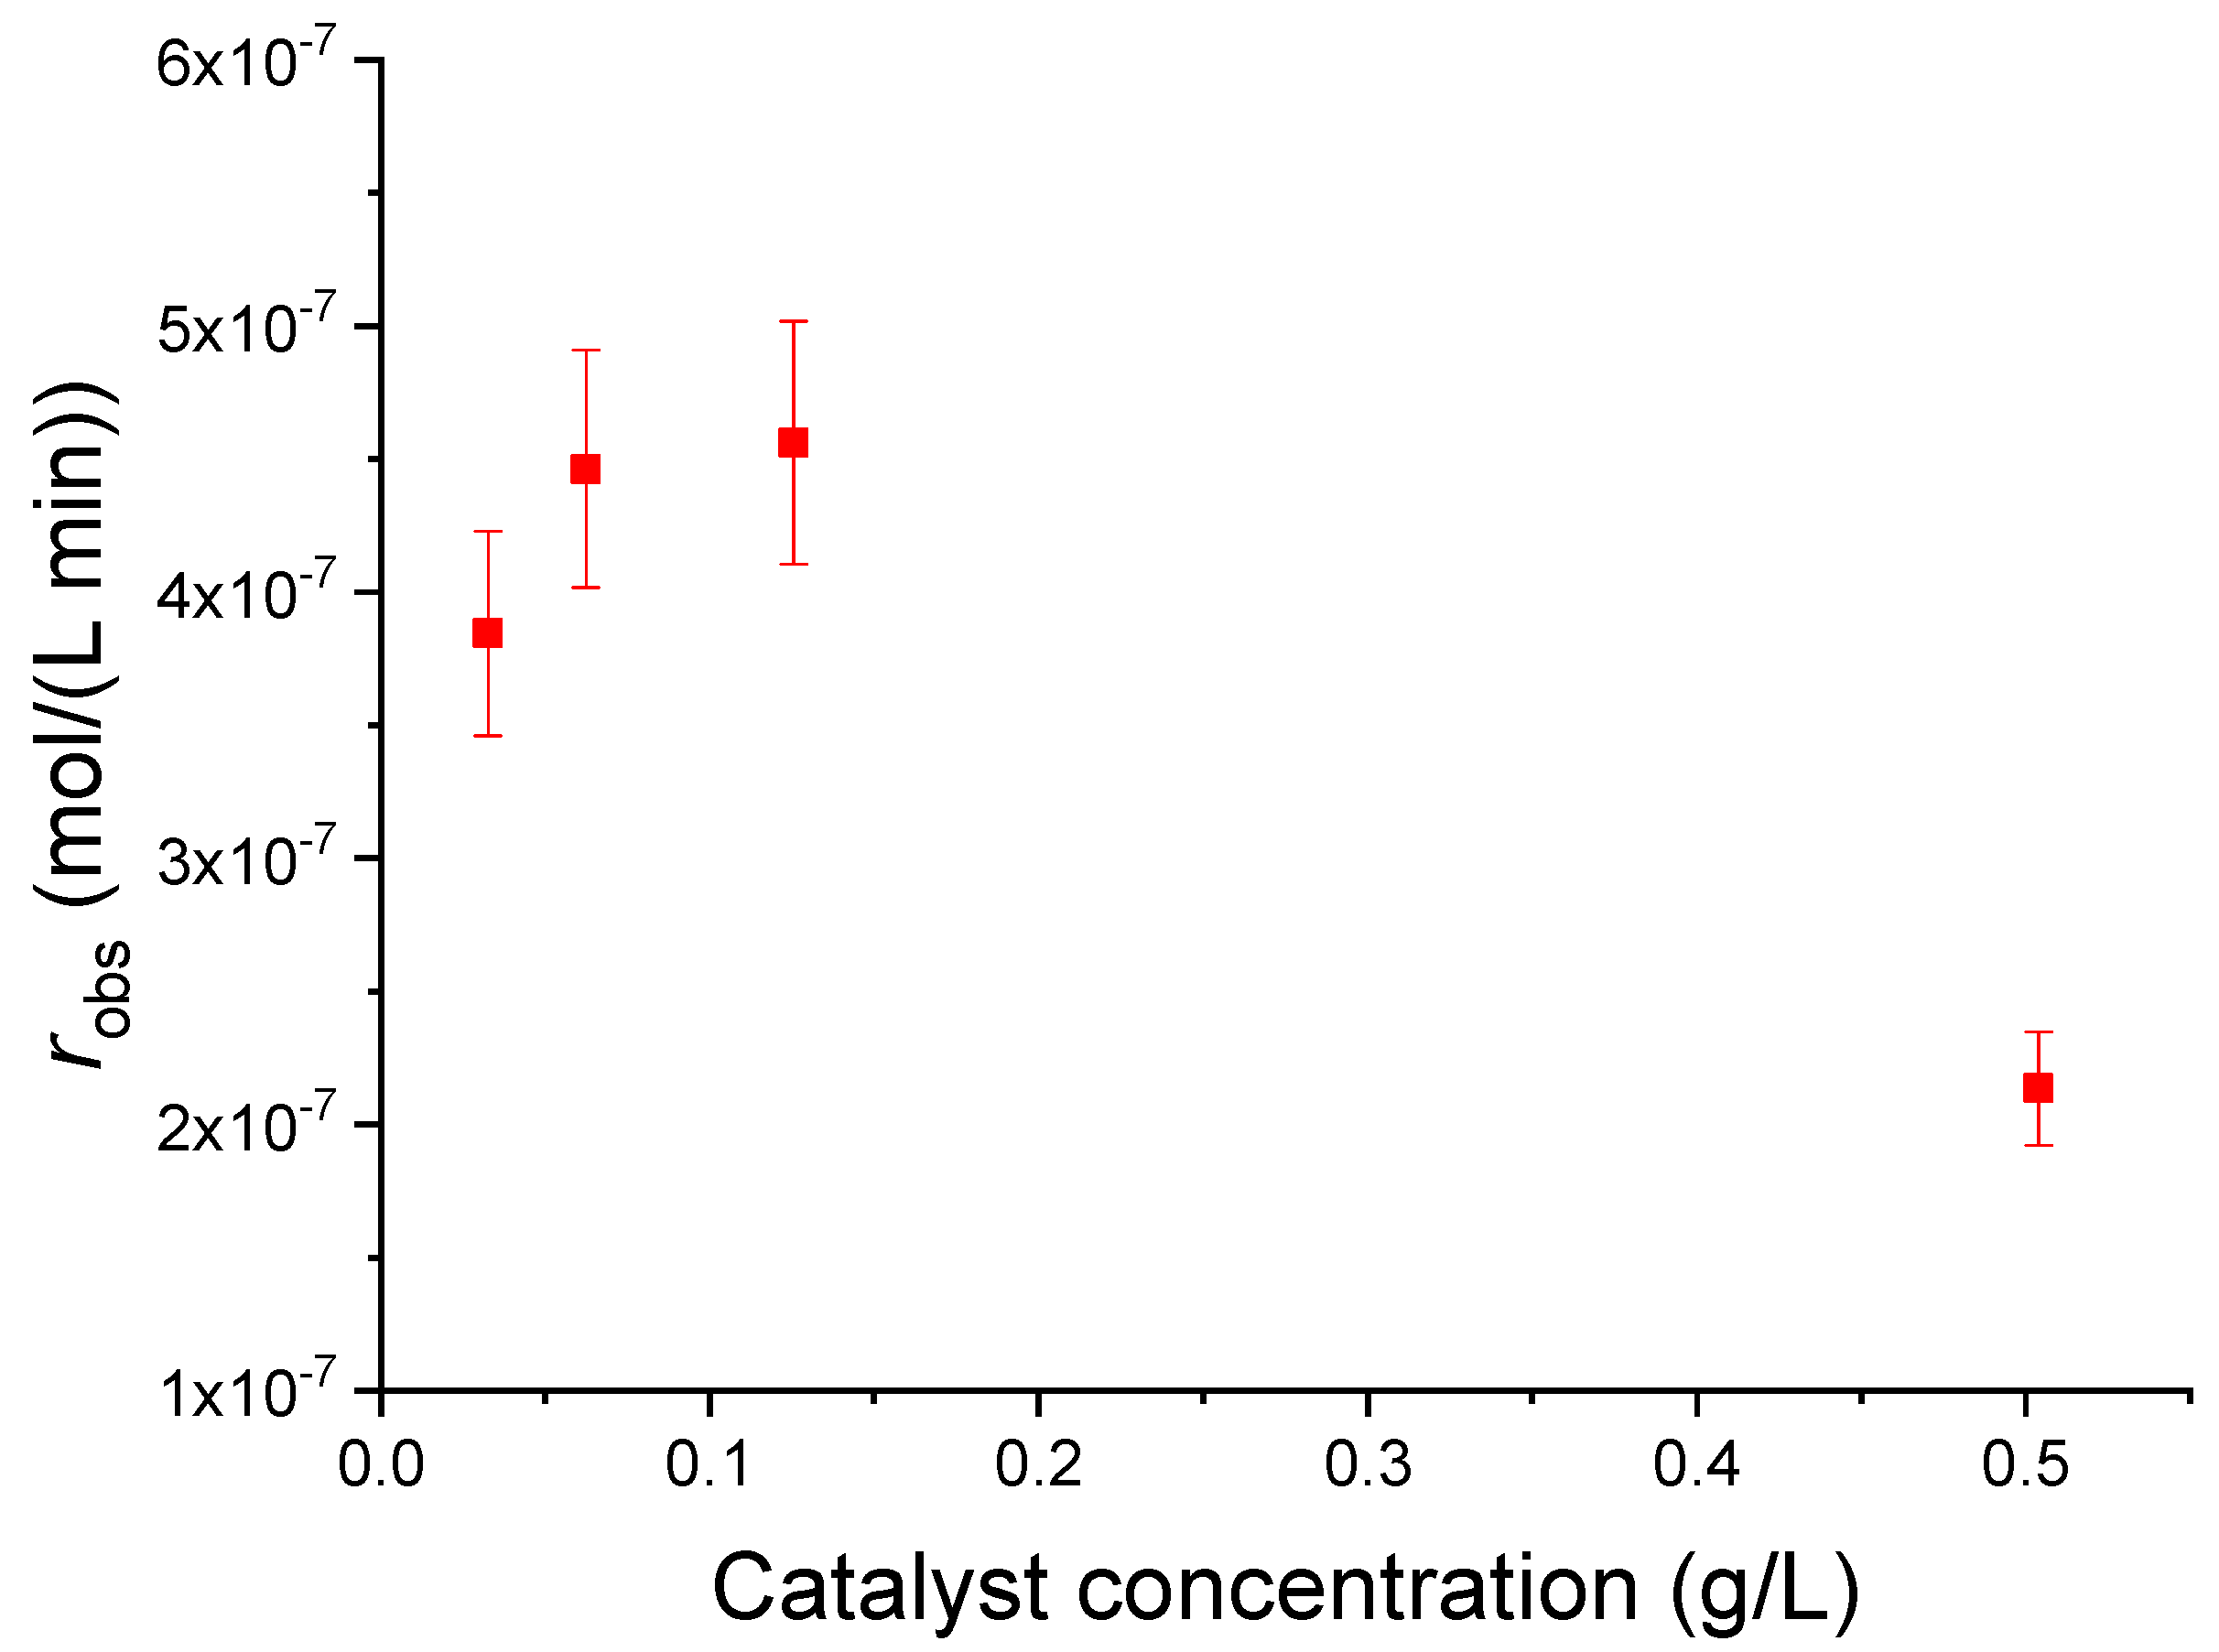
3.3.2. Effect of the Catalyst/Phenol Concentration Ratio

The previous sets of experiments were all carried out with 0.50 g of the catalyst. A set of experimental tests was performed at different catalyst/phenol concentration ratios, with a starting phenol concentration of 25 ppm, which represents the best phenol concentration for degradation (Figure 6, tests 4–7 in Table 2).
The results show that an increase in the catalyst/phenol concentration ratio increases the reaction rate, but for the runs with ratios of 20 and 5, the disappearing trend of phenol is almost the same.
By plotting the observed reaction rate vs. the catalyst concentration, it is possible to obtain the plot reported in Figure 7.
Figure 7 shows that when increasing the catalyst concentration, the initial rate of reaction at first increases; then, from 0.125 to 0.5 g L−1, it starts to decrease. This behavior could be attributed to the double effect of the catalyst concentration on the reaction rate: on the one hand, increasing the catalyst concentration increases the number of active sites, thus accelerating the reaction; on the other hand, it decreases the light penetration in the suspension, due to the screening effect and unfavorable light scattering. Consequently, the catalyst concentration of 0.125 g L−1, which yielded the highest reaction rate, was chosen along the initial phenol concentration of 25 ppm to perform a set of kinetic tests.

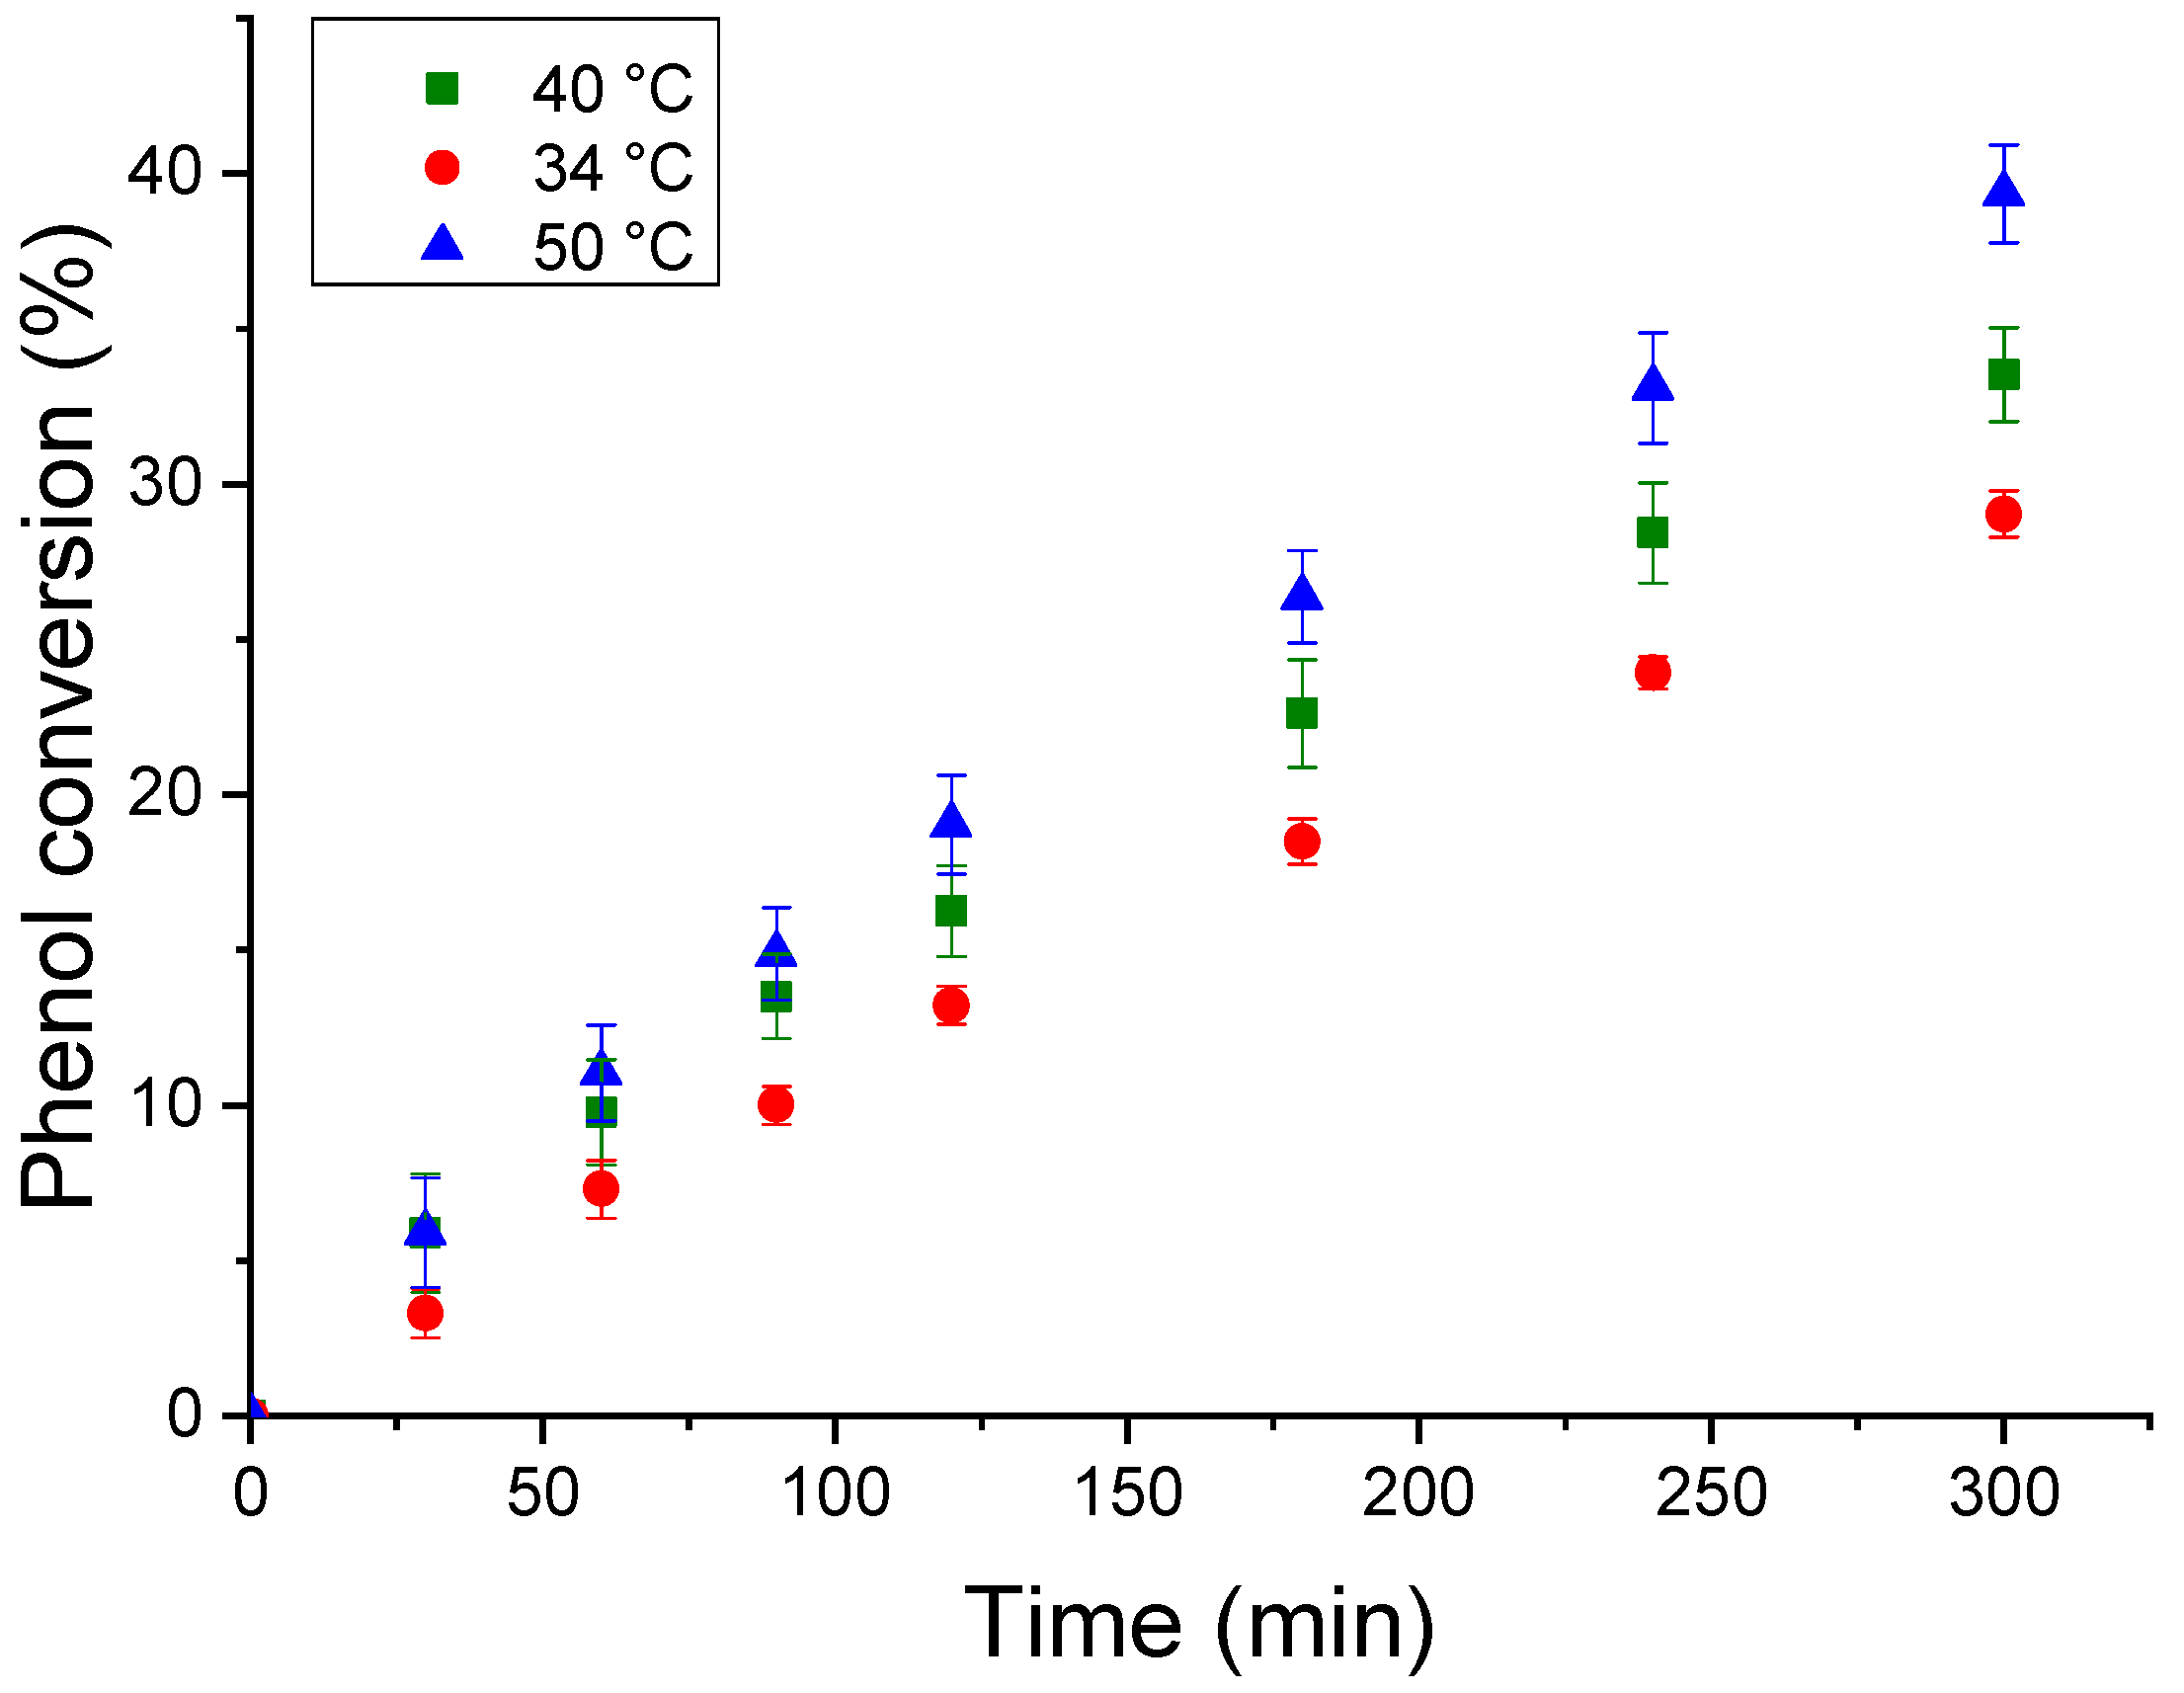
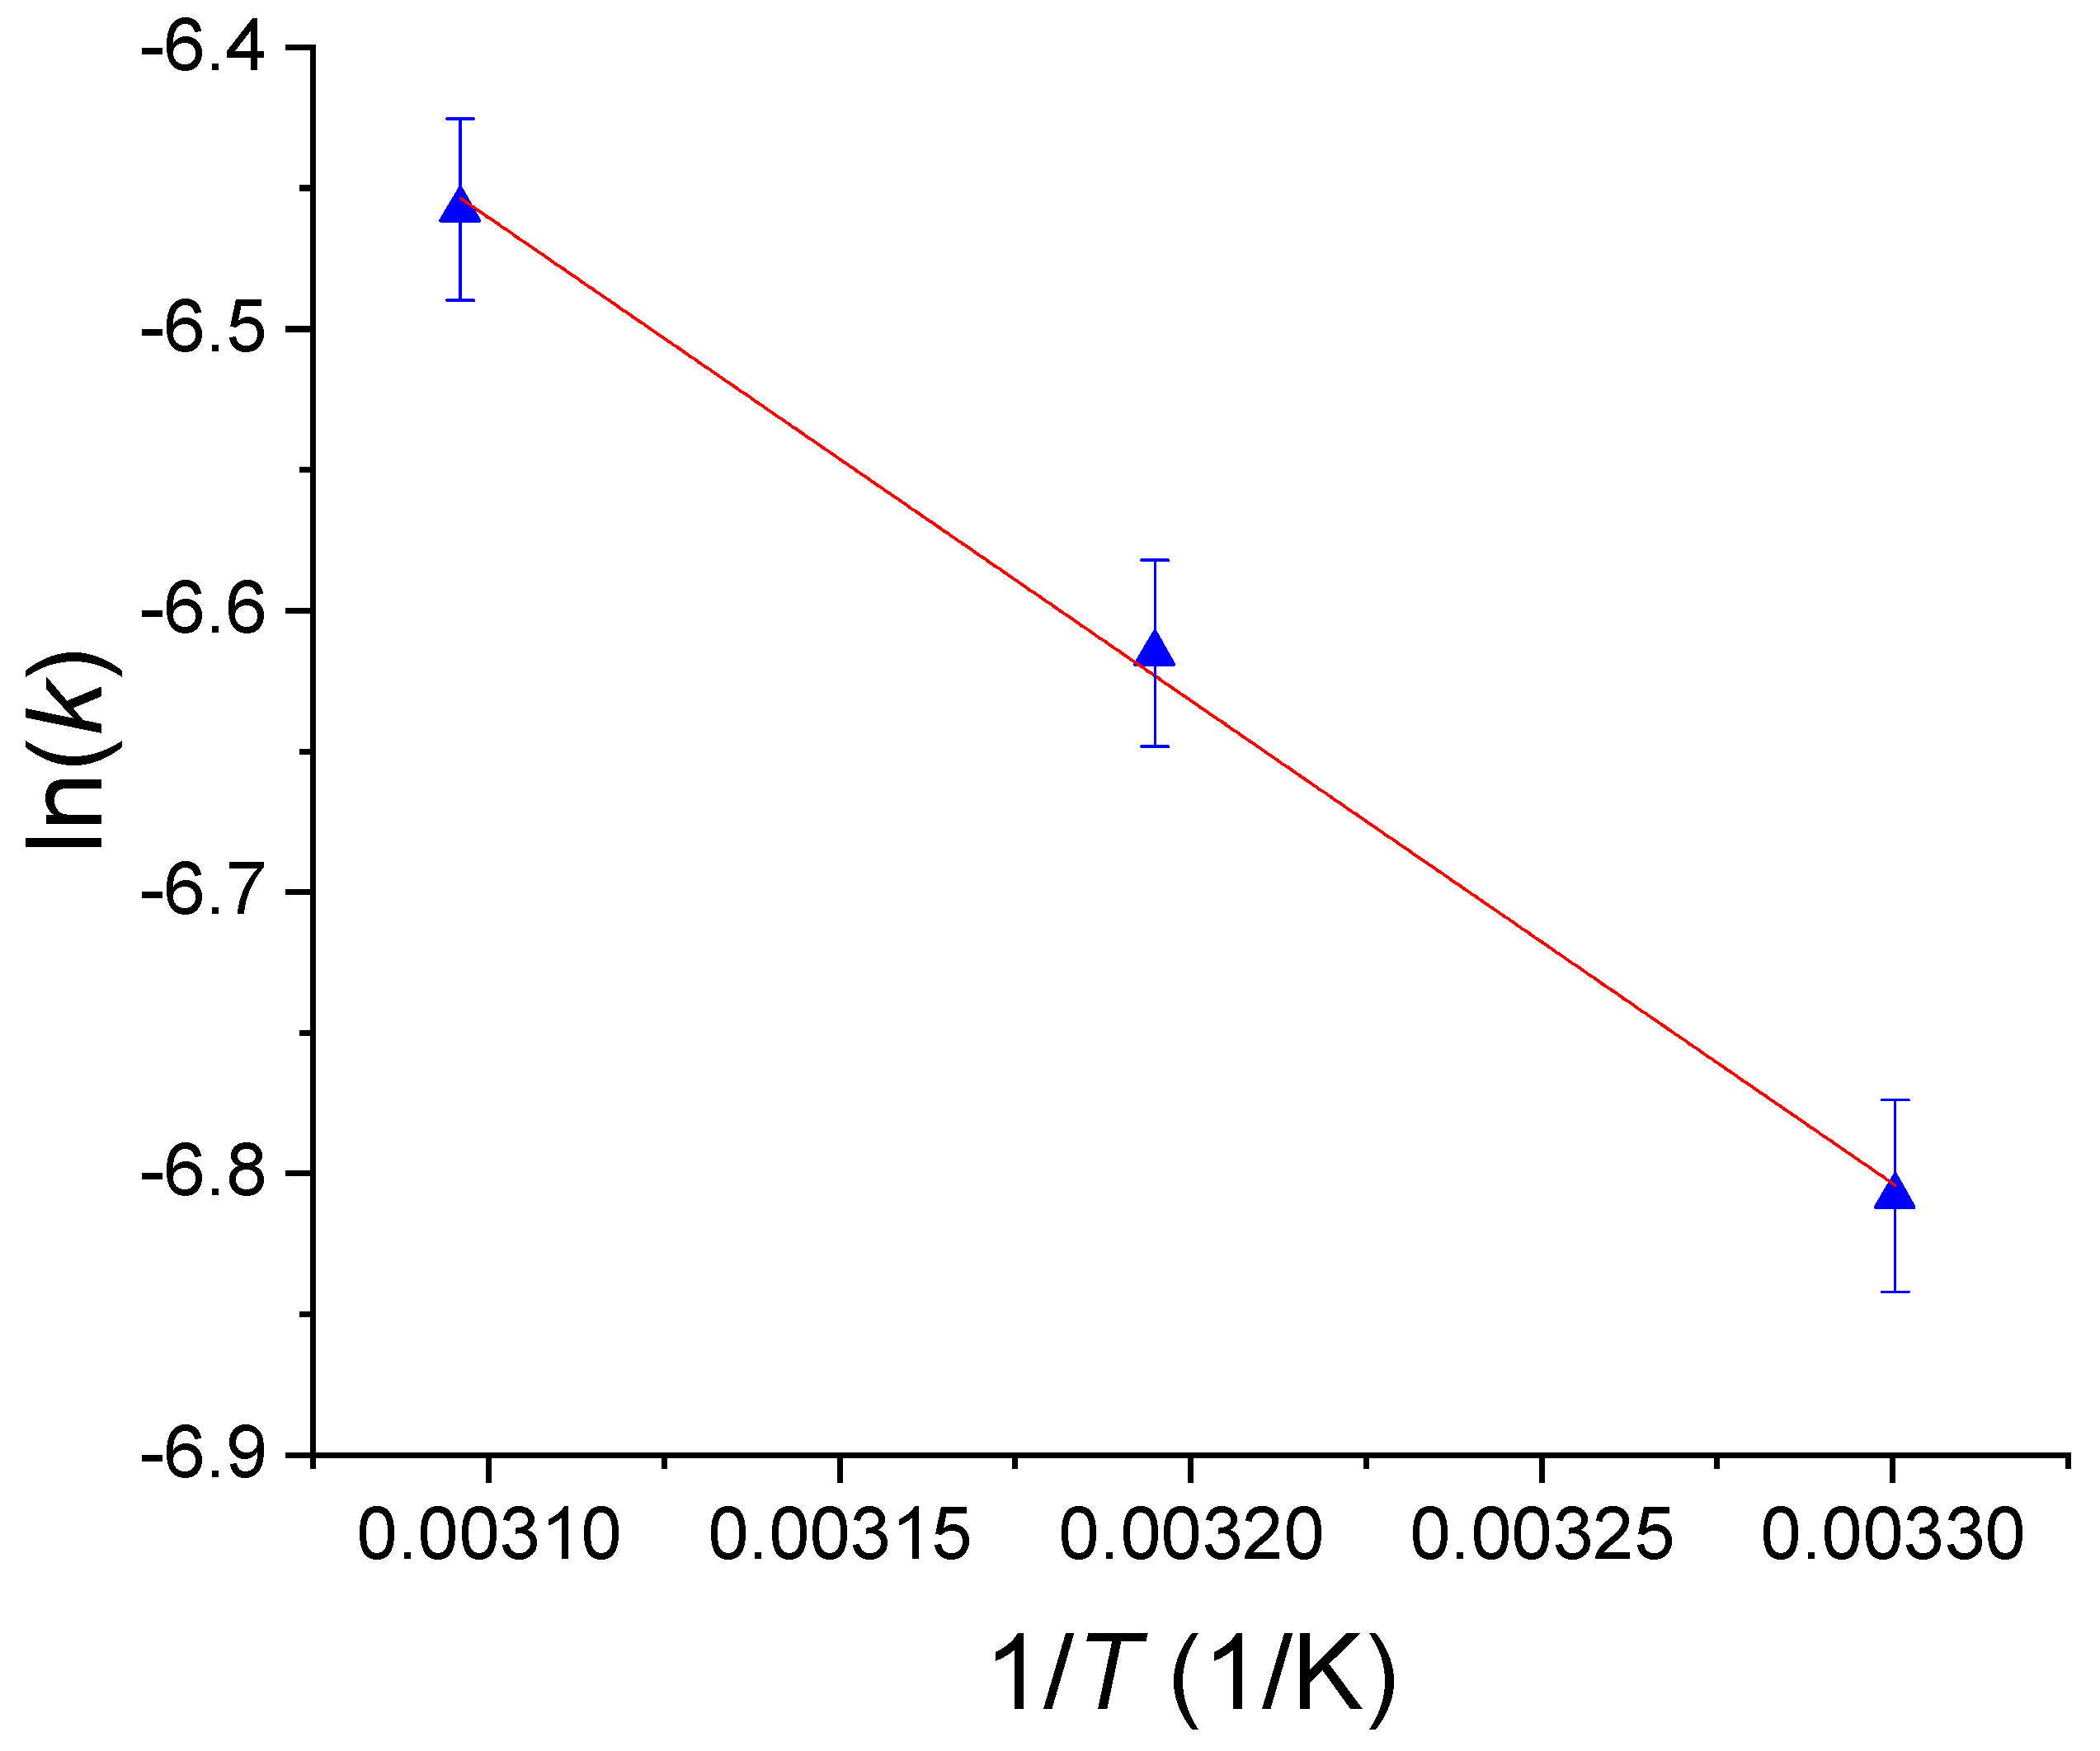
3.3.3. Evaluation of the Kinetic Parameters
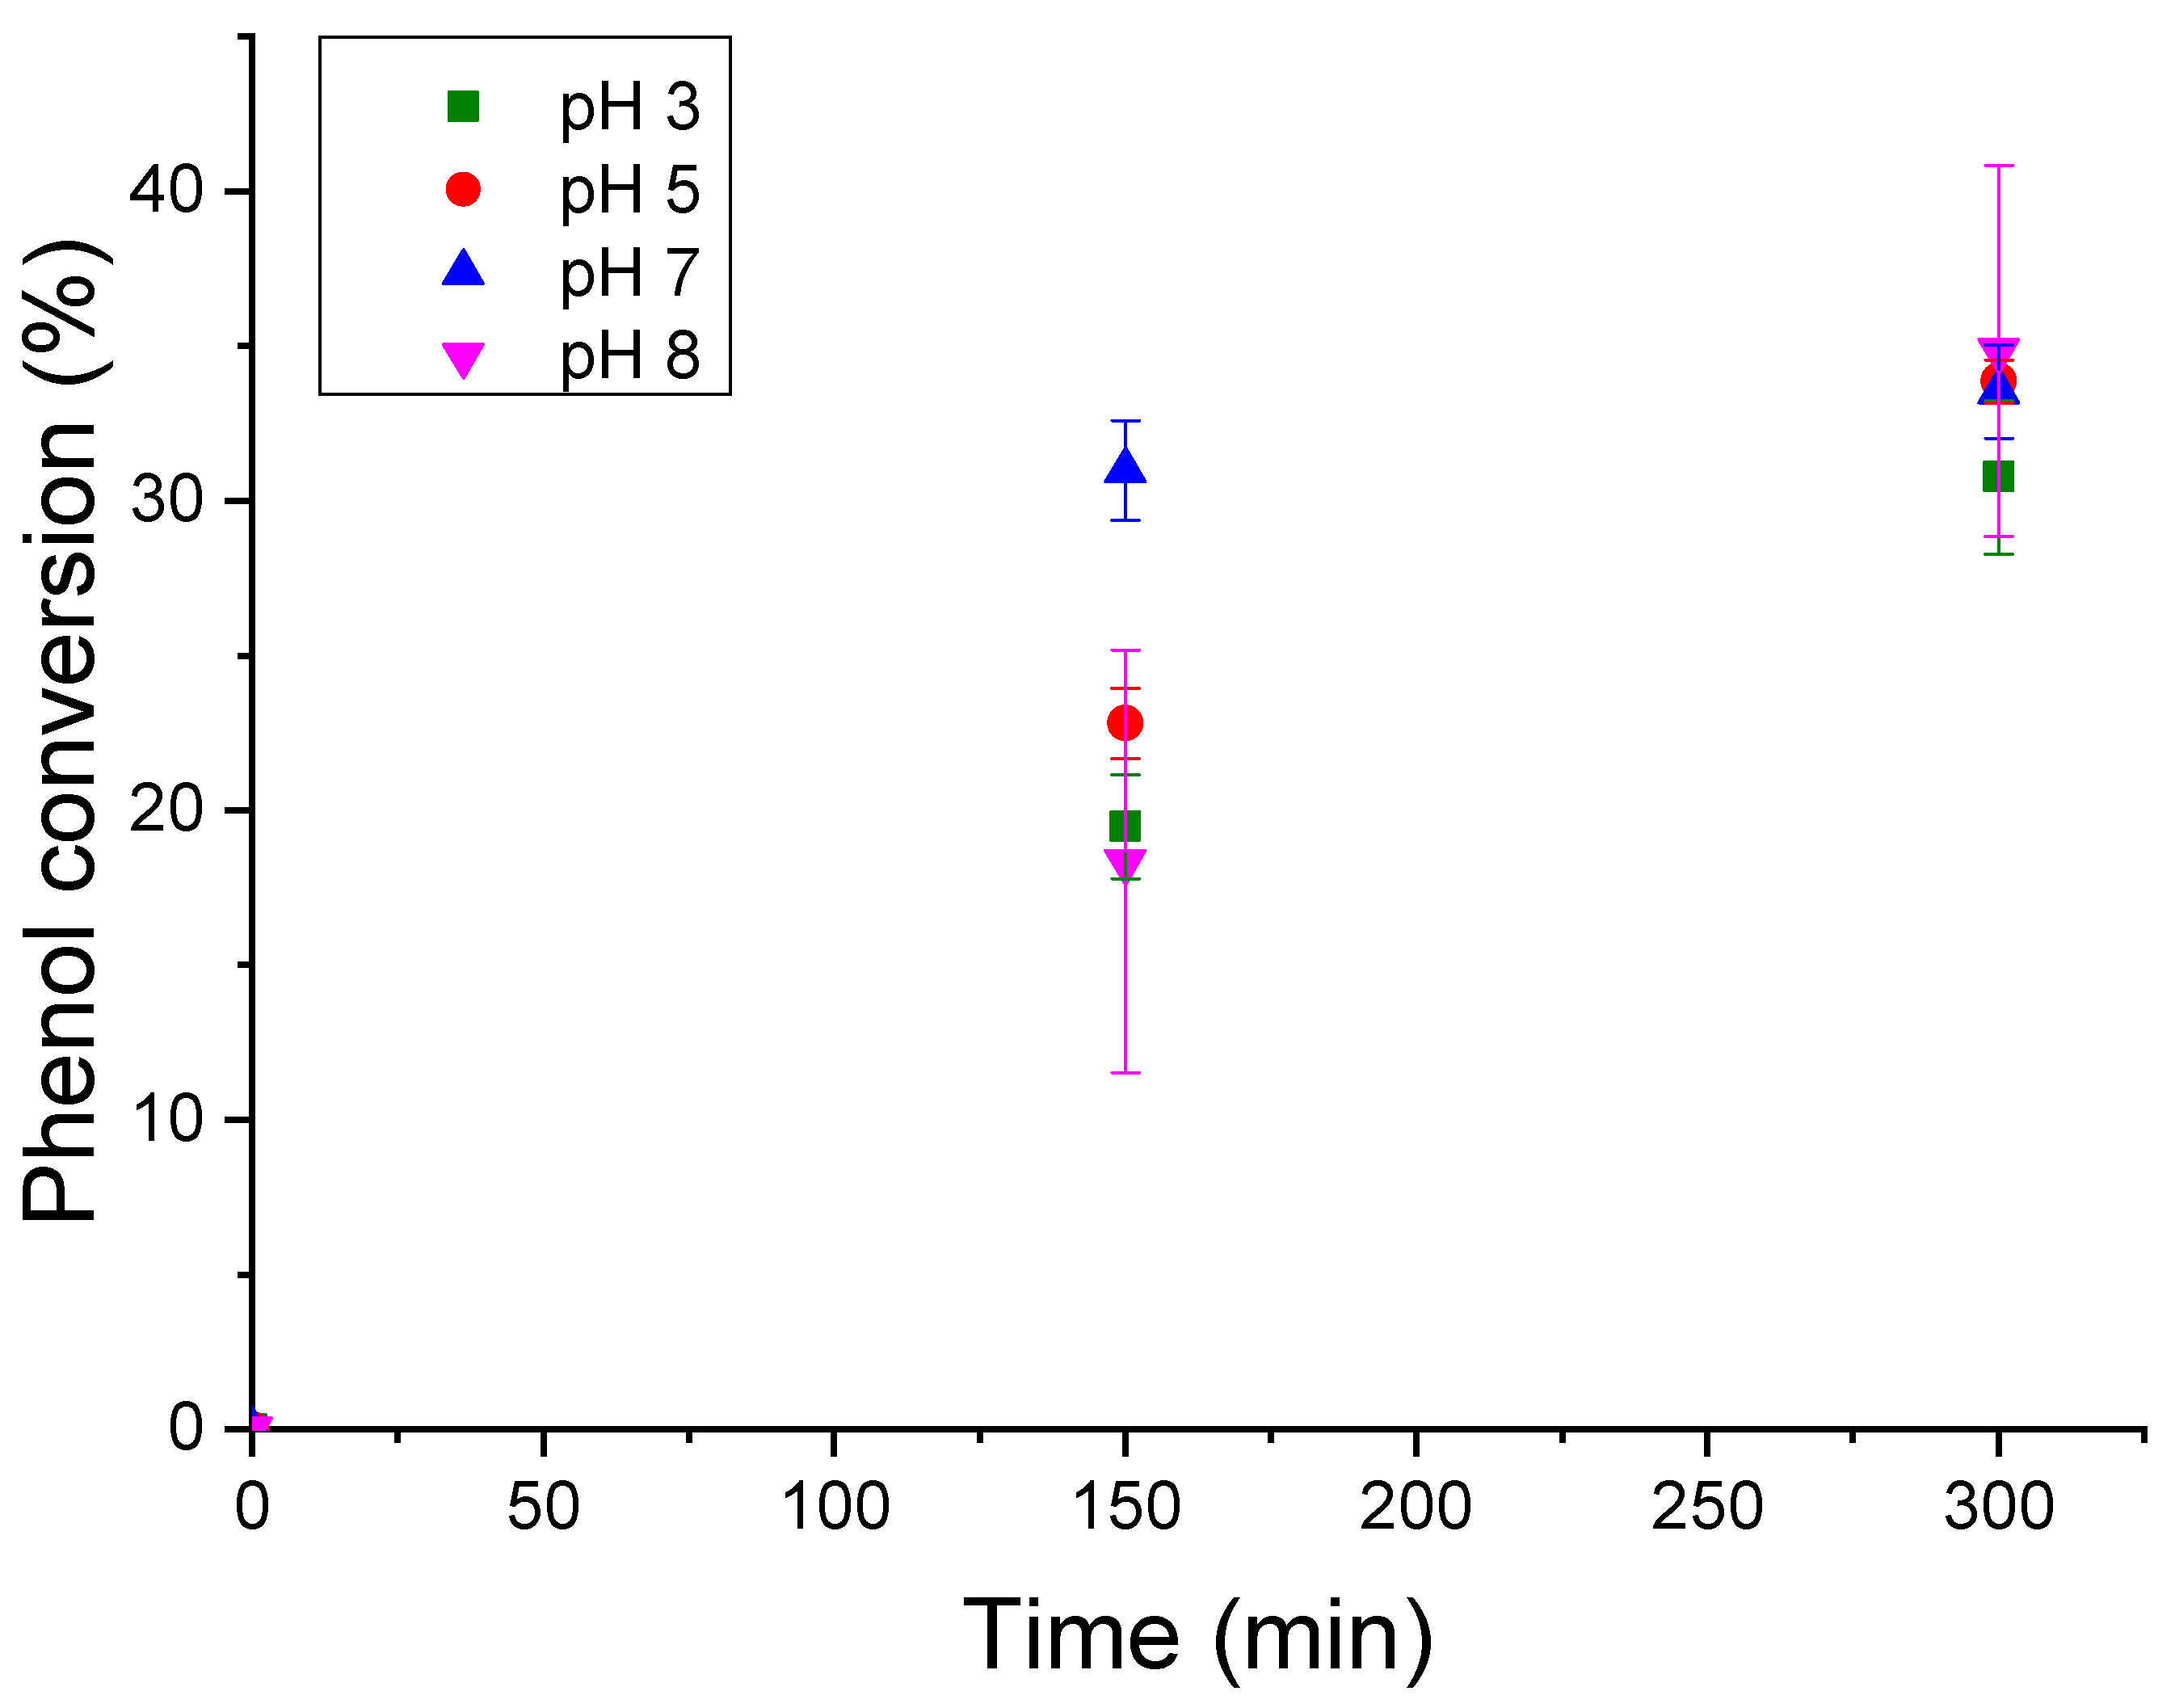
A set of kinetic tests was carried out to explore the effect of the temperature on the reaction rate and to create an Arrhenius plot for the process. The three runs for this set were performed using an initial phenol concentration of 25 ppm and catalyst loading of 0.125 g L−1, at three different temperatures: T = 30 °C, 40 °C, and 50 °C (Figure 8, tests 4, 8, and 9 in Table 2).
The results show that an increase in the system temperature corresponds to a rise in the phenol degradation rate: higher temperatures increase the collision frequency and the number of active species with sufficient energy to react.
For all these runs, the trend in phenol disappearance against time was almost linear; thus, the reaction was assumed to follow first-order kinetics.
The Arrhenius equation is shown in Equation (10):
ln k = ln k 0 E a R T
where k is the reaction rate constant, k0 is the frequency factor, Ea is the activation energy, R is the ideal gas constant, and T is the temperature.
For each test, the observed reaction rate was calculated, and the kinetic constant was obtained assuming a first-order kinetic rate expression (Table 3).
By plotting ln(k) vs. 1/T, the Arrhenius plot for the process was elaborated, as depicted in Figure 9.
From the slope of the Arrhenius plot’s linear regression line, the activation energy was calculated; the frequency factor was obtained from its intercept with the y-axis (Table 4).
The activation energy was found to be 14.3 ± 0.5 kJ mol−1.

3.3.4. Effect of pH

The last set of experimental tests was performed to explore the effect of the solution pH on the reaction rate. This is an important parameter because it determines the surface charge properties of the catalyst and the size of the aggregates it forms. The effect of pH on the degradation of organic pollutants has been investigated in many studies; however, opposing conclusions have often been reported. Some researchers have found that higher pH values favor the heterogeneous photodegradation reaction rate [50] because a higher pH favors the hydroxyl radical production; others [48] found that the degradation rate increases at a lower pH, whereas others [49] have found 5 to be the optimum pH value for this process. For this experimental set, four test runs have been performed, at pH 3, 5, 7, and 8. The pH values of the solutions were adjusted with dilute HNO3 or NaOH. All runs were performed with a phenol concentration of 25 ppm, a catalyst load of 0.125 g L−1, and UV light irradiation (Figure 10, tests 10–13 in Table 2).
As reported in Figure 10, at a reaction time of 150 min, the phenol conversion was higher at neutral pH (~7); there WAs only a slight difference in the phenol conversion at the end of the tests for pH 5, 7, and 8. The results show that the phenol conversion at 150 min was the lowest for both pH = 3 and 8. However, from an industrial point of view, the disadvantage of operating at a different pH from the natural value is the necessity of neutralizing the solution before disposal. Thus, the best choice for a possible industrial implementation of heterogeneous photocatalysis in the treatment of wastewater containing phenol would be to leave the solution pH unchanged.

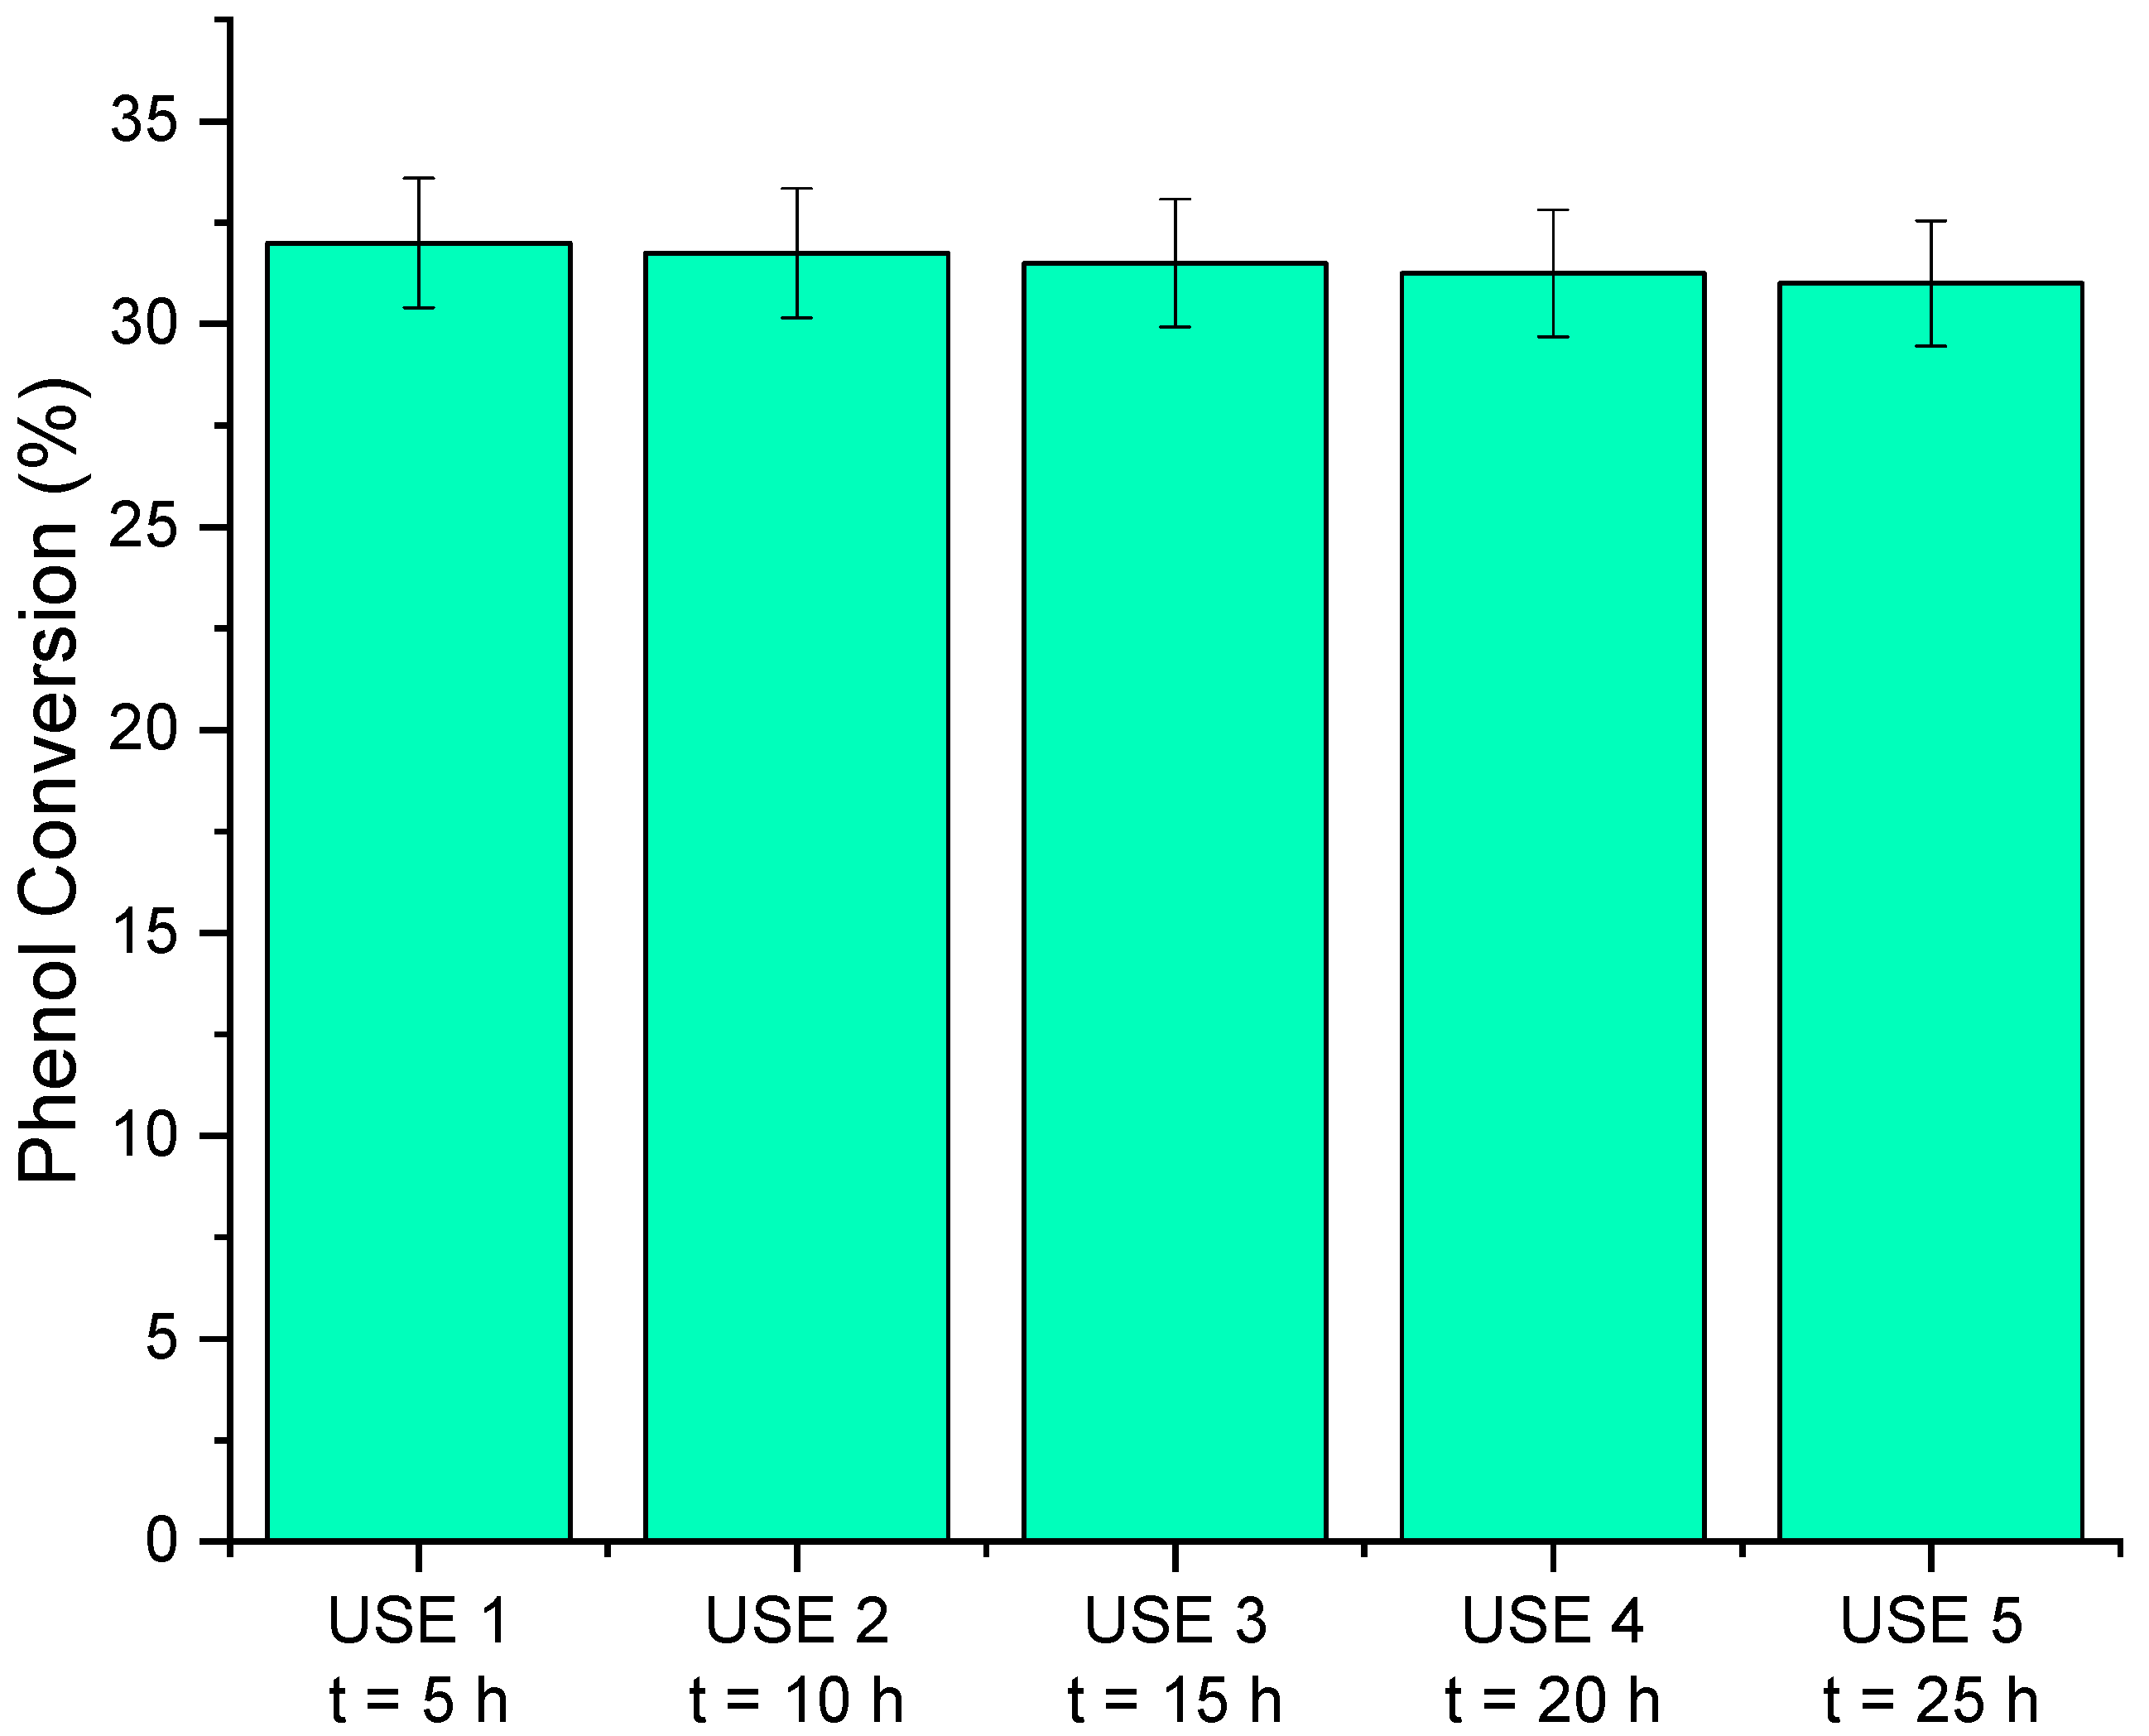
3.3.5. Reusability Experiments

The reusability of the catalyst was checked by conducting dedicated kinetic experiments, adopting the experimental conditions set for test 8 in Table 2, for a total of five cycles, i.e., 25 h or reaction time. The results of the phenol conversion after each reuse experiment are reported in Figure 11.
As revealed, the catalyst could be considered stable during the whole experiment, indicating its possible utilization in a device working in flow. A further demonstration was given by the XRD pattern of the photocatalyst after the five catalytic cycles (Figure 3). As revealed, the pattern is very similar to the fresh catalyst, demonstrating the stability of the catalytic material.

4. Conclusions

In the present paper, a detailed kinetic investigation was conducted on phenol photodegradation using commercial Aeroxide P-25. The photocatalyst was characterized, confirming the physico-chemical properties retrieved from the supplier. From a preliminary investigation, a negligible adsorption extent was measured, together with good stability at UV irradiation in the absence of photocatalyst. The optimization tests for the heterogeneous photodegradation reaction of phenol in a discontinuous reaction system showed that a lower catalyst concentration increases the reaction rate; then, it was found that the optimum catalyst/phenol concentration ratio for phenol conversion was 5. This ratio was implemented for the performance of kinetic runs, which provided data to determine the activation energy of the reaction, resulting in Ea = 14.3 ± 0.5 kJ mol−1. The experimental tests at different values of the solution pH evidenced that the initial phenol degradation rate was the highest at pH = 7, while at basic pH values there were slightly increases in the final conversion of phenol. The analytic HPLC method used in this study did not evidence the appearance of reaction intermediates; in fact, different chromatographic methods and instruments (e.g., GC/MS and HPLC-MS) could be used to identify photodegradation by-products [51]. The photocatalyst was stable for 25 h of reaction time with dedicated reuse experiments; thus, there is a clear possibility to test it in continuous devices.

Author Contributions

Conceptualization, V.R. and M.D.S.; methodology, F.B. and R.P.; software, F.B.; validation, F.B., R.P. and V.R.; formal analysis, V.R. and M.R.I.; investigation, F.B.; data curation, F.B. and R.P.; writing—original draft preparation, F.B.; writing—review and editing, all authors equally; supervision, M.D.S., M.R.I. and V.R.; project administration, V.R.; funding acquisition, M.D.S. All authors have read and agreed to the published version of the manuscript.

Funding

This research received no external funding.

Data Availability Statement

Not applicable.

Conflicts of Interest

The authors declare no conflict of interest.

Appendix A

Figure A1. Picture (A) and sketch (B) of the photoreactor used for the kinetic tests.
Chemengineering 07 00027 g0a1

References

  1. Filipowicz, N.; Momotko, M.; Boczkaj, G.; Pawlikowski, T.; Wanarska, M.; Cieśliński, H. Isolation and Characterization of Phenol-Degrading Psychrotolerant Yeasts. Water Air Soil Pollut. 2017, 228, 210. [Google Scholar] [CrossRef] [PubMed] [Green Version]
  2. Swarts, H.J.; Verhagen, F.J.; Field, J.A.; Wijnberg, J.B. Trichlorinated phenols from hypholoma elongatum. Phytochemistry 1998, 49, 203–206. [Google Scholar] [CrossRef]
  3. Michałowicz, J.; Duda, W. Phenols—Sources and Toxicity. Pol. J. Environ. Stud. 2007, 16, 347–362. [Google Scholar]
  4. US EPA. Ambient Water Quality Criteria DOC: Phenol US EPA-440/5-80-066 (PB 81-117772); US Environmental Protection Agency: Washington, DC, USA, 1980; pp. 1100–1156. [Google Scholar]
  5. Tsuruta, Y.; Watanabe, S.; Inoue, H. Fluorometric determination of phenol and p-cresol in urine by precolumn high-performance liquid chromatography using 4-(N-phthalimidinyl)benzenesulfonyl chloride. Analyt. Biochem. 1996, 243, 86–91. [Google Scholar] [CrossRef]
  6. Bruce, R.M.; Santodonato, J.; Neal, M.W. Summary Review of the Health Effects Associated With Phenol. Toxicol. Ind. Health 1987, 3, 535–568. [Google Scholar] [CrossRef]
  7. Bernats, M.; Juhna, T. Factors Governing Degradation of Phenol in Pharmaceutical Wastewater by White-rot Fungi: A Batch Study. Open Biotechnol. J. 2015, 9, 93–99. [Google Scholar] [CrossRef]
  8. Andreozzi, R.; Caprio, V.; Insola, A.; Marotta, R. Advanced oxidation processes (AOP) for water purification and recovery. Catal. Today 1999, 53, 51–59. [Google Scholar] [CrossRef]
  9. Babich, H.; Davis, D. Phenol: A review of environmental and health risks. Regul. Toxicol. Pharmacol. 1981, 1, 90–109. [Google Scholar] [CrossRef]
  10. Faggiano, A.; De Carluccio, M.; Fiorentino, A.; Ricciardi, M.; Cucciniello, R.; Proto, A.; Rizzo, L. Photo-Fenton like process as polishing step of biologically co-treated olive mill wastewater for phenols removal. Sep. Purif. Technol. 2023, 305, 122525. [Google Scholar] [CrossRef]
  11. Galgale, A.D.; Shah, N.B.; Shah, N.G. Treatment of Wastewater Containing High Concentration of Phenol & Total Dissolved Solids in Moving Bed Biofilm Reactor. Int. J. Innov. Res. Sci. Eng. Technol. 2014, 3, 10924–10930. [Google Scholar]
  12. Gogate, P.R.; Aniruddha, B.; Pandit, A.B. A review of imperative technologies for wastewater treatment I: Oxidation technologies at ambient conditions. Adv. Environ. Res. 2004, 8, 501–551. [Google Scholar] [CrossRef]
  13. Fedorak, P.M.; Hrudey, S.E. The effects of phenol and some alkyl phenolics on batch anaerobic methanogenesis. Water Res. 1984, 18, 361–367. [Google Scholar] [CrossRef]
  14. Herrmann, J.-M. Heterogeneous photocatalysis: Fundamentals and applications to the removal of various types of aqueous pollutants. Catal. Today 1999, 53, 115–129. [Google Scholar] [CrossRef]
  15. Russo, V.; Hmoudah, M.; Broccoli, F.; Iesce, M.R.; Di Serio, M. Applications of Metal Organic Frameworks in Wastewater Treatment: A Review on Adsorption and Photodegradation. Front. Chem. Eng. 2020, 2, 1–13. [Google Scholar] [CrossRef]
  16. Glaze, W.H.; Kang, J.W.; Chapin, D.H. The chemistry of water treatment processes involving ozone, hydrogen peroxide and UV-radiation. Ozone Sci. Eng. 1987, 9, 335–352. [Google Scholar] [CrossRef]
  17. Ameta, S.C. Advanced Oxidation Processes for Wastewater Treatment: Emerging Green Chemical Technology; Academic Press: Cambridge, MA, USA, 2018; pp. 1–12. [Google Scholar]
  18. Guillard, C.; Disdier, J.; Herrmann, J.-M.; Lehaut, C.; Chopin, T.; Malato, S.; Blanco, J. Comparison of various titania samples of industrial origin in the solar photocatalytic detoxification of water containing 4-chlorophenol. Catal. Today 1999, 54, 217–228. [Google Scholar] [CrossRef]
  19. Li, S.; Shan, S.; Chen, S.; Li, H.; Li, Z.; Liang, Y.; Fei, J.; Xie, L.; Li, J. Photocatalytic degradation of hazardous organic pollutants in water by Fe-MOFs and their composites: A review. J. Environ. Chem. Eng. 2021, 9, 105967. [Google Scholar] [CrossRef]
  20. Araña, J.; Nieto, J.L.M.; Meli án, J.A.H.; Rodriguez, J.M.D.; Diaz, O.G.; Perna, J.P.; Bergasa, C.A.; Mendez, J. Photocatalytic degradation of formaldehyde containing wastewater from veterinarian laboratories. Chemosphere 2004, 55, 893–904. [Google Scholar] [CrossRef]
  21. Li, S.; Cai, M.; Liu, Y.; Wang, C.; Lv, K.; Chen, X. S-Scheme photocatalyst TaON/Bi2WO6 nanofibers with oxygen vacancies for efficient abatement of antibiotics and Cr(VI): Intermediate eco-toxicity analysis and mechanistic insights. Chin. J. Catal. 2022, 43, 2652–2664. [Google Scholar] [CrossRef]
  22. Li, X.; Liu, T.; Zhang, Y.; Cai, J.; He, M.; Li, M.; Chen, Z.; Zhang, L. Growth of BiOBr/ZIF-67 Nanocomposites on Carbon Fiber Cloth as Filter-Membrane-Shaped Photocatalyst for Degrading Pollutants in Flowing Wastewater. Adv. Fiber Mater. 2022, 4, 1620–1631. [Google Scholar] [CrossRef]
  23. Curcó, D.; Giménez, J.; Addardak, A.; Cervera-March, S.; Esplugas, S. Effects of radiation absorption and catalyst concentration on the photocatalytic degradation of pollutants. Catal. Today 2002, 76, 177–188. [Google Scholar] [CrossRef]
  24. Qamar, M.; Muneer, M.; Bahnemann, D. Heterogeneous photocatalysed degradation of two selected pesticide derivatives, triclopyr and daminozid in aqueous suspensions of titanium dioxide. J. Environ. Manag. 2006, 80, 99–106. [Google Scholar] [CrossRef] [PubMed]
  25. Stylidi, M.; Kondarides, D.I.; Verykios, X.E. Visible light-induced photocatalytic degradation of Acid Orange 7 in aqueous TiO2 suspensions. Appl. Catal. B Environ. 2004, 47, 189–201. [Google Scholar] [CrossRef]
  26. Abu Tariq, M.; Faisal, M.; Muneer, M.; Bahnemann, D. Photochemical reactions of a few selected pesticide derivatives and other priority organic pollutants in aqueous suspensions of titanium dioxide. J. Mol. Catal. A Chem. 2007, 265, 231–236. [Google Scholar] [CrossRef]
  27. Bhatkhande, D.S.; Kamble, S.P.; Sawant, S.B.; Pangarkar, V.G. Photocatalytic and photochemical degradation of nitrobenzene using artificial ultraviolet light. Chem. Eng. J. 2004, 102, 283–290. [Google Scholar] [CrossRef]
  28. Kumar, A.; Pandey, G. A Review on the Factors Affecting the Photocatalytic Degradation of Hazardous Materials. Mater. Sci. Eng. Int. J. 2017, 1, 106–114. [Google Scholar] [CrossRef] [Green Version]
  29. Kogo, K.; Yoneyama, H.; Tamura, H. Photocatalytic oxidation of cyanide on platinized titanium dioxide. J. Phys. Chem. 1980, 84, 1705–1710. [Google Scholar] [CrossRef]
  30. Dinga, H.; Suna, H.; Shan, Y. Preparation and characterization of mesoporous SBA-15 supported dye-sensitized TiO2 photocatalyst. J. Photochem. Photobiol. A 2005, 169, 101–107. [Google Scholar] [CrossRef]
  31. Maira, A.; Yeung, K.; Soria, J.; Coronado, J.; Belver, C.; Lee, C.; Augugliaro, V. Gas-phase photo-oxidation of toluene using nanometer-size TiO2 catalysts. Appl. Catal. B Environ. 2001, 29, 327–336. [Google Scholar] [CrossRef] [Green Version]
  32. Krýsa, J.; Keppert, M.; Jirkovský, J.; Štengl, V.; Šubrt, J. The effect of thermal treatment on the properties of TiO2 photocatalyst. Mater. Chem. Phys. 2004, 86, 333–339. [Google Scholar] [CrossRef]
  33. Chun, H.; Yizhong, W.; Hongxiao, T. Destruction of phenol aqueous solution by photocatalysis or direct photolysis. Chemosphere 2000, 41, 1205–1209. [Google Scholar] [CrossRef]
  34. Haque, M.; Muneer, M. Photodegradation of norfloxacin in aqueous suspensions of titanium dioxide. J. Hazard. Mater. 2007, 145, 51–57. [Google Scholar] [CrossRef]
  35. Sun, J.; Wang, X.; Sun, J.; Sun, R.; Sun, S.; Qiao, L. Photocatalytic degradation and kinetics of Orange G using nano-sized Sn (IV)/TiO2/AC photocatalyst. J. Mol. Catal. A 2006, 260, 241–246. [Google Scholar] [CrossRef]
  36. Alnaizy, R.; Akgerman, A. Advanced oxidation of phenolic compounds. Adv. Environ. Res. 2000, 4, 233–244. [Google Scholar] [CrossRef]
  37. Evgenidou, E.; Fytianos, K.; Poulios, I. Semiconductor-sensitized photodegradation of dichlorvos in water using TiO2 and ZnO as catalysts. Appl. Catal. B Environ. 2005, 59, 81–89. [Google Scholar] [CrossRef]
  38. Pitre, S.P.; Yoon, T.P.; Scaiano, J.C. Titanium dioxide visible light photocatalysis: Surface association enables photocatalysis with visible light irradiation. Chem. Commun. 2017, 53, 4335–4338. [Google Scholar] [CrossRef] [Green Version]
  39. Pirkanniemi, K.; Sillanpää, M. Heterogeneous water phase catalysis as an environmental application: A review. Chemosphere 2002, 48, 1047–1060. [Google Scholar] [CrossRef]
  40. Ohno, T.; Sarukawa, K.; Tokieda, K.; Matsumura, M. Morphology of a TiO2 Photocatalyst (Degussa, P-25) Consisting of Anatase and Rutile Crystalline Phases. J. Catal. 2001, 203, 82–86. [Google Scholar] [CrossRef]
  41. Zhou, D.; Luo, H.; Zhang, F.; Wu, J.; Yang, J.; Wang, H. Efficient Photocatalytic Degradation of the Persistent PET Fiber-Based Microplastics over Pt Nanoparticles Decorated N-Doped TiO2 Nanoflowers. Adv. Fiber Mater. 2022, 4, 1094–1107. [Google Scholar] [CrossRef]
  42. Gerischer, H.; Heller, A. Photocatalytic Oxidation of Organic Molecules at TiO2 Particles by Sunlight in Aerated Water. J. Electrochem. Soc. 1992, 139, 113–118. [Google Scholar] [CrossRef]
  43. Guo, Z.; Ma, R.; Li, G. Degradation of phenol by nanomaterial TiO2 in wastewater. Chem. Eng. J. 2006, 119, 55–59. [Google Scholar] [CrossRef]
  44. AEROXIDE TiO2 P 25. Available online: http://glenncorp.com/wp-content/uploads/2013/12/AEROXIDE-TiO2-P-25.pdf (accessed on 14 February 2023).
  45. Carneiro, J.O.; Vasconcelos, G.; Azevedo, S.; Jesus, C.; Palha, C.; Gomes, N.; Teixeira, V. The evaluation of the thermal behaviour of a mortar based brick masonry wall coated with TiO2 nanoparticles: An experimental assessment towards energy efficient buildings. Energy Build. 2014, 81, 1–8. [Google Scholar] [CrossRef]
  46. Spurr, R.A.; Myers, H. Quantitative Analysis of Anatase-Rutile Mixtures with an X-ray Diffractometer. Anal. Chem. 1957, 29, 760–762. [Google Scholar] [CrossRef]
  47. Barakat, M.A.; Al-Hutailah, R.I.; Qayyum, E.; Rashid, J.; Kuhn, J.N. Pt nanoparticles/TiO2 for photocatalytic degradation of phenols in wastewater. Environ. Technol. 2013, 35, 137–144. [Google Scholar] [CrossRef]
  48. Gaya, U.I.; Abdullah, A.H. Heterogeneous photocatalytic degradation of organic contaminants over titanium dioxide: A review of fundamentals, progress and problems. J. Photochem. Photobiol. C Photochem. Rev. 2008, 9, 1–12. [Google Scholar] [CrossRef]
  49. Laoufi, N.A.; Tassalit, D.; Benthahar, F. The degradation of phenol in water solution by TiO2 photocatalysis in a helical reactor. Glob. NEST J. 2008, 10, 404–418. [Google Scholar]
  50. Barka, N.; Bakas, I.; Qourzal, S.; Ait-Ichou, A.A.A.Y. Degradation of Phenol in Water by Titanium Dioxide Photocatalysis. Orient. J. Chem. 2013, 29, 1055–1060. [Google Scholar] [CrossRef] [Green Version]
  51. Peiró, A.M.; Ayllón, J.A.; Peral, J.; Doménech, X. TiO2-photocatalyzed degradation of phenol and ortho-substituted phenolic compounds. Appl. Catal. B Environ. 2001, 30, 359–373. [Google Scholar] [CrossRef]
Figure 1. Phenol HPLC calibration curve.
Chemengineering 07 00027 g001
Figure 2. SEM (A) and TEM (B) images of the commercial Aeroxide P-25 photo-catalyst.
Chemengineering 07 00027 g002
Figure 3. XRD pattern of the commercial Aeroxide P-25 photo-catalyst: (A) fresh catalyst; (B) after 5 catalytic cycles, each of 5 h.
Chemengineering 07 00027 g003
Figure 4. Phenol adsorption (without UV irradiation) and blank (without catalyst but with UV irradiation) experiments, all conducted at T = 40 °C and pH = 7.
Chemengineering 07 00027 g004
Figure 5. Effect of the initial phenol concentration on: (A) the phenol conversion; (B) the observed reaction rate (robs), fixing T = 40 °C and a catalyst loading of 0.50 g/L.
Chemengineering 07 00027 g005
Figure 6. Effect of the catalyst/phenol mass ratio on the reaction rate, fixing T = 40 °C and an initial phenol concentration of 25 ppm. Continuous lines represent the linear fit necessary to calculate the observed reaction rate (robs).
Chemengineering 07 00027 g006
Figure 7. Initial rate of reaction vs. catalyst concentration. Phenol concentration of 25 ppm, T = 40 °C.
Chemengineering 07 00027 g007
Figure 8. Photocatalytic degradation of phenol at different temperatures, fixing a catalyst loading of 0.125 g/L and an initial phenol concentration of 25 ppm.
Chemengineering 07 00027 g008
Figure 9. Arrhenius plot for the heterogeneous photodegradation of phenol.
Chemengineering 07 00027 g009
Figure 10. The effect of pH on the heterogeneous photodegradation of phenol, fixing T = 40 °C, an initial phenol concentration of 25 ppm, and a catalyst loading of 0.125 g/L.
Chemengineering 07 00027 g010
Figure 11. Reusability experiments results, fixing T = 40 °C, an initial phenol concentration of 25 ppm, and a catalyst loading of 0.125 g/L.
Chemengineering 07 00027 g011
Table 1. Properties of the Aeroxide P-25 catalyst.
PropertyValue
CAS-No.13463-67-7
Specific surface [m2/g]35–65
pH (in 4% dispersion)3.5–4.5
Density [g/cm3]4.1
Average particle size [nm]21
Tamped density [g/L]130
Anatase: rutile weight ratio80:20
TiO2 content [wt.-%]≥99.5
Al2O3 content [wt.-%]≤0.3
SiO2 content [wt.-%]≤0.2
Fe2O3 content [wt.-%]≤0.01
HCl content [wt.-%]≤0.3
Table 2. Experimental conditions for each kinetic experiment conducted in the batch reactor. C0: initial phenol concentration (ppm), ρcatalyst: loading (g/L), T: temperature (°C). * Experiment repeated to investigate the reusability of the catalyst.
TestC0 (ppm)ρcatalyst (g/L)T (°C)pH
A1250.125407
A25000.5407
B11160407
B2260407
1500 0.50407
21200.50407
3650.50407
4250.50407
5250.125407
6250.065407
7250.031407
8 *250.125307
9250.125507
10250.125403
11250.125405
12250.125407
13250.125708
Table 3. Calculated kinetic parameters of the reaction.
T (°C)C0 (mol L−1)robs (mol L−1 min−1)k (min−1)
302.84·10−43.14·10−71.10·10−3
402.79·10−43.74·10−71.34·10−3
502.80·10−44.39·10−71.57·10−3
Table 4. Kinetic parameters obtained from the Arrhenius plot.
ln(k0)Ea/R (kJ mol−1)R2
−1.1 ± 0.21.7 ± 0.60.998
Disclaimer/Publisher’s Note: The statements, opinions and data contained in all publications are solely those of the individual author(s) and contributor(s) and not of MDPI and/or the editor(s). MDPI and/or the editor(s) disclaim responsibility for any injury to people or property resulting from any ideas, methods, instructions or products referred to in the content.

