Article

The Effectiveness of Polyvinylidene Fluoride Membranes Modified with Poloxamer and Single/Multi-Walled Carbon Nanotubes for Lactalbumin Purification

1
Department of Chemical Engineering, Universitas Syiah Kuala, Jl. Syeh A. Rauf, No. 7, Banda Aceh 23111, Indonesia
2
Atsiri Research Center-Pusat Unggulan Iptek (PUI), Universitas Syiah Kuala, Jl. Syeh A Rauf, No. 5, Banda Aceh 23111, Indonesia
3
Graduate School of Environmental Management, Universitas Syiah Kuala, Jl. Tgk. Chik Pante Kulu, No. 5, Banda Aceh 23111, Indonesia
4
Faculty of Integrated Technologies, Universiti Brunei Darussalam, Bandar Seri Begawan BE1410, Brunei
5
School of Chemical & Biomedical Engineering, Nanyang Technological, University Singapore, Singapore 627833, Singapore
6
National Research Center on Membrane Technologies, Istanbul Technical University, Maslak, Istanbul 34469, Turkey
7
Department of Physiology, Faculty of Medicine, Universitas Syiah Kuala, Banda Aceh 23111, Indonesia
*
Author to whom correspondence should be addressed.
ChemEngineering 2022, 6(6), 88; https://doi.org/10.3390/chemengineering6060088
Submission received: 3 September 2022 / Revised: 8 October 2022 / Accepted: 4 November 2022 / Published: 10 November 2022

Abstract

:
The application of separation technology using ultrafiltration/nanofiltration membranes for protein purification and concentration has grown rapidly in the last decade. Innovations to synthesize membranes with properties and performance that suit the characteristics of the feed solution have been and will keep developing. This study aims to examine the strategies to improve the performance of the Polyvinylidene Fluoride (PVDF) membrane for lactalbumin protein isolation. The PVDF polymer membrane was modified by adding Poloxamer 188 (Po1) copolymer and a combination of two types of nanocarbons, i.e., single-walled carbon nanotubes (S-CnT) and multi-walled carbon nanotubes (M-CnT). The following membrane characteristics were examined: mechanical properties, morphological structure, porosity, elemental composition and functional groups, and surface hydrophilicity. The membrane’s filtration performance was analyzed in terms of its ability to pass water (flux) and concentrate lactalbumin protein. The results showed that the changes in the membrane morphological structure were clearly visible in the SEM test, which exposed more open membrane pores after adding Pol and S-CnT/M-CnT additives. The mechanical properties of the membrane also increased, as indicated by the increase in the tensile strength from 12.1 MPa to 16.07 MPa. In general, it was found that the composition of the PVDF/Pol/S-CnT/NMP polymer solutions resulted in better filtration performance compared to the membranes made of only the PVDF/NMP polymer solution.

1. Introduction

Whey is a byproduct of the cheese-making process; it is known to have high nutritional value, especially for protein, and is rich in sulfates and essential amino acids. Currently, there are two types of whey on the market; whey protein concentrates (WPC) and whey protein isolates (WPI). In general, WPC has a protein content of around 35% to 85%, while WPI contains 90% protein and almost no carbohydrates. Therefore, WPI is often used to meet the nutritional needs of athletes. Whey has a dominant protein component called lactalbumin. The percentage of lactalbumin in whey is 20% or 3–4% of the total protein in milk. Lactalbumin contains the essential amino acid tryptophan, which is important for brain development in infants. Lactalbumin functions as a component of the lactose synthase enzyme, which is useful in the biosynthesis of lactose in milk. In addition, lactalbumin also functions as an apoptotic or antitumor, anticancer, antibacterial, and antiviral. Such benefits of lactalbumin for the human body encouraged the experts to isolate it. The yield of lactalbumin isolation from cow’s milk carried out by experts amounts to ±1.2 g/L [1].
Barone et al. (2020) applied selective precipitation and ion exchange methods to concentrate lactalbumin protein in whey [2]. Then, Jiang et al. (2020) used another method for separating lactalbumin, namely aqueous two-phase flotation (ATPF) using 1000 g/mol polyethylene glycol (PEG1000)/trisodium citrate. However, these methods are less efficient due to their costs, even though the separation was considered ideal [3].
The use of membranes is a promising alternative for the separation process in the industry [4,5,6]. The development of membrane technology applications in the environmental and biomedical fields is growing rapidly, which has encouraged researchers to develop modified membrane technology for the process of lactalbumin separation in whey [3]. The use of membranes has many advantages, including the relatively easy and inexpensive preparation process, low energy consumption, combinability with other processes, and modifiability of the membrane characteristics, in which membranes can be developed according to the purpose of application [7,8].
Membranes can be synthesized from various materials such as ceramics, polymers, or macromolecules [9,10]. Polymers are the most widely used membrane materials in the manufacture of microfiltration, ultrafiltration, and nanofiltration membranes. Polyvinylidene Fluoride (PVDF) is one of the prime polymers widely applied, including in seawater desalination, wastewater treatment, and chemical production processes [11]. PVDF has excellent physical and chemical resistance, thermal stability, and film-forming properties [6,12,13]. However, PVDF polymer is highly hydrophobic, which triggers cake formation on the membrane surface and causes fouling. As a result, the purification time becomes longer and uneconomical. Therefore, PVDF is usually modified using additives to increase membrane hydrophilicity and prevent fouling.
Several previous studies have applied membrane technology in protein isolation. Lin et al. (2020) modified PVDF membranes using PEG porogen for the purification of Bovine Serum Albumin (BSA) protein. The best results were obtained with the addition of 6 w/t% PEG, in which the permeate flux increased to 60 LMH·bar−1 and BSA rejection of 90% [14]. Vatanpour and Khorshidi (2020) modified PVDF membranes by coating the membrane surface using ZIF-8 nanoparticles for BSA separation and dye removal processes. After modification, the value of pure water flux increased from 43.1 to 57.5 L/m2·h with BSA rejection >98% and rejection of Rhodamine B, Reactive Green 19, and Direct Black 38 by 74%, 82% and 98%, respectively [15]. Modification of the PVDF membrane using multi-walled carbon nanotubes (MWCNT) and zeolitic imidazolate framework-8 (ZIF-8) has also been carried out by Wanie et al. (2020) to reject Bovine Serum Albumin (BSA) and humic acid. The highest pure water flux for the PVDF/ZIF-8 membrane was 56.96 L/m2·h, while the highest water flux for the PVDF/MWCNT membrane increased to 73.03 L/m2·h. In the filtration test, the PVDF/ZIF-8 membrane achieved the highest rejection value for humic acid solution (≥94%) and BSA (≥92%) compared to other membranes [16]. In another study, PVDF membranes were also modified using hydrothermal carbon nanospheres (CNS) by Yu et al. (2020) to increase membrane hydrophilicity and antifouling ability to reject Bovine Serum Albumin (BSA). The highest pure water flux, BSA rejection, and flux recovery ratio (FRR) increased in the membrane with the addition of 0.2 wt% CNS, namely 956.72 L/m2·h, 95.8%, and 83.21% [11].
Limited studies in the literature have been conducted on protein isolation in whey using membranes, let alone developing a membrane for this particular application. Therefore, it is necessary to conduct further studies to modify membranes with more optimal characteristics and performance for the isolation of lactalbumin protein in whey. Our recent work [8] reported the development of a polysulfone (PES)-based ultrafiltration membrane for the filtration of α-lactalbumin protein solution by employing Pluronic F127 and carbon nanotubes with single- and multi-walled carbon nanotubes (S-CnT and M-CnT) as the additives. In this study, a more challenging PVDF polymer was used as the basis to develop membrane material for lactalbumin protein isolation. PVDF is more hydrophobic than PES, with surface tensions of 29.2 and 46.6 mN/m, respectively. Unlike our earlier work that coupled Pluronic F127 and S-CnT and M-CnT as the additive, this study explores combinations of Poloxamer and S-CnT and M-CnT as the additives for the development of PVDF UF membranes. Poloxamer has an optimal hydrophilic/lipophilic balance and a high molecular weight. Poloxamer is used to modify the membrane surface and improve the pore structure [17], while carbon nanotubes are used as additives to increase the membrane’s durability, selectivity, and mechanical strength. Membrane modification is carried out optimally using organic and inorganic additives. The combination of the two additives is to improve the membrane characteristics comprehensively to increase the membrane performance for lactalbumin isolation in whey.

2. Materials and Methods

2.1. Materials

The polymer used as the main component of the membrane is Polyvinylidene Fluoride powder (PVDF, average Mw~534,000) obtained from Sigma Aldrich. The hydrophilic forming agent Poloxamer 188 was purchased from (99%, WAKO, Osaka, Japan). Pore-forming additives for carbon nanotubes, both single and multi-walled, were obtained from Sigma Aldrich. To dissolve the polymers and additives, N-Methyl Pyrrolidone (NMP) from WAKO, Pure Chemical Industries, Ltd. was used. (Osaka, Japan). Deionized water as a coagulation medium of the cast polymer solution was obtained from the Chemical Engineering Operations Laboratory, Syiah Kuala University, Banda Aceh. Finally, whey and lactalbumin protein as reagents for the protein concentration process were ordered from WPI 93 Glanbia, Jakarta, Indonesia.

2.2. Preparation of Membrane

The membrane was prepared using the phase inversion method by varying the type of carbon nanotube additive used. The dope solution was prepared by dispersing the inorganic components of S-CnT and M-CnT in NMP in different bottles using an ultrasonicator (Branson 8510) at 40 kV. Then 20% w/v PVDF and 3% w/v Poloxamer were added to the mixture. Four types of polymer solutions were prepared with the compositions, as shown in Table 1. Each solution mixed with the polymer and additives was magnetically stirred for 24 h and put on a hotplate. The homogeneous polymer solution was cast on a glass plate using a membrane auto applicator (Yoshimitsu, Japan) with a film thickness of 300 µm. The glass plate, along with the cast solution, was immediately immersed in a non-solvent (distilled water) for the membrane to solidify. The resulting membrane sheets were stored in a container containing distilled water at room temperature before being examined for their properties, characteristics, and filtration performance.

2.3. Swelling Analysis

Swelling is one of the membrane’s physical property parameters, which can be evaluated based on the gravimetric principle. The membrane was cut to a uniform size and then dipped in deionized water for 24 h to obtain the wet weight. Then the membrane was dried in an oven for 2 h at 50 °C to obtain the dry membrane. Swelling on the membrane can be calculated using Equation (1) [18].
Swelling = W wet W dry W dry × 100 %
where Wwet = Membrane wet weight (gram), Wdry = Membrane dry weight (gram),

2.4. Membrane Composition and Morphological Analysis

Surface morphology and membrane cross-section were observed using Scanning Electron Microscopy (SEM, JEOL JSM-6360 LA) at 20 kV voltage. For cross-sectional analysis, each of the membranes was dipped in liquid nitrogen for a few seconds until the sample hardened, and then it was broken using tweezers at both ends. Surface and cross-section samples were mounted on metal channels and then coated with osmium powder for 30 min. The samples were then mounted for SEM imaging and photographed at 1000 and 10,000× magnification. The same samples were used to analyze the composition of the membrane constituent elements using SEM-EDX.

2.5. Identification of Chemical Functional Groups

The membrane’s functional groups were analyzed using Fourier transform infrared spectroscopy (FTIR, NicoletTM iS50 Spectrometer). The membrane samples with a size of 1 × 1 cm were dried in an oven at 40 °C for 2 h. Subsequently, the membrane samples were left at room temperature for approximately 2 h. Each membrane sample was placed at the end of the NicoletTM iS50 Spectrometer sample panel, and the transmittance was read at a wave number of 400–4000 cm−1.

2.6. Porosity and Pore Size

The method used to test the membrane porosity was by first immersing the membrane in water for 24 h at room temperature. The membrane was then weighed for its wet weight. After that, the membrane was dried in an oven at 50 °C for 2 h and then weighed for its dry weight. This was carried out 3 times with the same treatment to obtain the appropriate results. The membrane porosity and pore size can be calculated using Equations (2) and (3) [19].
ε   % = W 1 W 2 ρ · A · l × 100 %
where W1 = Membrane wet weight (gram), W2 = Membrane dry weight (gram), ρ = Water density (gram/cm2), A = Membrane surface active area (cm2), and I = Membrane thickness (cm)
rm   μ m = ( 2 . 9 1 . 75 ε ) × 8 η lQ ε × A × Δ P
where ε = Porosity, I = Membrane thickness (cm), η = Water Viscosity (8.9 × 10⁻⁴ Pa·s), Q = Permeate flow rate (cm3/s), and ∆P = pressure difference (Pa).

2.7. Surface Hydrophilicity

The membrane hydrophilicity was tested by dripping water onto the dry membrane surface using a water contact angle meter (KSV Attension Theta device, Turkey). The membrane was first dried in an oven at 50 °C for 2 h. The dry membrane was then put on a glass plate, and a 0.7 µL drop of water was used to measure the contact angle. The contact angle of the water and the membrane surface was read 5 times from different angles. The average value of the repetition was calculated as an indication of membrane hydrophilicity. The smaller the WCA, the better the hydrophilicity value.

2.8. Membrane Mechanical Properties

The membrane mechanical properties evaluated were tensile strength and elongation, analyzed using the Autograph AGS J device, Japan, in line with ASTM D 638-14. The membrane was cut to resemble a dumbbell. It was tested for tensile strength at a tensile speed of 10 mm/min. The two ends of the membrane sample were clamped on a tensile tester, and then the sample was pulled apart until it broke. The applied tensile force (kgF) and the membrane elongation (∆l) were recorded. The test was carried out 3 times to get optimum results.

2.9. Membrane Filtration Performance

The type of filtration performance evaluated was the membrane’s ability to pass water, known as flux, and concentrate lactalbumin protein. Flux measurement is carried out to determine the ability of the membrane to pass a specific volume of feed. Flux is the volume of water that passes through the membrane per unit active area in unit time. Deionized water was fed to a crossflow flat sheet module membrane using a peristaltic pump at 2 Bar pressure for 1 h until compaction occurred. Furthermore, filtration was carried out with a pressure of 1 Bar, and the permeate volume was calculated every 10 min for one hour.
The flux (L/m2·hour) can be calculated using Equation (4) [19].
Flux =   V A   ×   Δ t
where V = permeate volume (L), A = membrane active surface area (m2), and t = permeate collection time.
The membrane application test for lactalbumin protein isolation was carried out on a laboratory scale using a series of crossflow modules. 100 mL of whey solution at 1000 ppm concentration was fed through a membrane layer installed in the module for 3 h with an operating pressure of 1 atm. The mass of the whey solution feed was weighed in advance. The permeate solution was collected in a glass beaker while the retentate flowed back into the feed. After the filtration process had been running for 3 h, the feed solutions were taken, and the lactalbumin concentration was analyzed using a UV-VIS spectrophotometer. The percentage of lactalbumin concentration obtained was calculated through the rejection coefficient value in Equation (5).
R = 1 ( Cp Cf ) ×   100 %
where R = Rejection coefficient (%), Cp = Concentration of solute in permeate (mg/L), Cf = Concentration of solute in feed (mg/L).

3. Result and Discussions

3.1. Swelling

Figure 1 shows the results of the swelling test for all membrane samples. The data obtained showed that the swelling on the M0, M1, M2, and M3 membranes was 95.055%, 135.458%, 67.249%, and 45.948%. The membrane swelling increased when P188 was added to the polymer solution but decreased when both P-188 and CnT were added. The swelling decreased significantly when only CnT was added to the polymer solution. The smaller the swelling, the better the mechanical properties. M2 and M3 membranes underwent a decrease in swelling after being modified using S-CnT (single-walled carbon nanotubes) and M-CnT (multi-walled carbon nanotubes). The addition of the CnT additive reduced the swelling of the membrane wall, which could cause damage to the membrane matrix. When the membrane is in contact with water, the inner macrovoid cavity will retain water and increase the wet weight of the membrane, which is a measure of the swelling of the membrane [20]. Membranes with the addition of M-CnT underwent a greater decrease in swelling than membranes with S-CnT, due to the difference in the number of constituent walls, where the former was composed of many walls, which provided excellent mechanical properties [21].

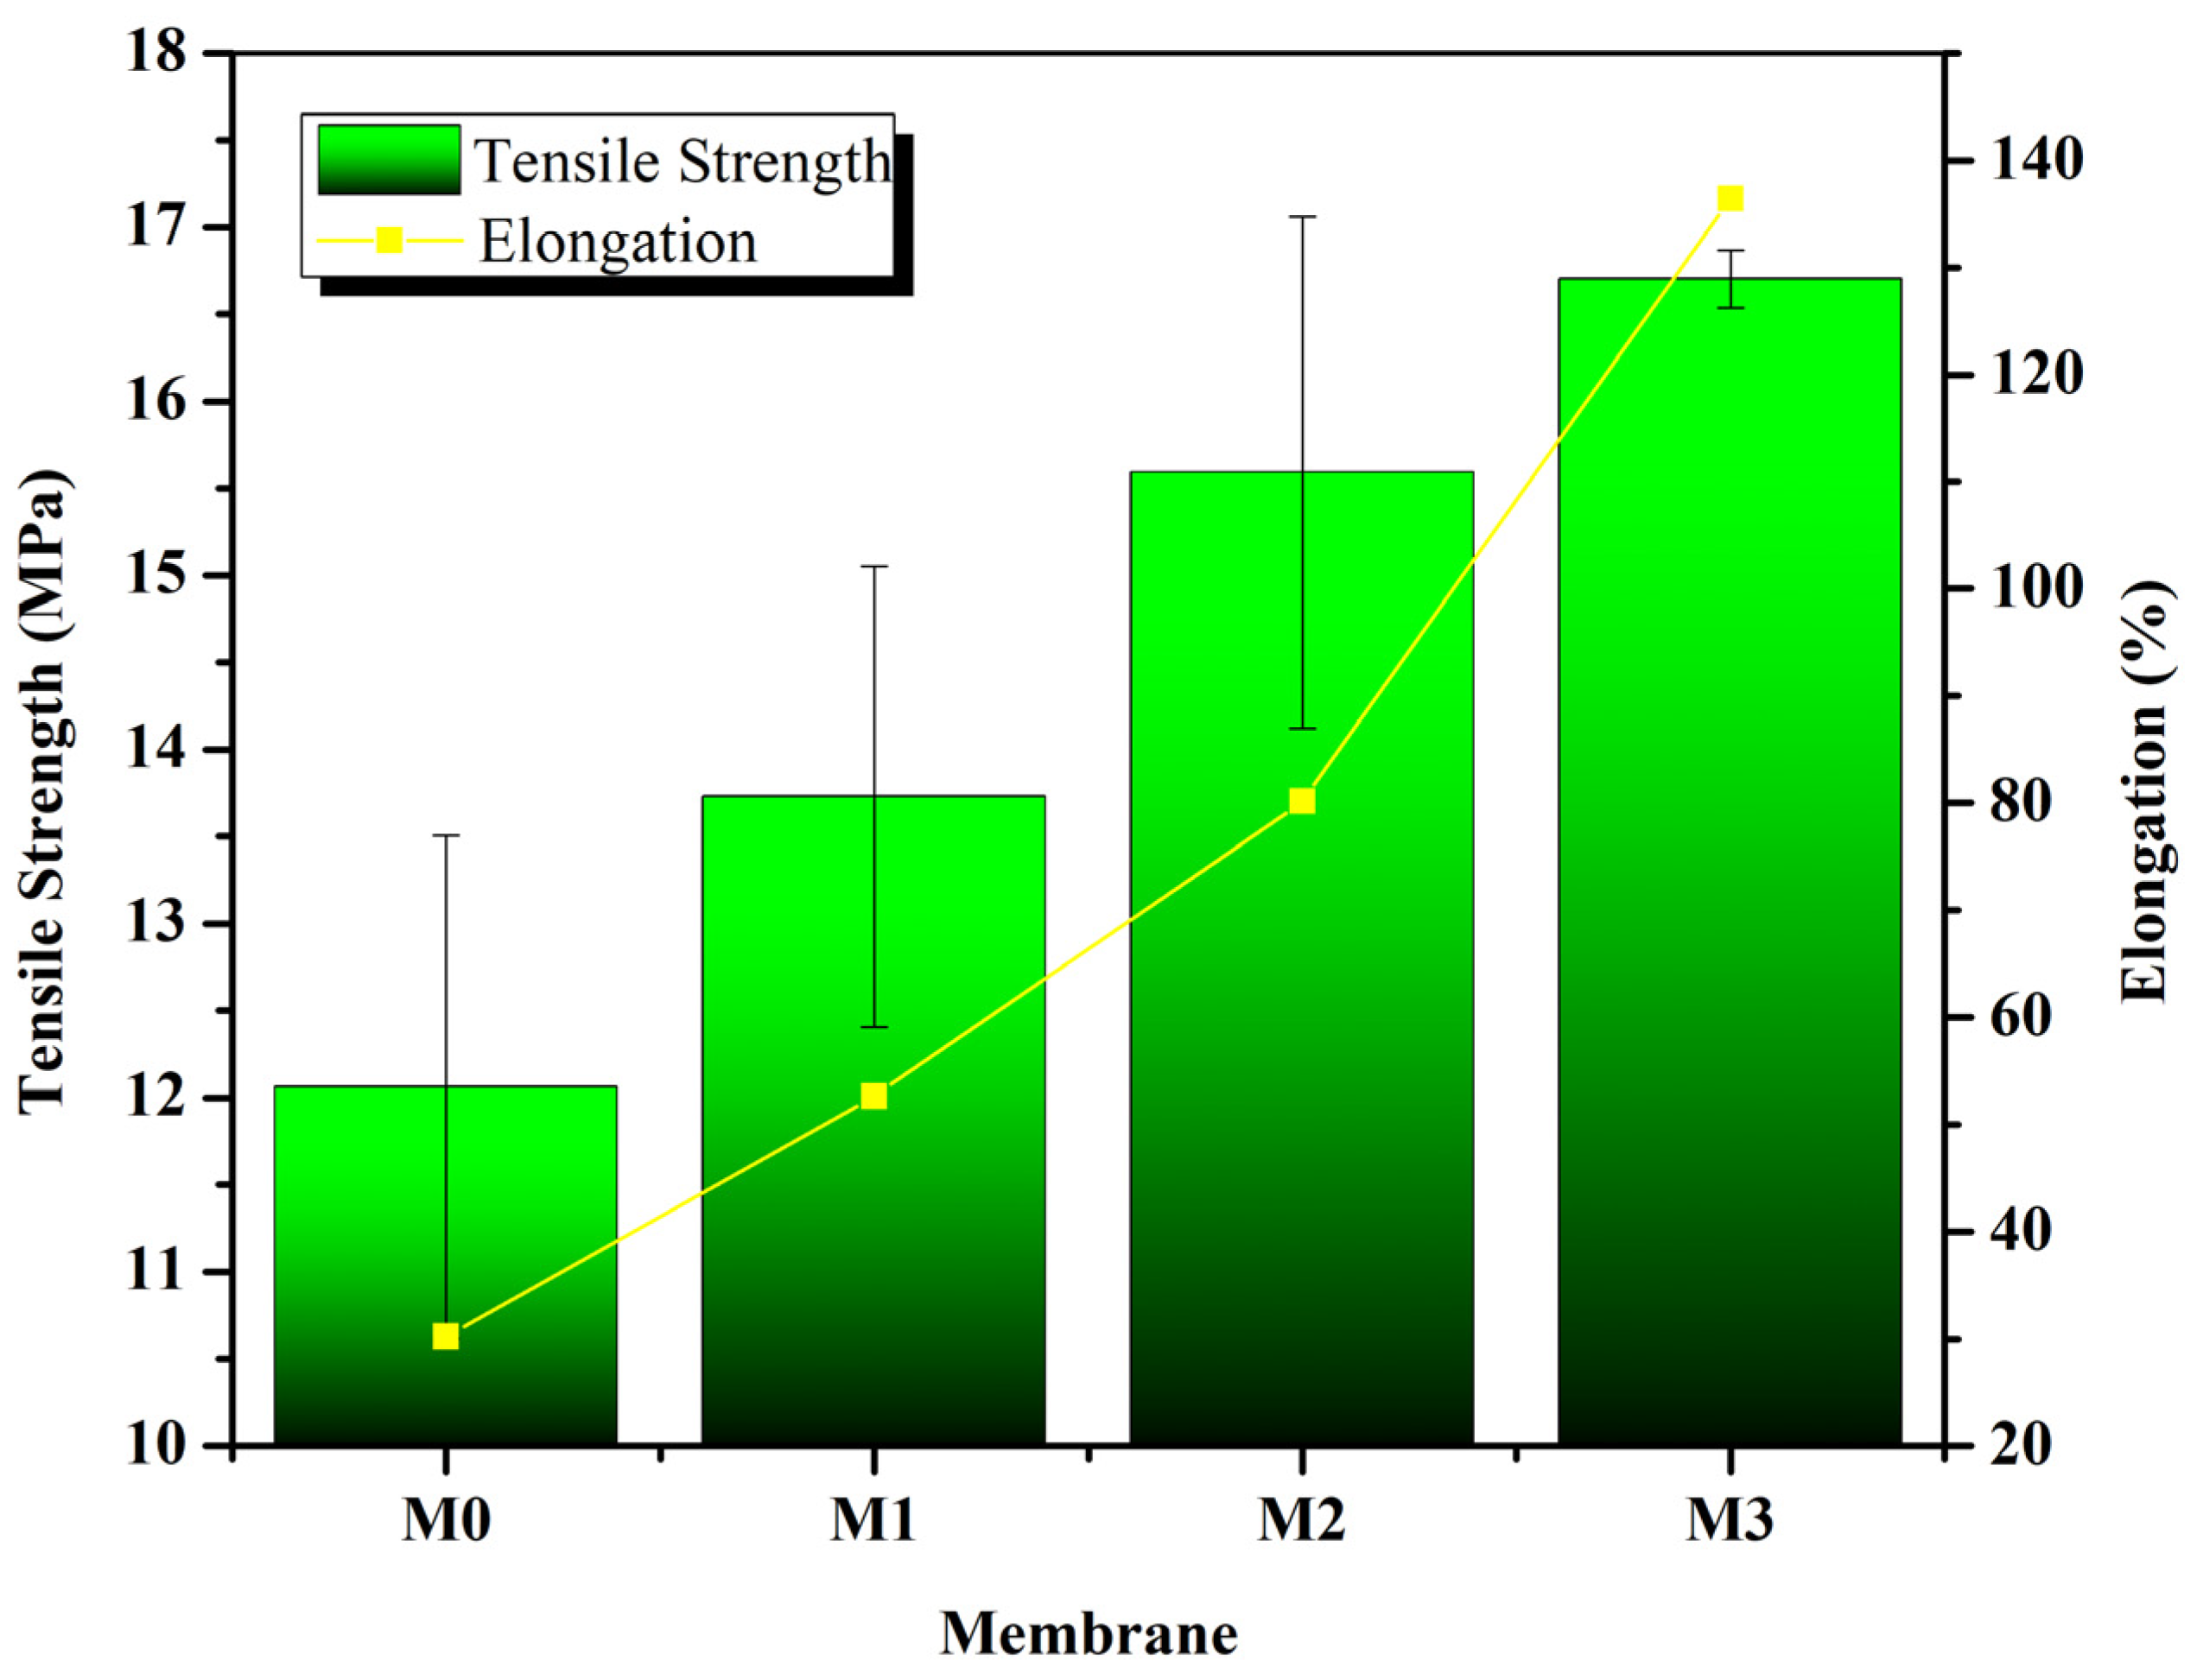
3.2. Tensile Strength

In addition to being carried out gravimetrically, the mechanical properties test was also carried out physically by the tensile strength test. Tensile strength is the maximum stress limit a sample can withstand when stretched before it breaks. Meanwhile, elongation is the percentage of membrane elongation ability indicating a sample elasticity. Tensile strength testing was carried out to examine the mechanical ability of the membrane.
Figure 2 shows that the M3 membrane, which is the membrane with the addition of 3% Poloxamer and 0.1% M-CnT, has the highest tensile strength and elongation values of 16.07 MPa and 136%, respectively. Meanwhile, the M0, M1, and M2 membranes have lower tensile strength and elongation values than M3, but the difference is not too significant, namely 12.06 MPa, 13.7284 MPa, 15.59 MPa, and 30.2%, 52.65%, 80.15%. Based on these values, the tensile strength profile of the membranes in this study demonstrates good mechanical properties. A previous study on the addition of M-CnT to produce FeCu nanocomposites reported that the strong C–C covalent bonds and CNT wall structure provided excellent mechanical capabilities, such as a high Young’s modulus and strong resistance to breakage. The study also confirmed an increase in the thermal characteristics and capabilities of the nanocomposite with the addition of M-CnT [21].

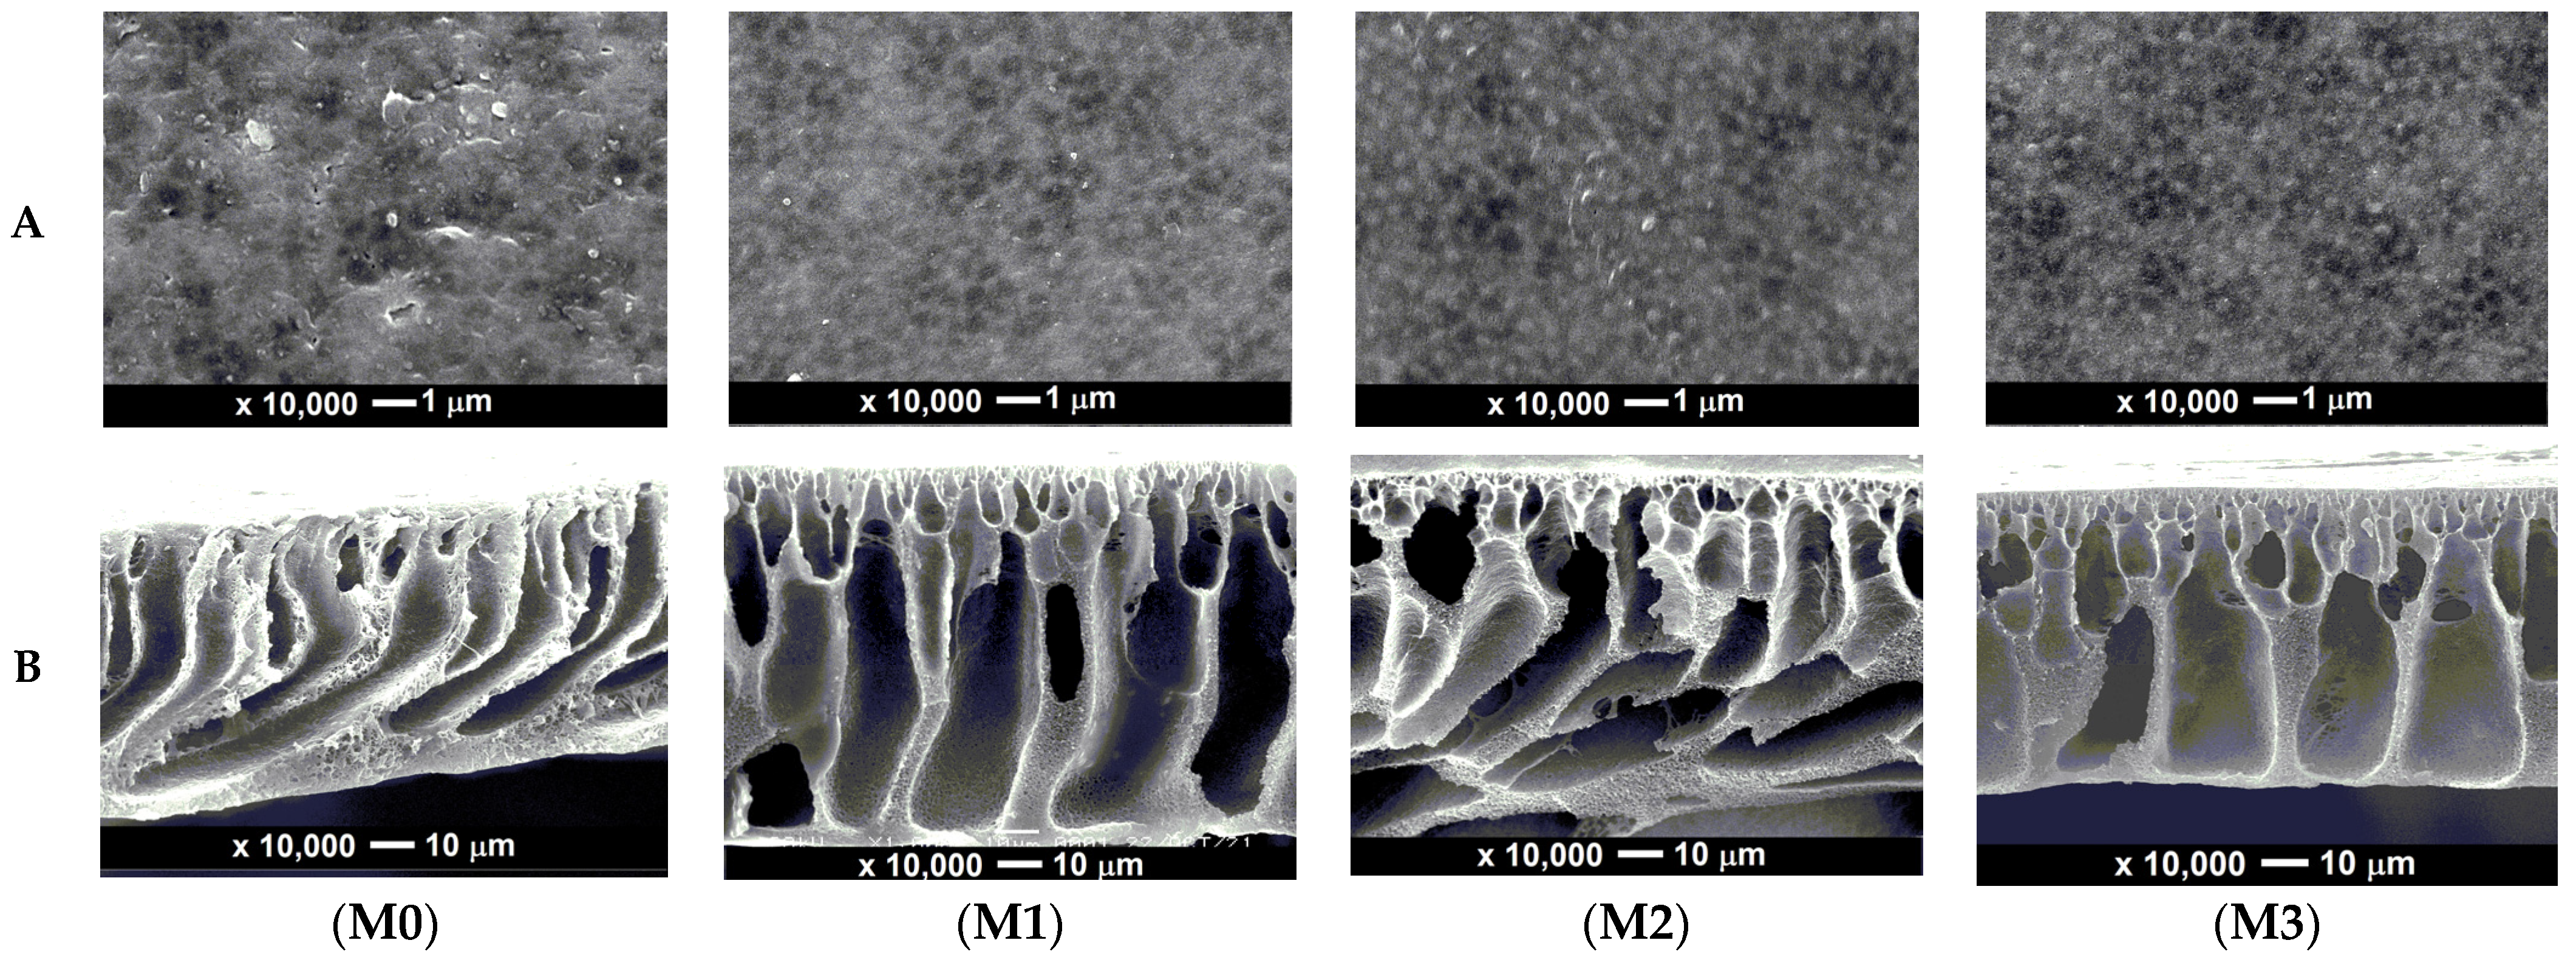
3.3. Membrane Morphology

The membrane surface morphology and cross-section were analyzed using a Scanning Electron Microscopy instrument. The purpose of this analysis is to see the differences or changes in morphology on the surface and cross-section of the PVDF membrane before and after modification. The surface structure and cross-section of the membranes on SEM analysis are presented in Figure 3. There are differences in the structure of pure PVDF membranes and modified PVDF membranes. The membranes were prepared using the phase inversion method to form an asymmetrical transverse structure with a thin structure on the top layer, a finger-like pore structure near the top layer, a macrovoid structure near the bottom layer, and a dense pore structure on the bottom layer. Such a morphological structure is a general form of membrane morphology produced through the phase inversion method by solidification in a container with a non-solvent such as water.
The differences in the morphology of the membranes formed in all samples of this study were in the number and size of finger-like and macrovoid structures. Compared to the M0 membrane, the M1, M2, and M3 membranes showed a structural change in the form of an enlarged finger-like void due to the addition of Pol and CnT. The membrane surface in Figure 3 does not show any cracks or excessive agglomeration, indicating that the additives were well dispersed in the membranes.
It can be inferred that the M0, M1, M2, and M3 membranes are ultrafiltration membranes. Ultrafiltration membranes have a pore size of 0.001–0.1 µm [22]. M3 membrane has the largest pore size due to the addition of Pol, which increased its hydrophilicity by increasing its pore size and the addition of M-CnT, which was more effective in improving the membrane’s physical properties, as M-CnT has a multi-layered structure.

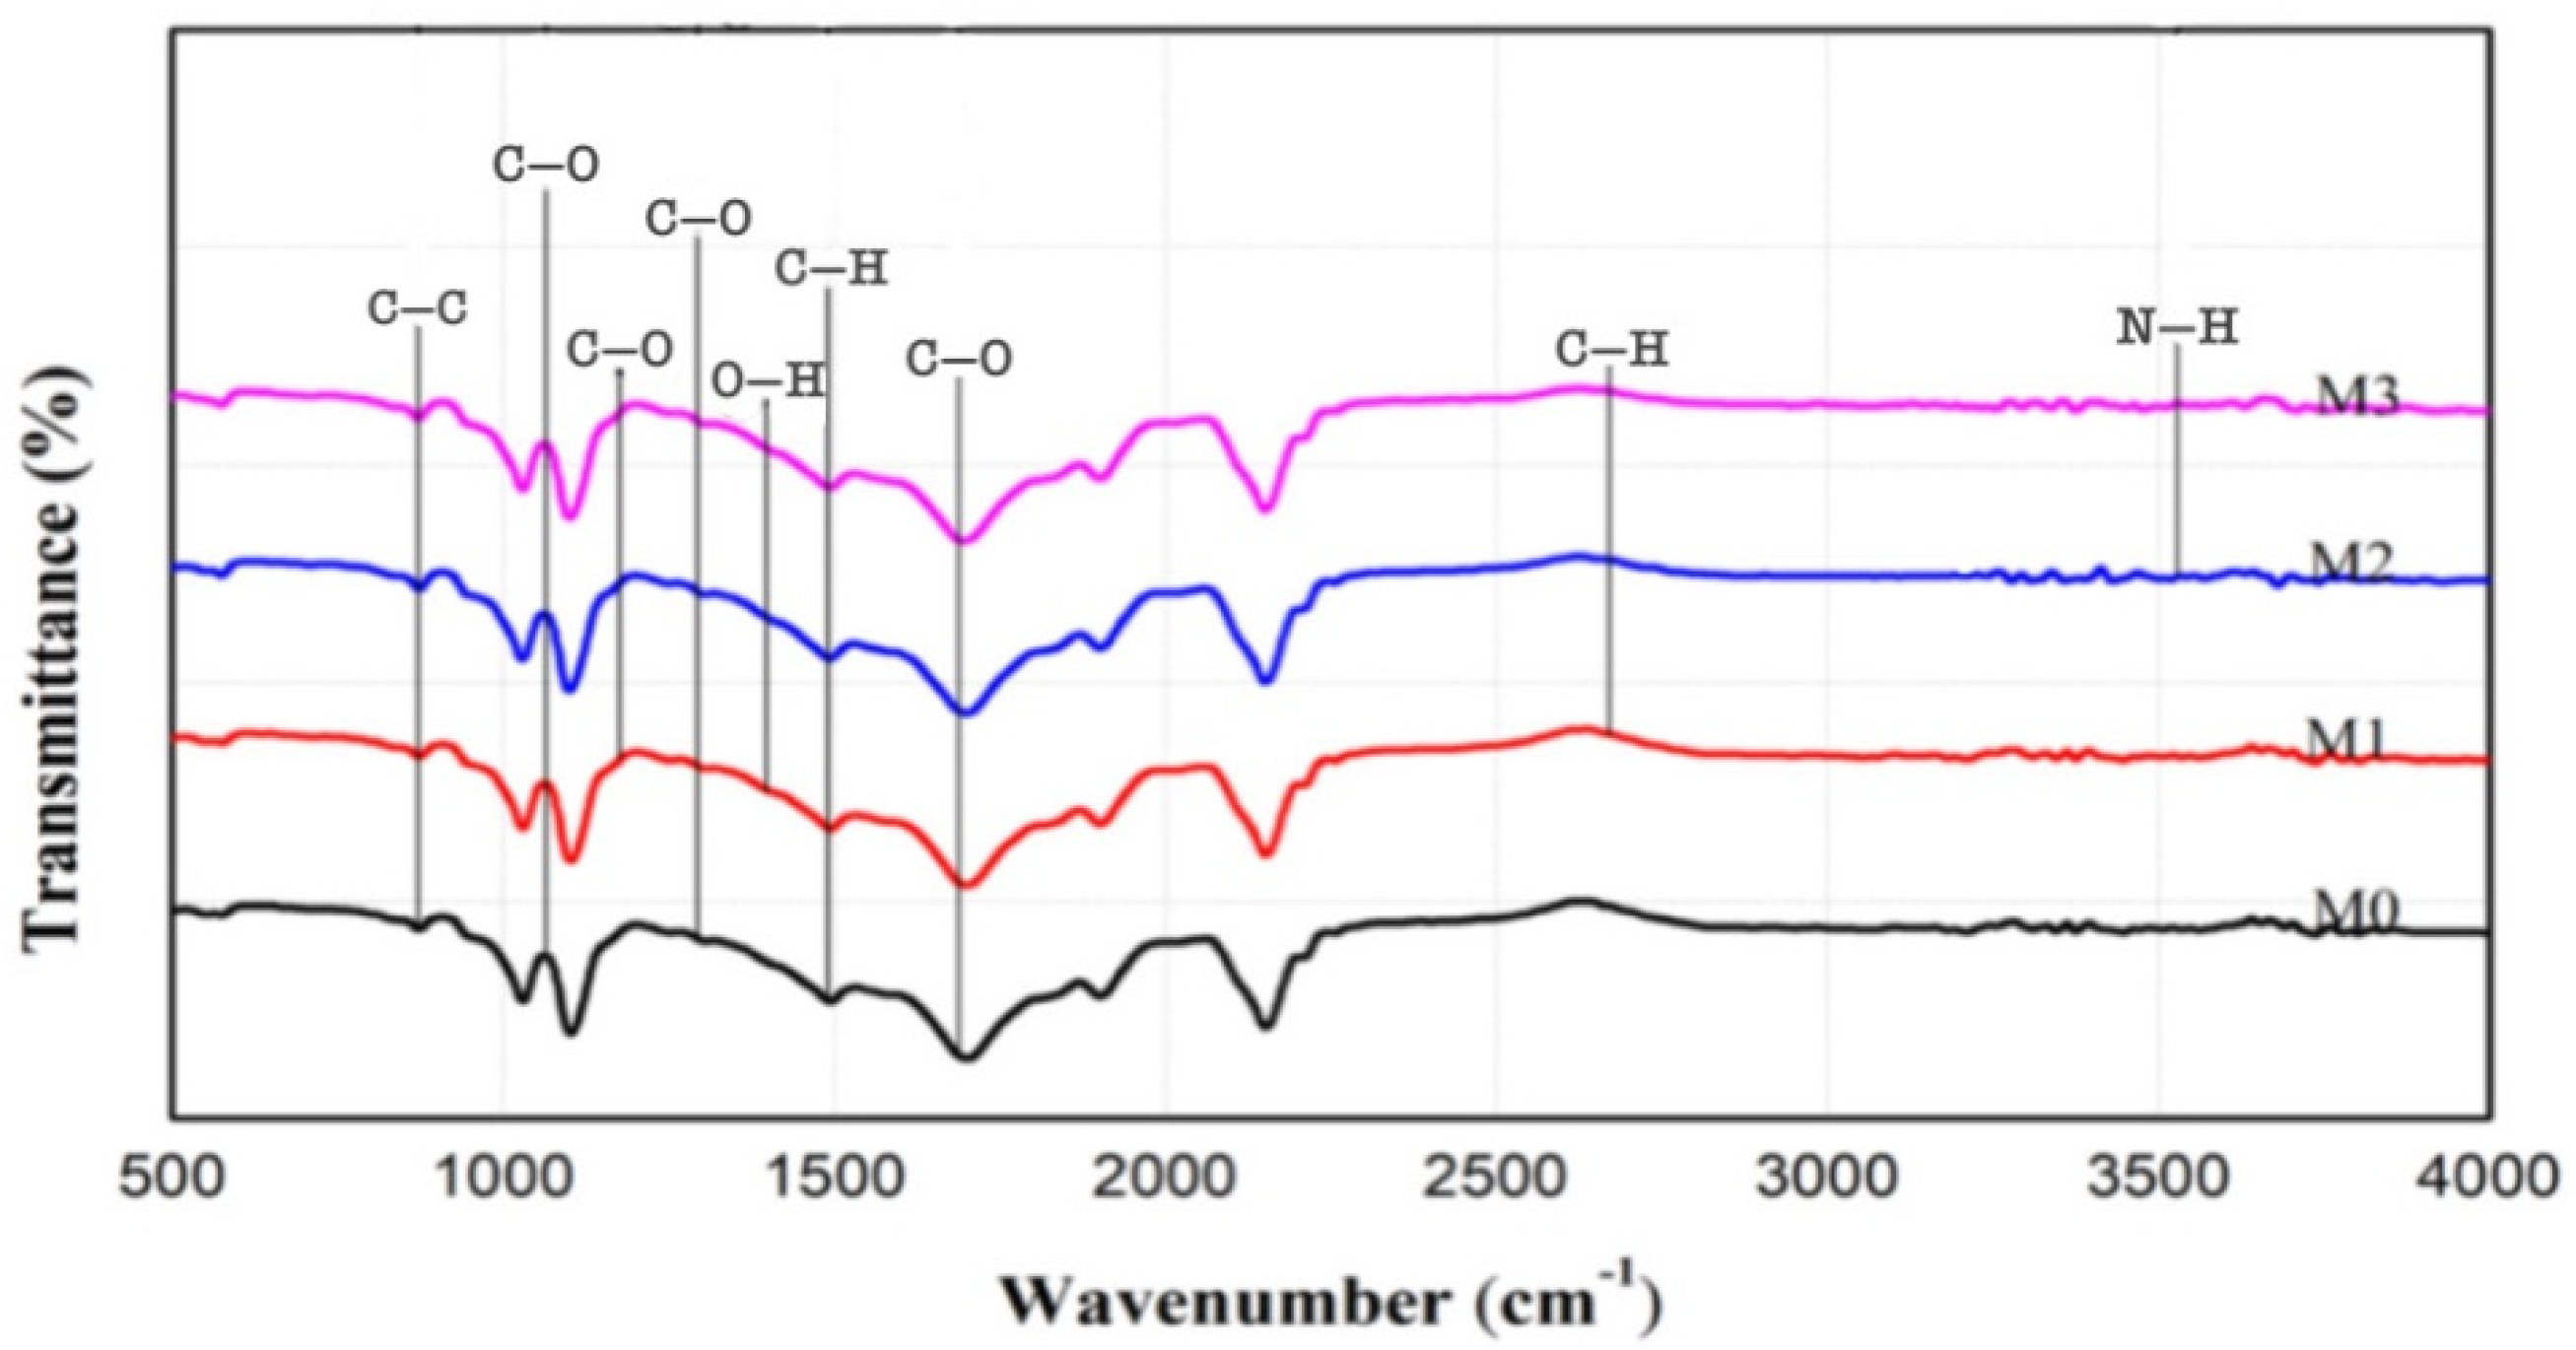
3.4. Functional Groups of the Membranes

Figure 4 shows the FTIR analysis results to determine the polymer functional groups. The specific IR spectra of PVDF membranes appear at wavenumbers between 1800–400 cm−1, which indicate double bonds for C=C and C=O atoms with weak intensity [23]. The C=C functional group was detected at a wave number of 874.12 cm−1, and the C=O functional group at a wave number of 1687.89 cm−1. On the modified M1, M2, and M3 membranes using Pol 3% polymer, the C–H functional groups were identified at wave numbers 2870.99 cm−1, 2871.51 cm−1, and 2871.77 cm−1, and O-H groups at wave numbers 1401.03 cm−1, 1400.81 cm−1, and 1400.67 cm−1 [15,24]. Then there are C–O functional groups at wave numbers 1175.10 cm−1, 1174.94 cm−1, and 1172.90 cm−1. This is in accordance with a study [25] which reported that in Pol polymers, C–H functional groups are identified at a wave number of 2883.38 cm−1, O-H at a wave number of 1348.15 cm−1, and C–O at a wave number of 1107.06 cm−1. Then, on the M2 and M3 membranes which were modified with the addition of 0.1% nanocarbon (S-CnT & M-CnT), the presence of the N-H functional group was identified at wave numbers of 3529.98 cm−1, 3530.11 cm−1, 3530.01 cm−1, and 3530.57 cm−1. This is in accordance with a study that membrane with the addition of nanocarbon (S-CnT and M-CnT) has an N-H functional group at a wave number of 3530 cm−1, C–H at a wave number of 2922 cm−1, and C=O at 1730 cm−1 [26].

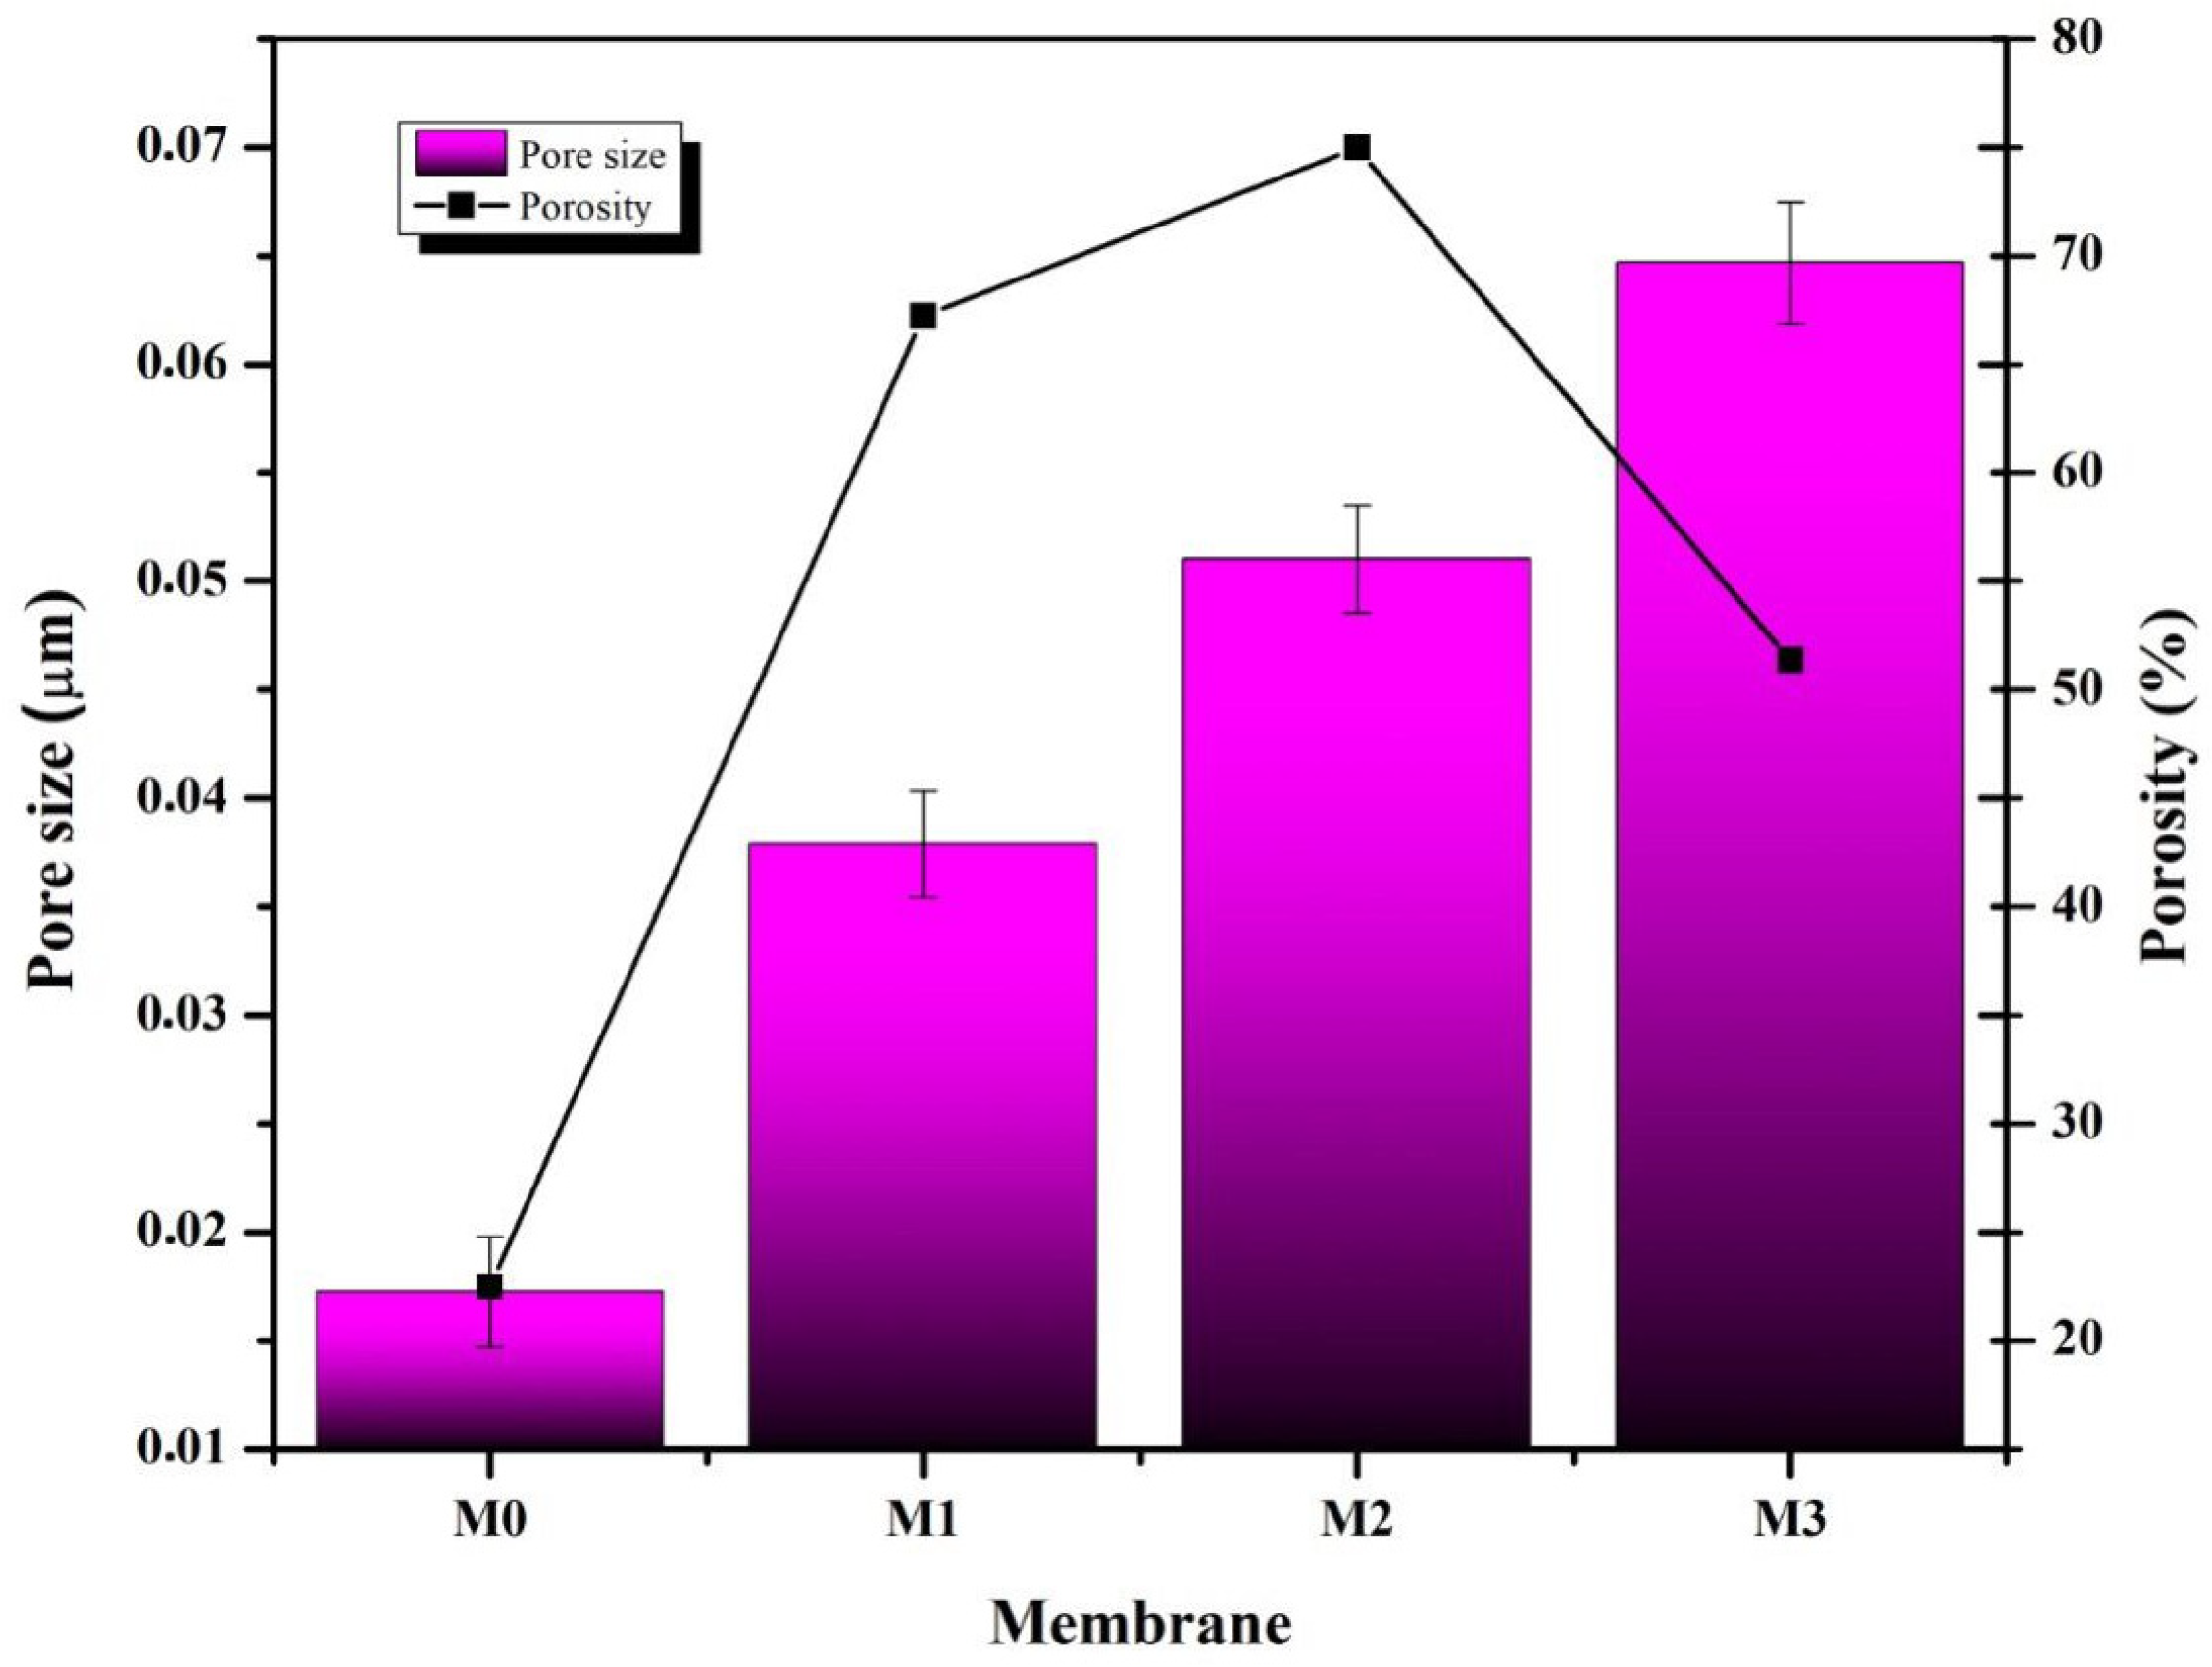
3.5. Porosity and Pore Size

Pore size and porosity are closely related to membrane filtration performance. The pore size of the membrane affects the permease performance and the selectivity of the membrane during filtration. The results of the pore size analysis and porosity can be seen in Figure 5. The pore size of the PVDF membrane (M0) increased when the hydrophilic additive Plo was added to the polymer solution (M1). The membrane’s pore size increased even further when the polymer solution was added with a combination of Plo additives and S-CnT and M-CnT nanoparticles. The increase in the size of the macrovoid, as evaluated by SEM in Figure 3, provides evidence of an increase in the pore size of the M1, M2, and M3 membranes. Pol has been widely used as a pore-forming agent for various types of polymeric membranes. The presence of Pol in the polymer solution had an impact on increasing the pore size of the membrane [27].
Furthermore, the addition of nanoadditives such as carbon nanotubes in the polymer solution has an impact on increasing the size of pores. The tube dimension of carbon nanotubes helps water transport during phase inversion, leading to faster solvent–non-solvent exchange and resulting in a membrane with larger pores. This membrane pore size phenomenon has also been observed by other researchers. The membrane pore size in this study ranged from 0.037 µm to 0.087 µm. Ultrafiltration membranes have pore sizes ranging from 0.001–0.1 µm. In other words, the membrane in this study belongs to the ultrafiltration category.
What is interesting from the findings of this study is that the increase in the pore size of the PVDF/Pol/M-CnT (M3) membrane is not necessarily proportional to the increase in porosity. From Figure 5, it can be understood that the highest porosity of 74.98% was found in the M2 membrane, which has the composition of the PVDF/Pol/S-CnT polymer solution. Carbon nanotubes have carbon elements with strong C–C covalent bonds. S-CnT and M-CnT have differences in their constituent walls. M-CnT has many walls, which could make the blending process more difficult so that the resulting pore distribution on the membrane is uneven [21]. Thus, the pore distribution or porosity of the M3 membrane containing M-CnT was not higher than that of the M2 membrane containing PVDF/Pol/S-CnT.

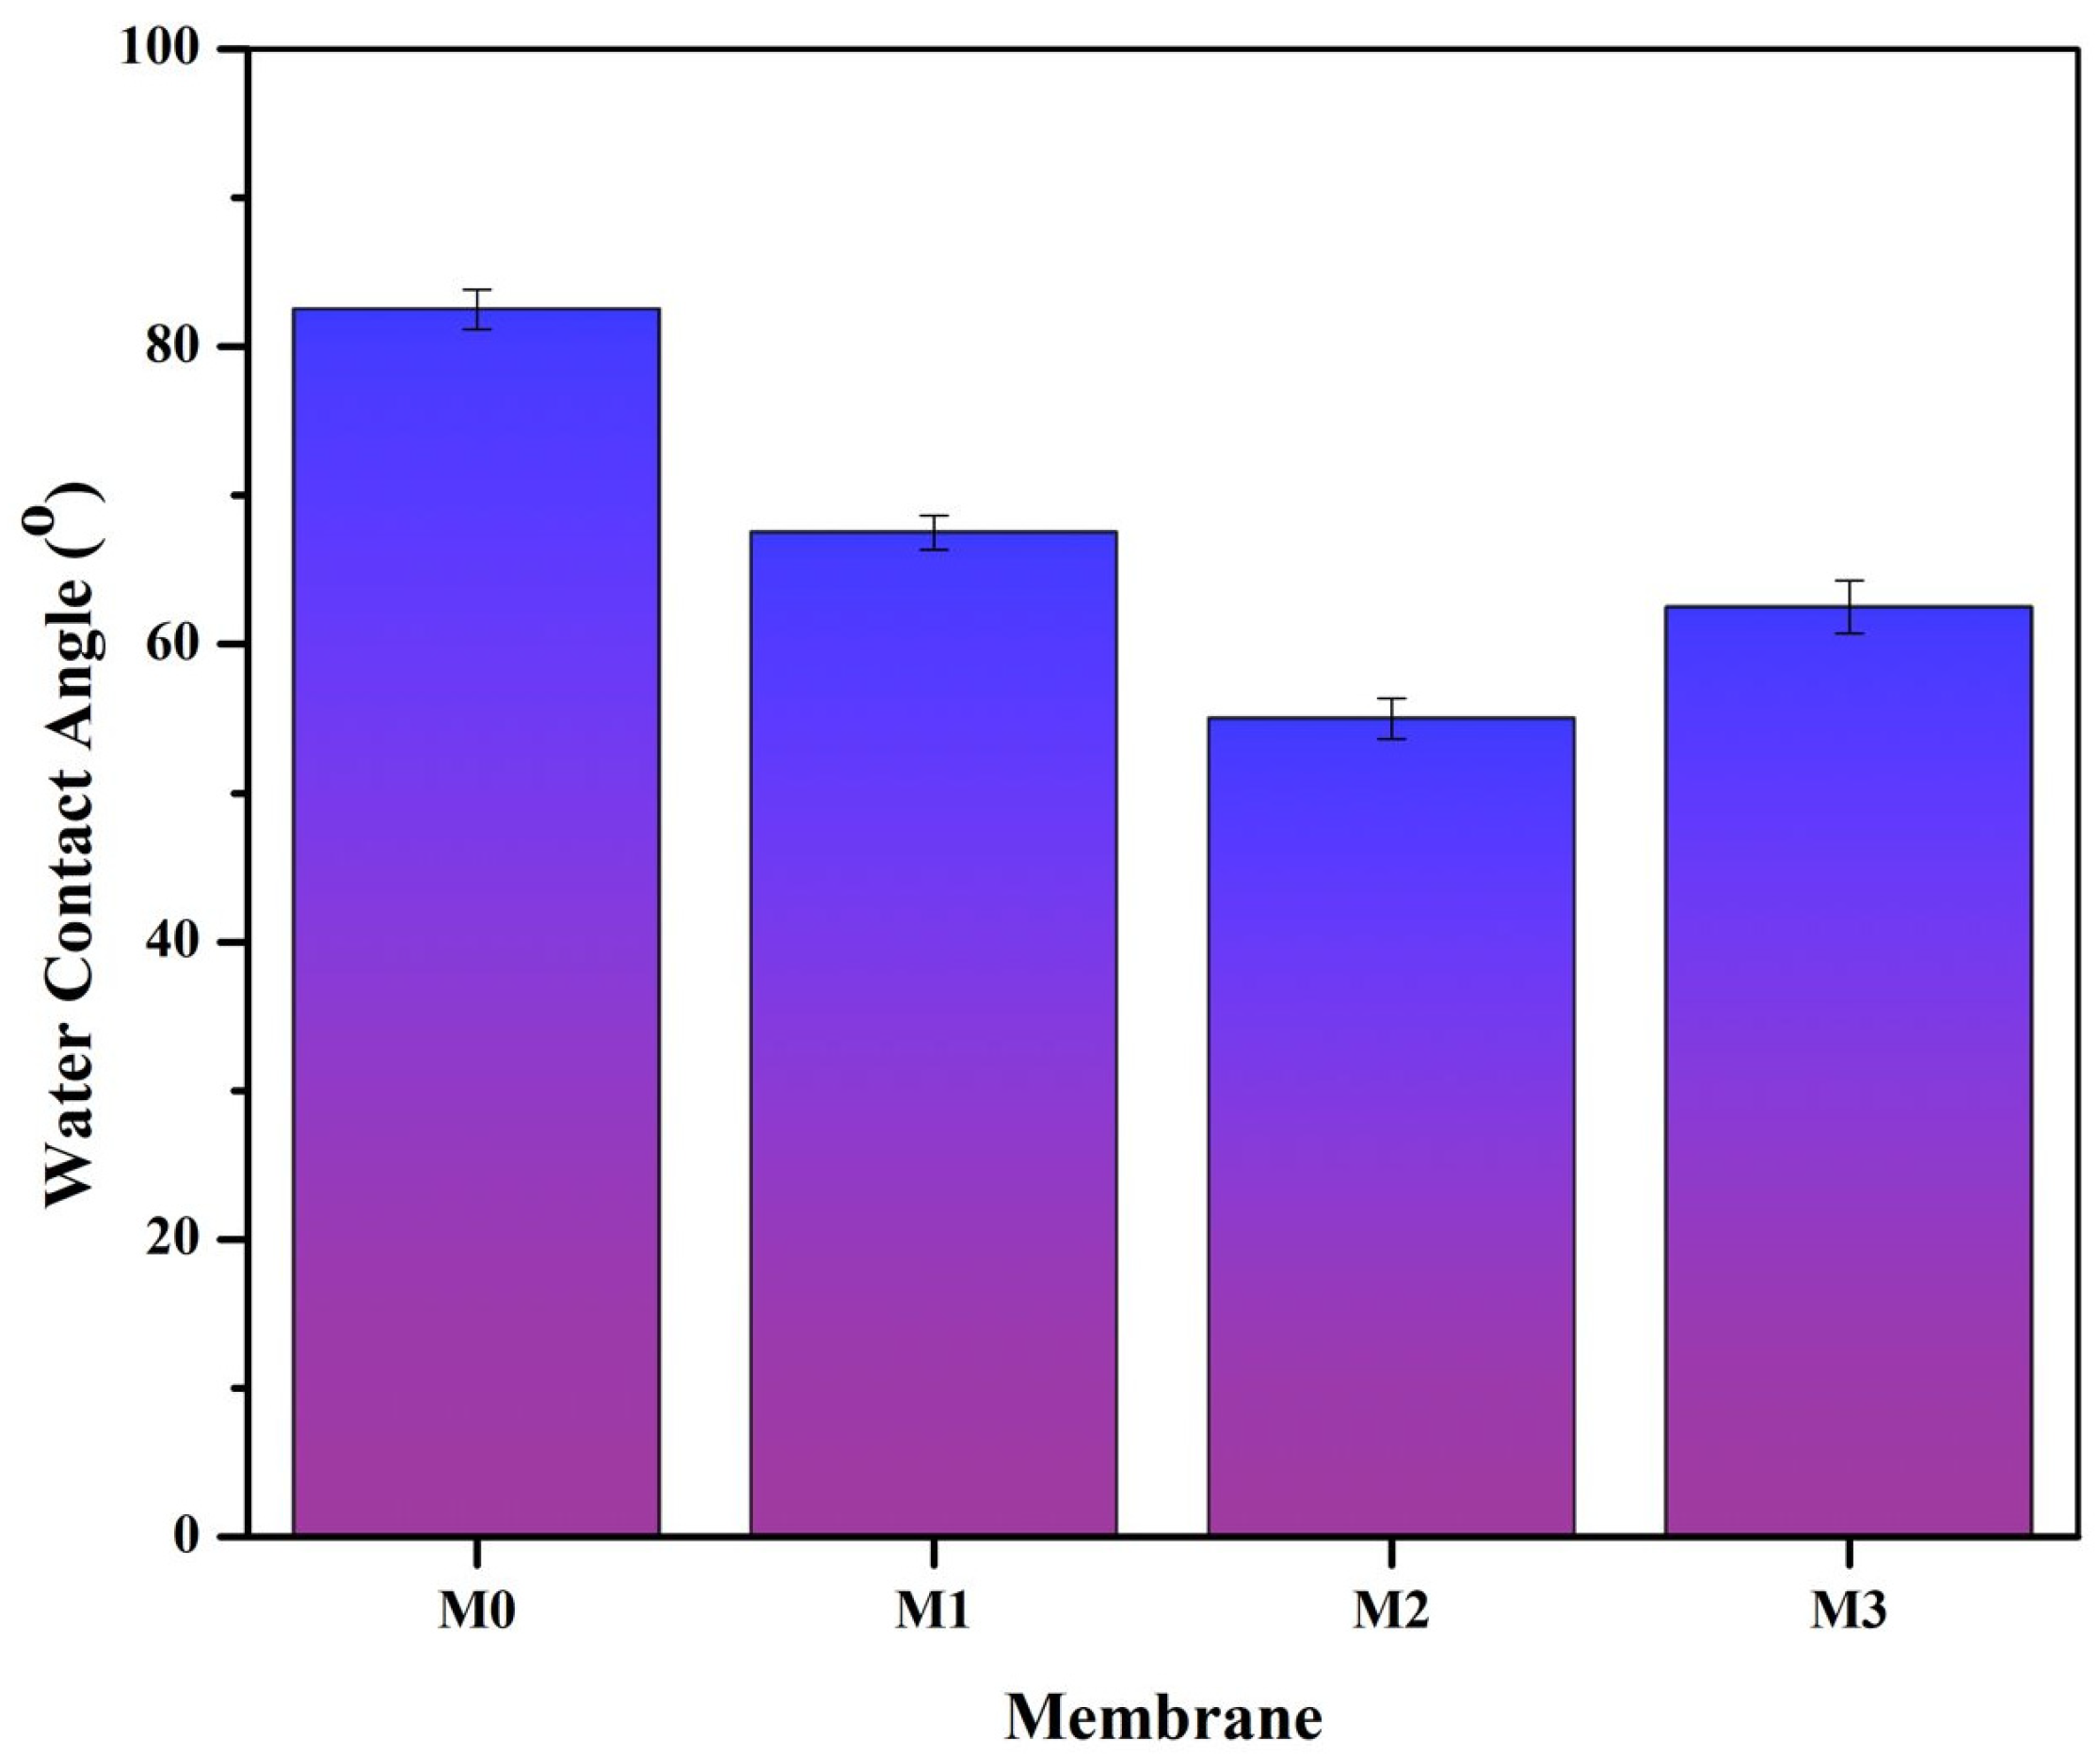
3.6. Membrane Hydrophilicity

Polyvinylidene Fluoride (PVDF) polymers are widely used in the manufacture of membranes due to their excellent physical and chemical resistance, thermal stability, and film-forming properties. However, these polymers are also susceptible to impurities due to their strong hydrophobicity and non-uniform pore size. Therefore, it is necessary to modify the PVDF membranes to reduce their hydrophobic properties and increase their hydrophilic properties. Changes in the hydrophobic–hydrophilic properties of the membranes in this study are shown in Figure 6.
The original PVDF membrane (M0) has a very high water contact angle value (82.5 O), indicating that this membrane is hydrophobic. The presence of Pol in the polymer solution (M1) resulted in a decrease in the water contact angle. This indicates that the blended PVDF and POL membrane have better hydrophilic properties than the M0 membrane. Furthermore, the addition of S-CnT and M-CnT resulted in a blend membrane with an even lower water contact angle than the two types of membranes M0 and M1. This shows that CnT also contributed to the increase in the hydrophilicity of the PVDF membranes. It is induced by the water-wall interaction inside the carbon nanotube atoms that are arranged on a honeycomb lattice [28]. CNTs help to transport water molecules due to their great aspect ratio and smooth inner walls [29].

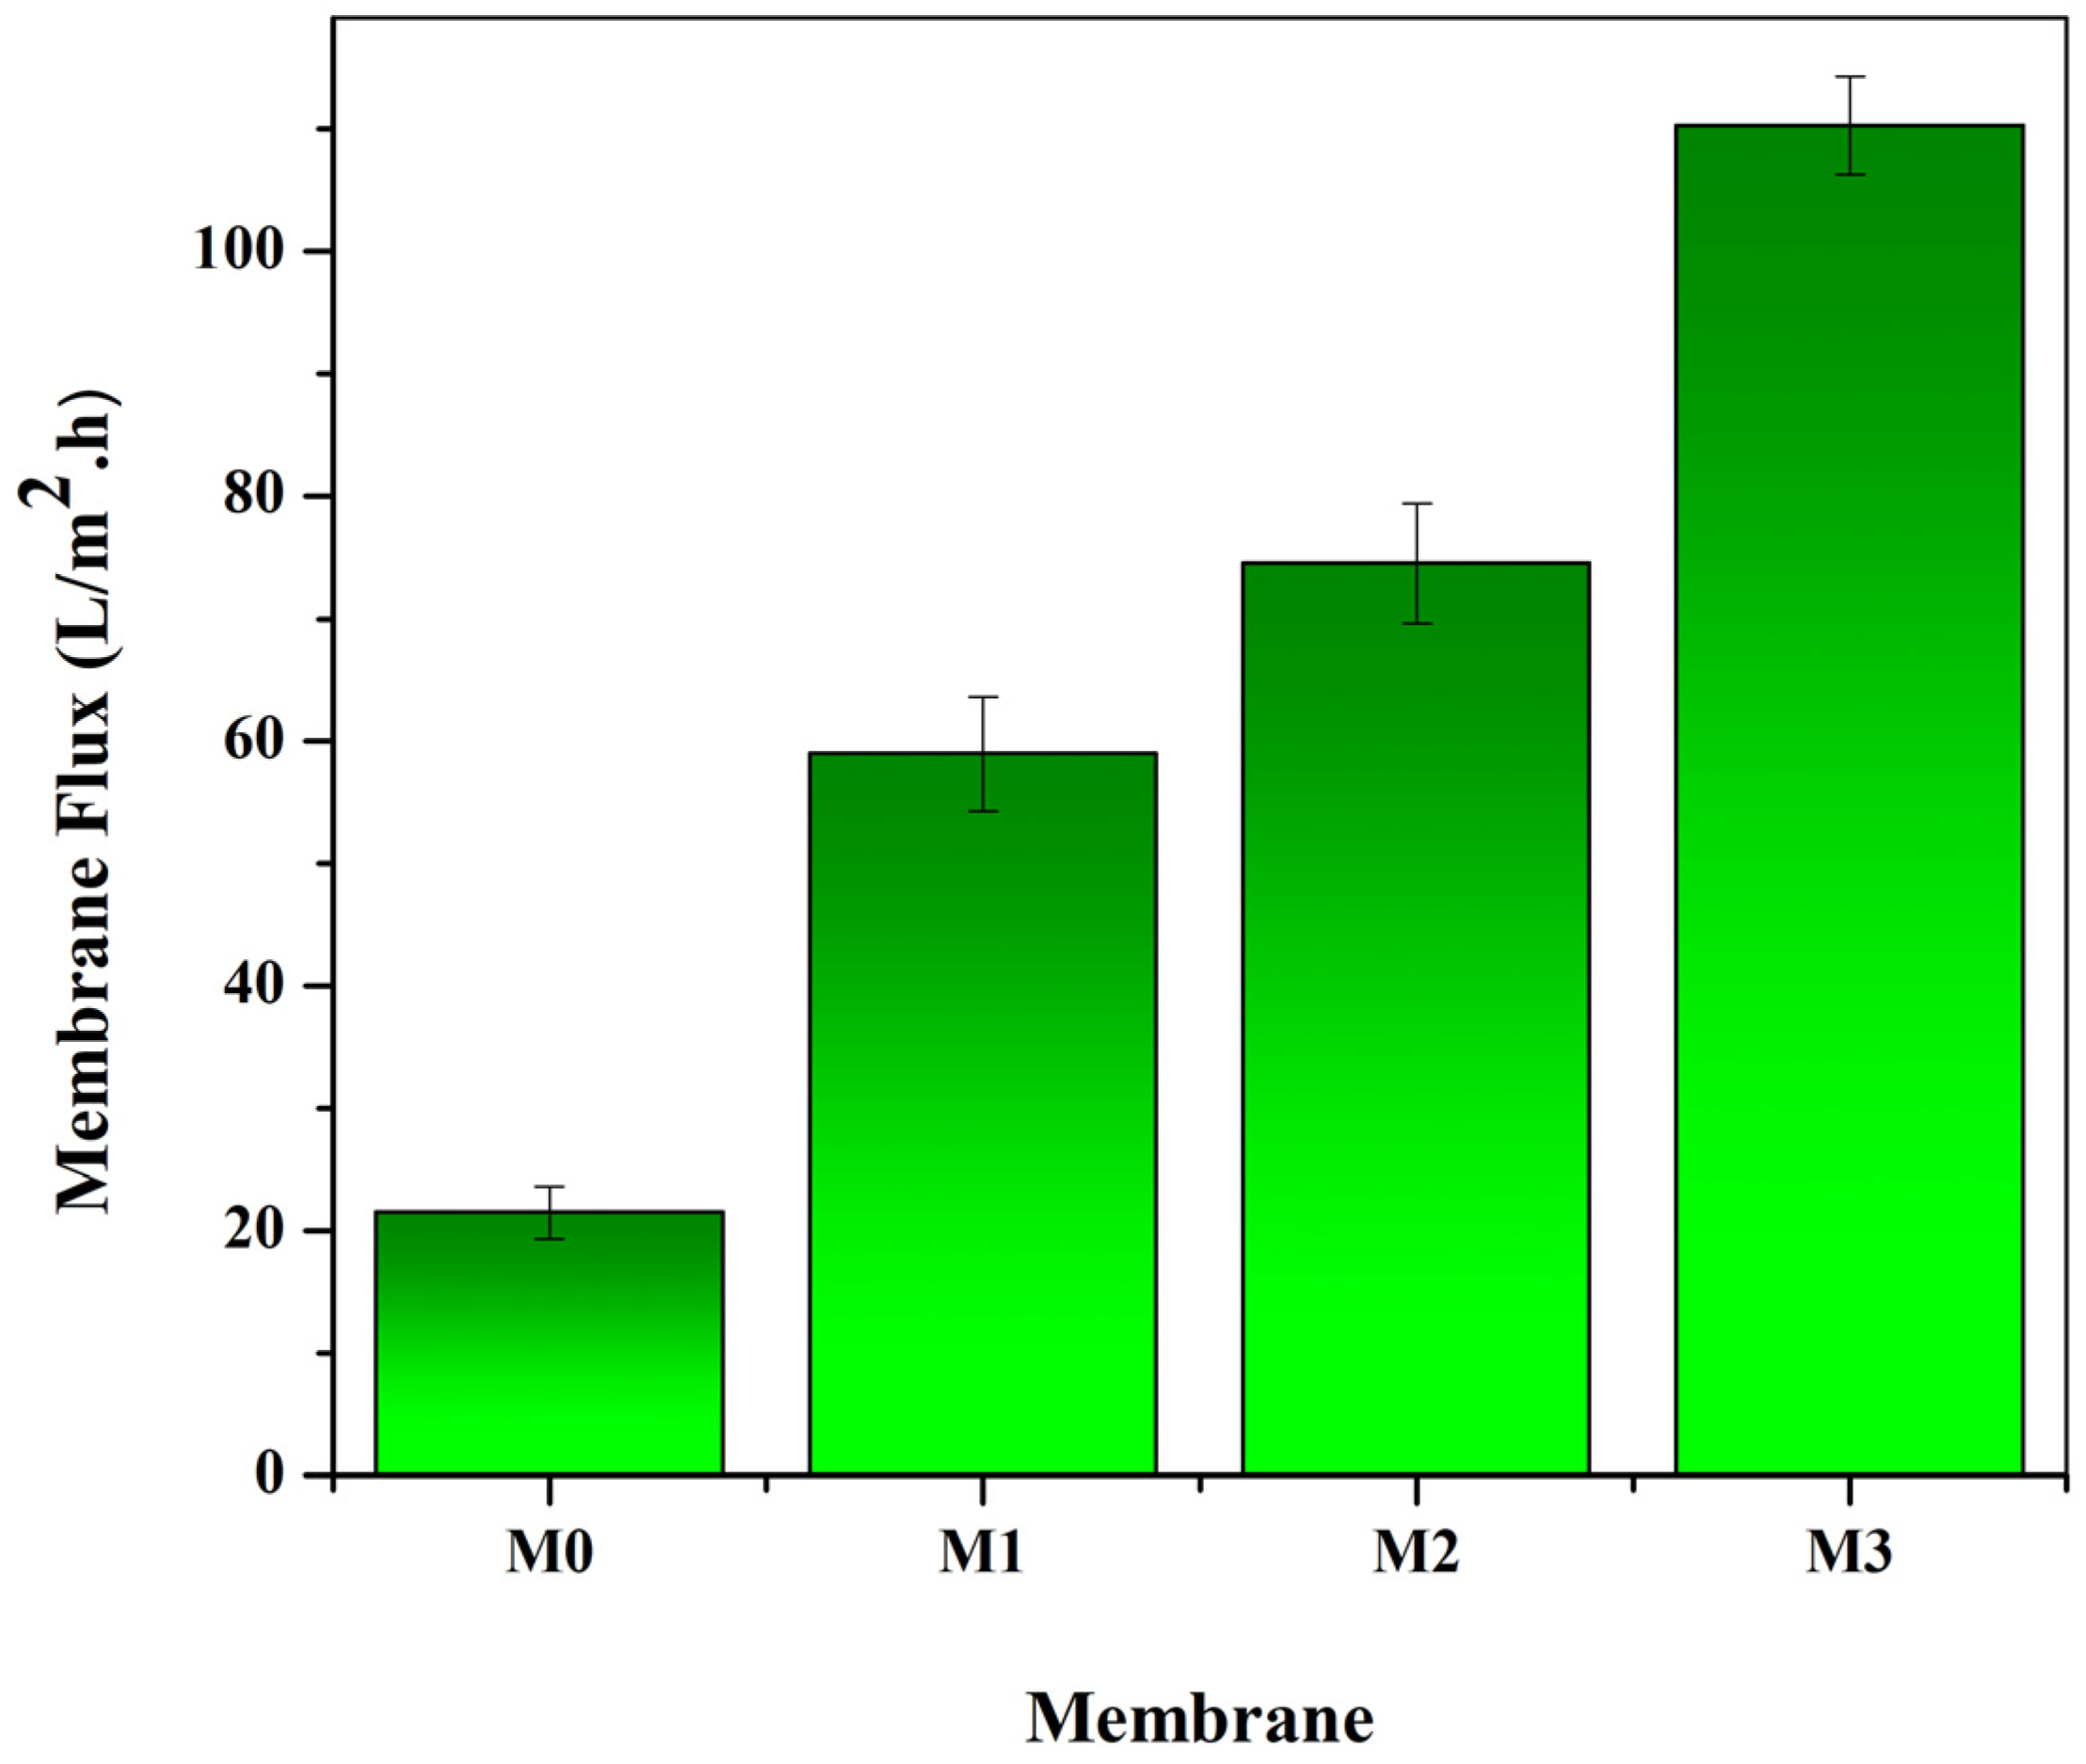
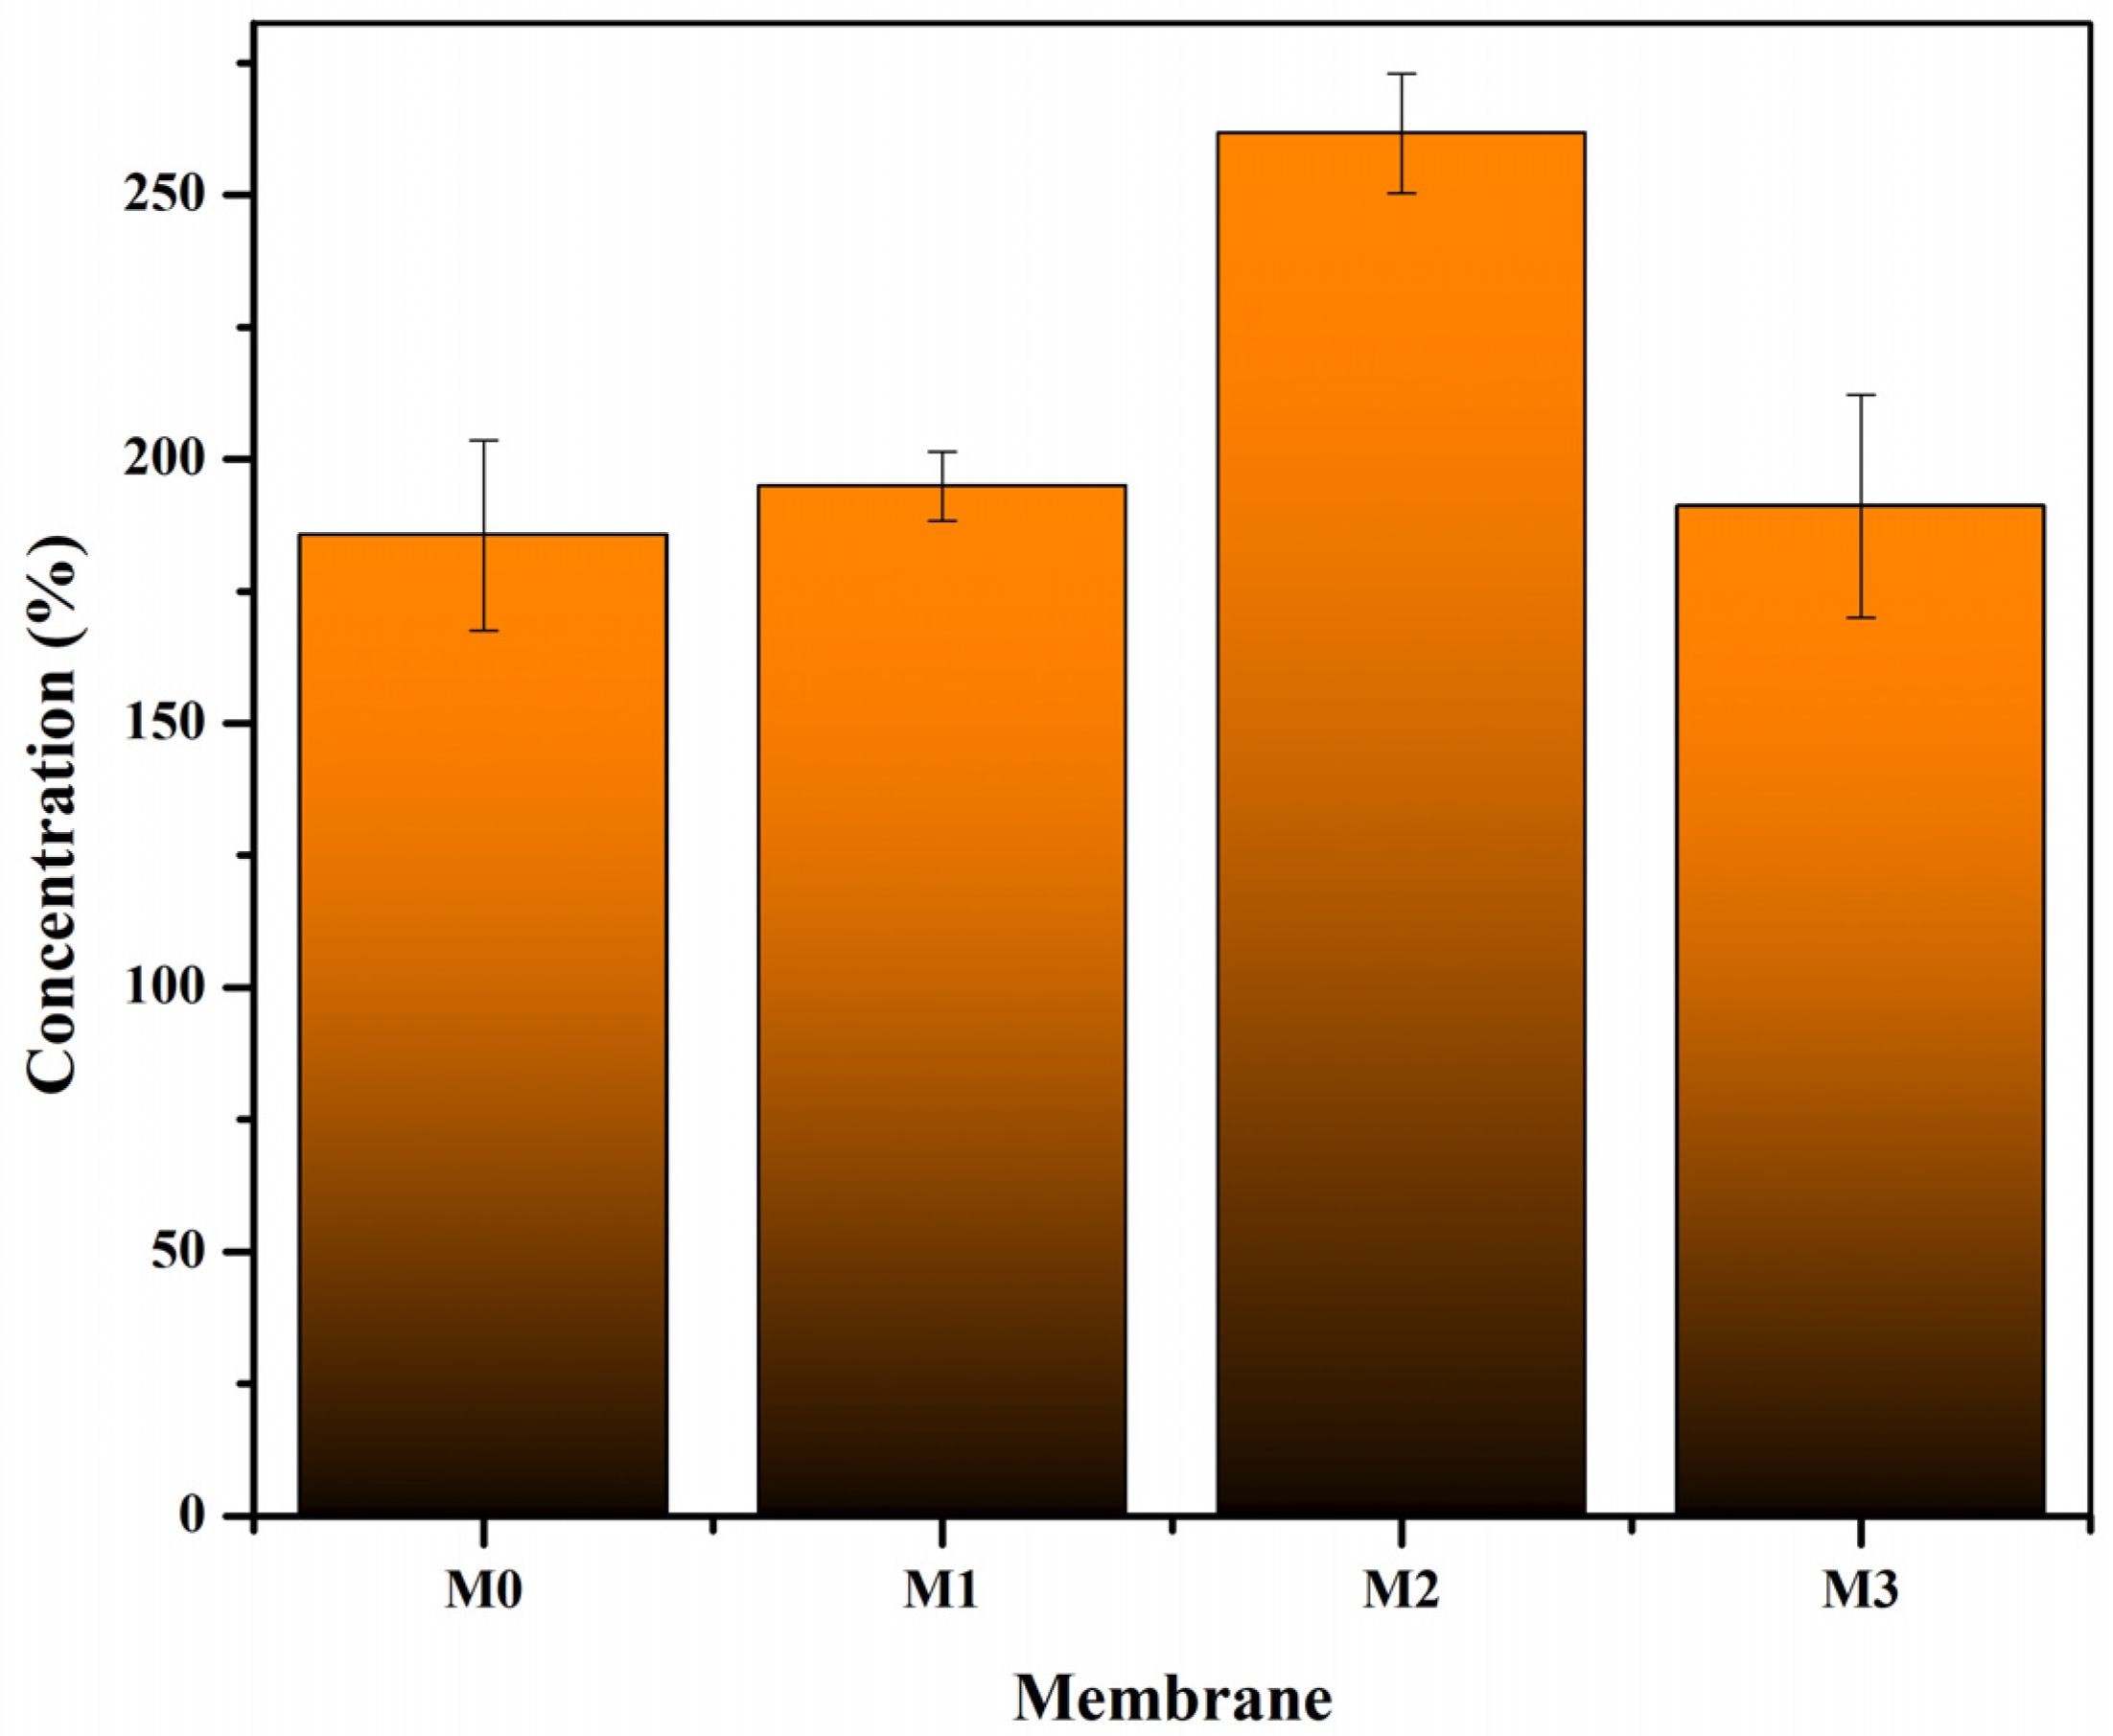
3.7. Filtration Performance

The membrane filtration performance tested in this study included pure water flux, solute rejection, and lactalbumin protein concentration. Flux is one of the parameters for describing the membrane performance. Ideally, the flux value is directly proportional to the number and size of the membrane pores. The results of the evaluation of the membrane flux in this study are shown in Figure 7. The original PVDF membrane (M0) has a flux of 21.50 (L/m2·h). The membrane flux increased with the presence of Pol, PoL + S-CnT, and Pol + M-CnT additives in the polymer solution. In many studies, it is reported that the presence of additives in the polymer solution will cause an increase in the number and size of pores in the membrane, thereby increasing the water flux. In this study, the membrane with the combined addition of PoL and M-CnT (M3) had the highest flux. This can be confirmed by the fact presented in Figure 3 and Figure 5, where a large macrovoid structure dominates the M3 membrane body. In addition, the results of the calculation of the membrane pore size show that the M3 membrane has the largest pore size (Figure 5).
The fabricated membranes in this works was then fed with a 1000 mg/L lactalbumin solution through the same module as the pure water flux test. The aim was to determine the membrane’s capacity for protein concentration processes. Figure 8 shows the percentage increase in lactalbumin concentration in the retentate solution after 3 h of filtration. All the types of membranes were able to concentrate lactalbumin solution well, with the lowest percentage increase of 185.85% on the M0 membrane. Figure 8 shows that the M2 membrane, with the addition of Pol and S-CnT, showed the best filtration performance, with an increase in lactalbumin concentration reaching 261.68%.
Data of the membrane morphological structure presented in Figure 3, the porosity and pore size in Figure 5, and the pure water flux in Figure 7 strengthen the evidence that the M2 membrane has excellent performance. The M2 membrane has a smaller pore size than the M3 membrane, but the pores in the M2 membrane are better distributed, thus making the M2 membrane have the best performance.

4. Conclusions

A porous polymeric membrane with improved characteristics and ultrafiltration performance has been successfully prepared from PVDF polymer with a combination of amphiphilic additive poloxamer and S-CnT/M-CnT nanoparticles into the polymer solution. The hydrophilicity of the membrane increased with the addition of Pol and CnT copolymers. The flux of the PVDF/Pol/M-CnT membrane was 110.27 L/m2·h, much higher than that of the pure PVDF membrane at 21.20 L/m2·h. The mechanical properties of the membrane also increased with the addition of the PVDF/Pol/S-CnT or PVDF/Pol/M-CnT solutions. The PVDF/Pol/S-CnT membrane achieved ultrafiltration performance with high flux and rejection of lactalbumin protein.

Author Contributions

Conceptualisation, N.A.; Data curation, O.O.T., A.F. and W.P.S.; Formal analysis, W.P.S.; Investigation, W.P.S. and I.M.S.; Project administration, S.M.; Resources, I.K., M.E.P. and V.V.; Supervision, N.A., M.R.B., C.M.R., S.M. and Y.Y., Writing—original draft, W.P.S.; Writing—review and editing, N.A., M.R.B. and P.G. All authors have read and agreed to the published version of the manuscript.

Funding

This research was funded by the Indonesian Ministry of Education, Culture, Research, and Technology with grant contract number 46/UN11.2.1/PT.01.03/DRPM/2022 (Penelitian Dasar Unggulan Perguruan Tinggi).

Acknowledgments

The Ministry of Education, Culture, Research, and Technology of Indonesia is acknowledged.

Conflicts of Interest

The authors declare no conflict of interest.

References

  1. Copriady, J.; Azmi, J.; Maharani, M. Isolasi Karakterisasi dan Penentuan Kadar Laktalbumin Susu Sapi Fries Holdstein dengan Metode Lowry. J. Nat. Indones. 2012, 13, 134–137. [Google Scholar] [CrossRef] [Green Version]
  2. Barone, G.; Moloney, C.; O’Regan, J.; Kelly, A.L.; O’Mahony, J.A. Chemical composition, protein profile and physicochemical properties of whey protein concentrate ingredients enriched in α-lactalbumin. J. Food Compos. Anal. 2020, 92, 103546. [Google Scholar] [CrossRef]
  3. Jiang, B.; Wang, L.; Na, J.; Zhang, X.; Yuan, Y.; Liu, C.; Feng, Z. Environmentally-friendly strategy for separation of α-lactalbumin from whey by aqueous two phase flotation. Arab. J. Chem. 2018, 13, 3391–3402. [Google Scholar] [CrossRef]
  4. El-Sayed, M.M.H.; Chase, H.A. Trends in whey protein fractionation. Biotechnol. Lett. 2011, 33, 1501–1511. [Google Scholar] [CrossRef] [PubMed]
  5. Ganjali, M.R.; Al-Naqshabandi, M.A.; Larijani, B.; Badiei, A.; Vatanpour, V.; Rajabi, H.R.; Rezania, H.; Paziresh, S.; Mahmodi, G.; Kim, S.-J.; et al. Improvement of dye and protein filtration efficiency using modified PES membrane with 2-mercaptoethanol capped zinc sulfide quantum dots. Chem. Eng. Res. Des. 2021, 168, 109–121. [Google Scholar] [CrossRef]
  6. Fahrina, A.; Yusuf, M.; Muchtar, S.; Fitriani, F.; Mulyati, S.; Aprilia, S.; Rosnelly, C.M.; Bilad, M.R.; Ismail, A.F.; Takagi, R.; et al. Development of anti-microbial polyvinylidene fluoride (PVDF) membrane using bio-based ginger extract-silica nanoparticles (GE-SiNPs) for bovine serum albumin (BSA) filtration. J. Taiwan Inst. Chem. Eng. 2021, 125, 323–331. [Google Scholar] [CrossRef]
  7. Fahrina, A.; Arahman, N.; Aprilia, S.; Bilad, M.R.; Silmina, S.; Sari, W.P.; Sari, I.M.; Gunawan, P.; Pasaoglu, M.E.; Vatanpour, V.; et al. Functionalization of PEG-AgNPs Hybrid Material to Alleviate Biofouling Tendency of Polyethersulfone Membrane. Polymers 2022, 14, 1908. [Google Scholar] [CrossRef] [PubMed]
  8. Arahman, N.; Rosnelly, C.M.; Yusni, Y.; Fahrina, A.; Silmina, S.; Ambarita, A.C.; Bilad, M.R.; Gunawan, P.; Rajabzadeh, S.; Takagi, R.; et al. Ultrafiltration of α-Lactalbumin Protein: Acquaintance of the Filtration Performance by Membrane Structure and Surface Alteration. Polymers 2021, 13, 3632. [Google Scholar] [CrossRef]
  9. Arahman, N.; Fahrina, A.; Wahab, M.Y.; Fathanah, U. Morphology and performance of polyvinyl chloride membrane modified with Pluronic F127. F1000Research 2018, 7, 726. [Google Scholar] [CrossRef]
  10. Fahrina, A.; Arahman, N.; Mulyati, S.; Aprilia, S.; Nawi, N.I.M.; Aqsha, A.; Bilad, M.R.; Takagi, R.; Matsuyama, H. Development of Polyvinylidene Fluoride Membrane by Incorporating Bio-Based Ginger Extract as Additive. Polymers 2020, 12, 2003. [Google Scholar] [CrossRef]
  11. Yu, H.; Gu, L.; Wu, S.; Dong, G.; Qiao, X.; Zhang, K.; Lu, X.; Wen, H.; Zhang, D. Hydrothermal carbon nanospheres assisted-fabrication of PVDF ultrafiltration membranes with improved hydrophilicity and antifouling performance. Sep. Purif. Technol. 2020, 247, 116889. [Google Scholar] [CrossRef]
  12. Muchtar, S.; Wahab, M.Y.; Mulyati, S.; Arahman, N.; Riza, M. Superior fouling resistant PVDF membrane with enhanced filtration performance fabricated by combined blending and the self-polymerization approach of dopamine. J. Water Process. Eng. 2019, 28, 293–299. [Google Scholar] [CrossRef]
  13. Paredes, L.; Murgolo, S.; Dzinun, H.; Othman, M.H.D.; Ismail, A.F.; Carballa, M.; Mascolo, G. Application of immobilized TiO2 on PVDF dual layer hollow fibre membrane to improve the photocatalytic removal of pharmaceuticals in different water matrices. Appl. Catal. B Environ. 2018, 240, 9–18. [Google Scholar] [CrossRef]
  14. Lin, Y.-C.; Liu, K.-M.; Chao, C.-M.; Wang, D.K.; Tung, K.-L.; Tseng, H.-H. Enhanced anti–protein fouling of PVDF membrane via hydrophobic–hydrophobic adsorption of styrene–terminated amphiphilic linker. Chem. Eng. Res. Des. 2020, 156, 273–280. [Google Scholar] [CrossRef]
  15. Vatanpour, V.; Khorshidi, S. Surface modification of polyvinylidene fluoride membranes with ZIF-8 nanoparticles layer using interfacial method for BSA separation and dye removal. Mater. Chem. Phys. 2019, 241, 122400. [Google Scholar] [CrossRef]
  16. Hazmo, N.H.W.; Naim, R.; Jye, L.W.; Ismail, A.F. Effect of composite multi-walled carbon nanotube and zeolitic imidazolate framework-8 on the performance and fouling of PVDF membranes. J. Membr. Sci. Res. 2020, 6, 424–432. [Google Scholar] [CrossRef]
  17. Dmitrenko, M.; Penkova, A.; Atta, R.; Zolotarev, A.; Plisko, T.; Mazur, A.; Solovyev, N.; Ermakov, S. The development and study of novel membrane materials based on polyphenylene isophthalamide-Pluronic F127 composite. Mater. Des. 2019, 165, 107596. [Google Scholar] [CrossRef]
  18. Kamulyan, B.; Hasanah, U.; Matulesi, F. Kajian Campuran Pelarut Akuades-Aseton Pada Pembuatan Membran Selulosa Propionat. JKPK J. Kim. Dan Pendidik. Kim. 2018, 3, 109. [Google Scholar]
  19. Lin, Y.-C.; Tseng, H.-H.; Wang, D.K. Uncovering the effects of PEG porogen molecular weight and concentration on ultrafiltration membrane properties and protein purification performance. J. Membr. Sci. 2020, 618, 118729. [Google Scholar] [CrossRef]
  20. Lusiana, R.A.; Prasetya, N.B.A. Indonesian Journal of Chemical Science Pengaruh Penambahan Aditif terhadap Karakterisasi Fisikokimia Membran Polisulfon, Indones. J. Chem. Sci. 2020, 9, 197. [Google Scholar]
  21. Bouleklab, M.; Hamamda, S.; Naoui, Y.; Nedilko, S.; Avramenko, T.; Ivanenko, K.; Revo, S.; Teselko, P.; Strelchuk, V.; Nikolenko, A. Influence of the multiwall carbon nanotubes on the thermal properties of the Fe–Cu nanocomposites. J. Alloy Compd. 2019, 816, 152525. [Google Scholar] [CrossRef]
  22. Mulder, M. Basic Principles of Membrane Technology; Kluwer Academic Publishers: Enschede, The Netherlands, 1996. [Google Scholar]
  23. Hudayawan, R.N.; Kusuma, D.Y.; Fisika, P.S.; Dan, F.M.; Pengetahuan, I. Pengaruh Dosis Implantasi Ion Nitrogen Pada Sifat Kapasitansi Polimer Pvdf Dan Pvdf-Hfp Effect of Nitrogen Ion Implantation Dose on Capacitance Properties of Pvdf and Pvdf-Hfp Polymer. J. Iptek Nukl. Ganendra 2018, 21, 89–99. [Google Scholar] [CrossRef]
  24. Arahman, N.; Mulyati, S.; Fahrina, A.; Muchtar, S.; Yusuf, M.; Takagi, R.; Matsuyama, H.; Nordin, N.A.H.; Bilad, M.R. Improving Water Permeability of Hydrophilic PVDF Membrane Prepared via Blending with Organic and Inorganic Additives for Humic Acid Separation. Molecules 2019, 24, 4099. [Google Scholar] [CrossRef] [PubMed] [Green Version]
  25. Garala, K.; Joshi, P.; Patel, J.; Ramkishan, A.; Shah, M. Formulation and evaluation of periodontal in situ gel. Int. J. Pharm. Investig. 2013, 3, 29–41. [Google Scholar] [CrossRef] [Green Version]
  26. Alagöz, D.; Toprak, A.; Yildirim, D.; Tükel, S.; Fernandez-Lafuente, R. Modified silicates and carbon nanotubes for immobilization of lipase from Rhizomucor miehei: Effect of support and immobilization technique on the catalytic performance of the immobilized biocatalysts. Enzym. Microb. Technol. 2020, 144, 109739. [Google Scholar] [CrossRef]
  27. He, M.; Zhang, S.; Su, Y.; Zhang, R.; Liu, Y.; Jiang, Z. Manipulating membrane surface porosity and pore size by in-situ assembly of Pluronic F127 and tannin. J. Membr. Sci. 2018, 556, 285–292. [Google Scholar] [CrossRef]
  28. Köhler, M.H.; Bordin, J.R.; da Silva, L.B.; Barbosa, M.C. Structure and dynamics of water inside hydrophobic and hydrophilic nanotubes. Phys. A Stat. Mech. Its Appl. 2018, 490, 331–337. [Google Scholar] [CrossRef]
  29. Wang, W.; Zhu, L.; Shan, B.; Xie, C.; Liu, C.; Cui, F.; Li, G. Preparation and characterization of SLS-CNT/PES ultrafiltration membrane with antifouling and antibacterial properties. J. Membr. Sci. 2018, 548, 459–469. [Google Scholar] [CrossRef]
Figure 1. The effect of polymer composition on the membrane swelling. Membrane swelling was analyzed based on the ratio of the difference between the wet weight and dry weight of the membrane, as described in Equation (1).
Chemengineering 06 00088 g001
Figure 2. Mechanical properties of the fabricated membrane at several polymer compositions. The data was found based on mechanical tests using the Autograph AGS J standard as ASTM D 638-14 with a tensile speed of 10 mm/min.
Chemengineering 06 00088 g002
Figure 3. Morphological structure of the surface (A) and cross-section (B) membranes: (M0) pure PVDF, (M1) PVDF with Pol, (M2) PVDF with Pol and S-CnT, and (M3) PVDF with Pol and M-CnT. The membrane sample was coated with osmium powder for 30 min, and the SEM imaging magnification was 1000 and 10,000 for cross-section and surface structure, respectively.
Chemengineering 06 00088 g003
Figure 4. IR spectra of the original PVDF and the modified PVDF with Pol, S-CnT, and M-CnT. The measurement of FTIR was done using a dry membrane at room temperature.
Chemengineering 06 00088 g004
Figure 5. Effect of polymer composition on the membrane porosity and pore size. The membrane sample was immersed in water for 24 h at room temperature. Membrane porosity and pore size were calculated using Equations (2) and (3).
Chemengineering 06 00088 g005
Figure 6. Water Contact Angle (WCA) values on M0 (pure PVDF membrane), M1 (PVDF + Pol), M2 (PVDF + Pol + S-CnT), and M3 (PVDF + Pol + M-CnT). The measurement of the water contact angle was carried out on the dried sample by dropping 0.7 µL of water on the top surface of the membrane.
Chemengineering 06 00088 g006
Figure 7. Water flux of the pure and modified PVDF membranes. The filtration test was designed as a crossflow filtration module with an operating pressure of 1 bar, and the permeate volume was collected every 10 min. Water flux was calculated using Equation (4).
Chemengineering 06 00088 g007
Figure 8. Profile of lactalbumin concentration for pure (M0) and the modified PVDF membrane (M1: PVDF + Pol, M2: PVDF + Pol + S-CnT, and M3: PVDF + Pol + M-CnT. The filtration test was designed as a crossflow filtration module with an operating pressure of 1 bar, and the concentration of lactalbumin was analyzed after 1 h operation.
Chemengineering 06 00088 g008
Table 1. Composition of membrane solutions.
MembraneComposition (%)
PVDFPolS-CnTM-CnTNMP
M02000080
M12030077
M22030.1076.9
M320300.176.9
Publisher’s Note: MDPI stays neutral with regard to jurisdictional claims in published maps and institutional affiliations.

