Article

Optimization of Oil Recovery from Japonica Luna Rice Bran by Supercritical Carbon Dioxide Applying Design of Experiments: Characterization of the Oil and Mass Transfer Modeling

by
José P. Coelho
1,2,*,
Maria Paula Robalo
1,2,
Inês S. Fernandes
1 and
Roumiana P. Stateva
3
1
Instituto Superior de Engenharia de Lisboa, Instituto Politécnico de Lisboa, Rua Conselheiro Emídio Navarro 1, 1959-007 Lisboa, Portugal
2
Centro de Química Estrutural, Institute of Molecular Sciences, Instituto Superior Técnico, Universidade de Lisboa, Av. Rovisco Pais 1, 1049-001 Lisboa, Portugal
3
Institute of Chemical Engineering, Bulgarian Academy of Sciences, Academic Georgi Bontchev Str., 1113 Sofia, Bulgaria
*
Author to whom correspondence should be addressed.
ChemEngineering 2022, 6(4), 63; https://doi.org/10.3390/chemengineering6040063
Submission received: 13 July 2022 / Revised: 26 July 2022 / Accepted: 28 July 2022 / Published: 10 August 2022

Abstract

:
This study presents an optimization strategy for recovery of oil from Japonica Luna rice bran using supercritical carbon dioxide (scCO2), based on design of experiments (DoE). Initially, a 24−1 two level fractional factorial design (FFD) was used, and pressure, temperature, and scCO2 flow rate were determined as the significant variables; while the yield, total flavonoids content (TFC), and total polyphenols content (TPC) were the response functions used to analyze the quality of the extracts recovered. Subsequently, central composite design (CCD) was applied to examine the effects of the significant variables on the responses and create quadratic surfaces that optimize the latter. The following values of pressure = 34.35 MPa, temperature = 339.5 K, and scCO2 flow rate = 1.8 × 10⁻³ kg/min were found to simultaneously optimize the yield (6.83%), TPC (61.28 μmol GAE/g ext), and TFC (1696.8 μmol EC/g ext). The fatty acid profile of the oils was characterized by GC-FID. It was demonstrated that the acids in largest quantities are C16:0 (15–16%), C18:1 (41%), and C18:2 (38–39%). Finally, three mass transfer models were applied to determine the mass transfer coefficients and assess the cumulative extraction curves, with an AAD% of 4.16, for the best model.

1. Introduction

According to a survey conducted in 6 June 2022, the results of which can be found at https://www.statista.com/statistics/263977/world-grain-production-by-type/ (accessed on 6 June 2022), corn, wheat, and rice are at the top of the list of grain production worldwide in 2021/22 with 1207, 778.6, and 509.87 million metric tons annually, respectively. Fourth in the list is barley with 157.05 million metric tons, which is about one-third that of rice.
Therefore, the integral utilization of those grains can bring added value to their production. For example, the processing of white rice (Oryza sativa L.)—the main product in the rice milling industries—creates large quantities of solid wastes generated from the removal of the outer layers of the grain, comprising predominantly two by-products: rice bran 8–10%, and rice husk, about 20% [1,2,3]. The huge amounts of waste created by this industry represent a considerable challenge for their economic and sustainable management. Hence, rather than discharging those quantities, techniques, and processes that can be applied to recover high added value products should be explored, as their successful implementation will guarantee not only the valorization of biowastes but will also contribute to sustainable industrial production.
Rice bran as a by-product contains 8–20 wt % bio-oil with an excellent calorific value for energy applications. In addition, it is a rich source of vitamins, antioxidants, and minerals [3,4,5,6].
The extraction of rice bran oil (RBO) has usually been carried out by using n-hexane. However, the removed oil contains many impurities, such as phosphorus and wax, so a subsequent refinement of the oil is usually required. It was demonstrated that processes applying green, sustainable, and environmentally friendly compressed fluids recover RBOs of better quality and with lower levels of impurities.
Until present, several authors have studied the influence of the extraction process applied on the quality and composition of RBO obtained from different rice varieties [7,8,9]. Among the techniques applied were cold-press, solvent, and supercritical CO2 (scCO2) extraction. It was demonstrated that rice varieties had a greater effect on the concentration of phytochemicals in the RBO than the extraction methods applied [9]. Still, for a given rice variety—black rice samples in the particular case—the RBO recovered by applying scCO2 showed the best physicochemical and antioxidant properties [8].
The works devoted to examining the influence of scCO2 extraction parameters (pressure, temperature, scCO2 flow rate, co-solvent presence) on the quality of the RBO and its composition are numerous, see for example [2,3,10,11,12,13,14,15,16]. The oils were evaluated in terms of antioxidant activity, fatty acid profile, and composition of bioactives and phytochemicals—such as phytosterols, tocopherols, and γ-oryzanol among others.
It was also reported that at the appropriate pressure/temperature conditions, scCO2 extraction of RBO—with or without a co-solvent—not only achieves yield comparable to that of conventional n-hexane extraction, but the extracts obtained have lower levels of phosphate and wax and present an improved color.
As far as we are aware, the works that communicate modeling of RBO kinetics data are rare. For example, Tomita et al. [10] correlated the solubility of RBO in scCO2 applying Chrastil equation and used two models—a thermodynamic and a simple kinetic one—to explain the experimental extraction behavior.
Works applying design of experiments (DoE) to optimize the process of RBO recovery by scCO2 are even fewer in number and provide limited data. For example, Wang et al. [13] carried out a more exhaustive work on the application of DoE, but did not perform any modeling of the results obtained. They used a two-factor central composite scheme composed of response surface methodology to verify the optimum values of temperature and pressure of the RBO scCO2 extraction that will lead to an increase in the concentration of oryzanols in the removed oil. Simultaneously, the authors examined the influence of the supercritical solvent flow—either down-flow or up-flow—on the recovery of the RBO, and concluded that the latter is more advantageous.
Application of DoE to the optimization of RBO extraction by scCO2 will have many advantages since, as discussed extensively in the literature, experimental design is a useful method of optimizing the operational parameters for any technique to maximize the extent of suitable information acquired with the minimum number of experiments. It delivers a more effective and complete optimization compared to the approach “Vary one factor at a time while allocating fixed values to the other factors” [17].
In view of the above, the principle aim of our work was the optimization of scCO2 extraction of RBO obtained from Japonica Luna variety, applying DoE. To achieve that goal, firstly, unlike other similar studies, two different DoE methods—namely a fractional factorial design (FFD) and, subsequently, a central composite design (CCD)—were combined and applied to determine the optimum values of the scCO2 process operating parameters. The influence of the latter on the yield and total phenolic and flavonoid content of the RBOs recovered was examined, with the details of the methodology applied outlined in the sections to follow.
Next, in addition to the new experimental data gathered and communicated, the applicability and suitability of three mass transfer models to simulate the experimental cumulative extraction yield curves obtained was also discussed. The mass transfer coefficients were evaluated, and it was demonstrated that their values were a good agreement with those found in the literature for similar matrices. Finally, in order to verify the influence of the experimental conditions on the composition of the oils, the fatty acid profile of RBOs recovered were determined by GC-FID analyses.

2. Materials and Methods

2.1. Raw Material

Rice bran, of the Japonica Luna variety was provided by Aparroz, Lda, based in Alcácer do Sal, Setúbal municipality (38°22′24.0″ N 8°31′47.0″ W). It was oven-dried to a regular mass at 338 K and stored frozen in a refrigerator at 255 K. The moisture content (5.3 ± 0.4%) was evaluated with a thermogravimetric balance, Kern MRS 120-3 (KERN & Sohn GmbH, D-72336 Balingen, Germany), and the average particle diameter, dp (0.300 ± 0.025) mm, was determined as defined before [18].

2.2. Reagents

Carbon dioxide (CO2), 99.995%, supplied by Air Liquide (Lisbon, Portugal) was employed for supercritical fluid extractions. Hexane (Analar NORMAPUR 98%) from VWR, PROLABO (Barcelona, Spain). Methanol (HPLC grade, 99.99%), boron trifluoride-methanol solution, BF3/MeOH (10%, w/w), and ethanol (99%+, absolute, extra pure) were from Fisher Chemical (Madrid, Spain); AlCl3 (98%) was obtained from Merck and ultra-pure water (Mili-Q system, Milipore Corporation, Darmstadt, Germany).
Trolox (98%), gallic acid (97.5–102.5%), sodium carbonate anhydrous (Na2CO3; 99.5%), catechin (98%), and Folin–Ciocalteu reagent, 2 N, were purchased from Sigma Aldrich (Darmstadt, Germany).

2.3. Methods and Equipments

Supercritical fluid extraction (SFE) experiments were performed applying a laboratory apparatus from Applied Separations, Allentown, PA, USA (model Spe-ed SFE-NP), equipped with a 50 cm3 internal capacity extractor. The equipment allows operating at pressures and temperatures up to 60.0 MPa and 120 °C, respectively, its comprehensive description is given in [2,18,19], hence no further details will be given herewith.
Total polyphenol content (TPC) of the rice bran oil was determined quantitatively using the Folin–Ciocalteu reagent in a microplates (Nunc) system with the necessary modifications [20], as described in a previous work [2], and the absorbance was measured at 765 nm in a microplate reader (BioTek Synergy 2, Winooski, VT, USA) in triplicate. The TPC was expressed as μmole of gallic acid equivalents (GAE) by g of extract (μmol GAE/g), determined from a calibration curve [2].
The determination of the total flavonoid content (TFC) of the rice bran oil was performed using aluminum chloride colorimetric method as described previously [21,22]. The same microplate and reader system, as used for the TPC, were applied at the absorbance of 415 nm to calculate the total flavonoid content, represented as μmole of catechin equivalents (CE) by g of extract (μmol CE/g), obtained from the calibration curve of catechin.
The calibration curve of catechin was generated by triplicate samples measurements, and the results are represented by Equation (1), with an R2 = 0.997. The sensitivity was determined according to the limit of detection (LOD = 10.24 µg/mL) and limit of quantification (LOQ = 34.13 µg/mL), where AS is the measured absorbance of the sample and CS is the concentration of the sample in µg/mL.
A s = 8.75 × 10 3 ( ± 1.17 × 10 2 ) + 1.56 × 10 3 ( ± 5.3 × 10 5 ) C s
Fatty acid ester profiles of rice bran oils recovered were evaluated by gas chromatographic method in accordance with Annex I to Commission Regulation (EEC) no. 2568/91(1), CELEX_01991R2568 published 4 December 2016, with the required adjustments. Fatty acid methyl esters (FAMEs) were obtained from treatment of the oils with BF3/MeOH (10%, w/w) [2].

2.4. Design of Experiments

Design of experiments was carried out applying the program Design-Expert 11 (DE-11). It is an important tool that can be used successfully in the case of experiments with several factors and responses.
On stage one, initially, a 24−1 two-level fractional factorial design (FFD) with three factors was applied to our system, which means that each experimental factor has only two levels, and the experimental runs include all combinations of these factors. While two-level factorial designs are unable to fully search a wide region in the factor space, they still provide useful information for relatively few runs per factor.
Once the most significant independent parameters (factors) were identified, a central composite design (CCD) was used at the subsequent stage to examine the effects of those variables on the responses, and to generate quadratic surfaces to optimize the values with a minimum number of experiments [17].
An empirical model that correlated a response to the independent parameters using a polynomial equation, such as the one given by Equation (2), was applied:
Y = a 0 + i = 1 n a i X i + ( i = 1 n a ii X i ) 2 + i = 1 n 1 j = i + 1 n a ij X i X j
where Y is the predicted response, a0—the constant coefficient, ai—linear coefficients, aii—quadratic coefficients, aij—interaction coefficients, and Xi and Xj are the coded values of the independent parameters in the experience.

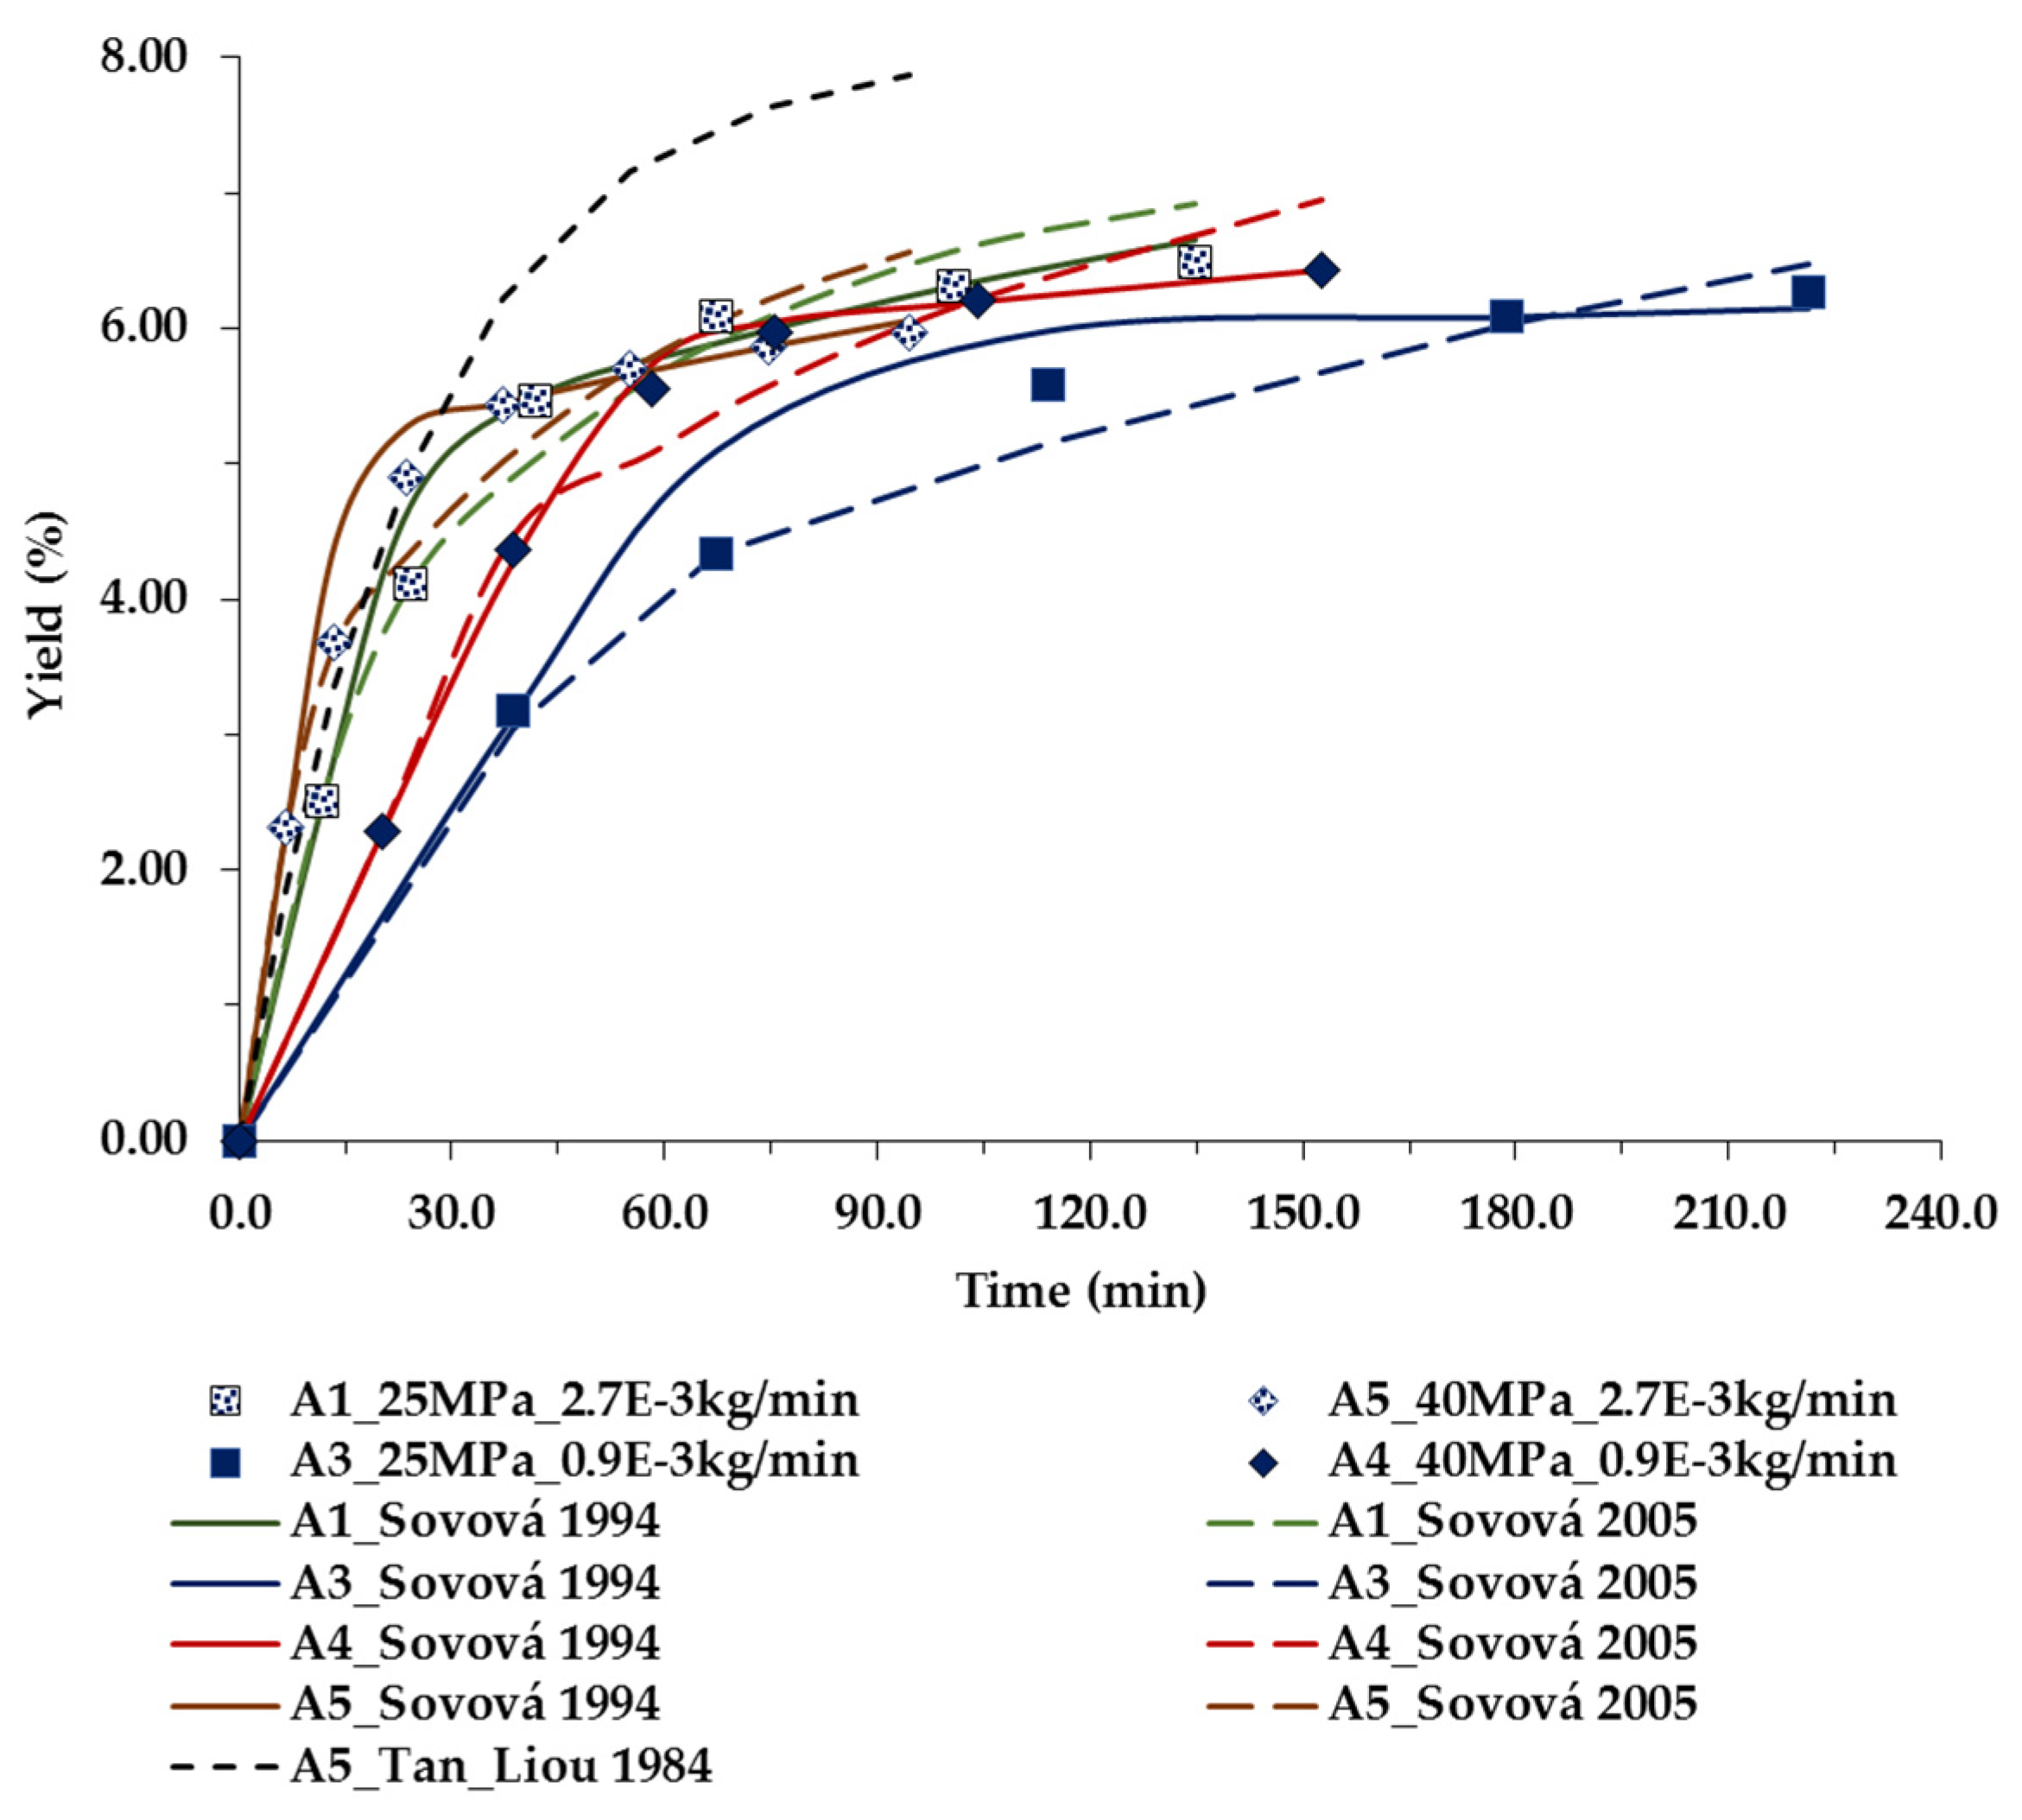
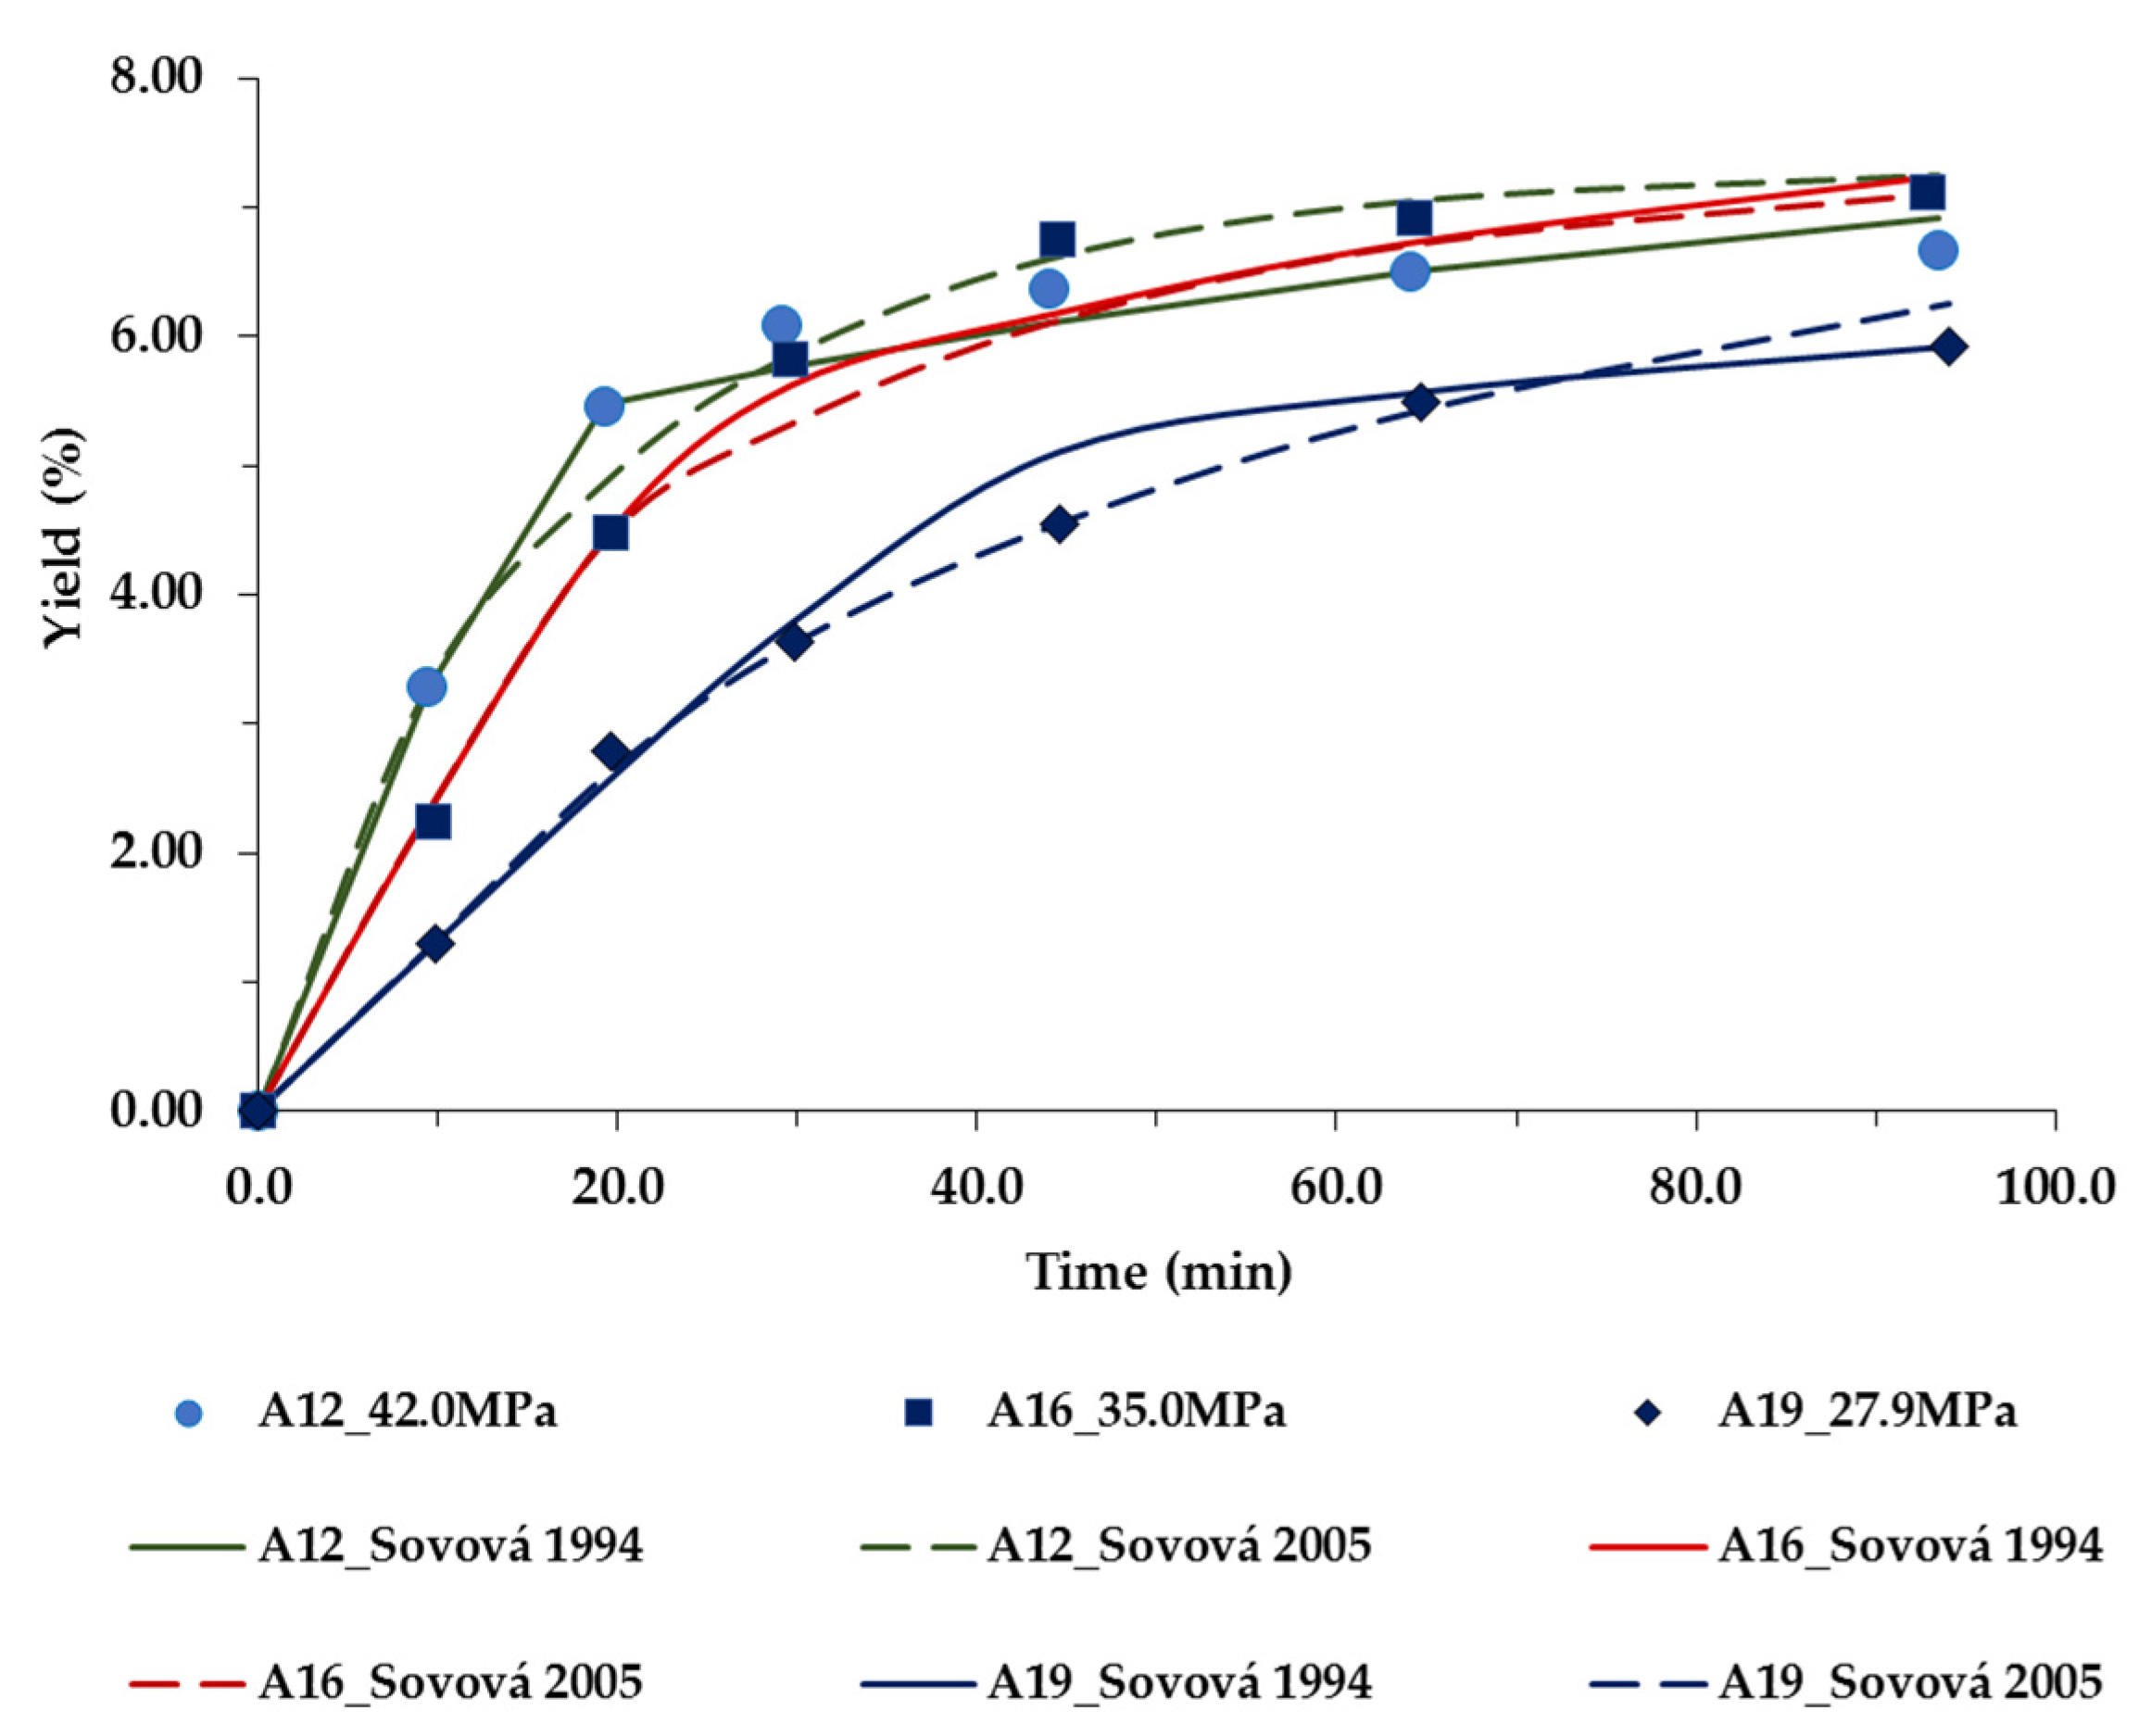
2.5. Mathematical Modeling of scCO2 Kinetics Extractions

In the literature, there are a variety of models advocated for modeling the scCO2 extraction kinetics, see for example [23,24,25,26,27].
In the present study, the experimental data obtained were fitted applying three mass transfer models. They are based on the differential mass balances in the solid and fluid phases and the following assumptions are made: (a) The behavior of all compounds extracted is similar and they can be described by a single pseudo-component even though the solid bed is composed of particles with a multi-component solute; (b) The concentration gradients in the fluid phase develop at scales larger than the particle size; (c) The solvent flow rate is uniformly distributed in every section of the extractor and the porosity is not affected during the extraction time; (d) Fluid density remains constant and the solid bed is assumed to be homogeneous since temperature gradients and pressure drop within the bed extractor are low enough, (e) The solvent is solute-free at the inlet of the extractor and uniformly distributed, without any radial dispersion; (f) The flow regime is axially dispersed.
The equation for the piston flow system is given by the differential mass balance expression
C t + u   ε   C h + ( 1   ε ) ε ρ s ρ f q t = 0
The extraction yield is obtained by
e = Q t 0 t C ( h = H ) d t
In agreement with the subsequent initial conditions, the concentration is assumed to be homogeneous in the two phases:
q ( h , t = 0 ) = q 0 , C ( h , t = 0 ) = C 0
The boundary condition being
C ( h = 0 , t ) = 0
where e is the extraction yield (kg·kg−1); C is the solute (oil) concentration in the scCO2 (kg·kg−1); q—the solute concentration in the solid phase (kg·kg−1); u—the superficial velocity of supercritical fluid (m·s−1); ε is the void fraction of the bed; h—the axial coordinate (m), t—time (s); ρf—the fluid density (kg·m−3); ρs—solid density (kg·m−3); Q-fluid flow rate (kg·s1); H—height of the extraction bed (m); q0—solute concentration in the solid phase at t = 0 (kg·kg−1); and C0 is the initial concentration of the oil in the scCO2, which is assumed to be equal to the oil solubility in the solvent.
The assumption regarding C0 is introduced because of the complexity of the raw materials and the uncertainty of the interactions among the compounds comprising them. Hence, the calculations can be simplified either by representing the oil as a single compound or by considering one specific solute as the unique compound to be dissolved in the scCO2. In addition, solubility of the oils is approximated using data from the first period of the process, namely the slope of the cumulative extraction curves.
The first model applied in our study is the desorption model of Tan and Liou [28]. The assumptions of the model are that there is no accumulation in the bed, and that the interfacial mass transfer of the extraction can be defined by a first-order kinetic expression. Then, the solid phase mass balance can be represented as
q t = k d ( q q )
where kd is the desorption constant, q*—the interfacial concentration of the solute (kg·kg−1). Further details of the model solution and applications can be found in [23,25,29].
The other two models that were used are based on the broken-and-intact cell (BIC) concept simplified model with analytical solution proposed by Sovová in 1994 [30], and its later modification introduced in 2005 [31]. Over the years, BIC model has been one of the most widely applied in SFE modeling and has proved its suitability in cases where matrices submitted to milling can result in two different structures. Hence, (i) some of the oil is located either at the outer surface of the particles or inside ruptured cells and thus can be readily accessible to the SFE solvent; (ii) still, the rest of the oil remains either deep down in the pore structure or in less accessible, intact cells.
BIC model [30] considers that solutes extraction can be determined by convection from broken (external) cells to the supercritical phase, and/or by diffusion from inner intact cells to the outer broken cells. Moreover, the extraction curves are divided in three regions, each one differentiated by the control of specific or combined mass transfer mechanisms.
The initial period of extraction, where the predominant resistance is the external film diffusion, involves mostly accessible solutes on particles surface and is characterized by constant extraction rate (CER). The second period is called falling extraction rate (FER) and combines the diminishing contribution of the convective term of CER with the increasingly significant intraparticle diffusion of solutes from inner intact cells. The final period is characterized by the slowest rate because the extraction is exclusively focused on the transport of solutes from intact cells due to diffusion. This period is known as diffusion control (DC).
Thus, according to the above considerations, the mass balance in the solid phase is given according to the following two equations:
q t = k f a ρ f ρ s ( C 0 C ) , f o r   q q k
with kf external mass transfer coefficient, (m·s−1), a—the surface of a unit volume of particles and qk—the initial content of the difficult accessible solute in the solid (kg·kg−1), and
q t = k s a q , f o r   q < q k
where ks is the internal mass transfer coefficient (m·s−1). Again, the analytical solution of Equations (8) and (9) is well documented [23,24,25,29].
In the 2005 modification of the model [31], new assumptions are introduced, the main difference with the 1994 model being that the solute from broken cells diffuses right to the fluid phase although the solute from intact cells diffuses just to the broken cells. Consequently, the two new parameters to be adjusted are the ks, and the initial fraction of solute in broken cells r = 1 − qk/qo. Further details and explanations can be found in [24,29].
The deviations between the experimental data and the model predictions were minimized applying the objective function, given by Equation (10)
A D D ( % ) = 1 N P i = 1 N P a b s (   e e x p e c a l c e e x p ) i × 100

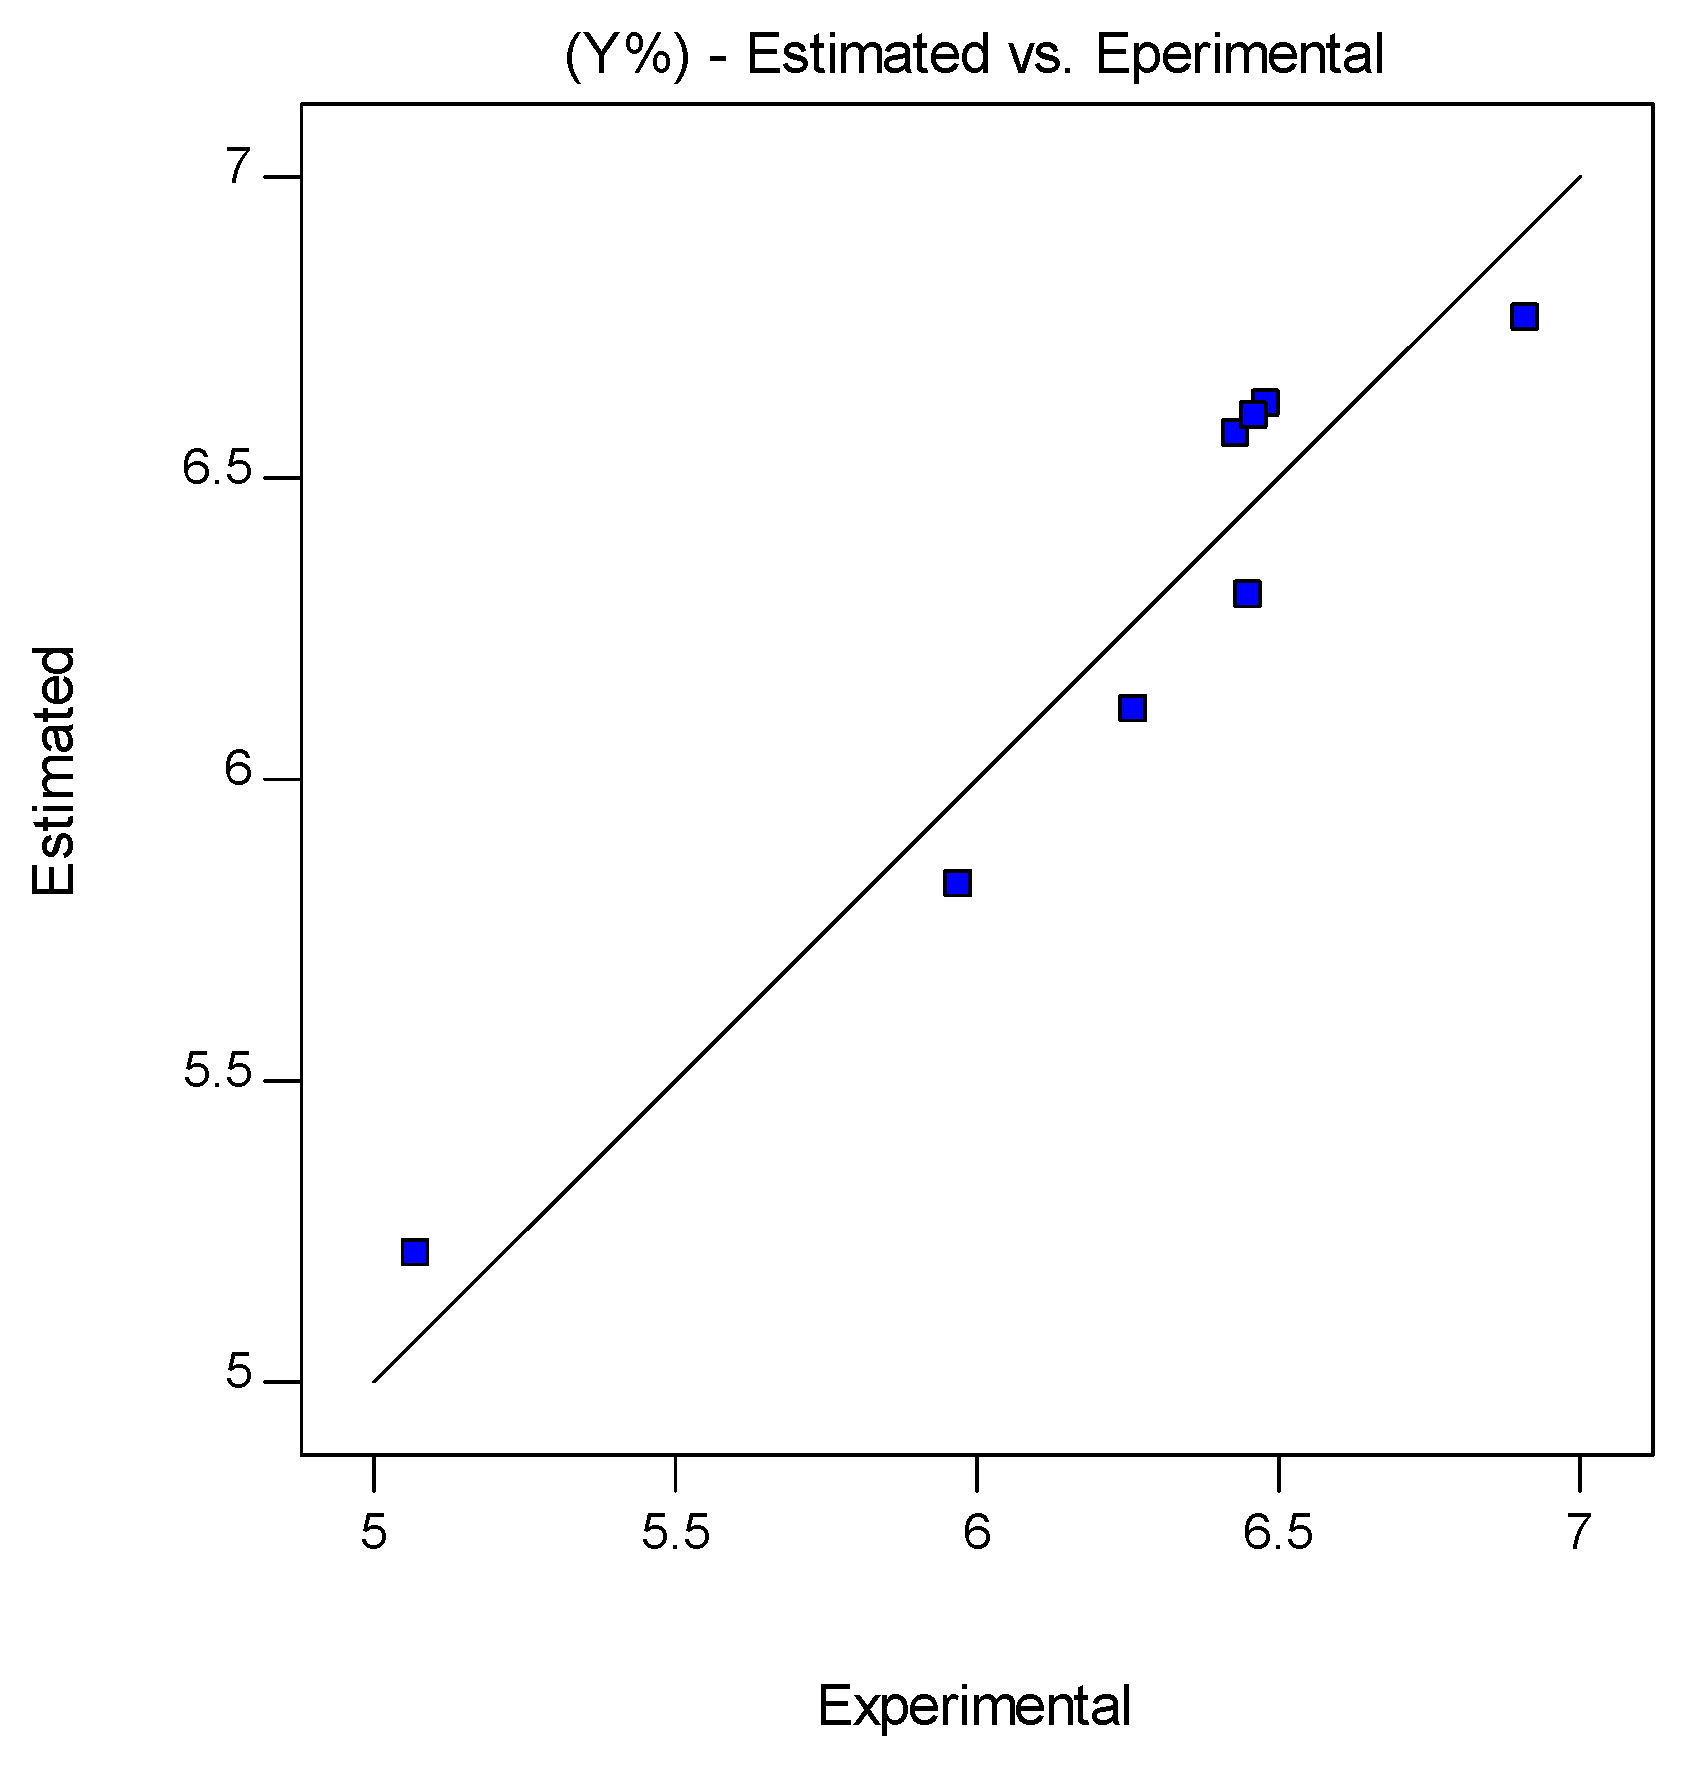
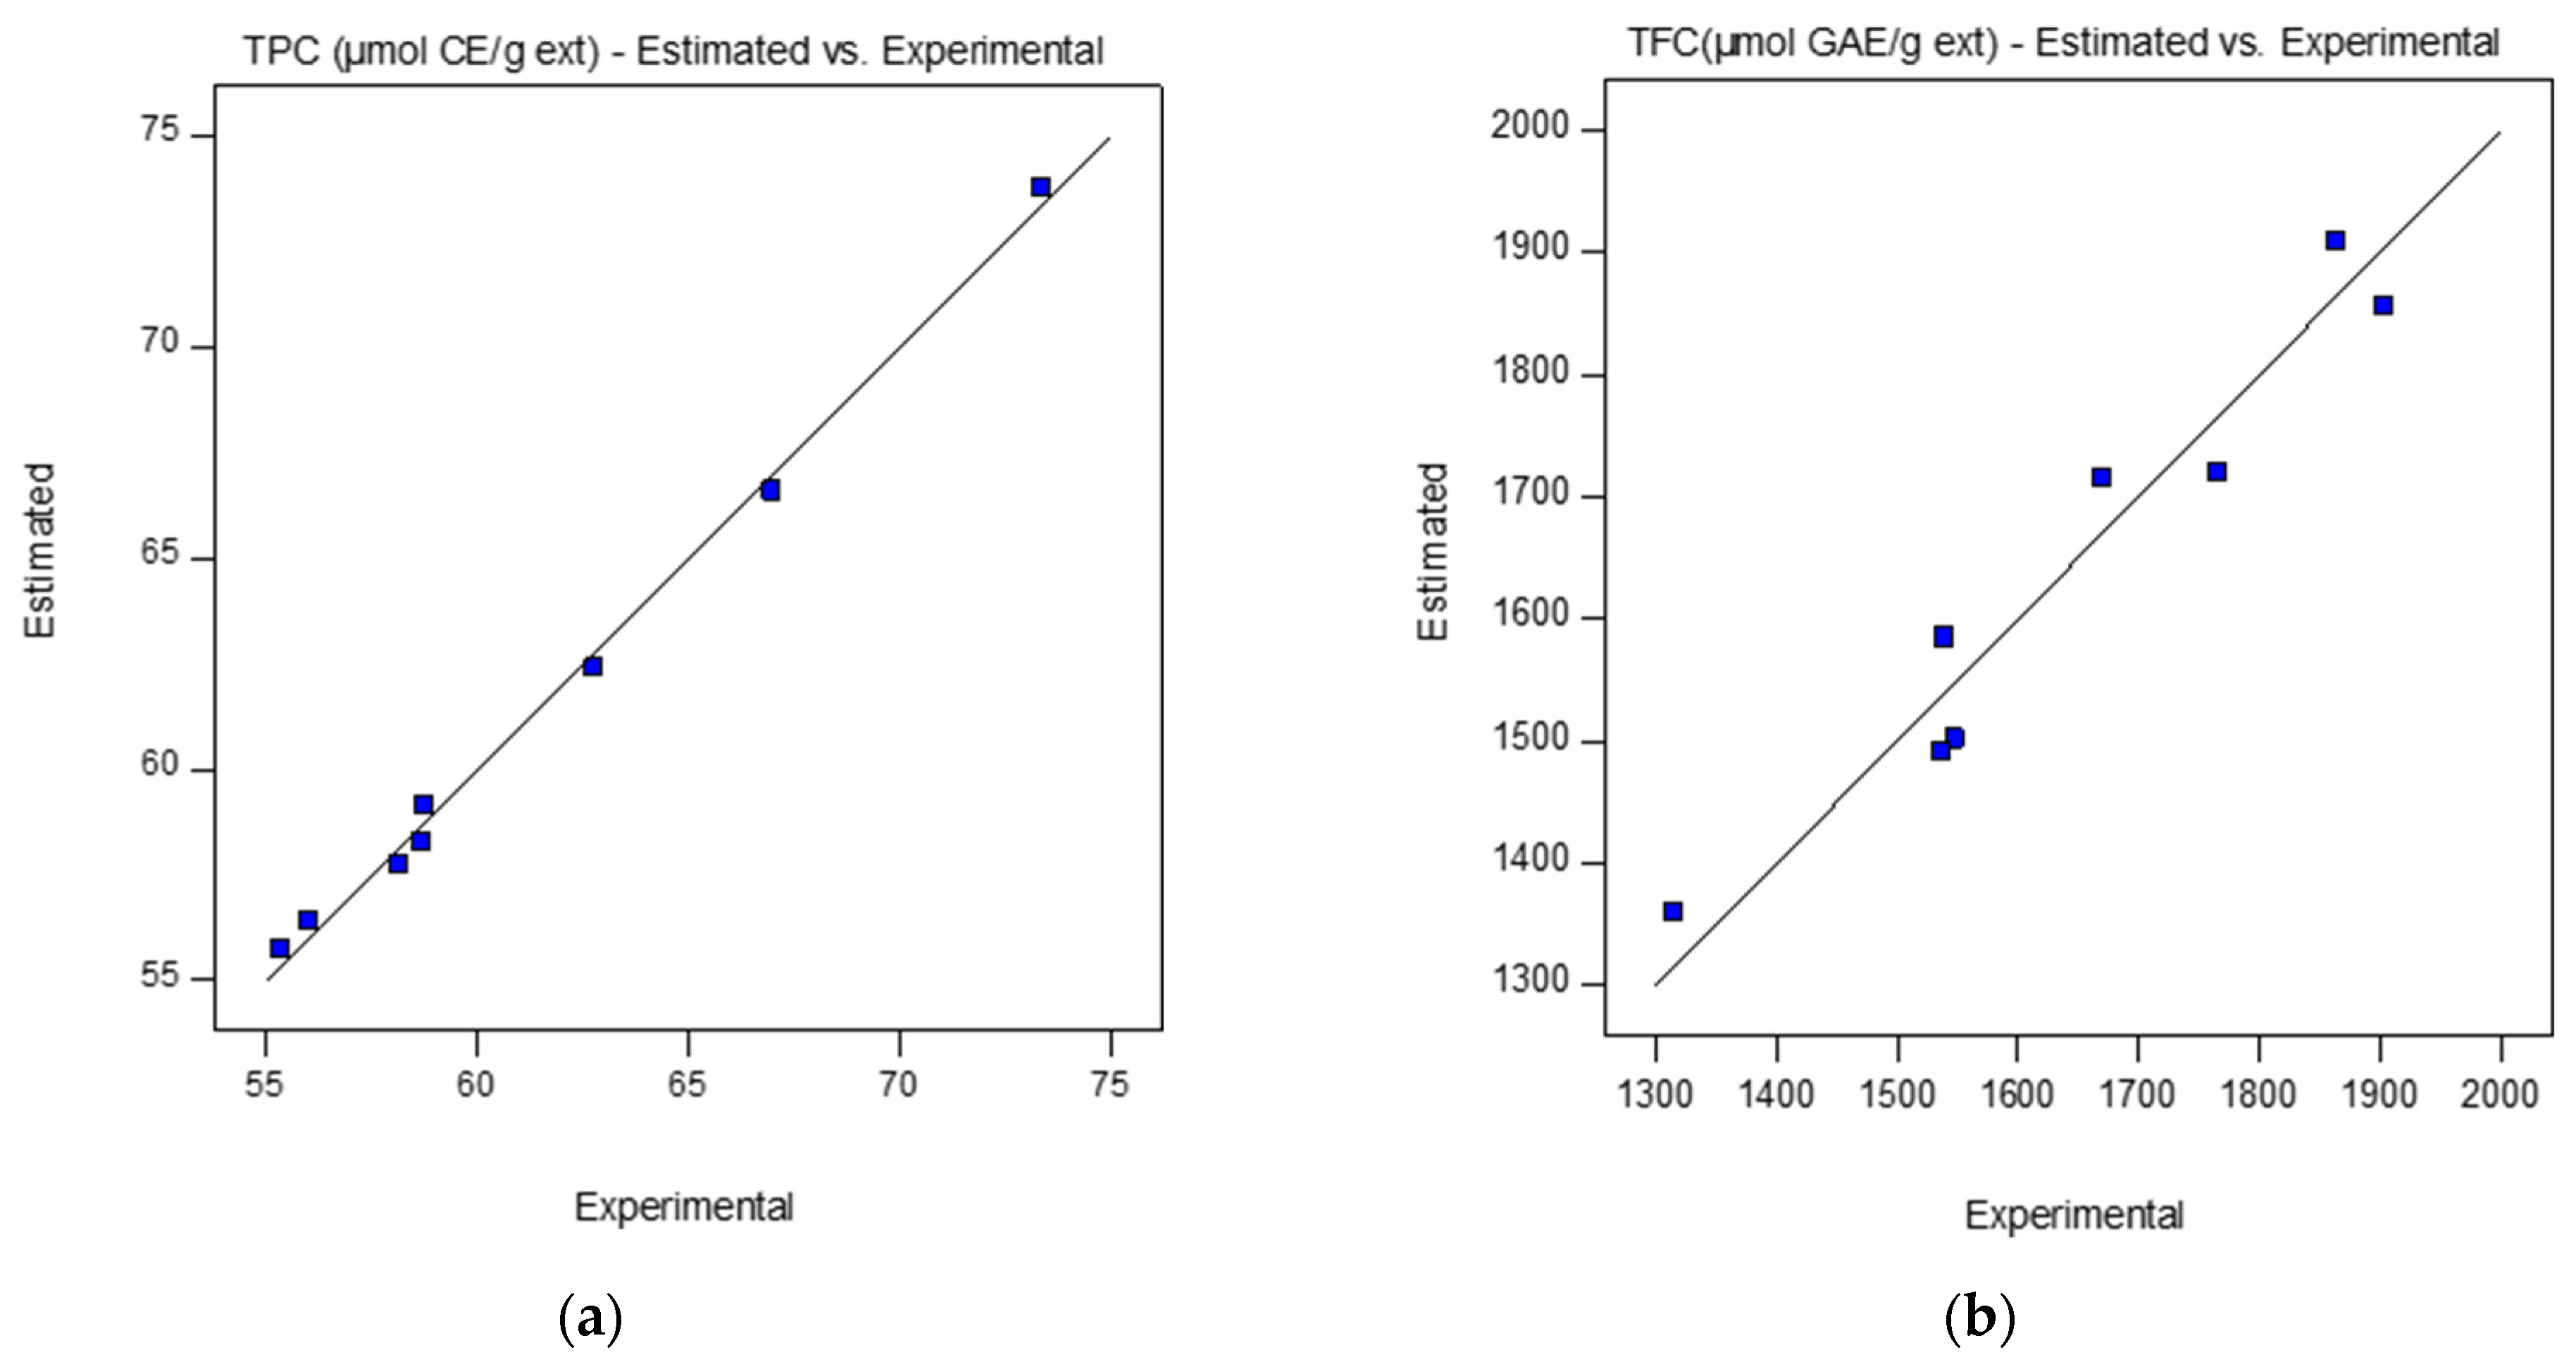
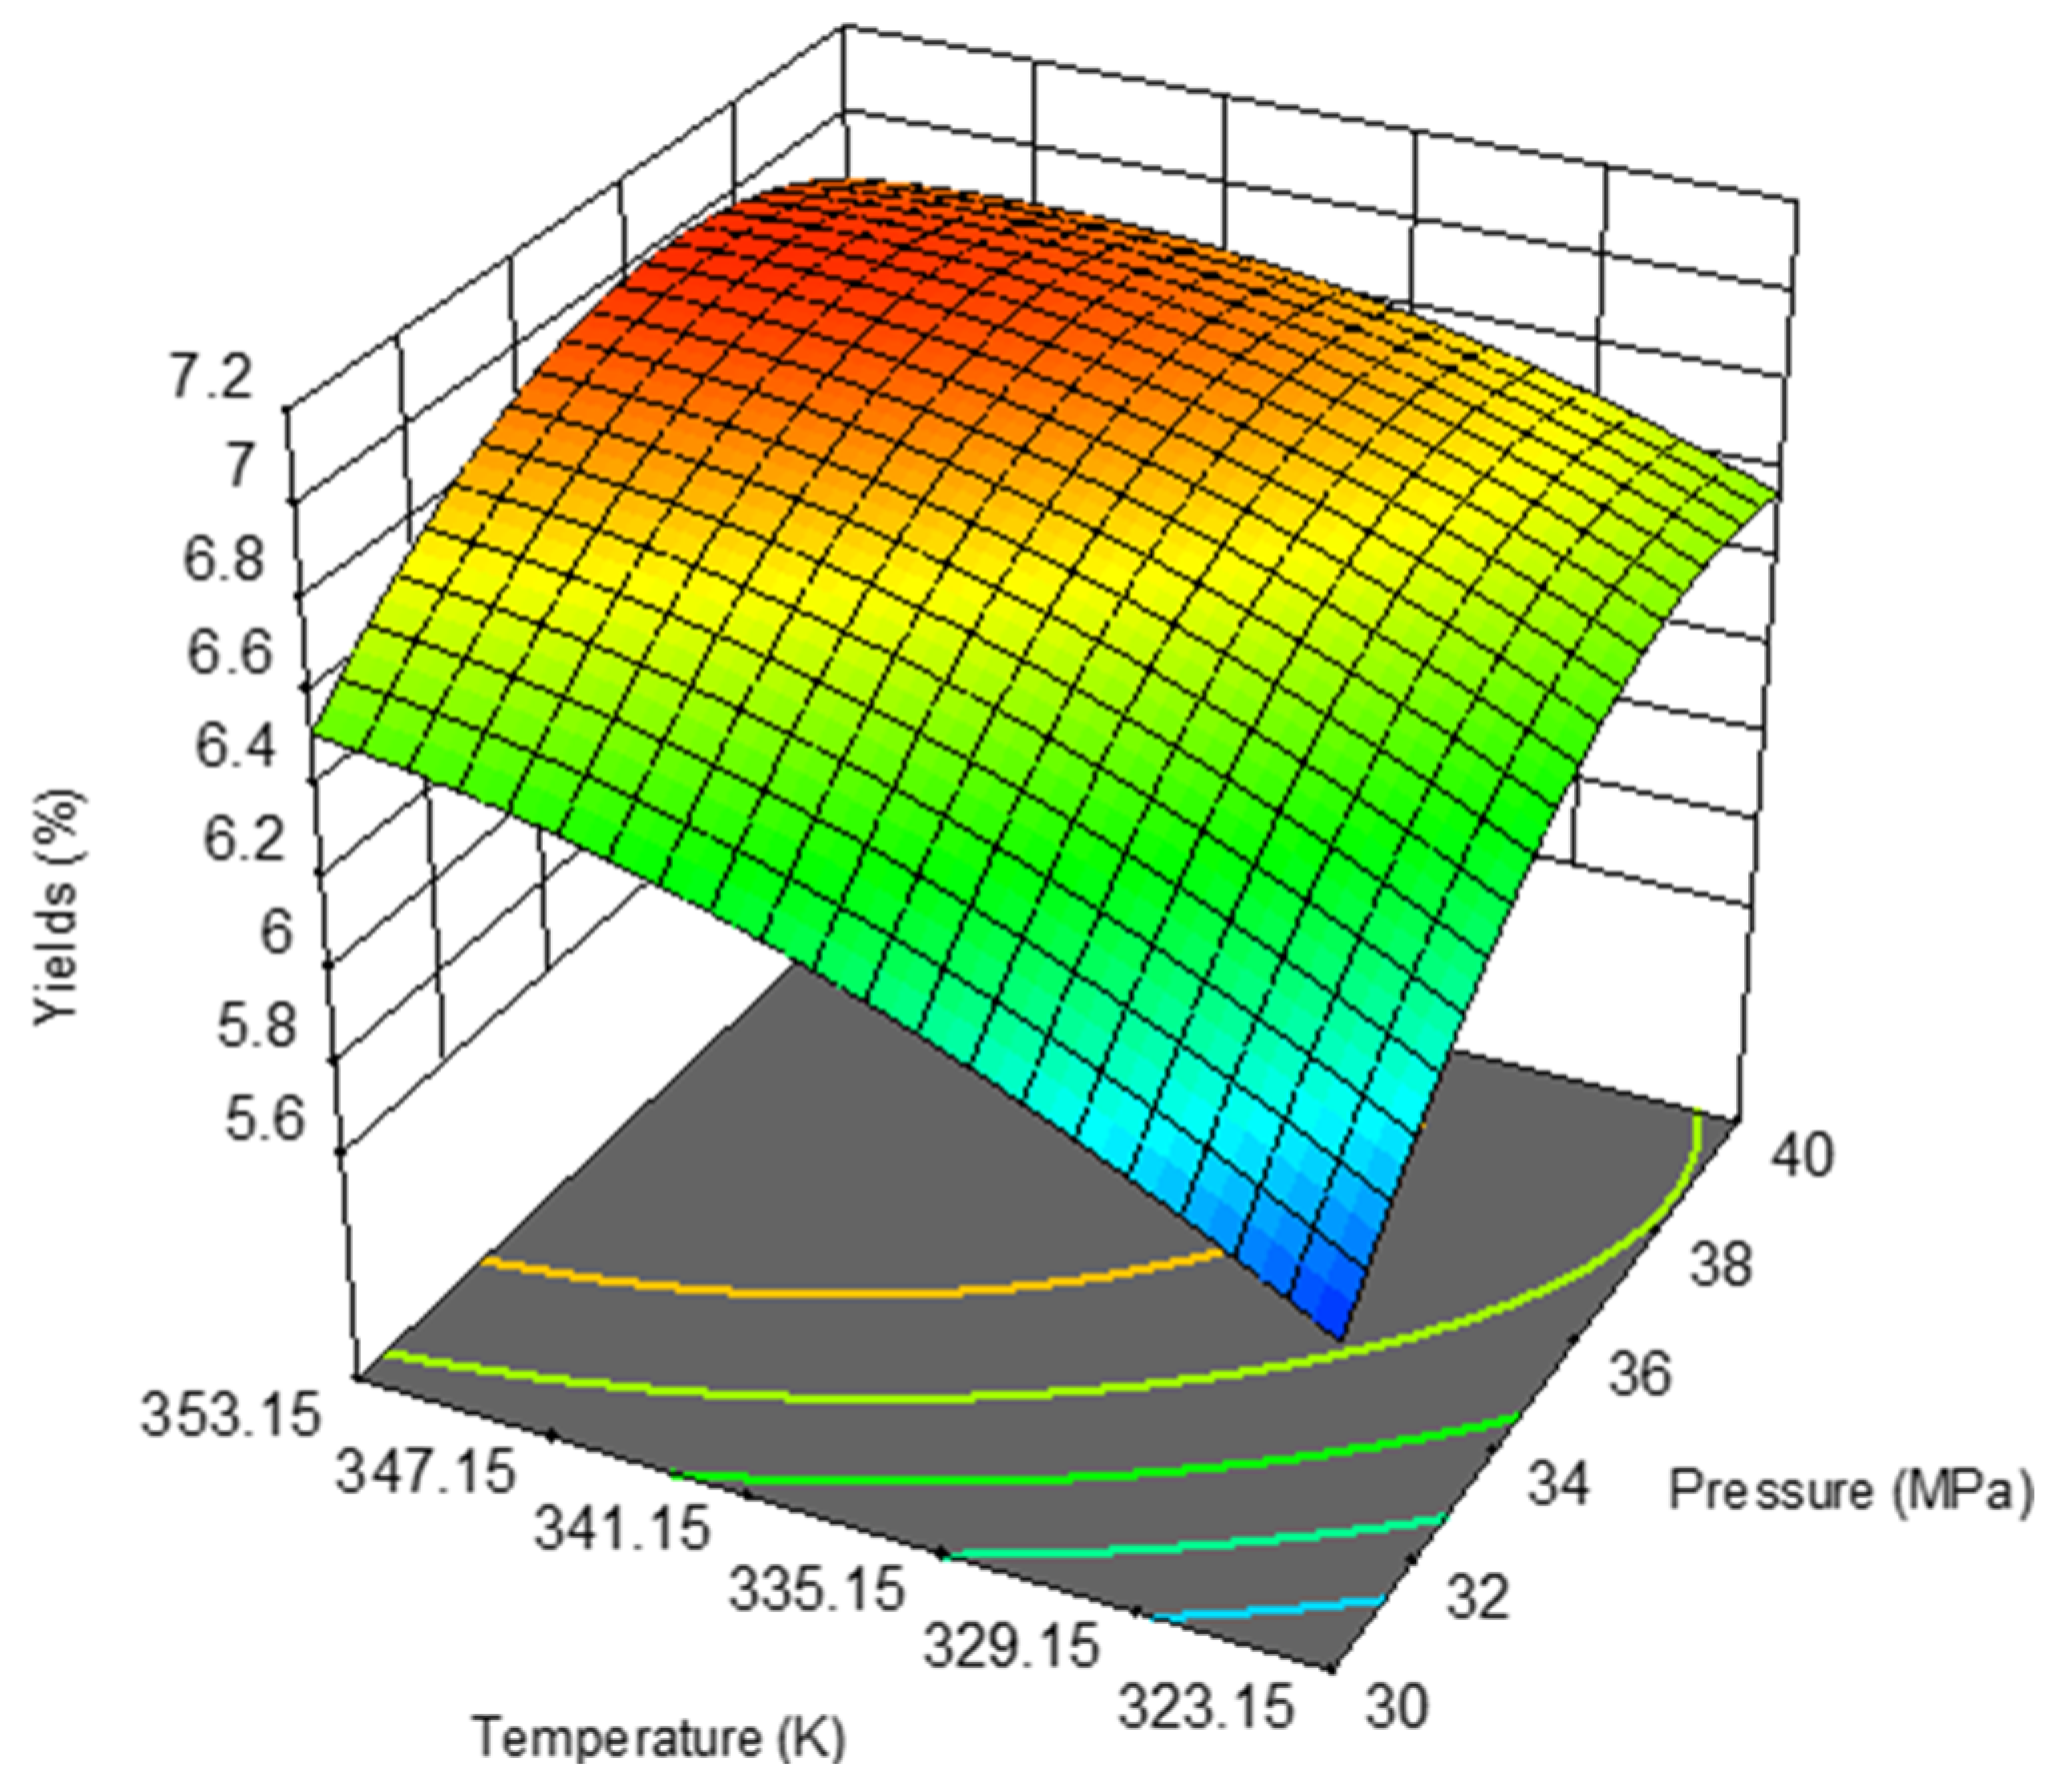
3. Results and Discussion

3.1. Design of Experiments

3.1.1. Fractional Factorial Design

The FFD is used to locate the ideal zone for the chosen experimental factors and intended responses. In this study, initially FFD was applied to generate a mathematical model and consider the viable interrelationships among the independent parameters through minimizing the number of experiments. Three independent parameters (factors) were selected—namely pressure, temperature, and CO2 flow rate—and their influence on the three response functions used to analyze the quality of the extracts was studied. The response functions chosen were yield (%), TPC, and TFC.
In the case of the 24−1 FFD, eight experimental runs were required. Each experiment was carried out until a maximum of the yield was achieved. The experimental kinetic curves obtained were simulated applying the mass transfer models, presented in Section 2.4.
Table 1 reports the results of the FFD design. Firstly, Soxhlet n-hexane extraction (HE) data are shown. The reason behind that is that HE is the conventional method, usually used. Then, the FFD design tests results are displayed, where A1, …A8 indicate the consecutive number of the scCO2 extraction performed at the corresponding experimental conditions (Table 1).
DE-11 was used to analyze the results obtained and identify the significant experimental factors influencing the extract yield, TPC, and TFC. Statistical testing of the model, for which a significance level of 5% was considered, was performed by analysis of variance (ANOVA) for each response.
The model analysis for the three response factors of yield, TPC, and TFC allowed us to obtain the following values of the coefficient of determination R2 = 0.921, 0.996, and 0.938, respectively.
The final model for the responses yield, TPC, and TFC in terms of factors pressure (MPa), temperature (K), and scCO2 flow rate (kg·min−1) are represented by Equations (11)–(13), respectively.
Y i e l d ( % ) = 28.31   0.5139 p r e s s u r e 0.07744 t e m p e r a t u r e 1116.0 ( f l o w   r a t e ) + 0.001872 ( p r e s s u r e t e m p e r a t u r e ) 46.48 ( p r e s s u r e f l o w   r a t e ) + 8.333 ( t e m p e r a t u r e f l o w   r a t e )
T P C ( μ mol   GAE / g ext ) = 61.27 + 2.51 p r e s s u r e 3.06 t e m p e r a t u r e 0.126 ( f l o w   r a t e ) 3.37 ( p r e s s u r e t e m p e r a t u r e ) 2.14 ( p r e s s u r e f l o w   r a t e ) + 1.32 ( t e m p e r a t u r e f l o w   r a t e )
T F C ( μ mol   CE / g ext ) = 1642.5 + 103.50 p r e s s u r e 125.23 t e m p e r a t u r a + 19.70 ( f l o w   r a t e ) 11.79 ( p r e s s u r e t e m p e r a t u r e ) + 20.71 ( p r e s s u r e f l o w   r a t e ) + 66.48 ( t e m p e r a t u r e f l o w   r a t e )
Figure 1 and Figure 2a,b show the agreement between the experimentally obtained and predicted values (represented by the straight line), for the three responses.
Among the three factors with values greater than p > 0.050 analyzed, the scCO2 flow rate was identified as the variable without significance to the model.
In order to determine the quadratic terms in the model that will shape the curvature across the whole response surface, a robust DOE, such as the central composite design (CCD), should be applied, as discussed in the section to follow.

3.1.2. Central Composite Design

The results of the FFD design identified the pressure and temperature as the significant experimental factors that influence the yield, TPC, and TFC in the oils. Consecutively, at the CCD test design stage, their values were varied in the range between 30 and 40 MPa, and 323.15 and 353.15 K, respectively. The value of CO2 flowrate was fixed at 1.8 × 10⁻³ kg/min, since the FFD design indicated its unsubstantial influence on the three responses.
Statistical testing of the model was performed in the form of an analysis of variance (ANOVA) for each response. The results obtained from the CCD are shown in Table 2.
All terms, pressure, and temperature (independent variables) were significant since the p-values were less than 0.05 (at the 5% probability level).
The final model for the response yield in terms of factors pressure (MPa) and temperature (K) is represented by Equation (14).
Y i e l d ( % ) = 97.70 +   1.33 p r e s s u r e + 0.46 t e m p e r a t u r e 0.0015 ( p r e s s u r e t e m p e r a t u r e ) 0.011 p r e s s u r e 2 0.00058 t e m p e r a t u r e 2
The ANOVA analysis of the model (Table 3) demonstrated that it is acceptable and reproducible and can be used reliably to determine the significant extraction parameter values that optimized the yield of the oils.
By applying Equation (14) resulting from the ANOVA analysis, it was possible to obtain for the yield (%) the 3D response surface plot shown on Figure 3. On the latter, the zones in red and orange correspond to higher values of the yield resulting from the combination of higher pressures and temperatures. Roughly, in the extraction process, maximum yields are achieved at temperatures above 335 K and pressures of 34 MPa.
Regarding TPC and TFC in the oils recovered, the ANOVA analyses show that they are not influenced by the change in pressure and temperature values. Thus, the models that best describe the two responses are given by Equations (15) and (16), respectively
T P C   ( μ mol   GAE / g   ext ) = 61.28
T F C   ( μ mol   CE / g   ext ) = 1696.80
To demonstrate the reliability of the models (Equations (14)–(16)), the software was applied to determine the best conditions leading to the optimum values of the three responses. Those values were verified by performing two experimental tests to compare them with the optimized ones. The results achieved are presented in Table 4, and they show that the models for predicting the optimum response values were acceptable, since there was a good agreement with the experimental values.

3.2. Extract Compositions—Fatty Acid Methyl Esters (FAMEs) Analysis

The influence of pressure, temperature, and scCO2 flow rate on the rice bran oils recovered in terms of their fatty acid compositions was analyzed, and the results are presented in Table 5. It should be noted that Table 5 displays the results for just some of the oils obtained since they did not differ significantly for the rest.
The main fatty acids identified in all the samples analyzed were palmitic (C16:0), linoleic (C18:2), and oleic (C18:1) acids, with the compositions of the latter two being commensurable in the bran rice oil. The composition values determined by us have some deviations from those of other authors [2,32,33,34], but they are insignificant. In addition, the results demonstrate that the extraction operational parameters do not appreciably affect the fatty acids profile of the rice bran oils, an observation in complete accordance with that reported in a previous work [33] and valid for oils obtained from other biomasses [18,35].

3.3. Mathematical Models Based on Differential Mass Balances

Mass transfer modeling of supercritical CO2 extraction was performed using the methods outlined briefly in Section 2.4. All experimental results obtained from FFD and CCD design were analyzed.
The following principal parameters were used: particle size, dp = 3.0 × 10⁻³ m; solid density, ρs = 580.0 kg·m−3; solute concentration in the solid phase at t = 0, q0 = 8.2 × 10⁻² kg·kg−1, which corresponds to the maximum yield obtained by the Soxhlet hexane extraction (Table 1); the surface of a unit volume of particles, a = 6/dp; the initial content of the difficult accessible solute in the solid, qk = 2.60 × 10⁻² (kg·kg−1), the initial fraction of solute in broken cells r = 0.45 and the fluid density, ρf, was taken from the NIST chemistry book (https://webbook.nist.gov/chemistry/) accessed on 11 April 2022.
In order to estimate the binary diffusion coefficient, D12, applying the equation of Wilke–Chang [36], and the theorical external mass transfer, kf, by the correlation of Wakao and Kaguei [37], it is assumed that triolein is the representative compound in the oil. This assumption is validated and based on the results of the GC-FID analyses which show that the principal fatty acid identified in the oils is C18:1. In addition, the properties of this triacylglycerol are well documented [35].
The experimental conditions and main parameters of the models, as well as the results obtained, are shown in Table 6.
The relative deviation between the experimental and calculated extraction yields (AAD %) is reported within parenthesis in Table 6. Taking into account the AAD(%) values, it can be concluded that for all samples of bran rice oil examined the desorption model by Tan and Liou (1989) is the worst performing and the least appropriate. For example, it predicts that the rate of extraction in the first part of the process is so high that the interfacial concentration is almost zero. Furthermore, it does not correlate the solute concentration in the fluid and solid phases to the rice matrix, where the decreasing amount of solute is slower and dependent on its location and interaction with that matrix.
As discussed briefly previously, BIC model considers both transport resistances in the fluid, and in the solid phases, but does not take into account the solute–matrix interaction, [29]. That interaction and different flow designs are taken into consideration in the 2005 model, and thus, as should be expected, it demonstrates the best performance (Table 6).
The values obtained are in a good agreement with those of other authors who reported application of [31] to different matrices, e.g., extraction of Baizhu [38]; recovery of oil from corn germ, pumpkin seeds, calendula flowers, and paprika fruits [39]; essential oil from black pepper [40], rosehip seeds [41], and Helichrysum italicum [42].
The deviations between the experimental data and the models [30,31] predictions of the overall extraction curves are low as shown in Table 6 and Figure 4 and Figure 5. The values of temperature and pressure were varied as reported above, and their influence on the extraction yields of the bran rice oil were represented as a function of the time.
Figure 4 shows, as an example, the influence of pressure and scCO2 flow rate, at 313.2 K, on the extraction yield of RBO. Regarding Tan and Liou 1984 model, only one curve is presented in order just to demonstrate the actual considerable deviations from the experimental data due to the fact that: (i) oil extraction rate predictions in the first part of the process are quite high; (ii) the decrease in the amount of solute available in the solid phase is not accounted for given the correlation of solute concentration in the fluid and solid phases in the matrix.
Figure 4 also shows that, at lower pressure, the flow rate has a significant influence on the extraction yield—thus almost double the time is needed to obtain maximal yield. To the contrary, at higher pressure the impact of the flow rate is practically negligible. Thus, the modeling results support the correctness of the decision to fix the flow rate at an intermediate value for the CCD design.
Figure 5 displays the influence of pressure at fixed temperature and scCO2 flow rate on the yield as a function of time.
Again, Sovová models perform well, and the modeling results are in a good agreement with the experimental data.

4. Conclusions

In our work, it was demonstrated that the application of the green and benign scCO2 to the recovery of oil from Japonica Luna rice bran not only eliminates the use of organic solvents in the process but achieves yields similar to that reported by n-hexane extraction.
Two DoE methods—an FFD followed by a CCD—were successfully applied to optimize the scCO2 extraction process, and the influence of the factors of principal significance; pressure and temperature on the extraction process responses yield, TPC, TFC, and fatty acid composition of RBOs, analyzed by GC-FID, was discussed. The reliability of the models was demonstrated by performing two experimental tests applying the best operating conditions leading to the optimum values of the three responses.
In addition, three mathematical models based on differential mass balances were applied to simulate the experimental cumulative extraction yield curves obtained. It was shown that the models that consider the nature of the matrix, solute–matrix interactions, as well as the location of the oil in the raw material give the best results, with an average of the AAD% of 4.16.
To the best of our knowledge, our work is the first to report optimization of scCO2 recovery of RBO applying DoE, followed by modeling of the process kinetics and identification and quantification of free fatty acids in the oils recovered. The results obtained can be used in the design and scale-up of environmentally safe and sustainable scCO2 processes targeting efficient valorization of wastes generated from rice milling.

Author Contributions

Conceptualization, J.P.C. and R.P.S.; Methodology, J.P.C., M.P.R. and I.S.F.; Validation, R.P.S., J.P.C. and M.P.R.; Formal analysis, M.P.R. and I.S.F.; Investigation, J.P.C., M.P.R. and I.S.F.; Writing—original draft preparation, all authors; Writing—review and editing, R.P.S. and J.P.C.; Supervision, J.P.C. and M.P.R.; Funding acquisition, R.P.S., J.P.C. and M.P.R. All authors have read and agreed to the published version of the manuscript.

Funding

The authors acknowledge the funding received from the European Union’s Horizon 2020 research and innovation program under the Marie Sklodowska-Curie grant agreement no. 778168. To Centro de Química Estrutural a Research Unit funded by Fundação para a Ciência e Tecnologia through projects UIDB/00100/2020 and UIDP/00100/2020. Institute of Molecular Sciences is an Associate Laboratory funded by FCT through project LA/P/0056/2020.

Institutional Review Board Statement

Not applicable.

Informed Consent Statement

Not applicable.

Data Availability Statement

Not applicable.

Conflicts of Interest

The authors declare no conflict of interest. The funders had no role in the design of the study; in the collection, analyses, or interpretation of the data; in the writing of the manuscript; or in the decision to publish the results.

References

  1. Pandey, R.; Shrivastava, S.L. Comparative evaluation of rice bran oil obtained with two-step microwave assisted extraction and conventional solvent extraction. J. Food Eng. 2018, 218, 106–114. [Google Scholar] [CrossRef]
  2. Pinto, T.I.; Coelho, J.A.; Pires, B.I.; Neng, N.R.; Nogueira, J.M.; Bordado, J.C.; Sardinha, J.P. Supercritical carbon dioxide extraction, antioxidant activity, and fatty acid composition of bran oil from rice varieties cultivated in Portugal. Separations 2021, 8, 115. [Google Scholar] [CrossRef]
  3. Okajima, I.; Ito, K.; Aoki, Y.; Kong, C.Y.; Sako, T. Extraction of Rice Bran Oil Using CO2-Expanded Hexane in the Two-Phase Region. Energies 2022, 15, 2594. [Google Scholar] [CrossRef]
  4. Khan, S.H.; Butt, M.S.; Sharif, M.K.; Sameen, A.; Mumtaz, S.; Sultan, M.T. Functional properties of protein isolates extracted from stabilized rice bran by microwave, dry heat, and parboiling. J. Agric. Food Chem. 2011, 59, 2416–2420. [Google Scholar] [CrossRef] [PubMed]
  5. El Boulifi, N.; Bouaid, A.; Martinez, M.; Aracil, J. Optimization and oxidative stability of biodiesel production from rice bran oil. Renew. Energy 2013, 53, 141–147. [Google Scholar] [CrossRef]
  6. Burlando, B.; Cornara, L. Therapeutic properties of rice constituents and derivatives (Oryza sativa L.): A review update. Trends Food Sci. Technol. 2014, 40, 82–98. [Google Scholar] [CrossRef]
  7. Balachandran, C.; Mayamol, P.N.; Thomas, S.; Sukumar, D.; Sundaresan, A.; Arumughan, C. An ecofriendly approach to process rice bran for high quality rice bran oil using supercritical carbon dioxide for nutraceutical applications. Bioresour. Technol. 2008, 99, 2905–2912. [Google Scholar] [CrossRef]
  8. Mingyai, S.; Kettawan, A.; Srikaeo, K.; Singanusong, R. Physicochemical and antioxidant properties of rice bran oils produced from colored rice using different extraction methods. J. Oleo Sci. 2017, 66, 565–572. [Google Scholar] [CrossRef] [Green Version]
  9. Mingyai, S.; Srikaeo, K.; Kettawan, A.; Singanusong, R.; Nakagawa, K.; Kimura, F.; Ito, J. Effects of extraction methods on phytochemicals of rice bran oils produced from colored rice. J. Oleo Sci. 2018, 67, 135–142. [Google Scholar] [CrossRef] [Green Version]
  10. Tomita, K.; Machmudah, S.; Wahyudiono; Fukuzato, R.; Kanda, H.; Quitain, A.T.; Sasaki, M.; Goto, M. Extraction of rice bran oil by supercritical carbon dioxide and solubility consideration. Sep. Purif. Technol. 2014, 125, 319–325. [Google Scholar] [CrossRef]
  11. Manosroi, A.; Ruksiriwanich, W.; Abe, M.; Sakai, H.; Manosroi, W.; Manosroi, J. Biological activities of the rice bran extract and physical characteristics of its entrapment in niosomes by supercritical carbon dioxide fluid. J. Supercrit. Fluids 2010, 54, 137–144. [Google Scholar] [CrossRef]
  12. Soares, J.F.; Dal Prá, V.; De Souza, M.; Lunelli, F.C.; Abaide, E.; Da Silva, J.R.F.; Kuhn, R.C.; Martínez, J.; Mazutti, M.A. Extraction of rice bran oil using supercritical CO2 and compressed liquefied petroleum gas. J. Food Eng. 2016, 170, 58–63. [Google Scholar] [CrossRef] [Green Version]
  13. Wang, C.-H.; Chen, C.-R.; Wu, J.-J.; Wang, L.-Y.; Chang, C.-M.J.; Ho, W.-J. Designing supercritical carbon dioxide extraction of rice bran oil that contain oryzanols using response surface methodology. J. Sep. Sci. 2008, 31, 1399–1407. [Google Scholar] [CrossRef]
  14. Sparks, D.; Hernandez, R.; Zappi, M.; Blackwell, D.; Fleming, T. Extraction of rice brain oil using supercritical carbon dioxide and propane. J. Am. Oil Chem. Soc. 2006, 83, 885–891. [Google Scholar] [CrossRef]
  15. Benito-Román, O.; Varona, S.; Sanz, M.T.; Beltrán, S. Valorization of rice bran: Modified supercritical CO2 extraction of bioactive compounds. J. Ind. Eng. Chem. 2019, 80, 273–282. [Google Scholar] [CrossRef]
  16. Trevisani Juchen, P.; Nolasco Araujo, M.; Hamerski, F.; Corazza, M.L.; Pedersen Voll, F.A. Extraction of parboiled rice bran oil with supercritical CO2 and ethanol as co-solvent: Kinetics and characterization. Ind. Crops Prod. 2019, 139, 111506. [Google Scholar] [CrossRef]
  17. Santos, C.P.; Rato, T.J.; Reis, M.S. Design of Experiments: A comparison study from the non-expert user’s perspective. J. Chemom. 2019, 33, e3087. [Google Scholar] [CrossRef] [Green Version]
  18. Coelho, J.P.; Filipe, R.M.; Paula Robalo, M.; Boyadzhieva, S.; Cholakov, G.S.; Stateva, R.P. Supercritical CO2 extraction of spent coffee grounds. Influence of co-solvents and characterization of the extracts. J. Supercrit. Fluids 2020, 161, 104825. [Google Scholar] [CrossRef]
  19. Coelho, J.P.; Bernotaityte, K.; Miraldes, M.A.; Mendonca, A.F.; Stateva, R.P. Solubility of ethanamide and 2-propenamide in supercritical carbon dioxide. Measurements and correlation. J. Chem. Eng. Data 2009, 54, 2546–2549. [Google Scholar] [CrossRef]
  20. Bobo-García, G.; Davidov-Pardo, G.; Arroqui, C.; Marín-Arroyo, M.R.; Vírseda, P.; Marín-Arroyo, M.R.; Navarro, M. Intra-laboratory validation of microplate methods for total phenolic content and antioxidant activity on polyphenolic extracts, and comparison with conventional spectrophotometric methods. J. Sci. Food Agric. 2015, 95, 204–209. [Google Scholar] [CrossRef]
  21. Reis, F.S.; Pereira, E.; Barros, L.; Sousa, M.J.; Martins, A.; Ferreira, I.C.F.R. Biomolecule profiles in inedible wild mushrooms with antioxidant value. Molecules 2011, 16, 4328–4338. [Google Scholar] [CrossRef] [PubMed]
  22. Coelho, J.; Veiga, J.; Karmali, A.; Nicolai, M.; Pinto Reis, C.; Nobre, B.; Palavra, A.; Reis, C.P.; Nobre, B.; Palavra, A. Supercritical CO2 Extracts and Volatile Oil of Basil (Ocimum basilicum L.) Comparison with Conventional Methods. Separations 2018, 5, 21. [Google Scholar] [CrossRef] [Green Version]
  23. De Melo, M.M.R.; Silvestre, A.J.D.; Silva, C.M. Supercritical fluid extraction of vegetable matrices: Applications, trends and future perspectives of a convincing green technology. J. Supercrit. Fluids 2014, 92, 115–176. [Google Scholar] [CrossRef]
  24. Oliveira, E.L.G.; Silvestre, A.J.D.; Silva, C.M. Review of kinetic models for supercritical fluid extraction. Chem. Eng. Res. Des. 2011, 89, 1104–1117. [Google Scholar] [CrossRef]
  25. Huang, Z.; Shi, X.-H.; Jiang, W.-J. Theoretical models for supercritical fluid extraction. J. Chromatogr. A 2012, 1250, 2–26. [Google Scholar] [CrossRef]
  26. Sovovà, H.; Stateva, R.P. Supercritical fluid extraction from vegetable materials. Rev. Chem. Eng. 2011, 27, 79–156. [Google Scholar] [CrossRef]
  27. Del Valle, J.M. Extraction of natural compounds using supercritical CO2: Going from the laboratory to the industrial application. J. Supercrit. Fluids 2015, 96, 180–199. [Google Scholar] [CrossRef]
  28. Tan, C.S.; Liou, D.C. Modeling of desorption at super critical conditions. AIChE J. 1989, 35, 1029–1031. [Google Scholar] [CrossRef]
  29. Grosso, C.; Coelho, J.P.; Pessoa, F.L.P.; Fareleira, J.M.N.A.; Barroso, J.G.; Urieta, J.S.; Palavra, A.A.F.; Sovová, H. Mathematical modelling of supercritical CO2 extraction of volatile oils from aromatic plants. Chem. Eng. Sci. 2010, 65, 3579–3590. [Google Scholar] [CrossRef]
  30. Sovová, H. Rate of the vegetable oil extraction with supercritical CO2-I. Modelling of extraction curves. Chem. Eng. Sci. 1994, 49, 409–414. [Google Scholar] [CrossRef]
  31. Sovová, H. Mathematical model for supercritical fluid extraction of natural products and extraction curve evaluation. J. Supercrit. Fluids 2005, 33, 35–52. [Google Scholar] [CrossRef]
  32. Jesus, S.P.; Grimaldi, R.; Hense, H. Recovery of γ-oryzanol from rice bran oil byproduct using supercritical fluid extraction. J. Supercrit. Fluids 2010, 55, 149–155. [Google Scholar] [CrossRef]
  33. Chia, S.L.; Boo, H.C.; Muhamad, K.; Sulaiman, R.; Umanan, F.; Chong, G.H. Effect of Subcritical Carbon Dioxide Extraction and Bran Stabilization Methods on Rice Bran Oil. JAOCS J. Am. Oil Chem. Soc. 2015, 92, 393–402. [Google Scholar] [CrossRef]
  34. Reis, N.; Castanho, A.; Lageiro, M.; Pereira, C.; Brites, C.M.; Vaz-Velho, M. Microwave-Assisted Method and Its Effects on GABA and Gamma-Oryzanol Compounds. Foods 2022, 11, 912. [Google Scholar] [CrossRef]
  35. Coelho, J.P.; Filipe, R.M.; Robalo, M.P.; Stateva, R.P. Recovering value from organic waste materials: Supercritical fluid extraction of oil from industrial grape seeds. J. Supercrit. Fluids 2018, 141, 68–77. [Google Scholar] [CrossRef]
  36. Wilke, C.R.; Chang, P. Correlations of diffusion coefficients in dilute solutions. AICHE J. 1955, 1, 264–270. [Google Scholar] [CrossRef]
  37. Wakao, N.; Kaguei, S. Heat and Mass Transfer in Packed Beds; Gordon and Breach Science Publisher: London, UK, 1982; ISBN 0677058608. [Google Scholar]
  38. Huang, Z.; Yang, M.; Liu, S.; Ma, Q. Supercritical carbon dioxide extraction of Baizhu: Experiments and modeling. J. Supercrit. Fluids 2011, 58, 31–39. [Google Scholar] [CrossRef]
  39. Nagy, B. Characterization of packed beds of plant materials processed by supercritical fluid extraction. J. Food Eng. 2008, 88, 104–113. [Google Scholar] [CrossRef]
  40. Ferreira, S.R.S.; Nikolov, Z.L.; Doraiswamy, L.K.; Meireles, M.A.A.; Petenate, A.J. Supercritical fluid extraction of black pepper (Piper nigrun L.) essential oil. J. Supercrit. Fluids 1999, 14, 235–245. [Google Scholar] [CrossRef]
  41. del Valle, J.; Rivera, O.; Mattea, M.; Ruetsch, L.; Daghero, J.; Flores, A. Supercritical CO2 processing of pretreated rosehip seeds: Effect of process scale on oil extraction kinetics. J. Supercrit. Fluids 2004, 31, 159–174. [Google Scholar] [CrossRef]
  42. Ivanovic, J.; Ristic, M.; Skala, D. Supercritical CO2 extraction of Helichrysum italicum: Influence of CO2 density and moisture content of plant material. J. Supercrit. Fluids 2011, 57, 129–136. [Google Scholar] [CrossRef]
Figure 1. Estimated (represented by the straight line), and experimental values for the rice bran oil yield (%) recovered by scCO2 extraction, and at the FFD design tests conditions shown in Table 1.
Chemengineering 06 00063 g001
Figure 2. Estimated (represented by the straight line), and experimental values for the rice bran oil recovered by scCO2 extraction at the FFD design tests conditions shown in Table 1: (a) TPC (μmol CE/g ext) and (b) TFC (μmol GAE/g ext).
Chemengineering 06 00063 g002
Figure 3. Response surface plot showing the effects of the temperature and pressure on the rice oil bran extraction yield.
Chemengineering 06 00063 g003
Figure 4. Extraction yield curves representing the influence of pressure (MPa) and CO2 flow rates (kg/min) at 313.15 K, on RBO yield, as a function of time. The symbols are the experimental data, and line-model predictions.
Chemengineering 06 00063 g004
Figure 5. Extraction yield curves representing the influence of pressure (MPa) at temperature (338.15 K) and CO2 flow rates (1.8×10⁻³ kg/min), on bran rice oil yield, as a function of time. The symbols are the experimental data, and line-model predictions.
Chemengineering 06 00063 g005
Table 1. FFD design tests results and the response functions evaluated in each run.
RunPressure
(MPa)
Temperature (K)Flow Rate (kg/min)Yield (%)TPC
(μmol GAE/g ext)
Flavonoids
(μmol CE/g ext)
HE---8.2060.24 ± 3.912092.19 ± 78.97
A125.0313.152.7 × 10−36.4858.76 ± 2.671538.99 ± 97.96
A240.0353.150.9 × 10−36.9158.67 ± 0.521547.83 ± 78.21
A325.0313.150.9 × 10−36.2658.14 ± 3.311765.87 ± 29.90
A440.0313.150.9 × 10−36.4373.41 ± 1.551863.10 ± 124.90
A540.0313.152.7 × 10−35.9766.99 ± 3.551902.88 ± 105.60
A625.0353.150.9 × 10−35.0755.35 ± 1.121314.32 ± 79.87
A725.0353.152.7 × 10−36.4562.79 ± 3.701536.78 ± 174.03
A840.0353.152.7 × 10−36.4656.02 ± 3.501670.11 ± 81.74
Table 2. CCD test design results and the response evaluated in each run.
RunPressure
(MPa)
Temperature (K)Yield (%)TPC
(μmol GAE/g ext)
Flavonoids
(μmol CE/g ext)
A930.0323.155.7259.98 ± 1.991537.24 ± 129.38
A1040.0323.156.5062.21 ± 2.581565.42 ± 73.94
A1130.0353.156.5753.38 ± 3.031636.68 ± 77.85
A1242.0338.156.6760.04 ± 2.121707.95 ± 24.58
A1335.0338.156.8168.58 ± 0.841641.84 ± 194.11
A1435.0338.156.6765.89 ± 1.951631.53 ± 116.81
A1535.0317.156.3263.27 ± 1.991907.39 ± 4.52
A1635.0338.157.1260.78 ± 0.961831.15 ± 254.14
A1740.0353.156.9154.98 ± 2.371683.09 ± 155.90
A1835.0359.156.8763.01 ± 1.711751.05 ± 121.03
A1927.9338.155.9361.97 ± 2.041771.49 ± 128.09
Table 3. ANOVA results on the CCD models selected. Estimated regression model of the relationship between a response variable and the independent variables.
Yield (%)
SourceSS aMS bF-Valuep-Value
Model1.60000.320615.320.0047
X1-Pressure (MPa)0.58670.586728.040.0032
X2-Temperature(K)0.51910.519124.810.0042
X1X20.04840.04842.310.1888
X120.43420.434220.750.0061
X220.09510.09514.550.0862
Residual0.10460.0209
Lack of Fit0.03070.01020.27750.8406
Pure Error0.07390.0369
Cor Total1.71
a Sums of squares. b Mean square.
Table 4. Predicted and experimental values of the responses were obtained at the optimum conditions of the independent variables. The experimental data are given as the mean ± SD (n = 2).
Pressure (MPa)Temperature (K)Yields (%)TPC
(μmol GAE/g ext)
Flavonoids
(μmol CE/g ext)
Predicted values34.3587339.4936.8270661.28091696.8
Experimental values34.5339.56.79 ± 0.0664.20 ± 5.421739.1 ± 75.4
Table 5. Compositions of the esters of fatty acids obtained with scCO2, % mass *.
FFD CCD
Run A2Run A3Run A4Run A12Run A16Run A17Run A10
Fatty Acid 40/353.1525/313.1540/313.1542/338.1535/338.1540/353.1527.9/338.15
C14:0—Myristic0.06 ± 0.020.08 ± 0.030.05 ± 0.010.06 ± 0.020.06 ± 0.020.06 ± 0.020.07 ± 0.03
C16:0—Palmitic15.32 ± 0.5915.95 ± 0.6115.35 ± 0.4915.22 ± 0.5515.38 ± 0.6315.12 ± 0.6515.87 ± 0.53
C18:0—Stearic1.58 ± 0.081.84 ± 0.071.43 ± 0.061.45 ± 0.071.41 ± 0.071.43 ± 0.081.63 ± 0.07
C18:1—Oleic41.37 ± 1.0041.78 ± 0.9541.53 ± 0.8941.65 ± 1.0141.47 ± 1.0041.58 ± 0.9641.31 ± 0.98
C18:2—Linoleic39.03 ± 0.9738.69 ± 1.0039.42 ± 1.05 39.27 ± 0.9439.65 ± 1.0639.61 ± 1.0539.45 ± 1.01
C18:3—Linolenic1.54 ± 0.061.02 ± 0.071.34 ± 0.081.48 ± 0.071.36 ± 0.061.46 ± 0.071.32 ± 0.06
C20:0—Arachidic0.25 ± 0.020.18 ± 0.020.27± 0.030.24 ± 0.020.26 ± 0.020.12 ± 0.020.10 ± 0.02
C20:1—Gadoleic0.53 ± 0.030.24 ± 0.020.38 ± 0.020.41 ± 0.030.19 ± 0.020.34 ± 0.020.13 ± 0.02
C22:0 —Behenic0.11 ± 0.020.08 ± 0.030.12 ± 0.020.09 ± 0.020.12 ± 0.020.14 ± 0.020.07 ± 0.03
C22:1—Erucic0.15 ± 0.030.06 ± 0.020.07 ± 0.020.08 ± 0.030.05 ± 0.020.12 ± 0.020.05 ± 0.02
C24:0—Lignoceric0.06 ± 0.03-----0.07 ± 0.030.06 ± 0.030.05 ± 0.040.07 ± 0.03-----
DUFA39.0338.6939.4239.2739.6539.6139.45
MUFA42.0542.0841.9842.1441.7142.0441.49
SFA17.3818.1317.2917.1217.2816.9417.74
UI1.2011.1951.2081.2071.2101.2131.204
SFA: Saturated fatty acids; MUFA: Monounsaturated fatty acids; DUFA: Di-unsaturated fatty acid; UI: Unsaturation index is defined by UI = (2 DUFA% molar fraction + MUFA % molar fraction)/100. * The lowest limit under which concentrations could not be determined quantitatively by the method used was 0.03. Those concentrations were assumed to be 0.00% mass.
Table 6. Experimental conditions, principal parameters, and mass transfer coefficients for the rice bran oil extraction by SC-CO2.
RunP (MPa)T (K)Flow Rate
f (kg/s) × 105
Superficial Velocity u (m·s−1) × 104Co
(kg/kg) × 102
Tan and Liou [28]
kd × 104 (s−1)
Sovová [30]
ks × 108 (m·s−1)/
kf × 106 (m·s−1)
Sovová [31]
ks × 108 (m·s−1)
a D12 × 109
(m2·s−1)
bkf × 106
(m·s−1)
A1 (FFD)25.0313.154.493.321.305.056 (8.98%)0.609/0.201 (3.42%)1.87 (3.86%)2.8727.971
A3 (FFD)25.0313.151.621.191.301.431 (10.7%)0.0432/0.0876 (5.52%)0.444 (3.26%)2.8723.401
A6 (FFD)25.0353.151.581.490.600.739 (6.76%)0.0376/0.0924 (10.5%)0.444 (3.24%)5.0086.534
A7 (FFD)25.0353.154.574.320.601.998 (7.97%)0.0942/0.230 (7.82%)0.790 (4.41%)5.0081.581
A19 (CCD)27.9338.153.082.531.103.300 (4.77%)0.492/0.188 (4.40%)2.85 (2.21%)3.8268.120
A9 (CCD)30.0323.153.122.331.604.514 (8.97%)0.304/0.155(1.56%)1.49 (4.59%)3.0296.193
A11 (CCD)30.0353.153.082.691.203.956(6.00%)1.099/0.196 (4.87%)3.94 (1.24%)4.3979.551
A13 (CCD)35.0338.153.122.402.205.872 (5.12%)1.572/0.137 (2.87%)4.66 (2.63%)3.3706.920
A14 (CCD)35.0338.153.092.382.205.884 (7.62%)1.627/0.126 (3.13%)4.60 (3.69%)3.3686.870
A16 (CCD)35.0338.153.112.402.206.337 (6.27%)1.711/0.134 (3.77%)4.48 (4.77%)3.3686.918
A15 (CCD)35.0317.153.152.222.004.964 (8.30%)0.948/0.117 (1.90%)2.40 (4.13%)2.6095.185
A18 (CCD)35.0359.153.102.622.105.663 (4.80%)1.769/0.135 (2.13%)4.71 (2.81%)4.2519.034
A4 (FFD)40.0313.151.611.092.102.335 (8.71%)0.148/0.0521 (1.13%)0.867 (4.29%)2.3372.590
A5 (FFD)40.0313.154.643.152.106.624 (16.3%)0.424/0.181 (4.13%)1.65 (5.11%)2.3376.250
A10 (CCD)40.0323.153.112.192.306.654 (12.7%)0.821/3.126 (1.80%)3.98 (7.99%)2.6395.156
A17 (CCD)40.0353.153.132.472.307.445 (9.22%)1.412/1.361 (3.19%)7.74 (5.47%)3.6837.599
A8 (FFD)40.0353.154.593.622.9010.12 (10.0%)1.677/0.217 (2.21%)7.00 (4.37%)3.6831.044
A2 (FFD)40.0353.151.601.262.903.445 (9.91%)0.310/0.0691 (1.48%)1.97 (4.98%)3.6834.346
A12(CCD)42.0338.153.062.252.607.110 (12.6%)1.063/2.357 (2.52%)8.51 (6.02%)3.0575.987
a Binary diffusion coefficient estimated by the equation by Wilke–Chang (1955) [36] b Estimated from the correlation proposed by Wakao and Kaguei (1982) [37].
Publisher’s Note: MDPI stays neutral with regard to jurisdictional claims in published maps and institutional affiliations.

