1. Introduction
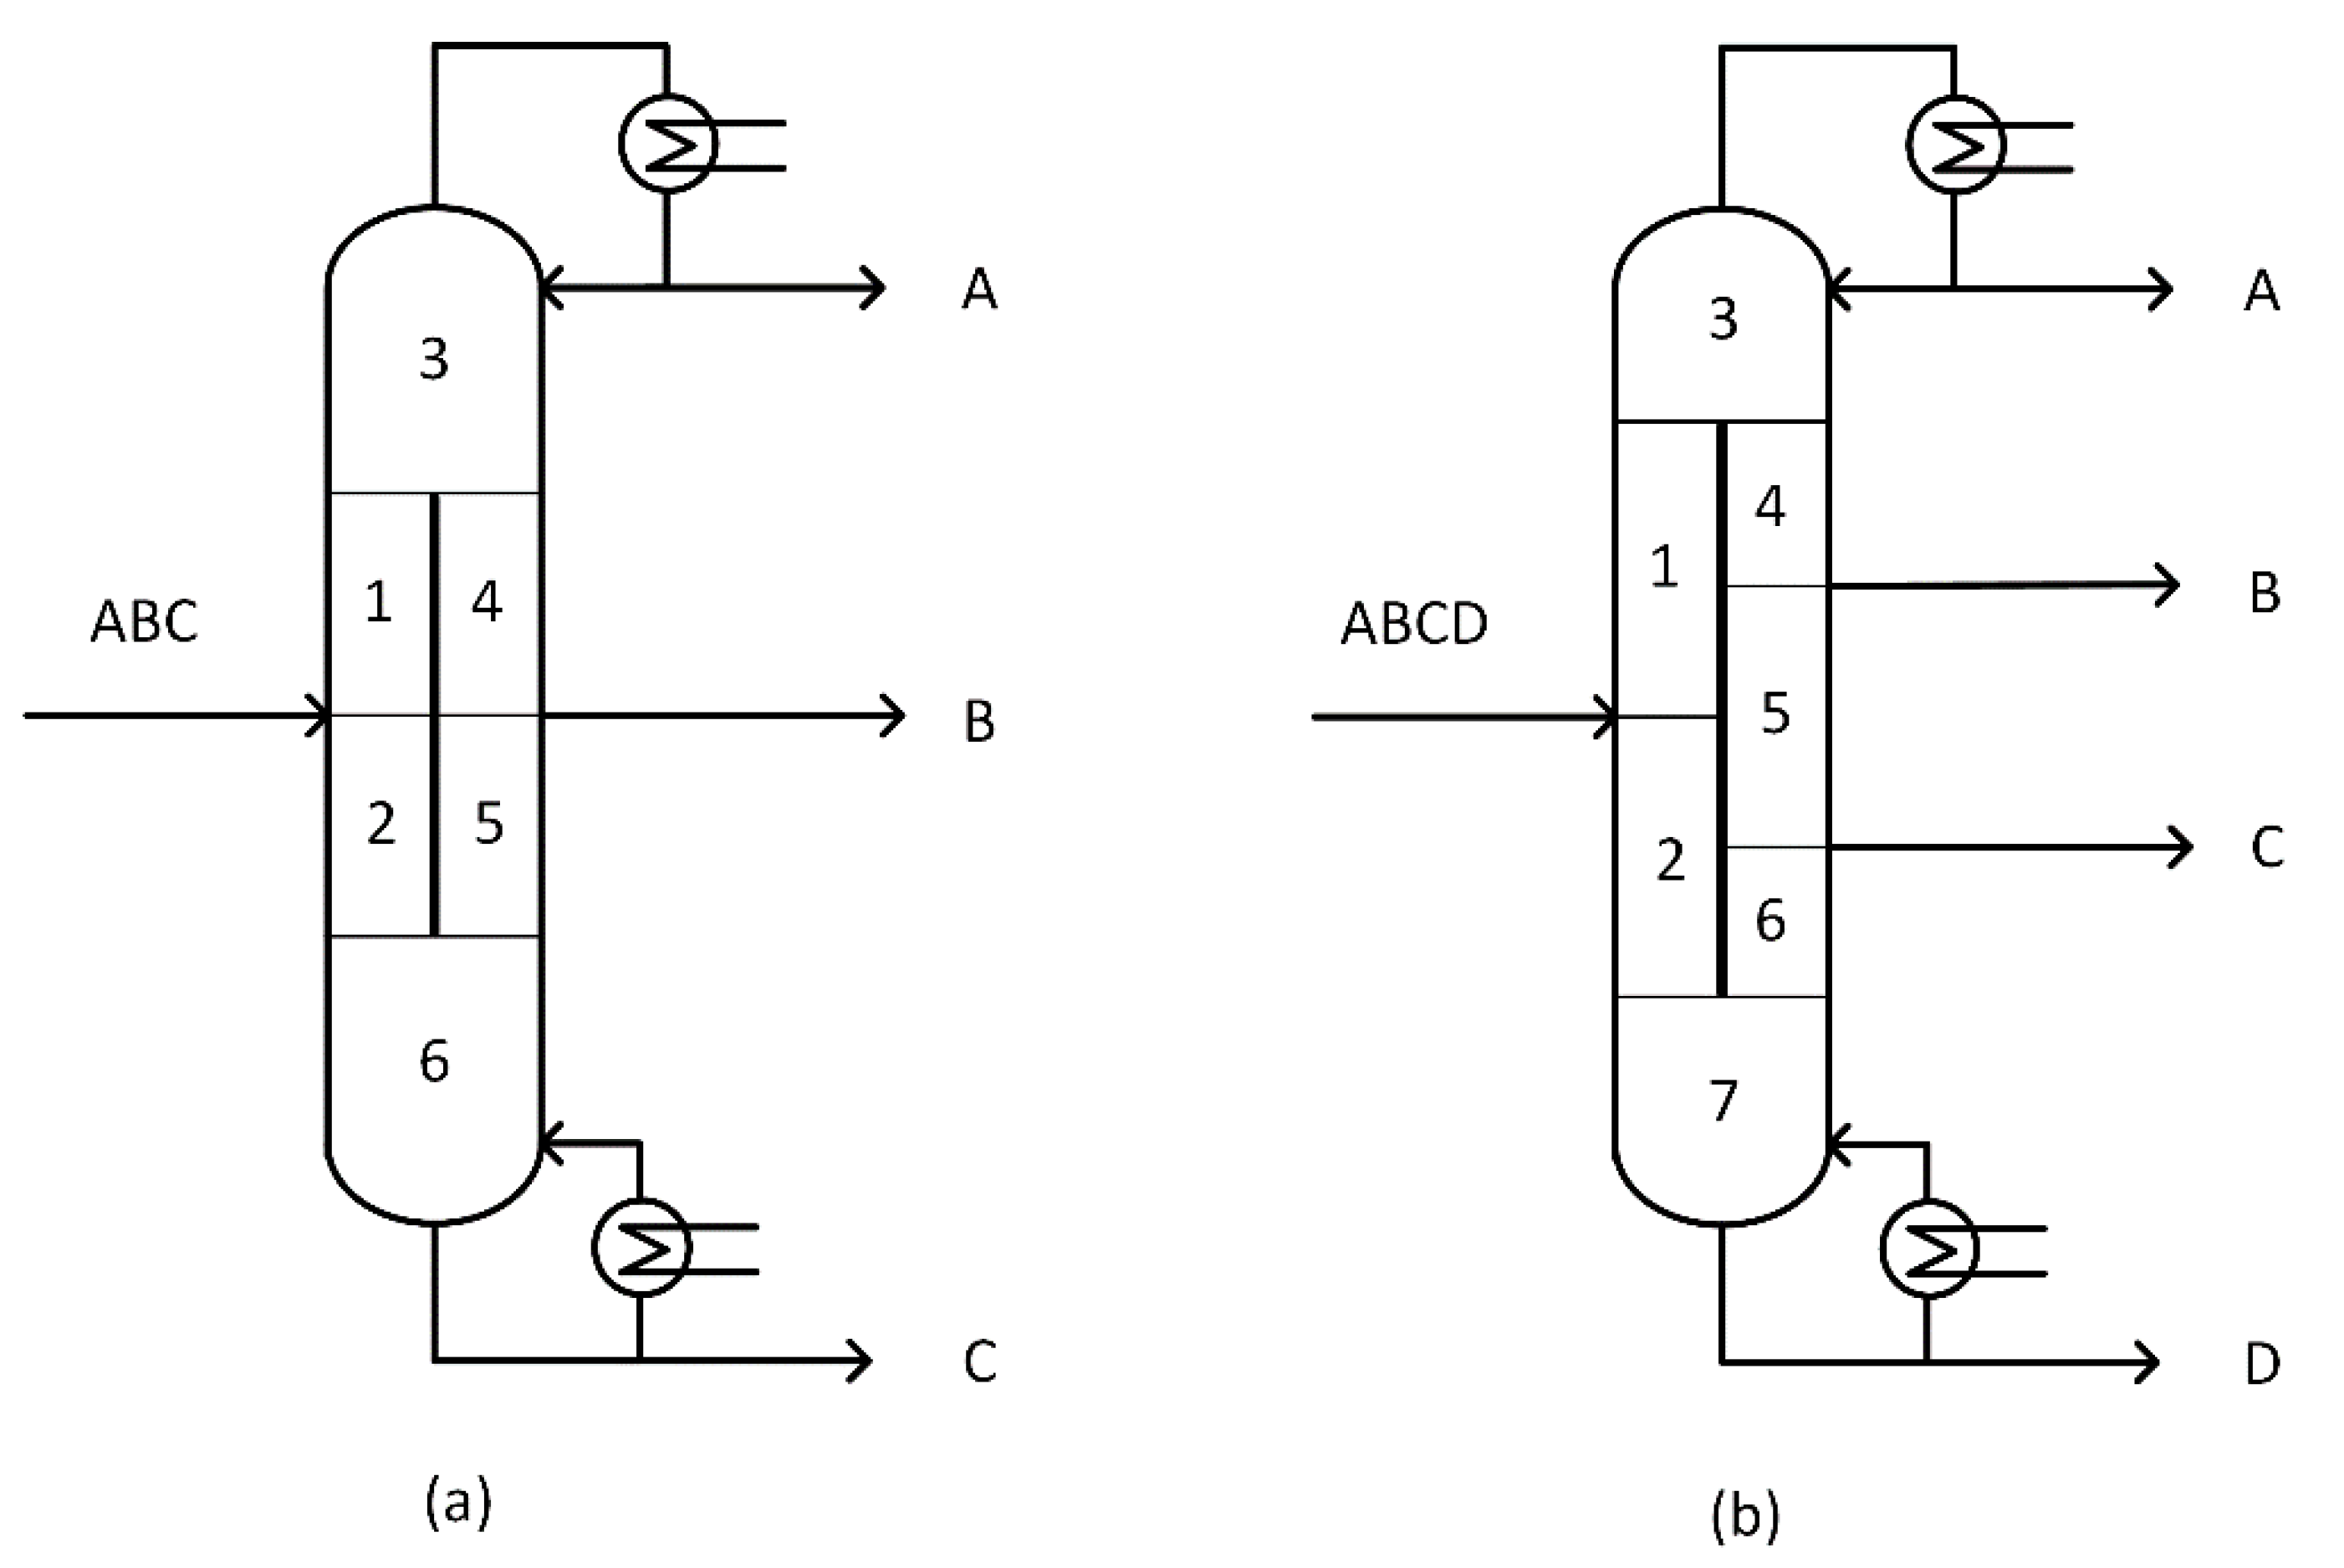
Distillation is, to this day, the most common thermal separation technology applied in many different branches of the industry. Besides the often-required flexibility to separate different feed mixtures, one of the much-desired properties of distillation columns is also higher efficiency in terms of energy usage. A possible way to improve the energy efficiency for the separation of a ternary mixture is the application of a Dividing Wall Column (DWC). A DWC is a three-product column in which the feed side (prefractionator) is separated from the side-draw side (main fractionator) by a partitioning wall (
Figure 1a). DWCs reduce the remixing effects and, therefore, the increase of mixing entropy, which ultimately leads to an increased efficiency [
1]. Furthermore, only one column shell as well as one reboiler and one condenser are necessary to operate a DWC. Hence, savings of up to 30% in operating and investment costs are conceivable compared to conventional sequences of two-product columns, such as the direct split [
2,
3,
4]. DWC technology was studied extensively, which also led to several special applications like an extractive DWC [
5], an azeotropic DWC [
6], or a reactive DWC [
7]. Another version is a four-product DWC, also called the Kaibel Column (KC), that has already been built and operated [
8]. Compared to the DWC, the KC has an additional side draw located on the product side of the partitioning wall (see
Figure 1b). However, its drawback is that it cannot be operated in the thermodynamic optimum [
9].
Following the idea and principles of the DWC, the next obvious step in its evolution is the application of a multiple Dividing Wall Column (mDWC) with more than one partitioning wall inside the column shell, enabling the separation of a quaternary mixture into its pure components. Due to a higher level of integration, further savings of around 45–55% in comparison to conventional sequences [
10,
11] and 17–20% in comparison to the KC [
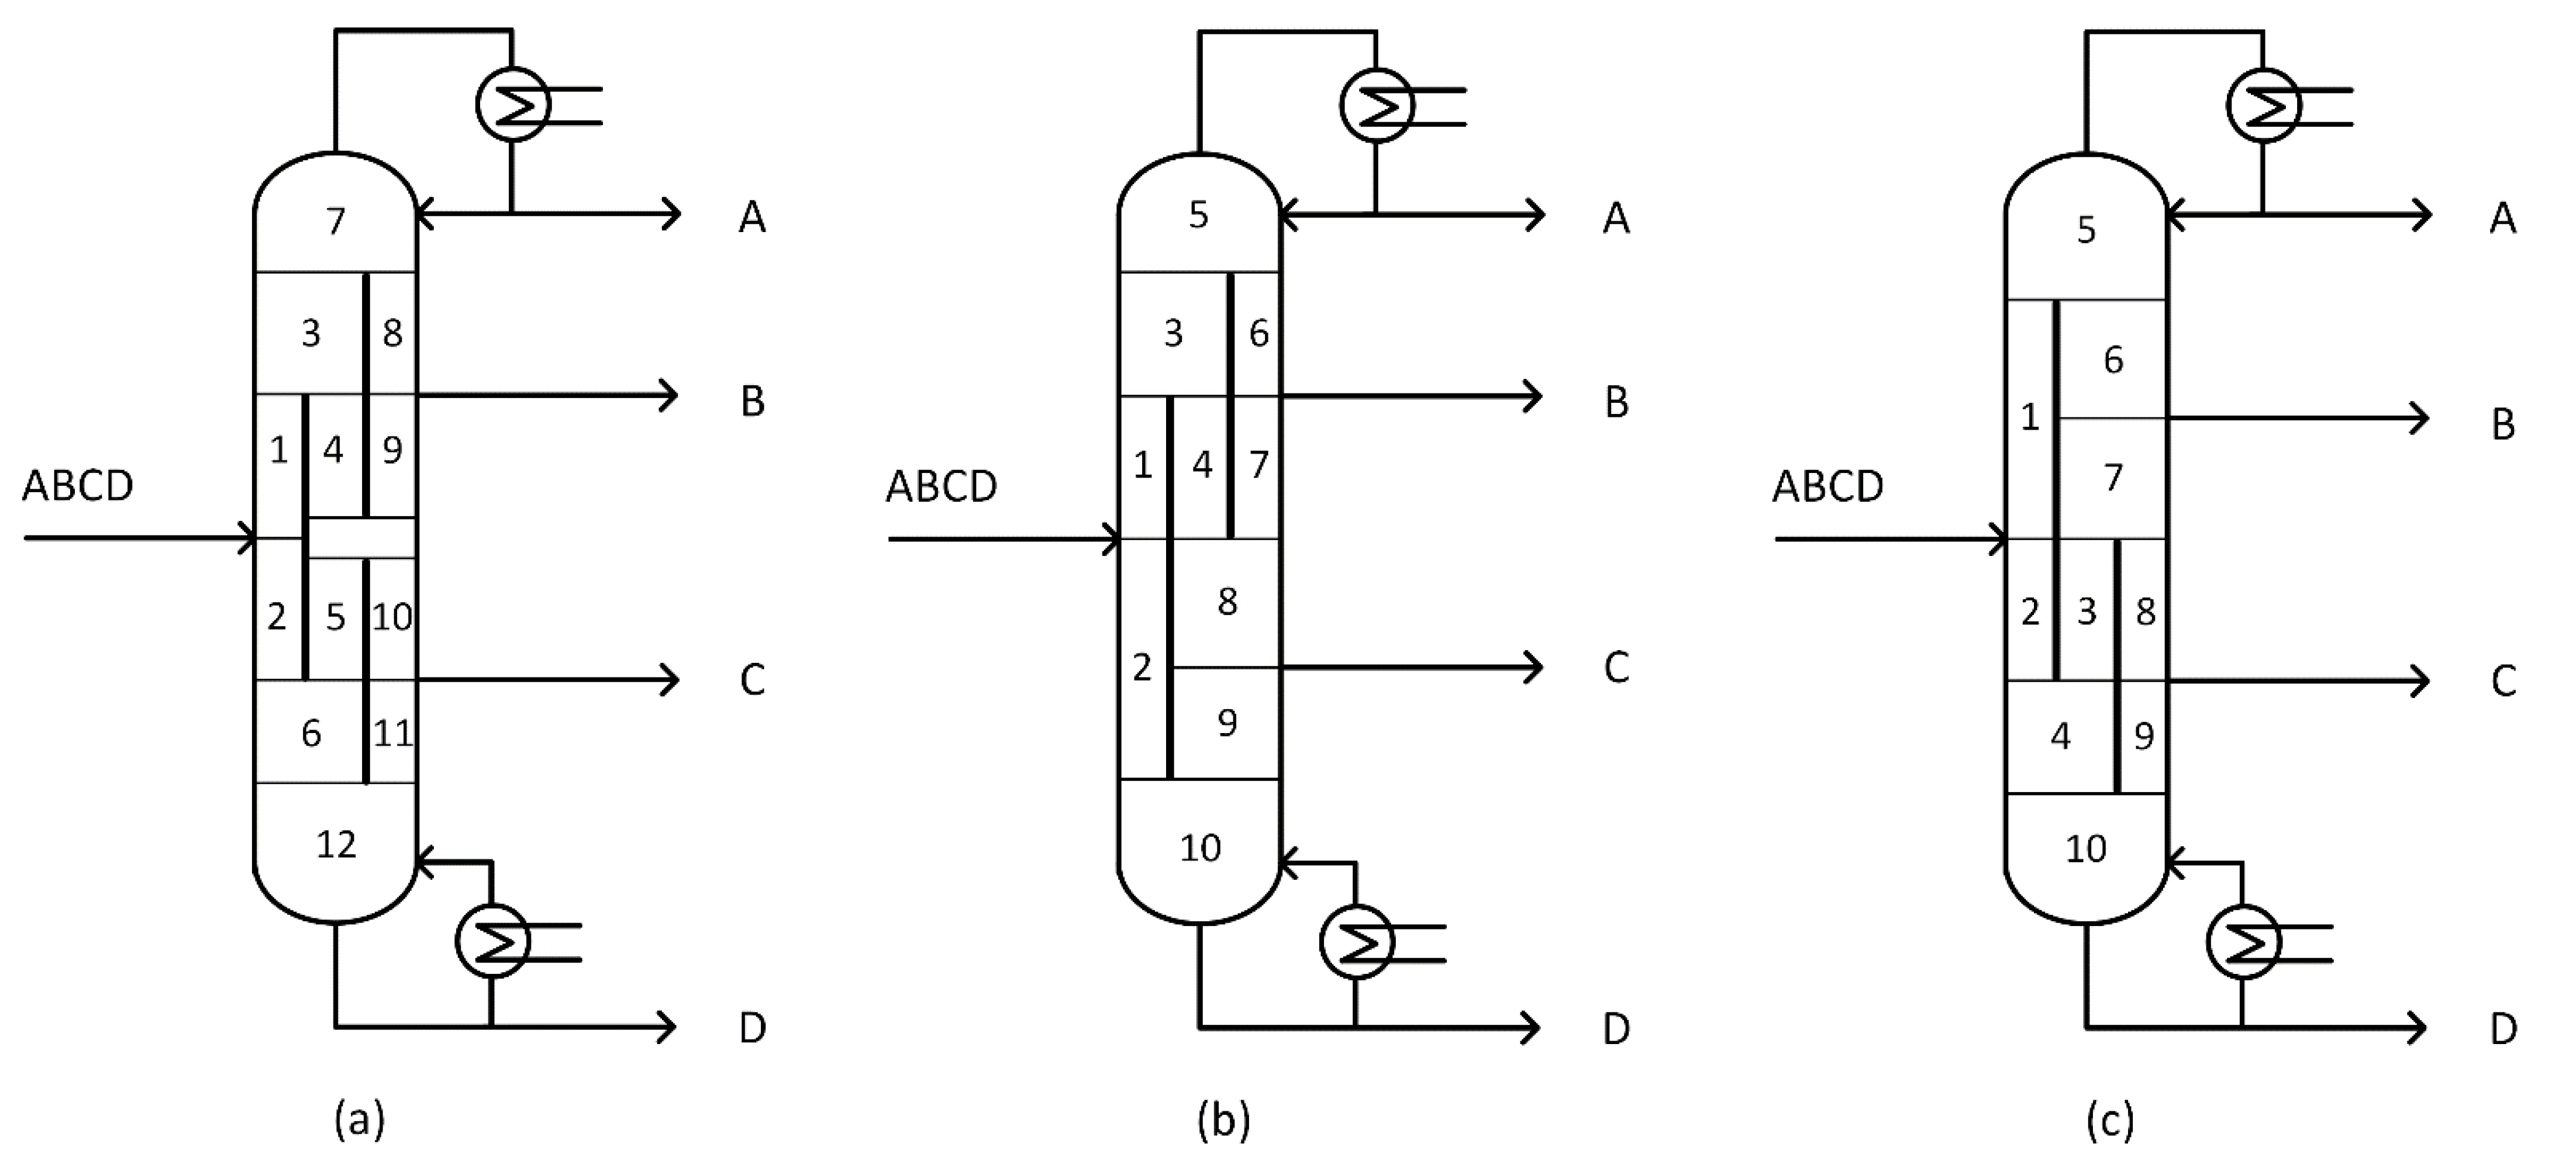
12] can be expected. The fully extended Petlyuk configuration, sometimes called a 2-3-4 configuration, is shown in
Figure 2a. Its configuration enables operation in a thermodynamic optimum for any zeotropic feed mixture [
9]. Since the 2-3-4 configuration with three partitioning walls and, therefore, three vapor and liquid splits, is very complex, applying constructional and operational simplifications is a good step toward its practical realization. An overview of possible simplifications of a four-product mDWC can be found in a work by Ge et al. [
13].
Two possible simplifications, the so-called 2-2-4-a and the 2-2-4-b configuration, are shown in
Figure 2b,c, respectively. The simplifications usually consist of a reduction of the number of partitioning walls within the column. This leads to fewer vapor and liquid splits, as well as fewer separation sections in the column. When a separation section is removed, another section has to perform its separation work. For example, if hypothetical key components ordered by decreasing volatility are denoted as A, B, C, and D, in the 2-3-4 configuration the prefractionator section performs the A/D separation. In the simplified 2-2-4-a configuration, the lower section of the middle fractionator is removed and the prefractionator has to perform the B/D separation [
14]. On the other hand, for the simplified 2-2-4-b configuration, the upper section of the middle fractionator is removed and the prefractionator has to carry out the A/D separation. In certain cases, depending on the feed mixture, this can lead to an increased energy demand compared to the 2-3-4 configuration [
15]. Nevertheless, the 2-2-4-a configuration has been evaluated by several different groups [
10,
12,
15,
16,
17] for a large number of feed mixtures and has been determined as the best candidate for implementation, since in most cases it combines both the operation at the thermodynamic optimum as well as a lower complexity compared to the 2-3-4 configuration. However, there is no report in the open literature that a mDWC has been built and operated to this day. Therefore, the target of the Laboratory of Thermal Process Engineering at Ulm University is to build and operate the first mDWC worldwide, in order to validate existing theoretical investigations with experimental data.
In order to maintain defined states in a column, the application of control structures ensuring a stable operation even during unavoidable fluctuations is mandatory. Since control structures for distillation columns have been extensively studied, there are many different methods available to design them. In the following section, a brief literature review concerning control of distillation columns with a focus on mDWCs is presented.
Control structures for two-product columns were extensively studied and will not be further discussed here [
18,
19,
20]. An overview of different control structures for three-product DWCs can be found in works by Kiss et al. [
21] and Yildirim et al. [
22]. Furthermore, different control structures for a three-product DWC were investigated theoretically and then validated using a pilot plant by Buck et al. [
23]. Most importantly, industrial-scale, three-product DWCs control structures have been verified during operation [
5,
24,
25].
DWCs have several additional degrees of freedom compared to conventional distillation columns due to their structure—one liquid and one vapor split per each installed wall. While the control of the liquid split during operation can easily be implemented via liquid collectors and distributors, vapor split control is significantly more complicated. Nevertheless, laboratory studies of vapor split control have been reported, utilizing vapor throttling by valves [
26] or by a specially designed tray installed at the bottom of a partitioning wall [
27,
28]. In principle, the control of the vapor split as an additional degree of freedom is very advantageous, as the adjustment of the vapor split under disturbances is necessary in order to maintain the optimal operating point. However, industrial studies of the active vapor split control have not been reported yet. Other studies have shown that the liquid split above the partitioning wall should be used to control the heavy key impurity in the top of the prefractionator because all heavy impurities carried over the wall will inevitably end up in the side draw [
29,
30]. Composition control can usually be realized via temperature control loops since the composition of a mixture can be directly related to the temperature.
Besides three-product DWCs, work on the control of the four-product Kaibel column has already been reported. Qian et al. investigated three different control structures based on temperature and composition control for the Kaibel column [
31]. Even though there are some steady-state deviations for the temperature-based control structure, the dynamic performance is superior to the other control structures [
31]. In another study, Strandberg and Skogestad investigated two temperature-based control structures by means of dynamic simulation for a Kaibel laboratory column and found that for each separation performed in the column a control loop is needed to avoid drift of the profile [
32]. Fan et al. confirmed this result by comparing a three-point control structure with fixed vapor and liquid splits with two four-point control structures with either controlled liquid split or controlled vapor split for the Kaibel column [
33]. Dwivedi et al. applied a four-point control structure to a laboratory Kaibel column and carried out 13 different experiments to verify that a stable operation of the column is possible and that the equilibrium stage model can be applied to simulate complex distillation columns [
34].
In addition, some publications on the control of mDWCs are already available. However, since there is no existing plant, all publications to date are purely theoretical studies. Dviwedi et al. studied four different control structures for the 2-3-4 configuration that are either composition based, temperature based, or composition–temperature cascade control structures. In their study, they used vapor splits as degrees of freedom to control the light key components at the bottom of the prefractionator and the middle fractionator, respectively. They found that a pure, temperature-based control scheme with fixed set points is insufficient to handle feed composition changes. Therefore, they suggest using a composition–temperature cascade controller, as then the set point of the temperature controller adapts to the new, required set point [
35].
Qian et al. studied the control of the 2-3-4 configuration by the investigation of three different control structures with fixed vapor splits. They used a pure temperature-based control structure, a pure temperature-difference-based control structure, and a mixed pressure-compensated temperature and temperature-difference control structure. In their study, they found that, due to the non-sharp splits in the prefractionator and the middle fractionator, the temperature could not be accurately related to the composition of the mixture, as there was at least one distributing component. Therefore, the temperature-based control structure is not suitable to control the 2-3-4 configuration and they suggested to rather use the temperature-difference or the pressure-compensated temperature-difference control structure [
36]. In another study, they investigated the 2-3-4 configuration with a pure temperature-based control structure, a mixed temperature and temperature-difference control structure, and a mixed temperature and double temperature-difference control structure. Additionally, in this study the vapor splits were fixed and the authors proved that a pure temperature-based control structure is insufficient for the 2-3-4 configuration and suggested to apply either the temperature-difference or the double temperature difference control structure [
37].
Lukač et al. investigated an industrial case of the 2-2-4-a configuration applied in a reformate fractionation complex in a refinery by dynamic simulation. They tested three different control structures: a pure temperature control structure, a mixed temperature and temperature-difference control structure, and a mixed temperature and temperature-difference control structure with two additional composition controllers. They found that a pure temperature control structure is insufficient to control the 2-2-4-a configuration and suggested to rather use the mixed temperature and temperature-difference control structure [
38].
A pilot plant mDWC that in future will be realized as a 2-2-4-a configuration at Ulm University was investigated by means of dynamic simulation from Preißinger et al. Taking into account the limitations that arise from the pilot plant design, they investigated three different control structures, which were a solely temperature control structure and two mixed temperature and temperature-difference control structures. Their study showed that all three control structures were capable of controlling the column during fluctuations, while one of the mixed control structures was superior to the others [
39].
Although a pure temperature-based control for the Kaibel column leads to good results, this cannot always be confirmed for mDWCs. Here, pure temperature-based control seems to be insufficient in most cases. This can be remedied by using temperature difference controllers or double temperature difference controllers, as well as composition controllers. Composition control, however, is not very practicable because it is expensive and causes long response times, especially in industrial applications.
The purpose of this work was to demonstrate that a feasible mDWC with an existing design is capable of reliably separating different feed mixtures without needing a revamp. Therefore, control structures were designed to handle separation of different feed mixtures, under limitations imposed by the plant design. The aim was to prove that, after the introduction of various disturbances, product specifications can be maintained and the column can be brought back to a stable operating state.
3. Control Structures’ Design
This section describes how the control structures were designed for the respective mixtures. Special attention was paid to implementing simple control structures, i.e., with as few controllers as possible. As already mentioned in the introduction, at least one control loop was required for each separation performed in the column [
32]. Since five separations were performed in the 2-2-4-a configuration, five control loops were required. First, the temperature stages used for the control had to be determined via Singular Value Decomposition (SVD). Afterwards, the interactions between the control loops were investigated by means of Relative Gain Array (RGA) analysis. Finally, the control structures as well as the initial operating points were presented.
Since different mixtures were separated, the control structures needed to be adjusted in terms of temperature control points’ location for every case. The different feed mixtures were taken from a previous work [
15] and are listed in
Table 1. The choice of these mixtures is explained subsequently. For these mixtures, the binary VLEs were also checked against literature data from the DDB and a regression was performed where necessary.
In a previous publication [
15], the pilot plant design was reported based on
Vmin diagrams for seven equimolar zeotropic mixtures favoring the 2-2-4-a configuration [
40,
41,
42]. This means that for all these mixtures the split requiring the most energy was the split between the two heaviest key components, C/D, and that the difference between energy requirement for A/B and C/D split was high enough that required
Vmin was maintained when the prefracionator was operated to perform sharp B/D split. Out of those seven mixtures, three were selected to test the flexibility of the most favorable control system, also previously reported [
39], with the fixed column geometry. The optimal
V/
F steady-state values for the required splits are presented in
Table 2.
Vmin/
F denotes the overall energy requirement for the separation in the mDWC with a practically infinite number of theoretical stages, expressed as the vapor flow rate at the bottom of the main fractionator.
VPFB/
F denotes the vapor flowrate required at the bottom of the prefractionator, while
VMFB/
F denotes the vapor flowrate needed at the bottom of the middle fractionator. These values presented a significant enough range of operating conditions to demonstrate the ability of the proposed control system to handle different feed mixtures.
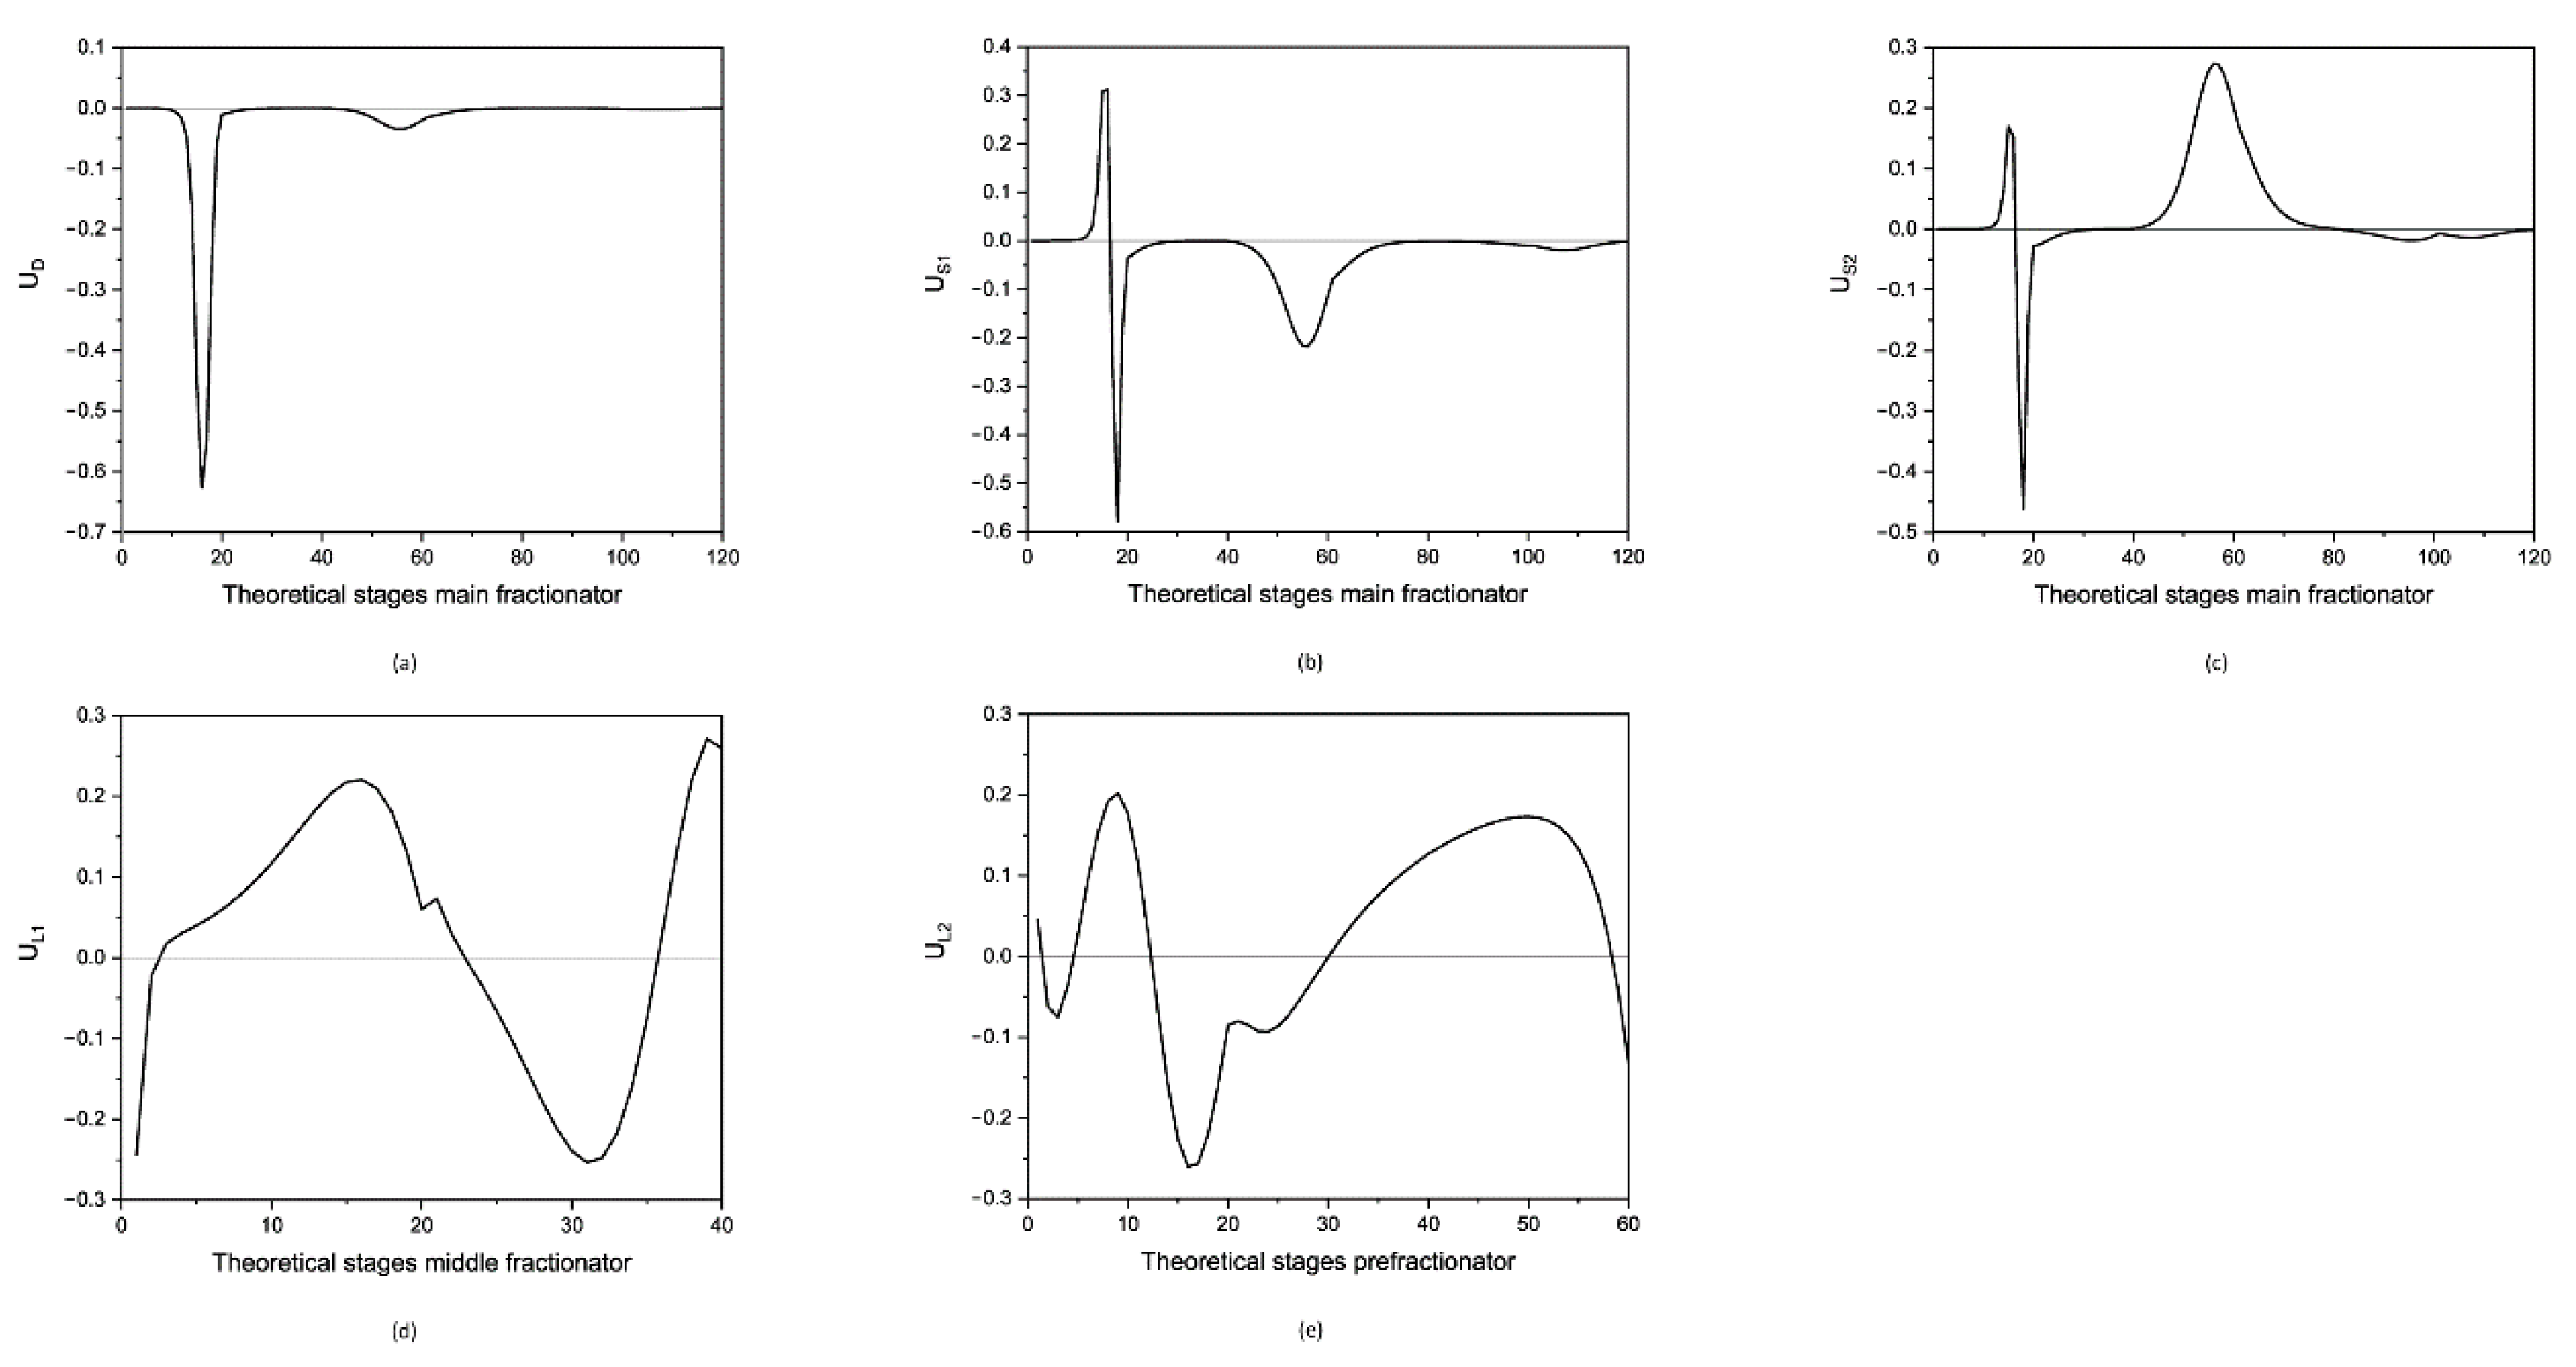
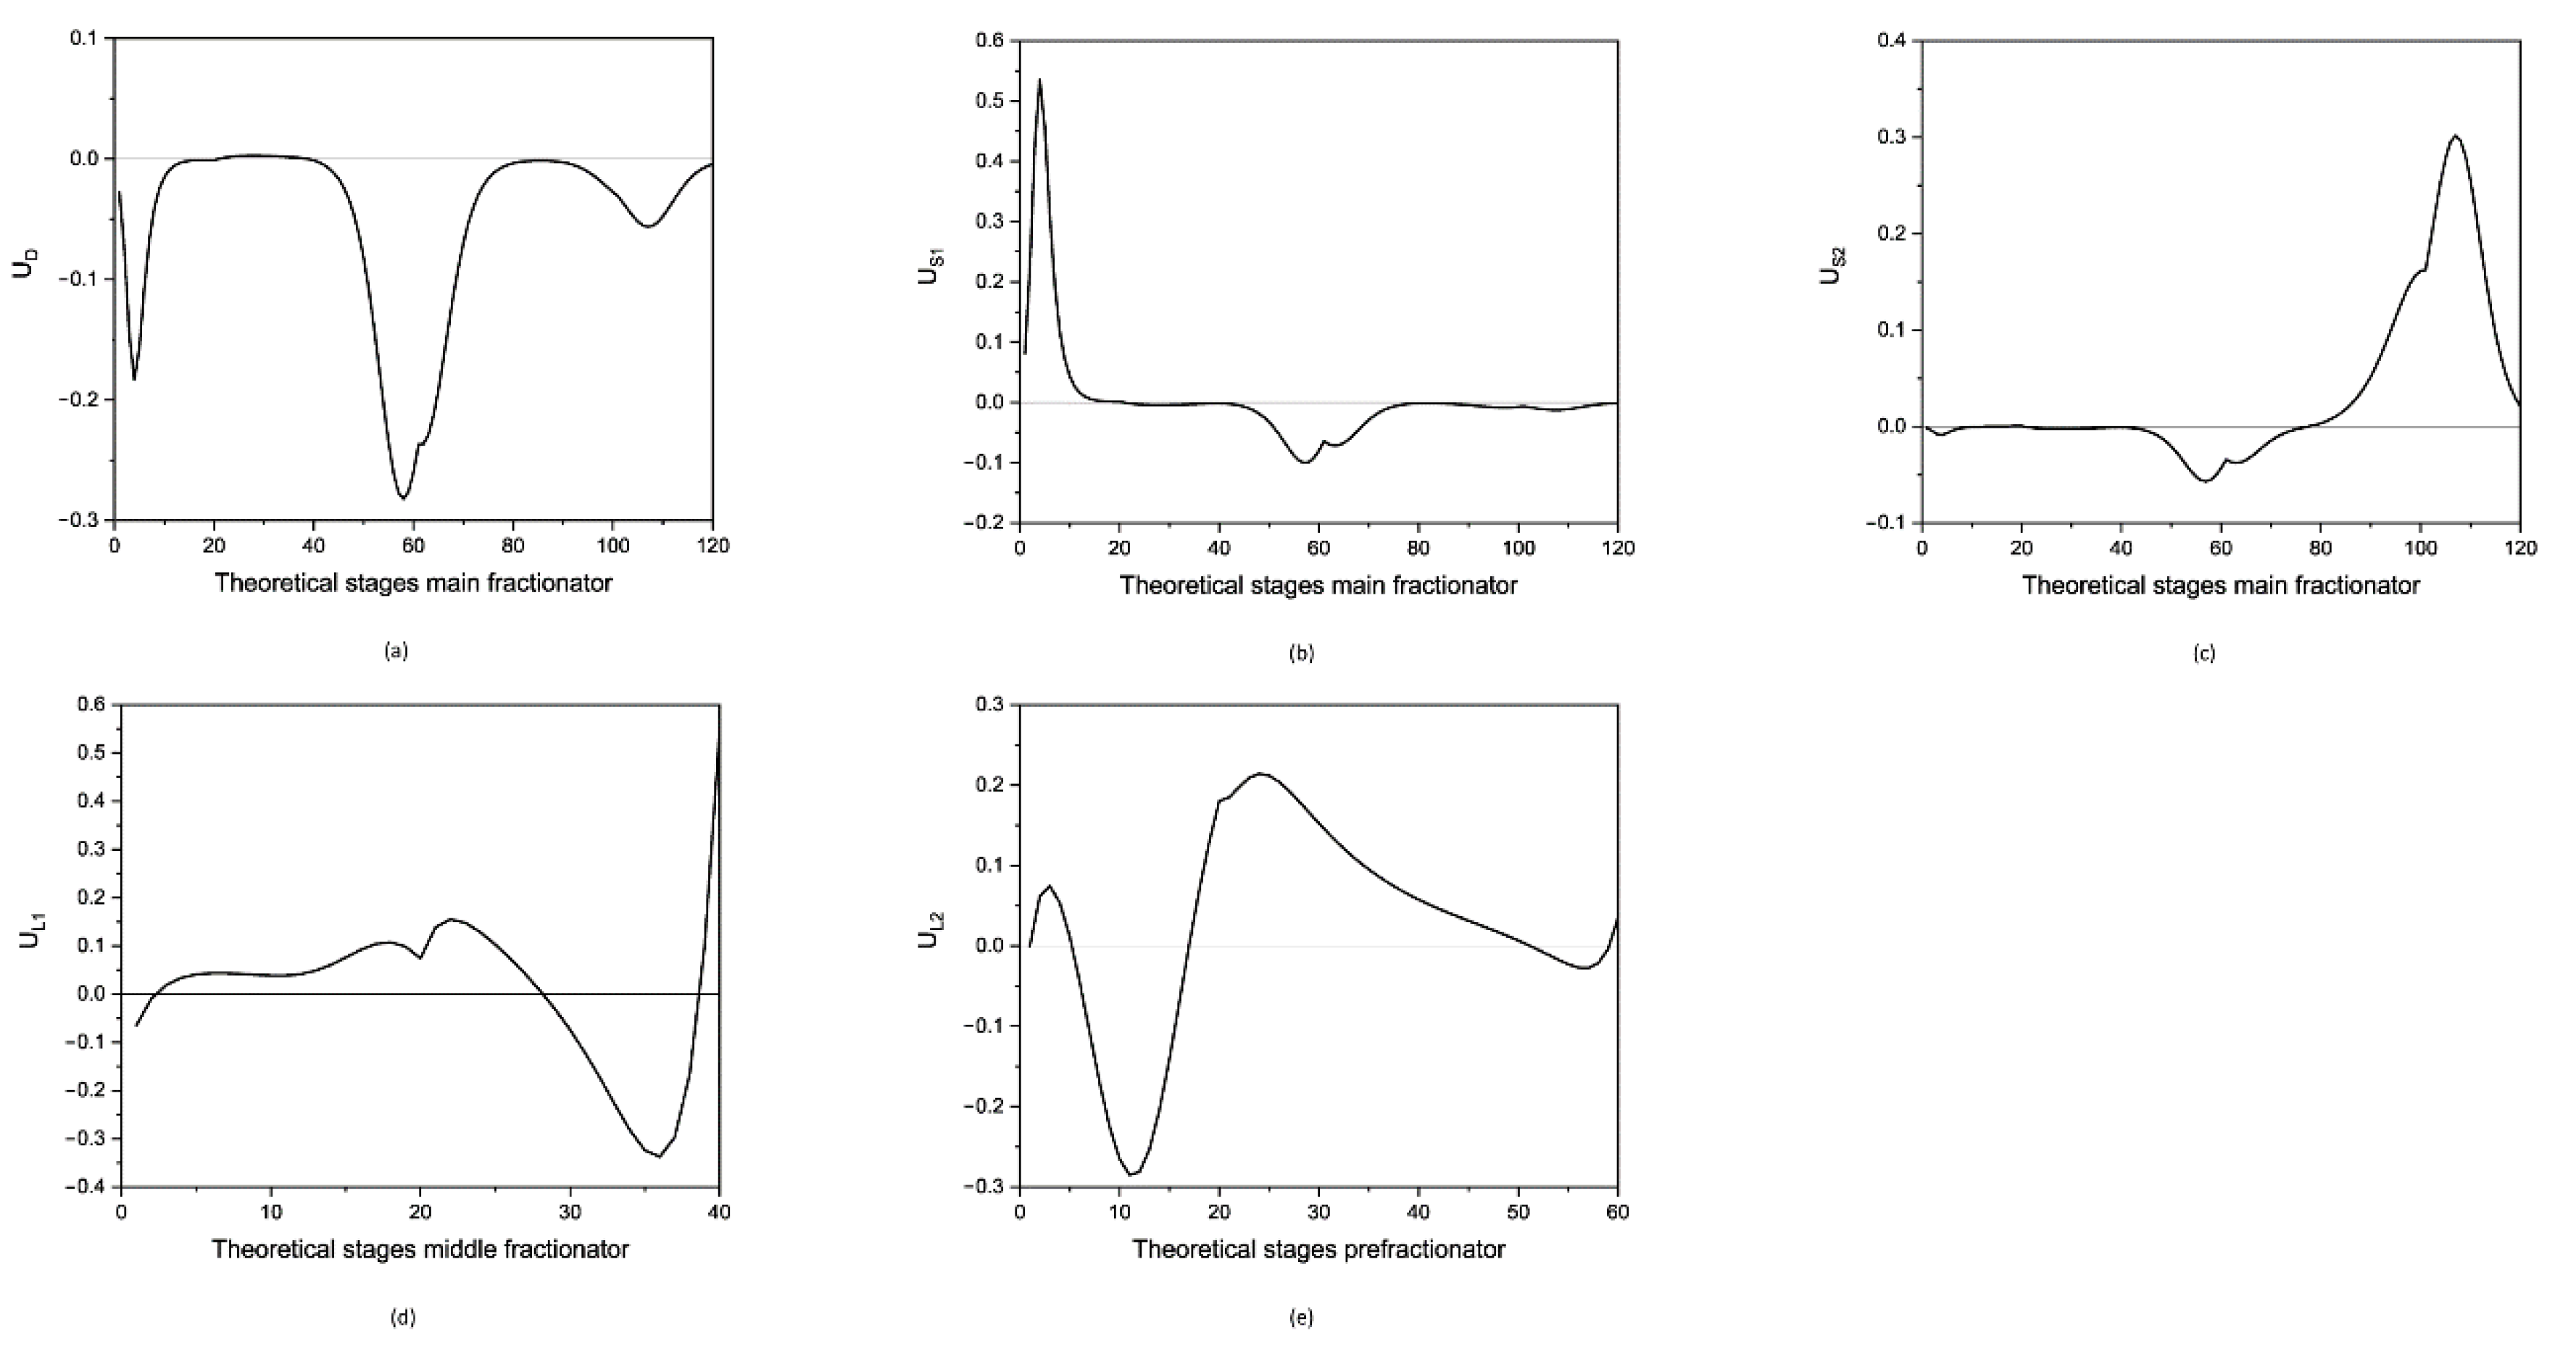
3.1. Singular Value Decomposition Analysis
In order to determine sensitive stages for available manipulated variables, the SVD analysis was carried out [
43,
44]. A comprehensive explanation of the SVD analysis can be found in work by Moore [
45]. When performing SVD analysis, the gains matrix is decomposed into three new matrices. The decomposition was carried out in Matlab
® (MathWorks Inc., Natick, MA, USA). The gains matrices were generated by performing sensitivity analyses of the respective manipulated variables, in this case, the distillate flow rate (
), the side draw 1 flow rate (
), the side draw 2 flow rate (
), liquid split 1 (
), liquid split 2 (
), and the reboiler duty (
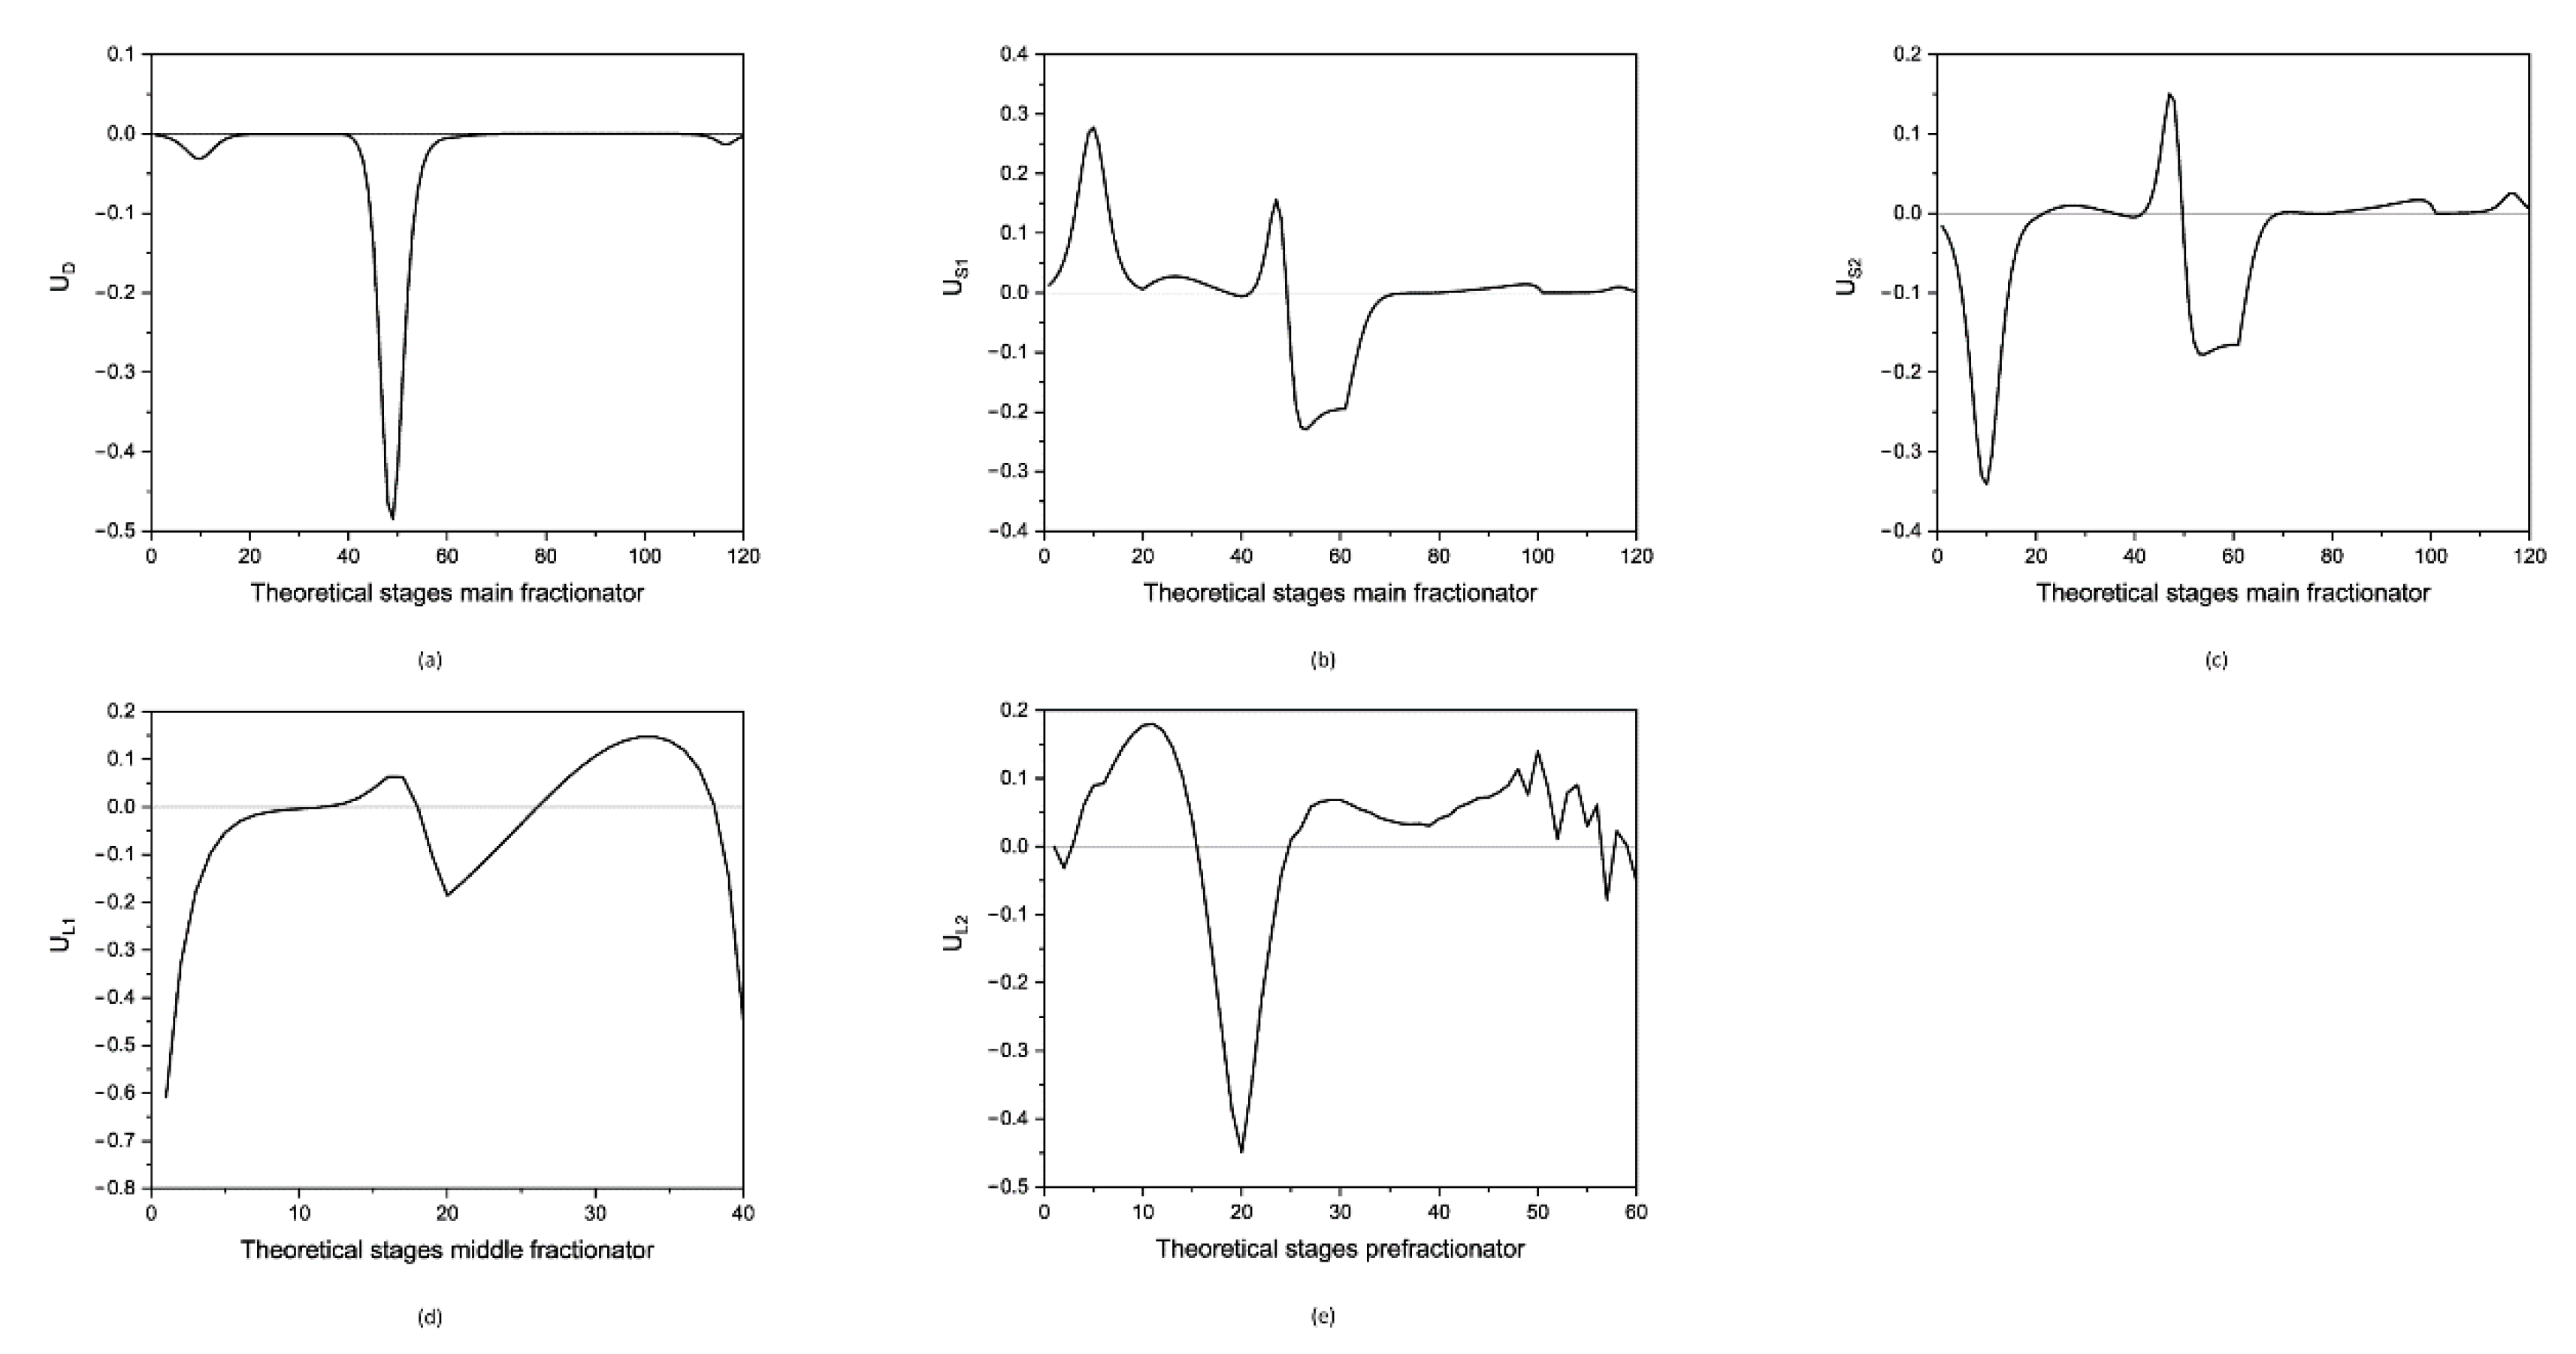
) in all three subcolumns (prefractionator, middle fractionator, and main fractionator). For this purpose, a small disturbance (0.1%) was introduced in the manipulated variables. Note that only the relevant results in the respective columns are displayed in
Figure 4,
Figure 5 and
Figure 6.
The most important matrix for the selection of the sensitive temperature stages is the U matrix [
46]. For temperature controllers, the highest amplitude stage in the U matrix should be selected. For temperature-difference controllers, a stage with the highest amplitude and a stage with an amplitude of zero should be selected. Note that the optimal stages for temperature control cannot always be selected as the temperature measurements are placed at every fifth theoretical stage and a stage in the vicinity has to be selected, as explained in
Section 2. Additionally, the controlled and manipulated variables should be close to each other to avoid long response times [
47]. The resulting stages for the temperature and temperature-difference control loops are shown in
Table 3.
3.2. Relative Gain Array Analysis
RGA analysis shows how strong the interactions between the control loops are. A comprehensive description of the RGA analysis can be found in [
48]. For the RGA analysis, as for the SVD analysis, the open loop gain matrix is required. However, for the RGA analysis, only the selected stages for temperature control are considered, which is why a 5 × 5 matrix was considered in the present case. The steady-state RGA calculation was done in Matlab
®, and the results are presented in
Table 4,
Table 5 and
Table 6, where coupled control loops are marked by bold typeface.
In the RGA matrix, a value of 1 means there were no interactions with other control loops in the system and is, therefore, a desired value [
30]. Negative values and values much larger than 1 are to be avoided [
49]. In general, the coupled control loops for all three mixtures were relatively close to 1. However, some control loops, such as liquid split 1 in mixture 1, showed values larger than 1, indicating that interactions were not completely unavoidable. No better pairing of the control loops could be derived from the RGA matrices. Therefore, the RGA analysis proved the selection of the coupled control loops in the systems.
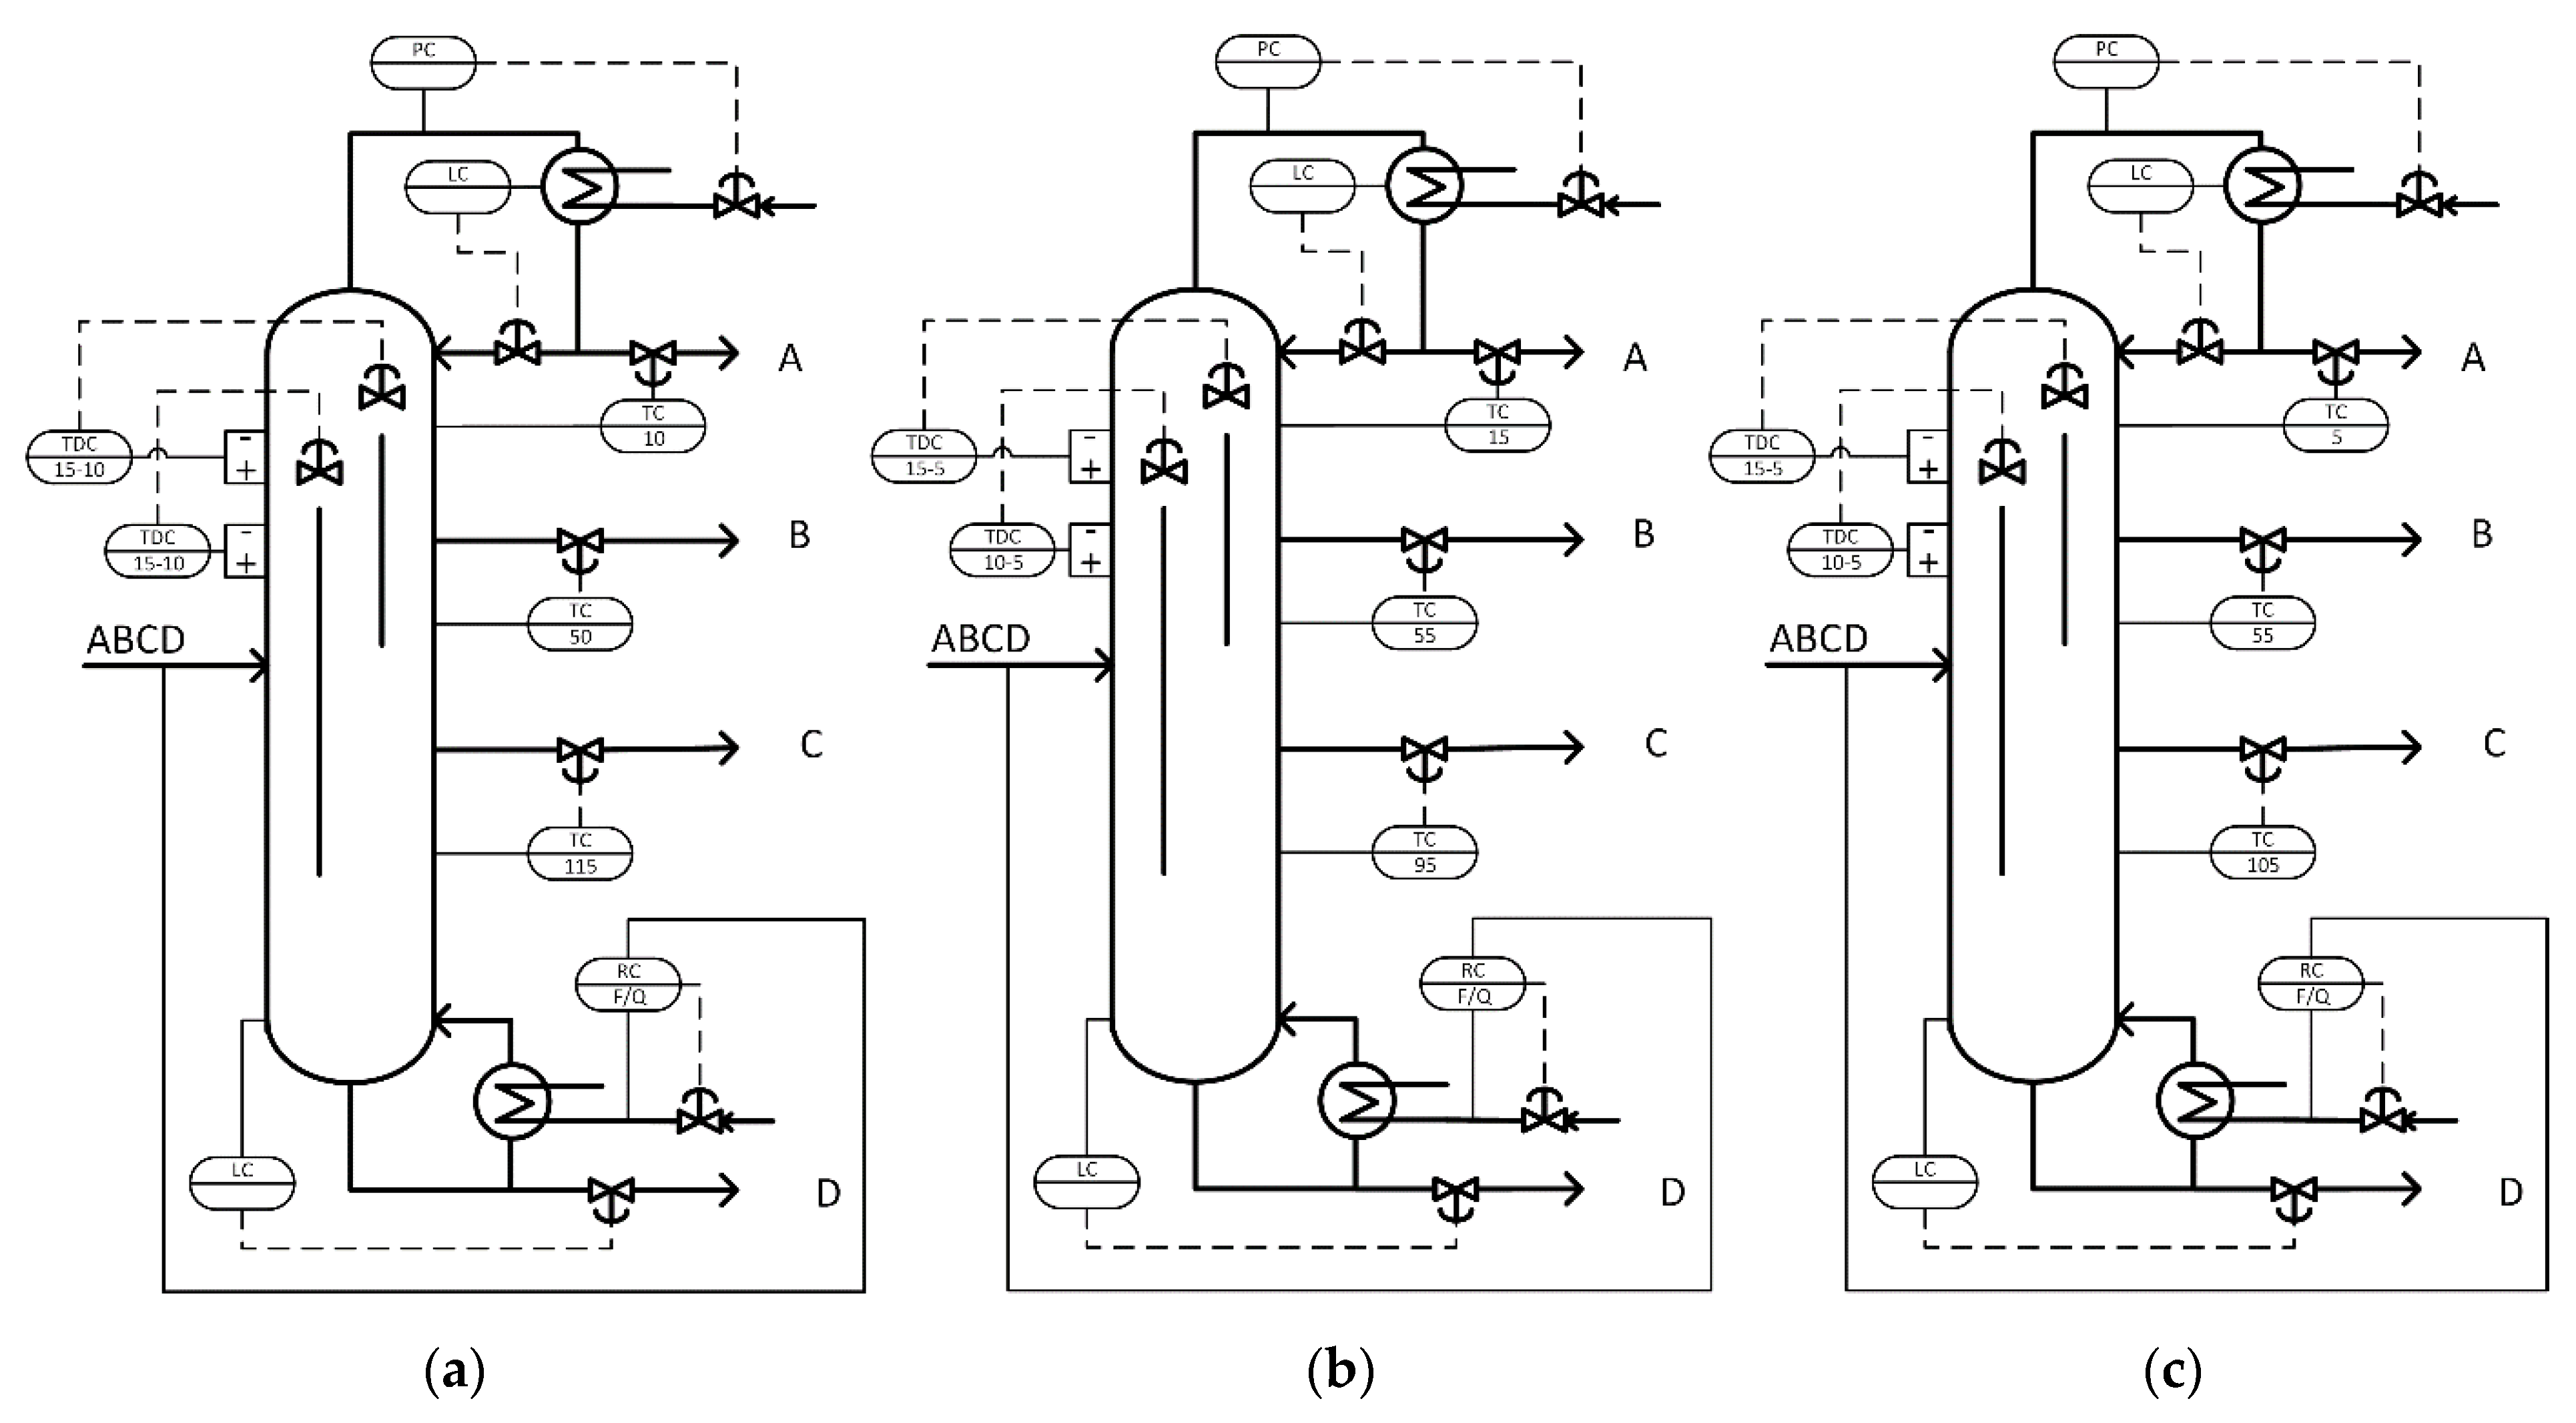
3.3. Resulting Control Structures and Initial Operating Points
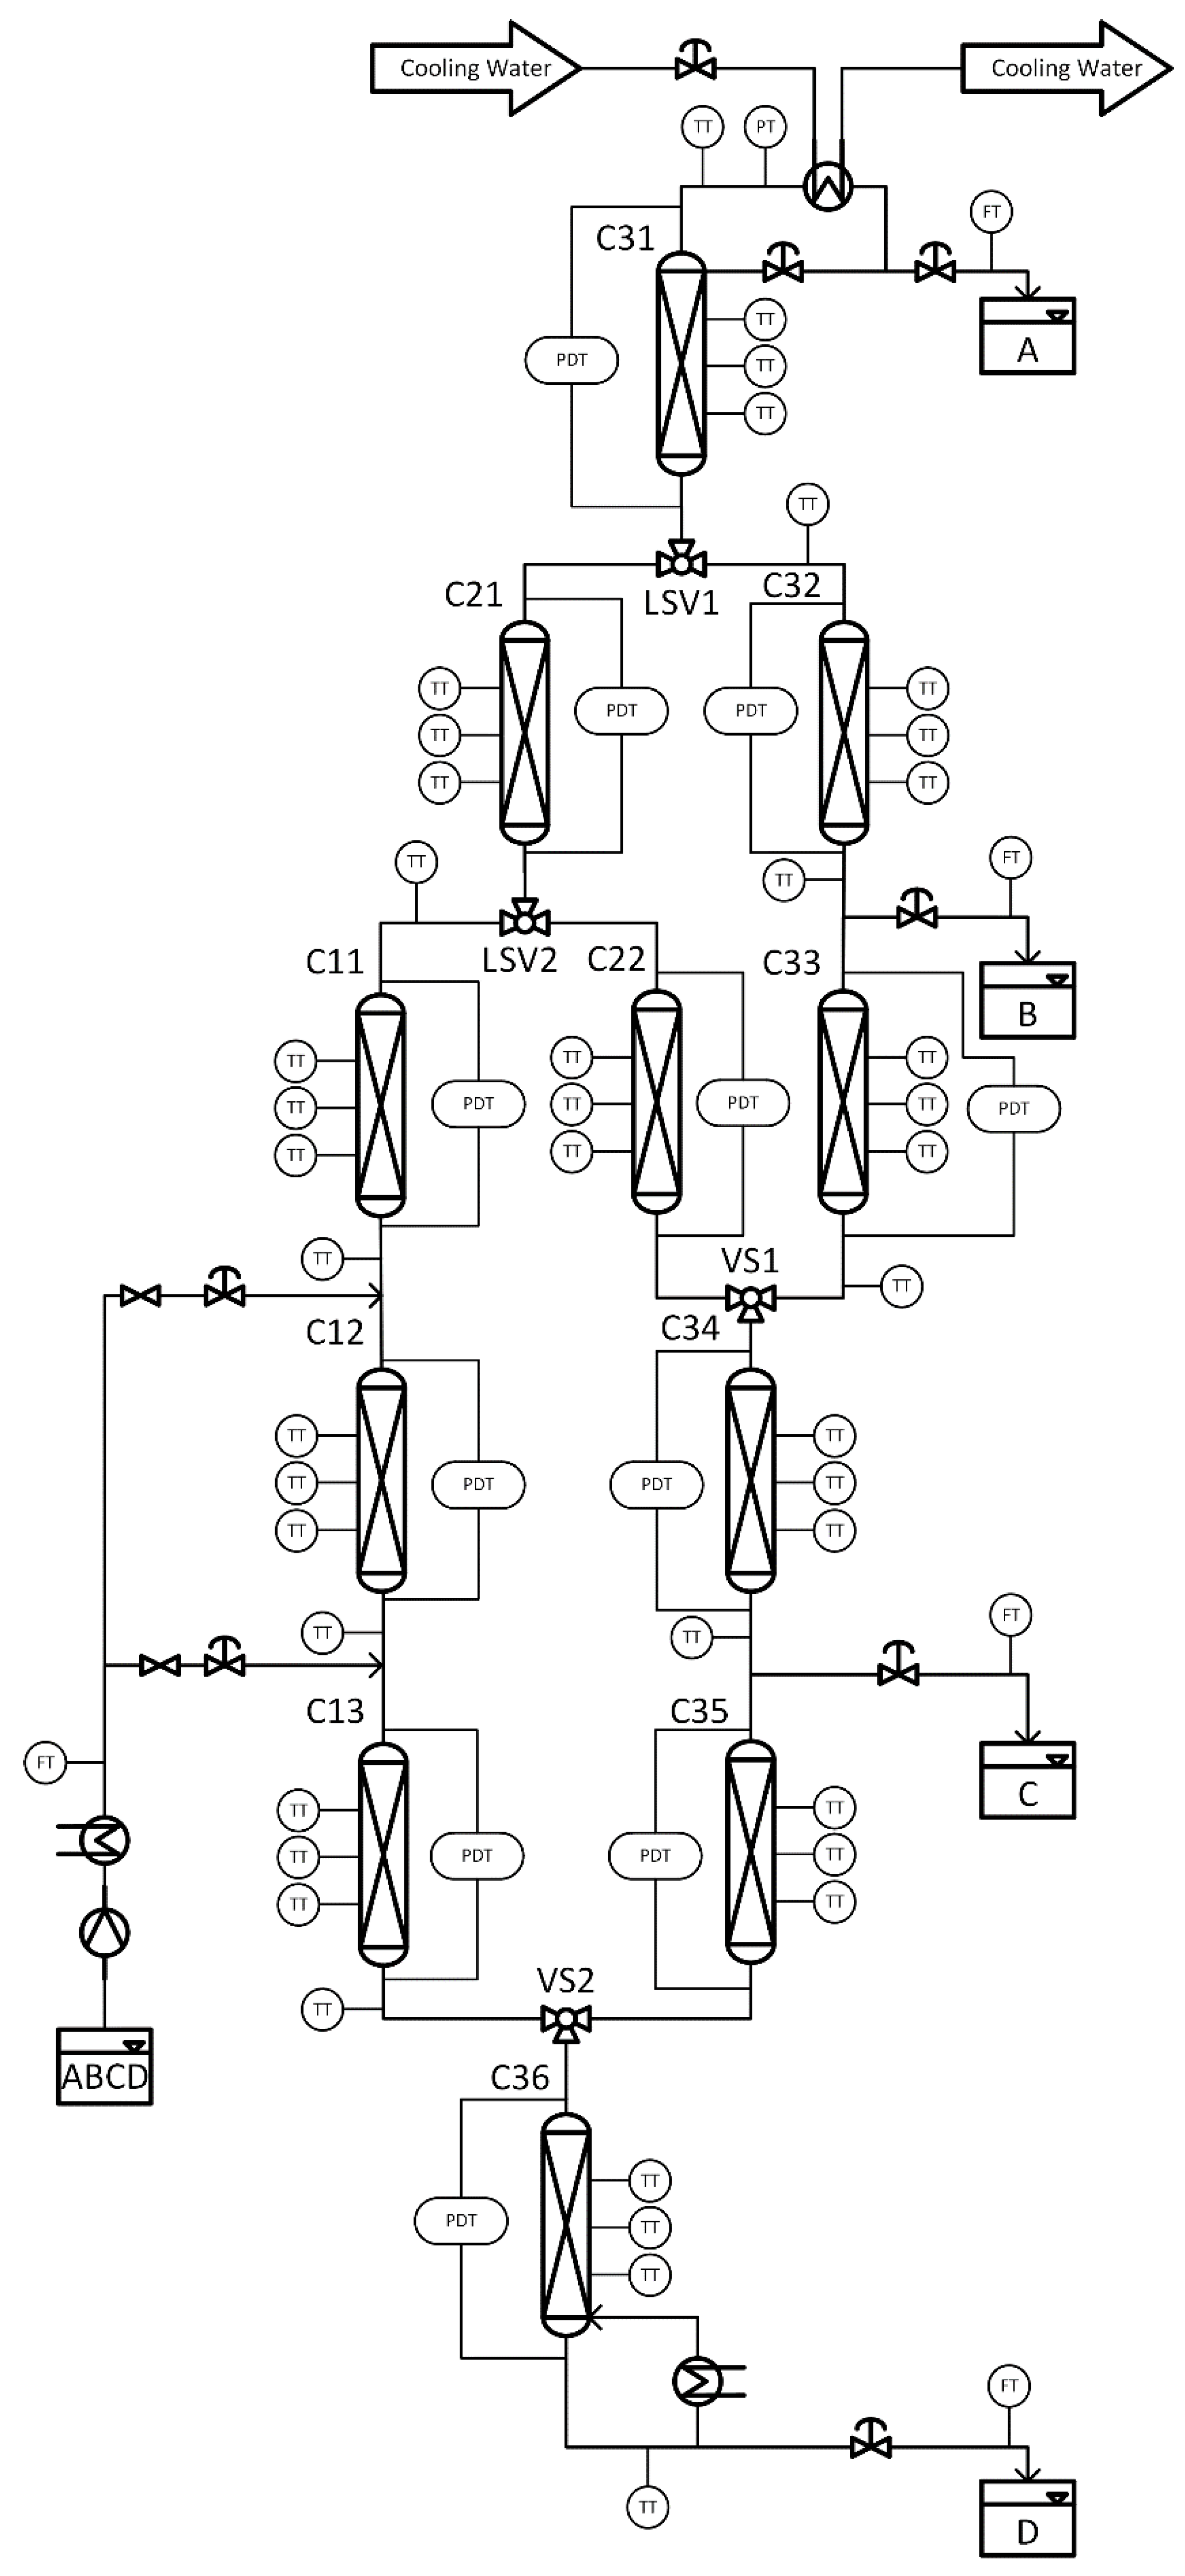
For visualization, the resulting control structures are displayed in
Figure 7. Note that in a previous publication [
39], this control structure was found to be the most appropriate one for the 2-2-4-a configuration. All applied controllers were PID controllers, while only the P and I actions were used. Tuning of the controllers was done by the autotuning function of Aspen Hysys©, which uses the approach of Tyreus and Luyben [
50]. Note that the only differences between the control structures were the selected temperature and temperature-difference control stages. Compared to a previous publication [
39], the control of the reboiler was adapted for this contribution. The original reboiler control was intended to keep the reflux-to-feed (
/
) ratio constant. However, since the reflux flowrate was not measured, this parameter could not be used for control. Therefore, the feed-to-reboiler-duty ratio (
/
) was used to control the reboiler in this contribution.
The optimization for the initial operating points (equimolar mixtures) was carried out in the equation-oriented mode in Aspen Hysys©, following an approach described in [
15].
Table 7 shows the optimized operating points for all mixtures. Note that the initial sets of vapor splits had to be slightly adapted to maintain the required purity of 98 mol% for all disturbance scenarios. The adaptation was performed with closed control loops, which subsequently also resulted in a slight change of the liquid splits. This was not a control engineering problem but solely optimization related. Studies have already been carried out on this topic for DWCs [
51,
52]. However, since the main focus of this paper was on the dynamic study of control structures for different feed mixtures, explaining the optimization problem here would exceed the scope of this contribution. The actual initial operating points used to evaluate dynamic performance are presented in
Table 8.
For each mixture in
Table 1 the investigated scenarios were composed of two feed mass flow disturbance cases (+/−10% scenarios 1 and 2) and six feed composition disturbance cases. In the feed composition disturbances, one component was increased by 5 mol% at a time, while another adjacent component was decreased by 5 mol% (compare
Table 9. This was done to increase the influence of the respective components on each other.
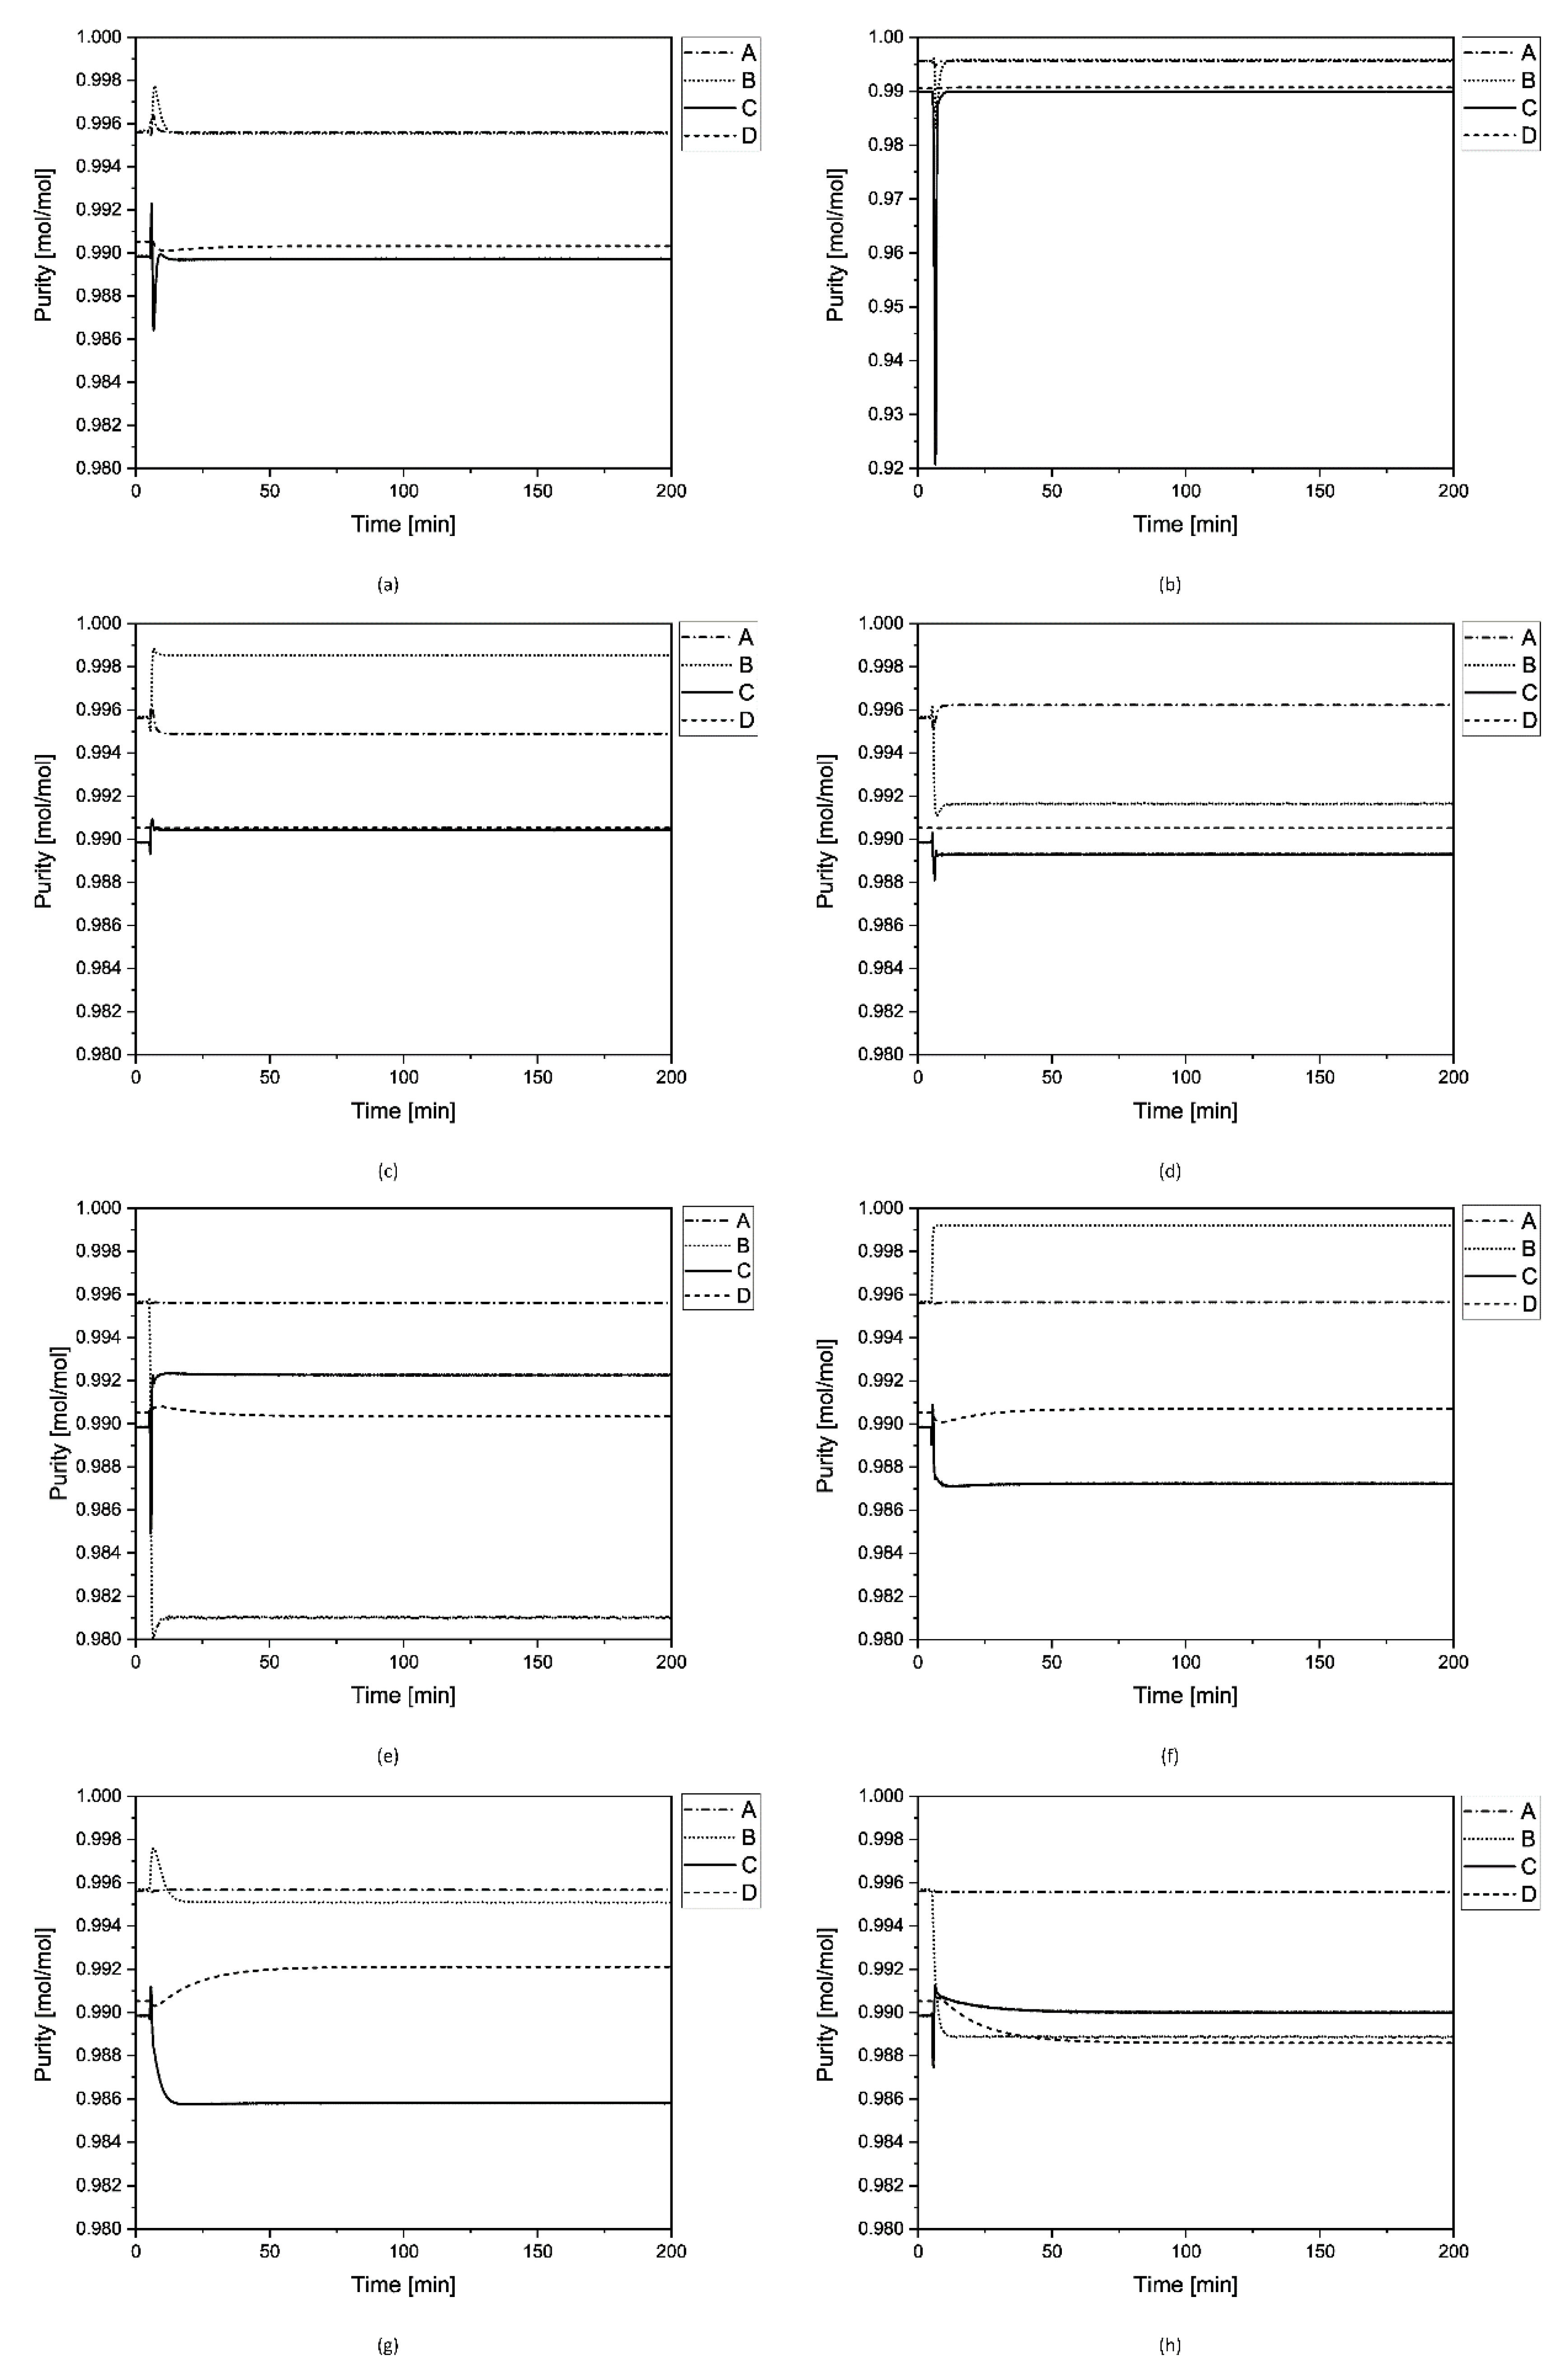
4. Results and Discussion
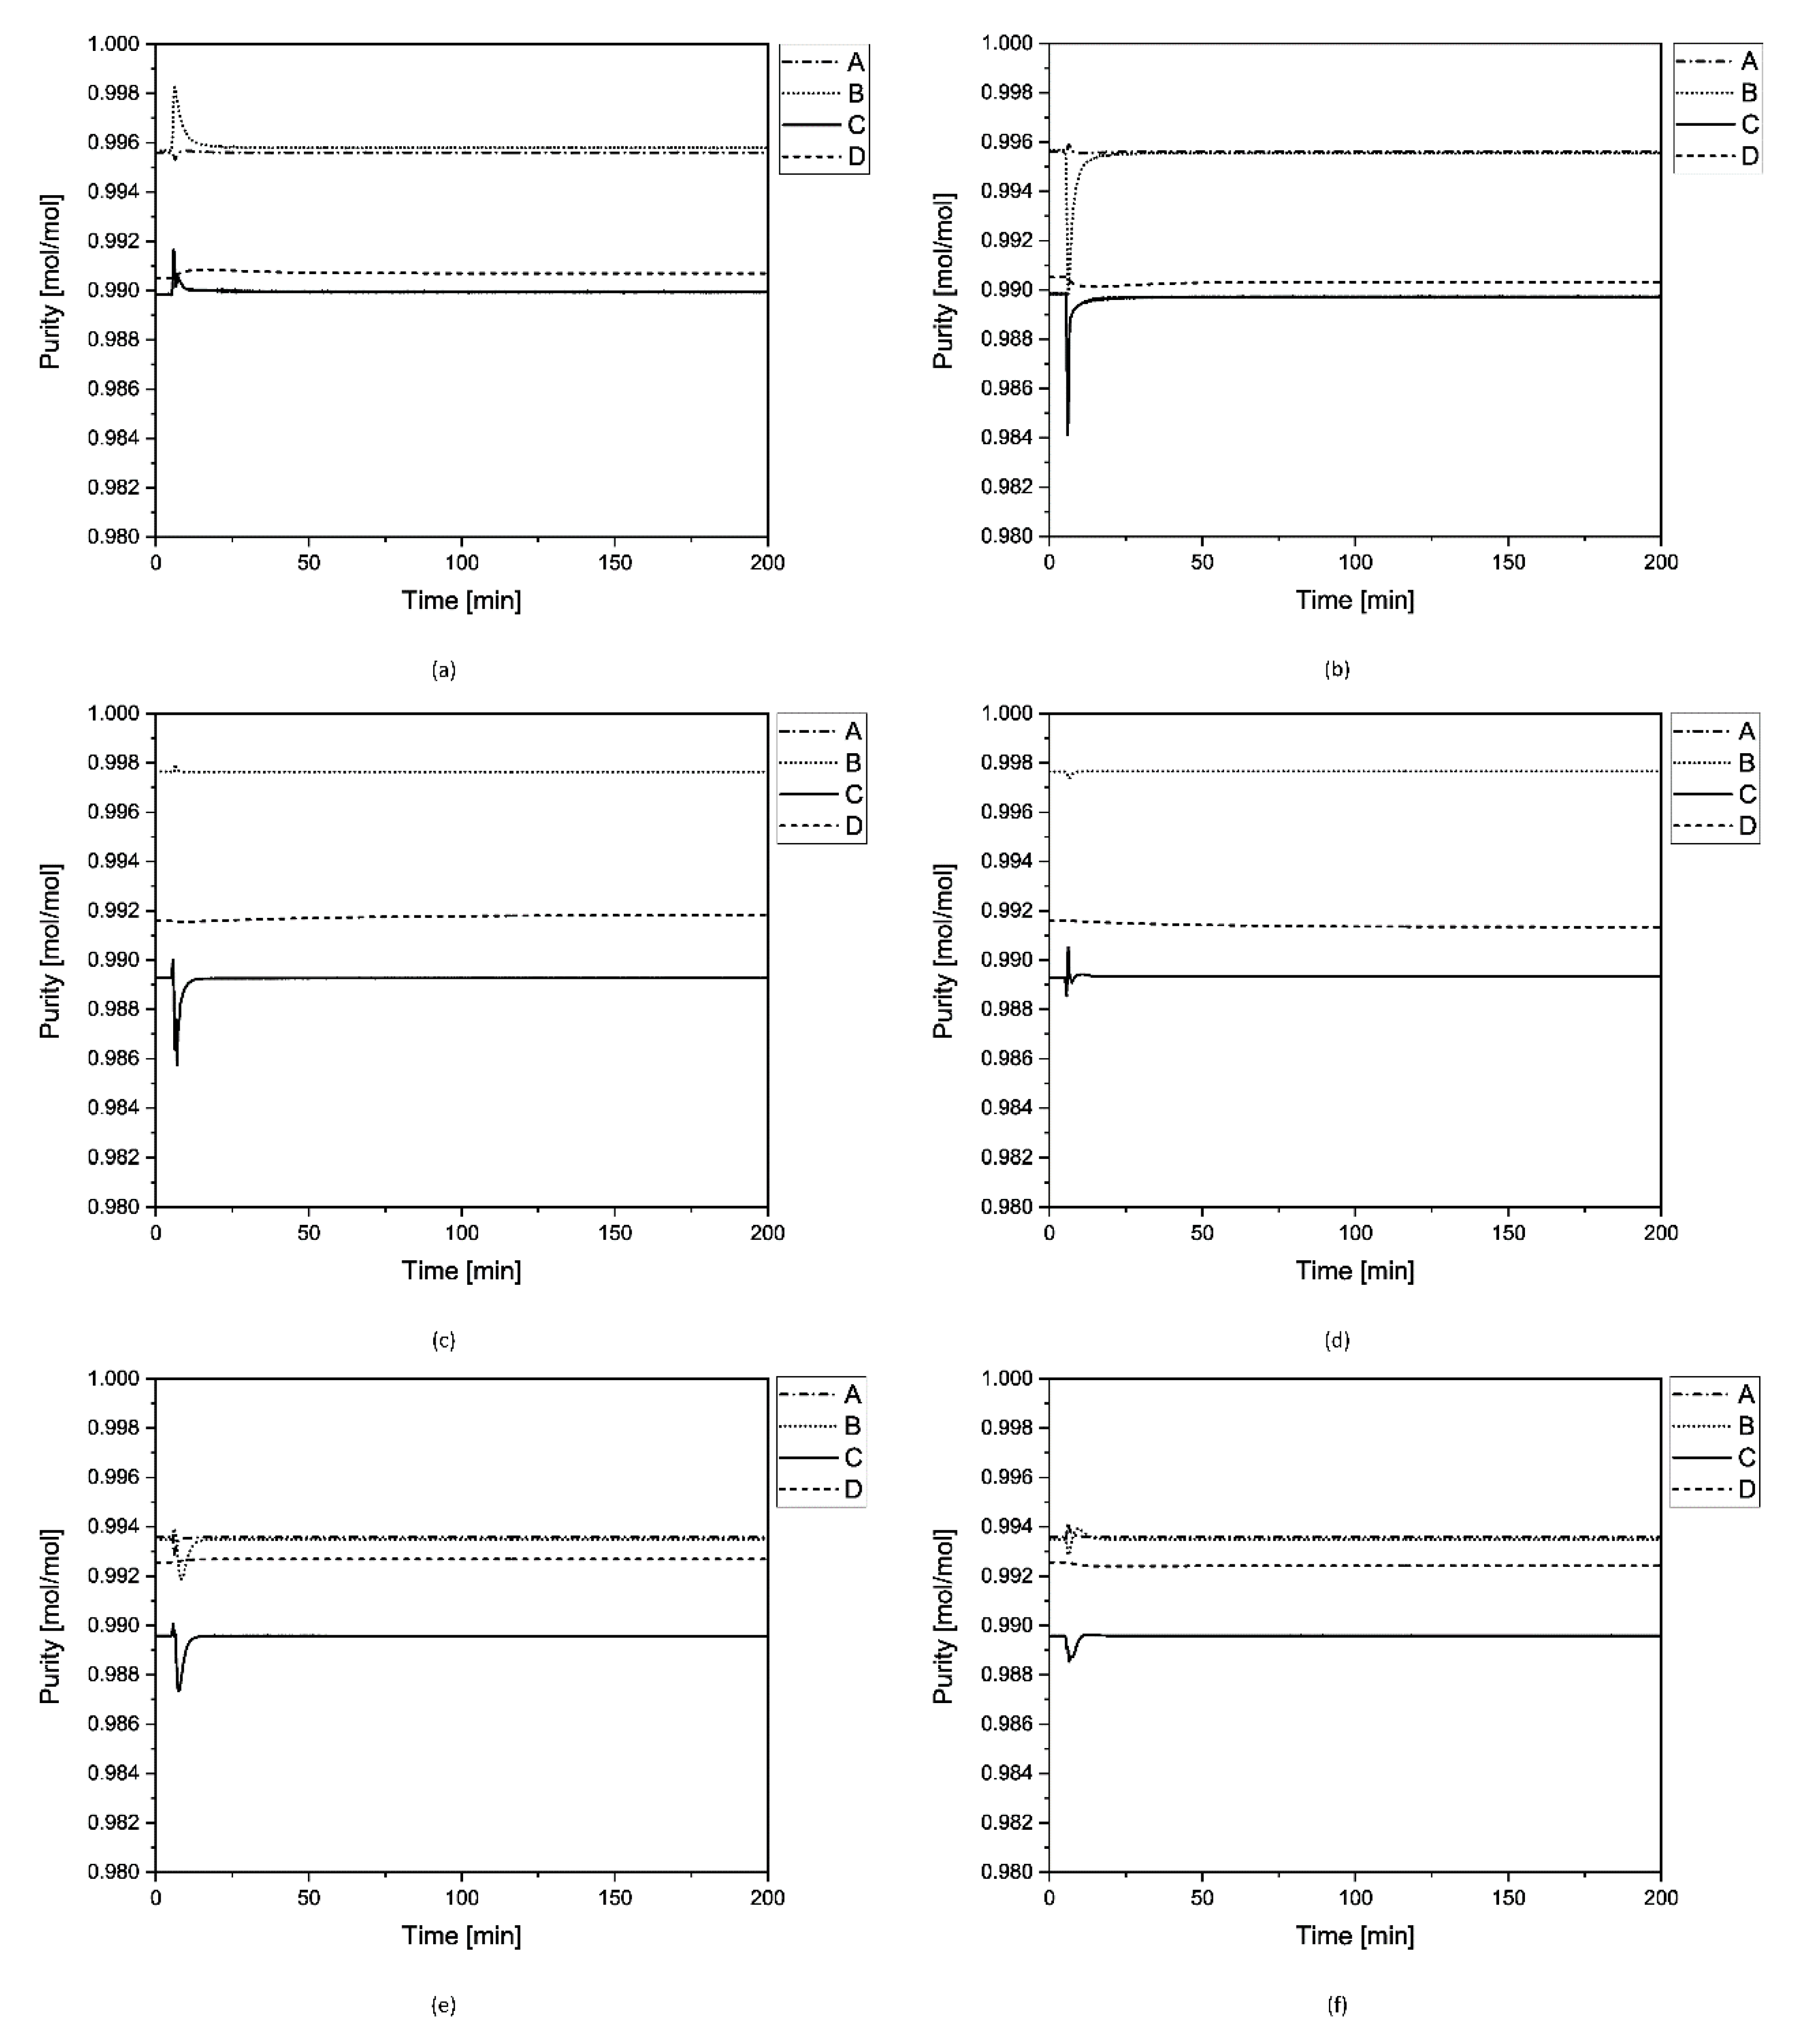
The parameters observed in the respective scenarios were the product purities, in terms of molar fraction of the main component of the respective product flow as plotted over time. For example, the progression of the component A was shown for the distillate. After 5 minutes of simulation time, the respective disturbance was introduced into the system. The target was to keep the product purities above 98 mol% for each scenario. Note that, because of convergence issues, the feed mass flow rate scenarios were implemented using the ramp function. This means that the disturbance was not introduced to the system suddenly, but over a period of 30 s.
Figure 8 shows the dynamic response results for mixture 1. After the disturbances were introduced, unavoidable fluctuations occurred, which were compensated by the control structure of the column. Due to the control structure, stable operation of the plant was possible after the fluctuations subsided. While the purity of most products was already stabilized after approximately 25 min, the longest settling time with 46 min for this mixture was for component D in scenario 8. Note that the first 5 minutes, shown here with a purpose of demonstrating a stable starting point, were not counted for the settling time. The long settling time for component D was due to the relatively large holdup in the reboiler. In scenario 2, where the feed mass flow rate was reduced by 10%, the purity of the side draw 2 was temporarily undercut, although a stable operating point could be reached again after a short time. The only reason for this was a slightly too-aggressive tuning of the heat duty control loop, which was obtained with the chosen method. This resulted in a too-small amount of vapor being available temporarily, making the separation between components C and D, which was the most difficult separation in the system, insufficient. As a result, side draw 2 became contaminated with the component D. Since this only took place over a very short period of time, no negative influences on the product qualities in the product tanks were to be expected. However, in order to resolve this issue, the reboiler control loop was manually re-tuned to act slightly slower, and scenario 2 was recorded again and displayed in
Figure 9. Since the reboiler control loop was now tuned slower, the reboiler duty decreased more slowly with changes in the feed mass flow rate, which then allowed product specifications to be within specification for the whole duration of the scenario. For the opposite case, i.e., scenario 1, where the feed mass flow rate was increased by 10%, there were no issues with the product purities while using more aggressive tuning parameters for the heat duty controller, as there can only be too much vapor available for separation for a short time, resulting in temporary overpurification instead of products going off-spec. Furthermore, even though the purity criterion was kept for all other scenarios, there were some scenarios with a significant steady-state deviation between the initial operating point and the operating point after the disturbance was introduced, e.g., component B in scenario 5. This drop in product purity had different reasons. One reason was that not the most sensitive stage but a stage in the vicinity had to be chosen for control purposes, due to the given design of the pilot plant. Furthermore, single-point temperature controllers were used to control product purities, which would need adapted setpoints for the scenarios where feed composition disturbances were introduced. This could be established using a master composition controller that adapts the setpoints of the temperature controllers [
35]. However, since online composition control is not planned for the pilot plant, on the one hand, and significantly increases the complexity of the control structure, on the other hand, single-point temperature control was used to control the product purities. In addition, the vapor splits were not controlled in the pilot plant, which can contribute to poorer results for some scenarios. In order to analyze the dynamic results in more detail, the integral absolute error (IAE) [
53] was calculated as the sum of all product purity deviations within 200 min of simulation time for each scenario and is displayed in
Table 10. Especially feed composition disturbances showed a higher IAE, which was due to the fact that the products were controlled by single-point temperatures with no setpoint adaption, which ultimately resulted in slightly bigger steady-state deviations.
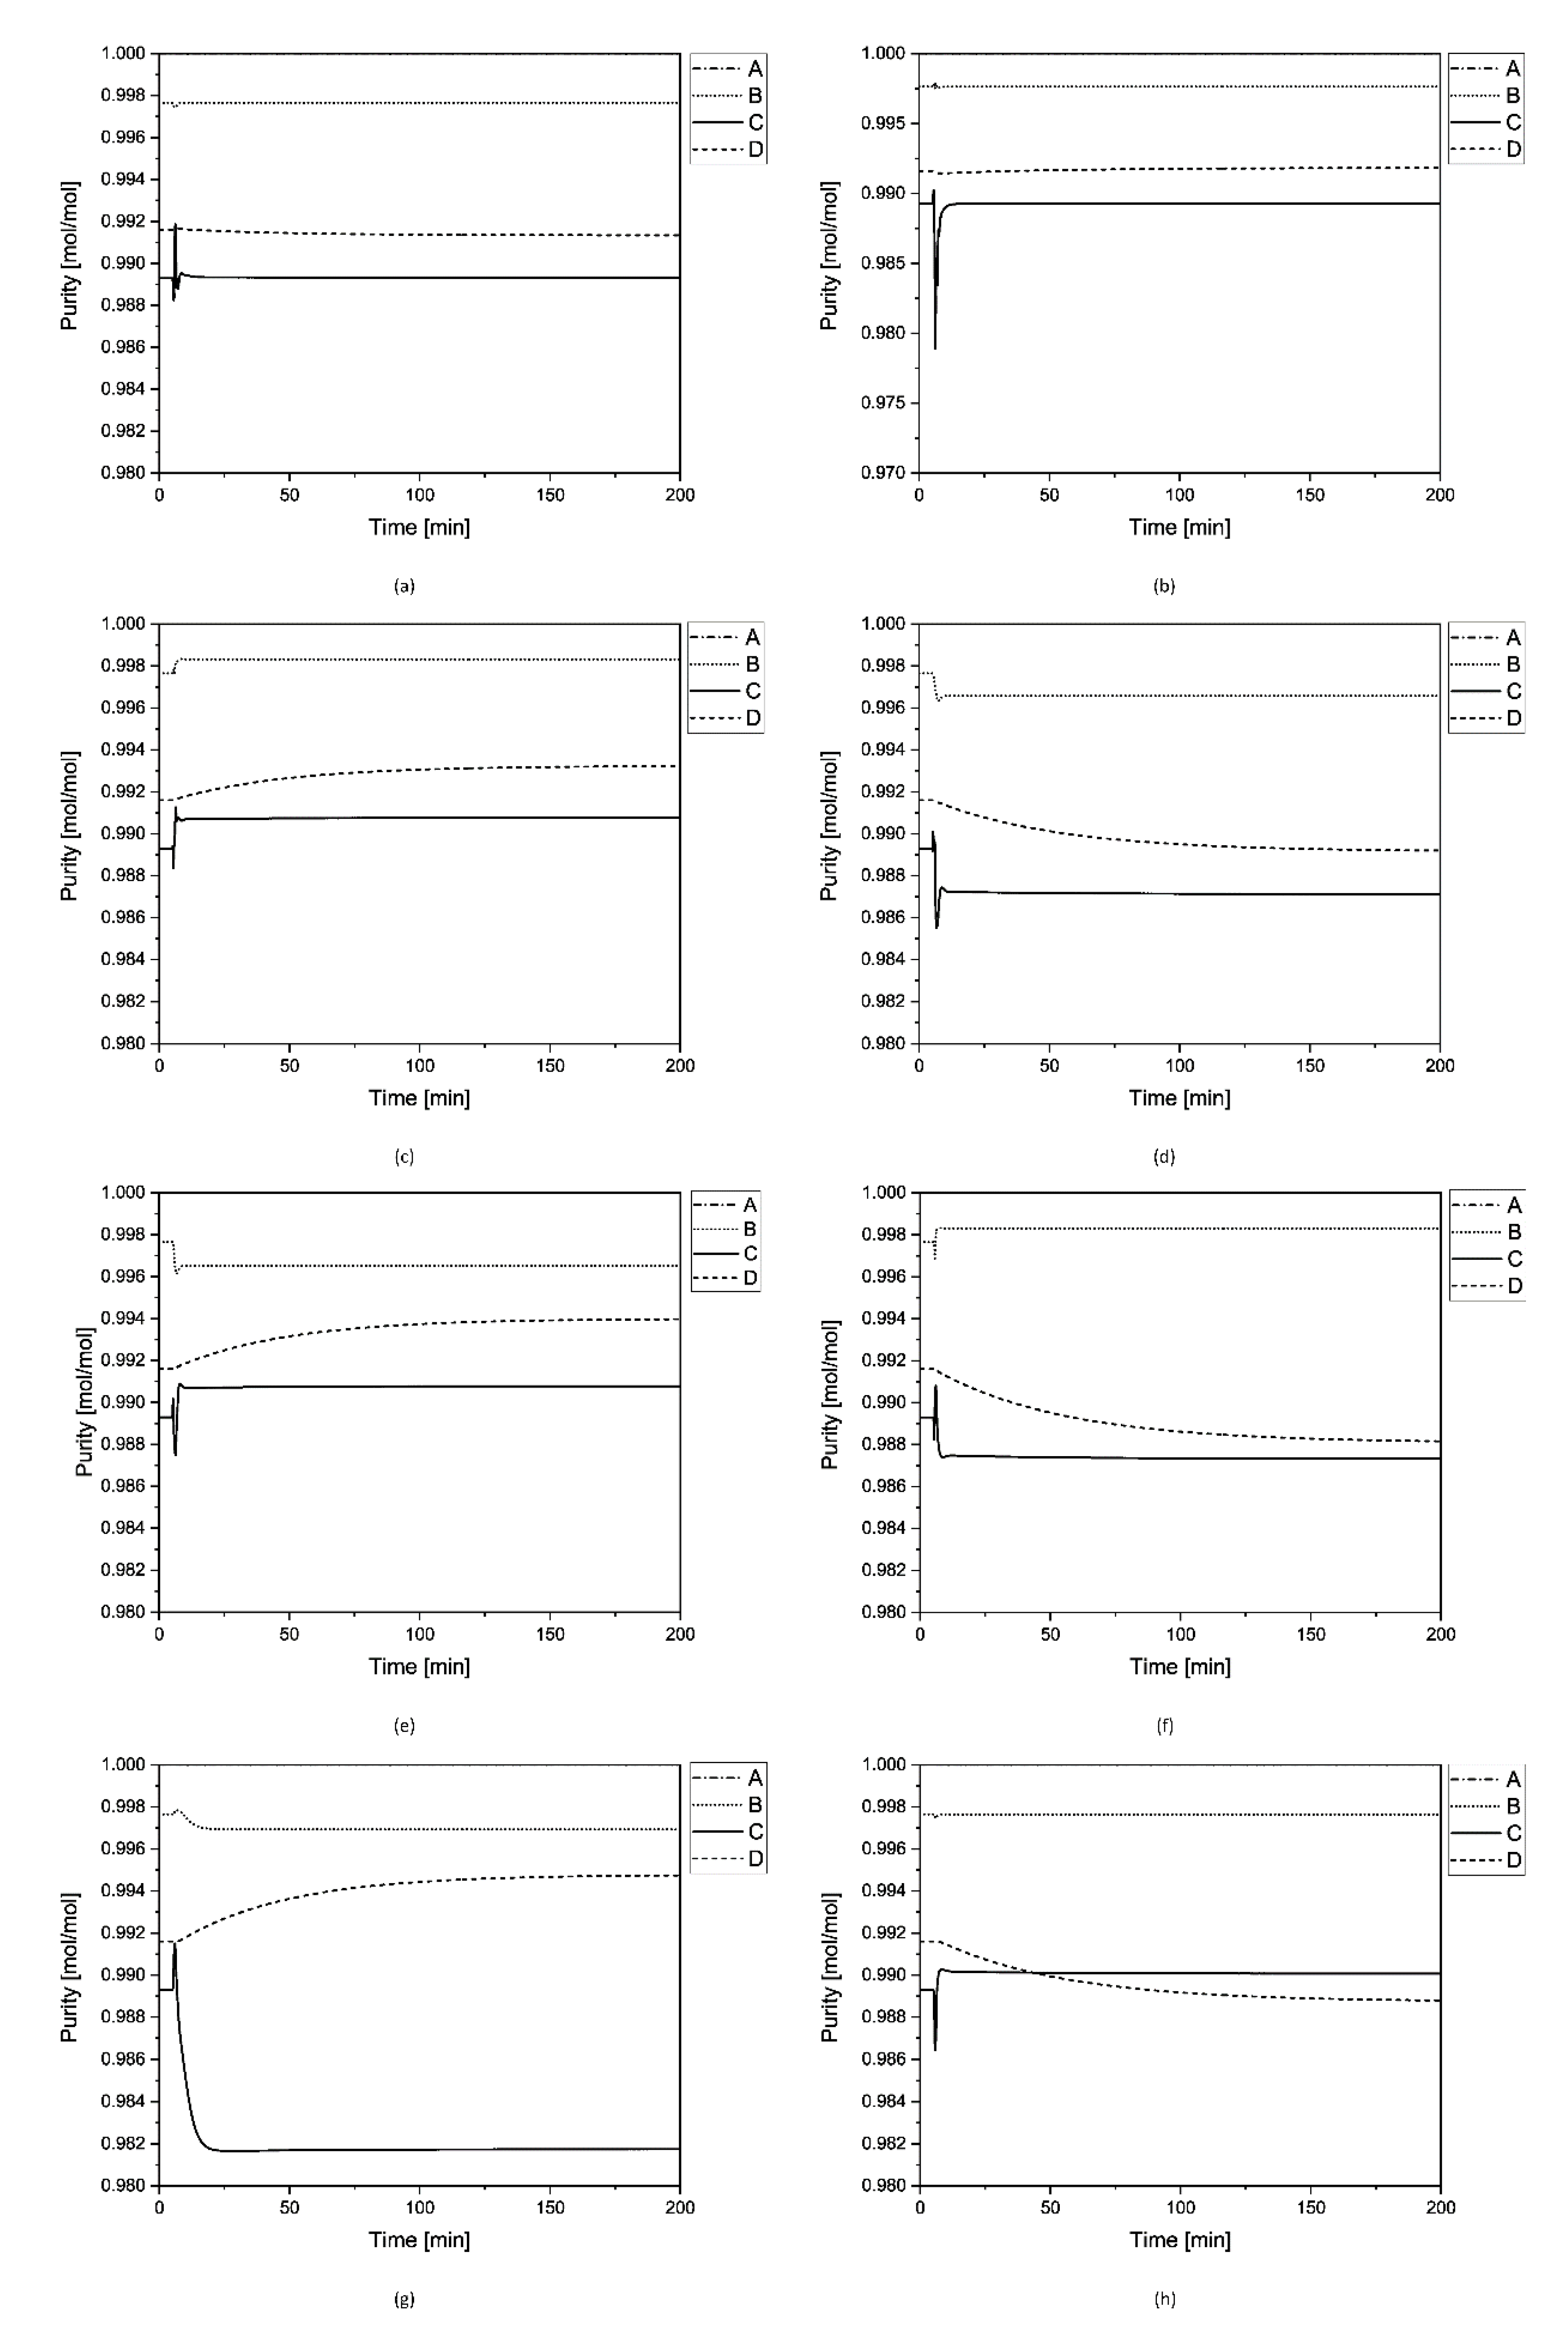
Figure 10 shows the dynamic results for mixture 2. Note that there are supposedly only three curves in the diagrams. This is because component A had a purity of 1 for all scenarios and is, therefore, at the top of the graphs. Stable operation was also possible for this mixture after the disturbances were introduced. In addition, the required purity of 98 mol% could be met for almost all scenarios. Scenario 2 showed the same behavior as observed with mixture 1, caused by aggressive tuning, resulting in a short duration of time with too little amount of vapor available for the separation, leading to the temporary decrease of side draw 2 purity below the 98 mol% constraint. Compared to mixture 1, the undercut was only minimal. Nevertheless, this scenario was also simulated again with a slower reboiler control loop (compare
Figure 9). It can be seen that with a slower reboiler control loop the purity of the products could be maintained throughout the entire scenario for mixture 2. The longest settling time of 99 min was observed for component D in scenario 5 for this mixture, and the IAE results are shown in
Table 10.
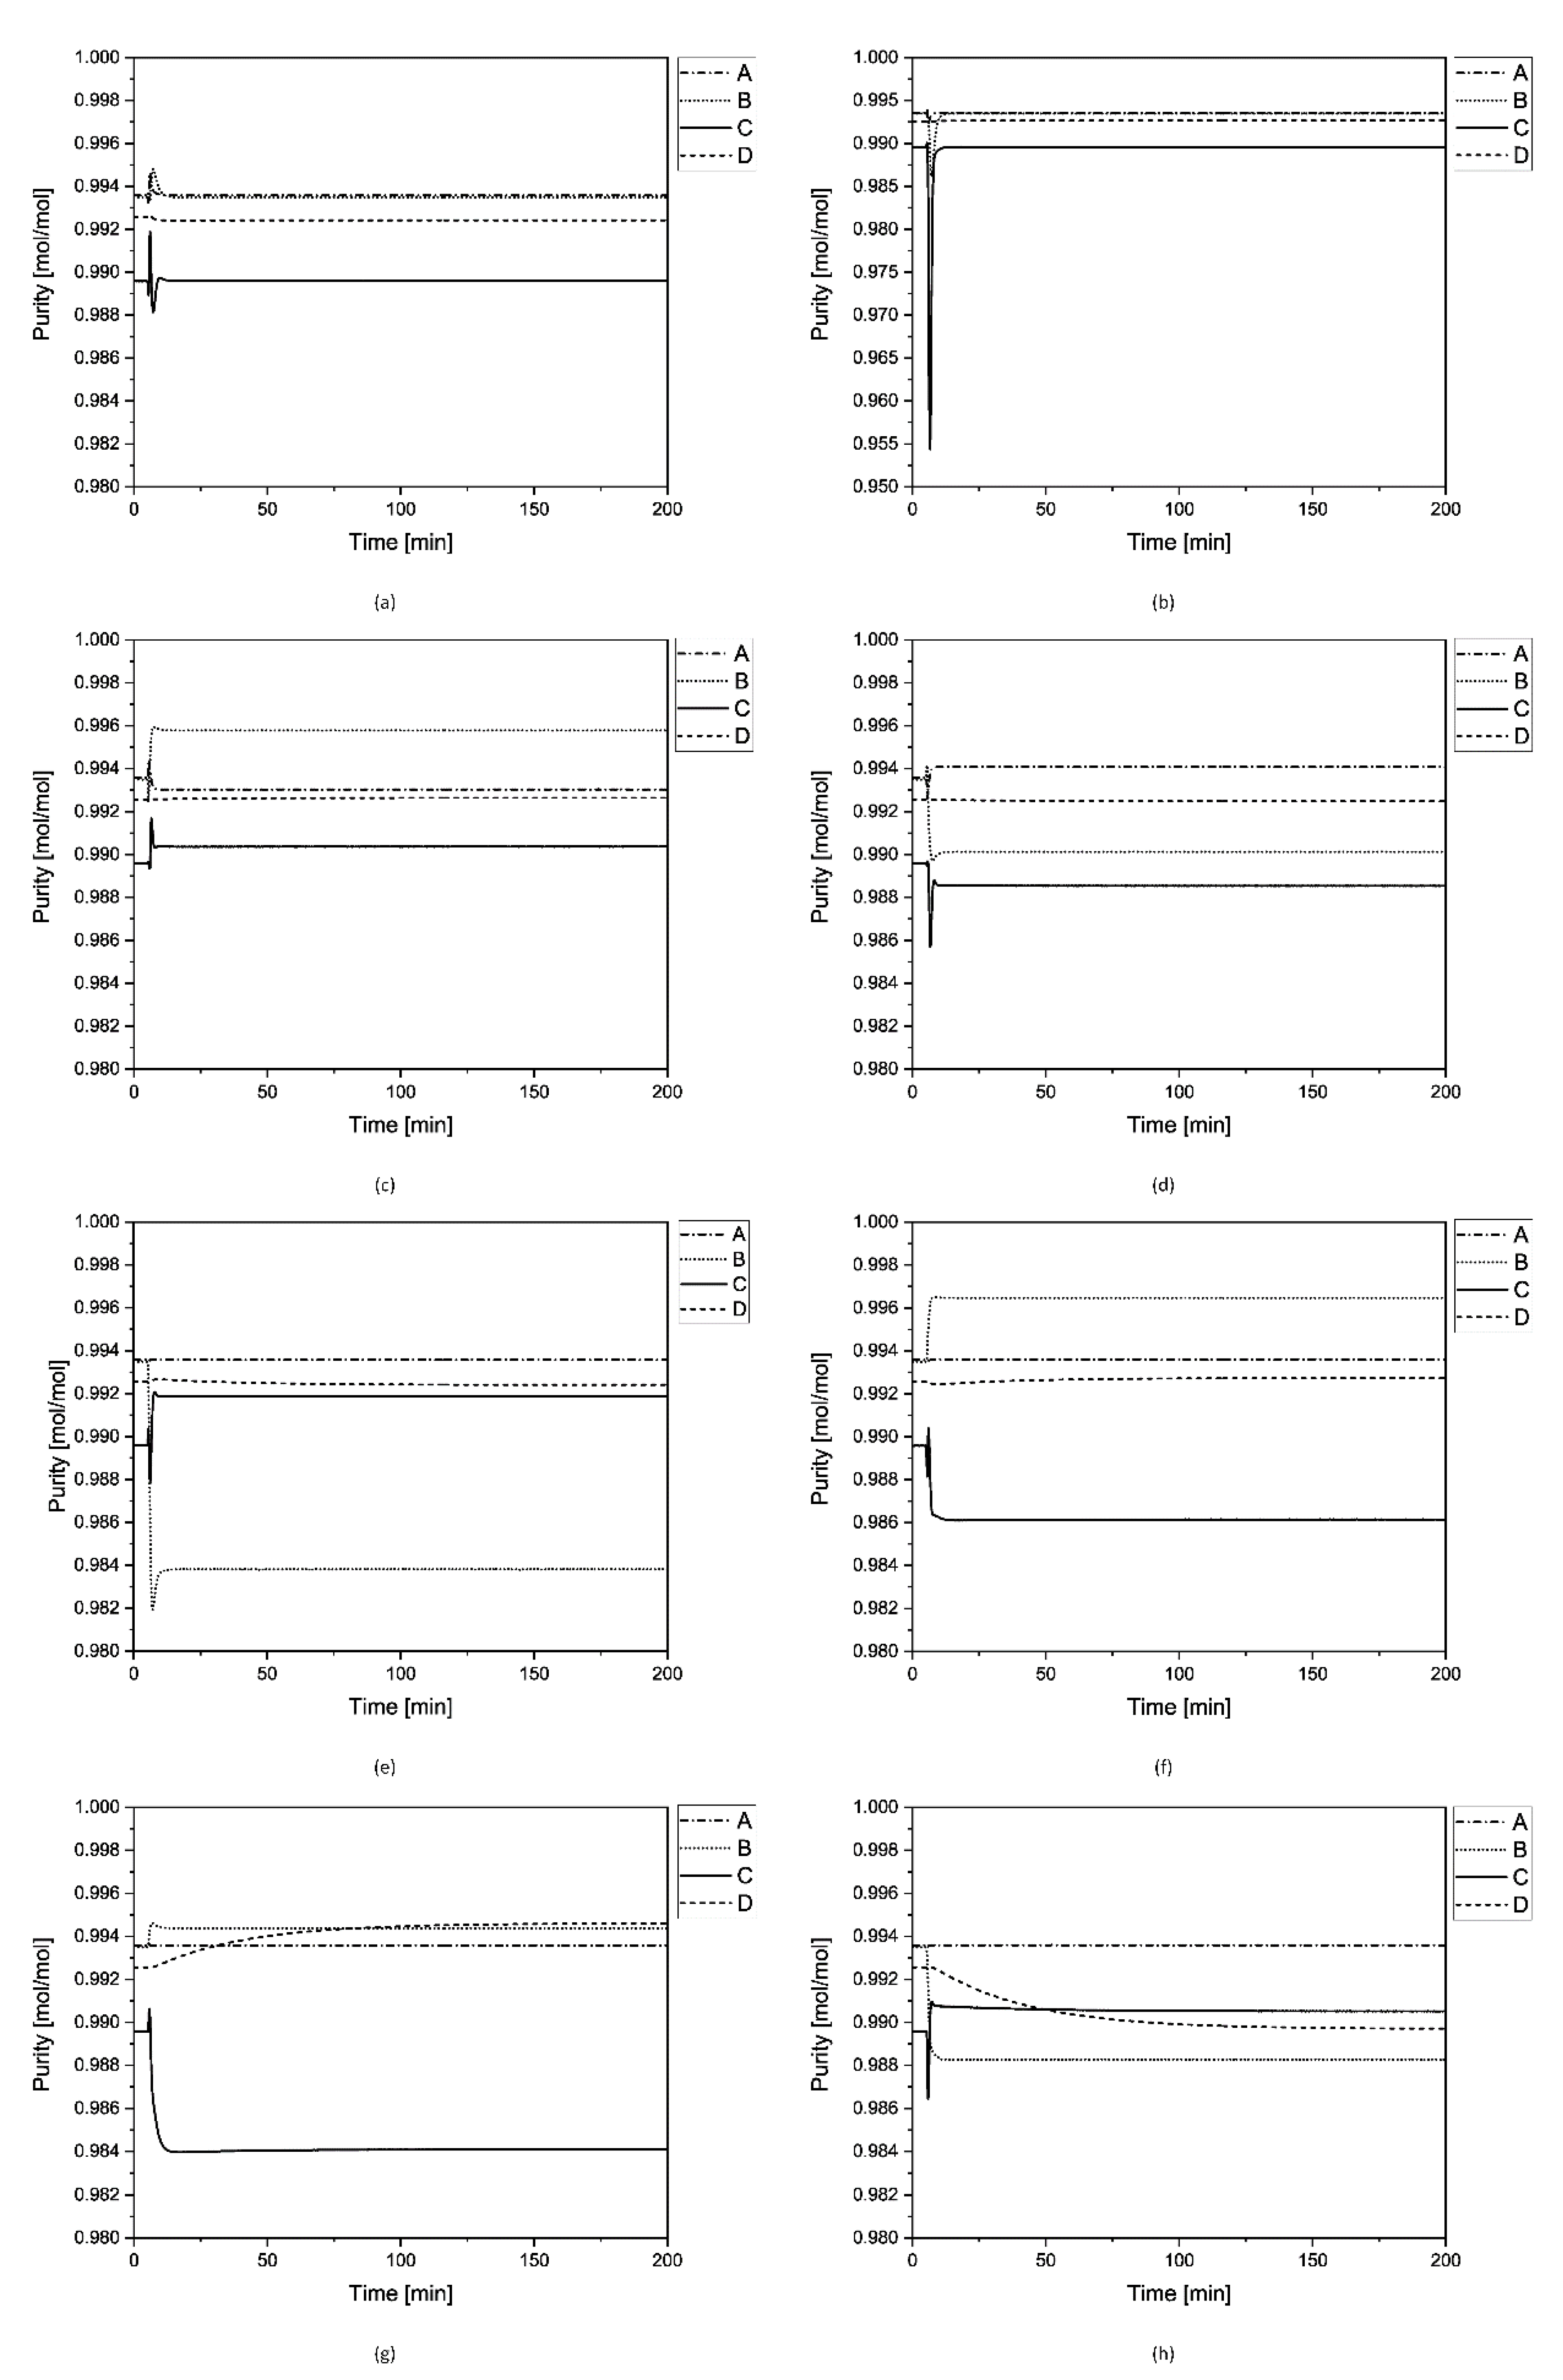
In
Figure 11, the results for the dynamic responses of mixture 3 are shown. Additionally, with this mixture, stable operation of the plant was achieved after the disturbances subsided. With the exception of scenario 2, the product qualities remained consistently above the 98 mol% limit. The reason for this, as with mixtures 1 and 2, was the too aggressively tuned reboiler control loop. For this reason, another scenario was simulated here as well, in which the reboiler control loop for scenario 2 was manually tuned more slowly (compare
Figure 9). The tuning parameters are listed in
Table 11. In addition, for consistency, scenario 1 was also recorded again for all mixtures.
Figure 9 shows that Scenario 1 for all mixtures could still be run without a drop of purity below the 98 mol% constraint. The scenarios with feed composition disturbances were not included again, since the influence of the reboiler duty control in these scenarios was negligibly small due to its minimal changes. The longest settling time for this mixture was 79 min and occurred for component D in scenario 8. The IAE results are displayed in
Table 10.
In summary, the selected control structure was capable of operating the mDWC pilot plant in silico and providing stable control with different feed mixtures under different disturbances. To achieve this, it was important to have a relatively slow reboiler control loop, compared to other control loops. This is because the reboiler duty directly influenced the vapor boil-up and, thus, all other operating parameters in the column were also directly influenced. Interestingly, the control was very successful, despite the inability to apply optimal control structures. Transferred to real industrial plants, where the same restrictions could occur (due to different services or future revamps), this means that the control structure of the column does not necessarily have to correspond to the optimal control structure. In addition, it was shown that mDWCs have a certain flexibility regarding the use with different feed mixtures. This means that a flexibly designed mDWC can be operated in different services. All in all, obtained results are very encouraging contribution toward the industrial use of mDWCs.


