Article

Estimation of the Cadmium Nephrotoxicity Threshold from Loss of Glomerular Filtration Rate and Albuminuria

by
Soisungwan Satarug
1,*,
David A. Vesey
1,2,
Tanaporn Khamphaya
3,
Phisit Pouyfung
3,
Glenda C. Gobe
1,4,5 and
Supabhorn Yimthiang
3
1
The Centre for Kidney Disease Research, Translational Research Institute, Brisbane 4102, Australia
2
Department of Kidney and Transplant Services, Princess Alexandra Hospital, Brisbane 4102, Australia
3
Occupational Health and Safety, School of Public Health, Walailak University, Nakhon Si Thammarat 80160, Thailand
4
School of Biomedical Sciences, The University of Queensland, Brisbane 4072, Australia
5
NHMRC Centre of Research Excellence for CKD QLD, UQ Health Sciences, Royal Brisbane and Women’s Hospital, Brisbane 4029, Australia
*
Author to whom correspondence should be addressed.
Toxics 2023, 11(9), 755; https://doi.org/10.3390/toxics11090755
Submission received: 17 August 2023 / Revised: 4 September 2023 / Accepted: 5 September 2023 / Published: 6 September 2023
(This article belongs to the Special Issue Feature Papers in Environmental Epidemiology)

Abstract

:
Cadmium (Cd) is a pervasive, toxic environmental pollutant that preferentially accumulates in the tubular epithelium of the kidney. Current evidence suggests that the cumulative burden of Cd here leads to the progressive loss of the glomerular filtration rate (GFR). In this study, we have quantified changes in estimated GFR (eGFR) and albumin excretion (Ealb) according to the levels of blood Cd ([Cd]b) and excretion of Cd (ECd) after adjustment for confounders. ECd and Ealb were normalized to creatinine clearance (Ccr) as ECd/Ccr and Ealb/Ccr. Among 482 residents of Cd-polluted and non-polluted regions of Thailand, 8.1% had low eGFR and 16.9% had albuminuria (Ealb/Ccr) × 100 ≥ 20 mg/L filtrate. In the low Cd burden group, (ECd/Ccr) × 100 < 1.44 µg/L filtrate, eGFR did not correlate with ECd/Ccr (β = 0.007) while an inverse association with ECd/Ccr was found in the medium (β = −0.230) and high burden groups (β = −0.349). Prevalence odds ratios (POR) for low eGFR were increased in the medium (POR 8.26) and high Cd burden groups (POR 3.64). Also, eGFR explained a significant proportion of Ealb/Ccr variation among those with middle (η2 0.093) and high [Cd]b tertiles (η2 0.132) but did not with low tertiles (η2 0.001). With an adjustment of eGFR, age and BMI, the POR values for albuminuria were increased in the middle (POR 2.36) and high [Cd]b tertiles (POR 2.74) and those with diabetes (POR 6.02) and hypertension (2.05). These data indicate that (ECd/Ccr) × 100 of 1.44 µg/L filtrate (0.01–0.02 µg/g creatinine) may serve as a Cd threshold level based on which protective exposure guidelines should be formulated.

1. Introduction

Chronic kidney disease (CKD) is a progressive disease with high morbidity and mortality, affecting 8% to 16% of the world’s population [1,2,3]. CKD is diagnosed when the estimated glomerular filtration rate (eGFR) falls below 60 mL/min/1.73 m2, termed low eGFR, or albuminuria, defined as albumin to creatinine ratios (ACR) ≥ 30 mg/g creatinine in women and ≥ 20 mg/g creatinine in men that persists for at least 3 months [1,2]. Environmental exposure to the toxic metal pollutant cadmium (Cd) is linked to an increased risk of both low eGFR and albuminuria. Typically, studies of CKD associated with environmental Cd exposure employed levels of blood Cd ([Cd]b) and excretion of Cd (ECd), normalized to creatinine excretion (ECd/Ecr) as indicators of exposure [3,4]. Notably, however, these Cd exposure indicators have been found to be also associated with an increased risks of diabetes [5,6,7,8,9,10] and hypertension [11,12,13,14,15,16]; both of which are major risk factors for CKD. Hypertension is known to be a cause and result of CKD [17,18]. Furthermore, in a Dutch prospective cohort study, smoking, which is a source of Cd exposure, promoted kidney failure, evident from a reduction in eGFR to below 15 mL/min/1.73 m2 [19]. It is imperative that these covariates are adequately adjusted for the estimation of risks of GFR loss and albuminuria due to renal Cd accumulation.
The dose–response relationship between Cd exposure and adverse kidney outcomes measured by a reduction in eGFR and albuminuria is not well defined. In comparison, numerous dose-effect studies employed tubular damage and tubulopathy reflected by tubular proteinuria as signs of the nephrotoxicity due to Cd accumulation. However, current evidence suggests that a sustained decrease in eGFR after Cd exposure is more suitable than the tubulopathy endpoint, especially for the purpose of determining protective exposure guidelines.
Also, current evidence suggests that excreted Cd (ECd) is related to tubular cell injury and death as a result of the cumulative burden of Cd [20]. The excreted Cd emanates from tubular epithelial cells complexed with metallothionein (MT) as CdMT [21], the storage form of Cd. Consequently, it is logical to normalize ECd to creatinine clearance (Ccr) rather than creatinine excretion (Ecr) because Ccr is a surrogate for GFR, which is the measurable analogue of nephron number [3,20,22].
The present study aims to explore if there is a potential toxicity threshold level of Cd accumulation in kidneys. To achieve this aim, changes in eGFR and albumin excretion (Ealb) together with the risks of low eGFR and albuminuria were quantified in relation to both ECd and [Cd]b. The confounding impacts of smoking, diabetes and hypertension were also evaluated. We collected data from women and men who resided in Cd-polluted and non-polluted regions of Thailand to obtain a wide range of exposure levels pivotal to the a dose–response analysis.
To depict an amount of Cd and albumin excreted per volume of filtrate, known also as primary urine, ECd and Ealb were normalized to Ccr as ECd/Ccr and Ealb/Ccr, respectively [23]. This Ccr-normalization corrects for differences in urine flow rate (dilution) and the number of functioning nephrons among cohort participants; they are unaffected by creatinine excretion (Ecr) [23]. Therefore, (Ealb/Ccr) × 100 ≥ 20 mg/L filtrate identifies albuminuria in both men and women. In comparison, when Ealb is adjusted to creatinine excretion (Ecr) as albumin to creatinine ratios (ACR), cut-off values for albuminuria in women and men differ because of universally lower Ecr values in women than in men.

2. Materials and Methods

2.1. Cohort Participants

To establish a clear dose–response relationship, a population exposed to a wide range of Cd doses is required. Therefore, we selected subjects from two population-based cross-sectional studies undertaken in a Cd-contaminated area of the Mae Sot District, Tak Province [24] and a non-contaminated location in the Nakhon-Si-Thammarat Province [25] of Thailand. More females (n = 354) were recruited to the present study than males (n = 118), given that an increase in mortality from kidney disease was found especially in women in a prospective cohort study of residents of a Cd-polluted area of Japan [26].
The data from a nationwide survey of Cd levels in soils and food crops indicated that environmental exposure to Cd in Nakhon Si Thammarat was low [27]. In comparison, the Cd concentration of the paddy soil samples from the Mae Sot district exceeded the standard of 0.15 mg/kg and the rice samples collected from household storage contained four times the amount of the permissible Cd level of 0.1 mg/kg [28]. An independent health survey revealed the prevalence of low eGFR among those resided in the Cd-contaminated area of the Mae Sot District to be 16.1% [29].
The study protocol for the Mae Sot group was approved by the Institutional Ethical Committees of Chiang Mai University and the Mae Sot Hospital (Approval No. 142/2544, 5 October 2001) [24]. The Office of the Human Research Ethics Committee, Walailak University of Thailand, approved the study protocol for the Nakhon Si Thammarat group (Approval number WUEC-20-132-01, 28 May 2020) [25].
Prior to participation, all participants provided informed consent. They had lived at their current addresses for at least 30 years. Exclusion criteria were pregnancy, breast-feeding, a history of metal work and a hospital record or physician’s diagnosis of an advanced chronic disease. Hypertension was defined as systolic blood pressure ≥ 140 mmHg, diastolic blood pressure ≥ 90 mmHg [30], a physician’s diagnosis or prescription of anti-hypertensive medications. Diabetes was diagnosed when fasting plasma glucose levels ≥ 126 mg/dL (https://www.cdc.gov/diabetes/basics/getting-tested.html) (accessed on 12 August 2023) or a physician’s prescription of anti-diabetic medications.

2.2. Assessment of Cadmium Exposure and Adverse Effects

Assessment of Cd exposure was based on a one-time measurement of blood Cd concentration ([Cd]b) and the urinary excretion of Cd (ECd). Kidney functional assessment was based on Ealb and eGFR. For these measurements, samples of urine and whole blood were collected after overnight fast. Blood samples were collected within 3 h of urine collection. Aliquots of blood and urine samples were stored at −80 °C for later analysis.
Levels of Cd in urine and blood ([Cd]u and [Cd]b) were quantified by graphite furnace atomic absorption spectrometry with the Zeeman effect background correction system. Multielement standards (Merck KGaA, Darmstadt, Germany) were used for instrument calibration. The quality control and quality assurance of Cd quantitation were accomplished by simultaneous analysis of blood control samples (ClinChek, Munich, Germany) and the reference urine metal control levels 1, 2 and 3 (Lyphocheck, Bio-Rad, Hercules, CA, USA).
The limit of detection (LOD) for Cd in blood or urine, defined as 3 times the standard deviation of at least 10 blank sample measurements, was 0.3 µg/L for [Cd]b and 0.1 µg/L for [Cd]u. The sample blanks as reference standards for urine and blood were included in the assay together with samples of urine or blood from subjects. Deionized water was used to zero an instrument. The coefficient of variation in Cd in the reference urine and blood were within acceptable clinical chemistry standards. When a sample contained Cd below its LOD, the Cd concentration assigned was the LOD value divided by the square root of 2 [31].
Urinary and plasma creatinine concentrations ([cr]u and [cr]p) were measured by the colorimetric method, based on the alkaline-picrate Jaffe’s reaction [32]. Urinary albumin concentration was determined by an immunoturbidimetric method [33,34].

2.3. Estimated Glomerular Filtration Rate (eGFR)

In theory, GFR is a measure of nephron function which is the product of the functioning nephron number and mean single nephron GFR [35,36,37]. In practice, GFR is estimated from established chronic kidney disease epidemiology collaboration (CKD-EPI) equations and is reported as estimated GFR (eGFR) [34]. These CKD-EPI equations have been validated with inulin clearance [38].
Male eGFR = 141 × [plasma creatinine/0.9]Y × 0.993age, where Y = −0.411 if [cr]p ≤ 0.9 mg/dL and Y = −1.209 if [cr]p > 0.9 mg/dL. Female eGFR = 144 × [plasma creatinine/0.7]Y × 0.993age, where Y = −0.329 if [cr]p ≤ 0.7 mg/dL and Y = −1.209 if [cr]p > 0.7 mg/dL. CKD stages 1, 2, 3a, 3b, 4 and 5 corresponded to eGFRs of 90–119, 60–89, 45–59, 30–44, 15–29 and <15 mL/min/1.73 m2, respectively. For dichotomized comparison, CKD (abnormal eGFR) was defined eGFR ≤ 60 mL/min/1.73 m2.

2.4. Normalization of Excretion Rate

Excretion of x, Ex was normalized to Ecr as [x]u/[cr]u, where x = Cd or alb; [x]u = urine concentration of x (mass/volume) and [cr]u = urine creatinine concentration (mg/dL). The ratio [x]u/[cr]u was expressed in μg/g of creatinine.
Ex was normalized to Ccr as Ex/Ccr = [x]u[cr]p/[cr]u, where x = Cd or alb; [x]u = urine concentration of x (mass/volume); [cr]p = plasma creatinine concentration (mg/dL) and [cr]u = urine creatinine concentration (mg/dL). Ex/Ccr was expressed as the excretion of x per volume of filtrate [23].
Results obtained with Ccr-normalized data are shown herein. Results of analogous analyses with Ecr-normalized data are provided in Supplementary Material (SM).

2.5. Statistical Analysis

Data were analysed with IBM SPSS Statistics 21 (IBM Inc., New York, NY, USA). The Mann–Whitney U test was used to compare two groups and Pearson’s chi-squared test was used to assess differences in percentages. Distribution of the variables was examined for skewness and those showing right skewing were subjected to logarithmic transformation before analysis, where required. Departure from normal distribution of variables was assessed by one sample Kolmogorov–Smirnov test.
A multiple linear regression model analysis was used to identify predictors of eGFR and Ealb/Ccr. The multivariable logistic regression analysis was used to determine the prevalence odds ratio (POR) for low eGFR and albuminuria. Univariate analysis of covariance via Bonferroni correction in multiple comparisons was used to obtain covariate adjusted mean Ealb/Ccr and eta square (η2) values. For all tests, p-values ≤ 0.05 were considered to indicate statistical significance.

3. Results

3.1. Cohort Participants

Table 1 provides descriptive characteristics of the Thai cohort participants, who were recruited from a low-exposure locality and a high-exposure region due to environmental Cd pollution.
A total of 482 persons (354 women and 118 men), mean age of 51.8 years, were included in this investigation. The respective percentages of smoking and diabetes were 29.7% and 18.3%, while about half (48.5%) had hypertension.
The overall % low eGFR was 8.1% and % abnormal ACR was 15%. The overall % abnormal Ealb/Ccr was 16.9%. Of note, the % abnormal Ealb was higher in the low eGFR group than normal eGFR group for both ACR and Ealb/Ccr criteria in both genders. Similarly, the % hypertension and diabetes were higher in the low eGFR than the normal eGFR group.
The mean [Cd]b (range) was 2.60 (0.03–20) µg/L. The mean (ECd/Ccr) × 100 (range) was 3.20 (0.02–25) µg/L filtrate. The corresponding mean ECd/Ecr (range) was 4.05 (0.03–31) µg/g creatinine.

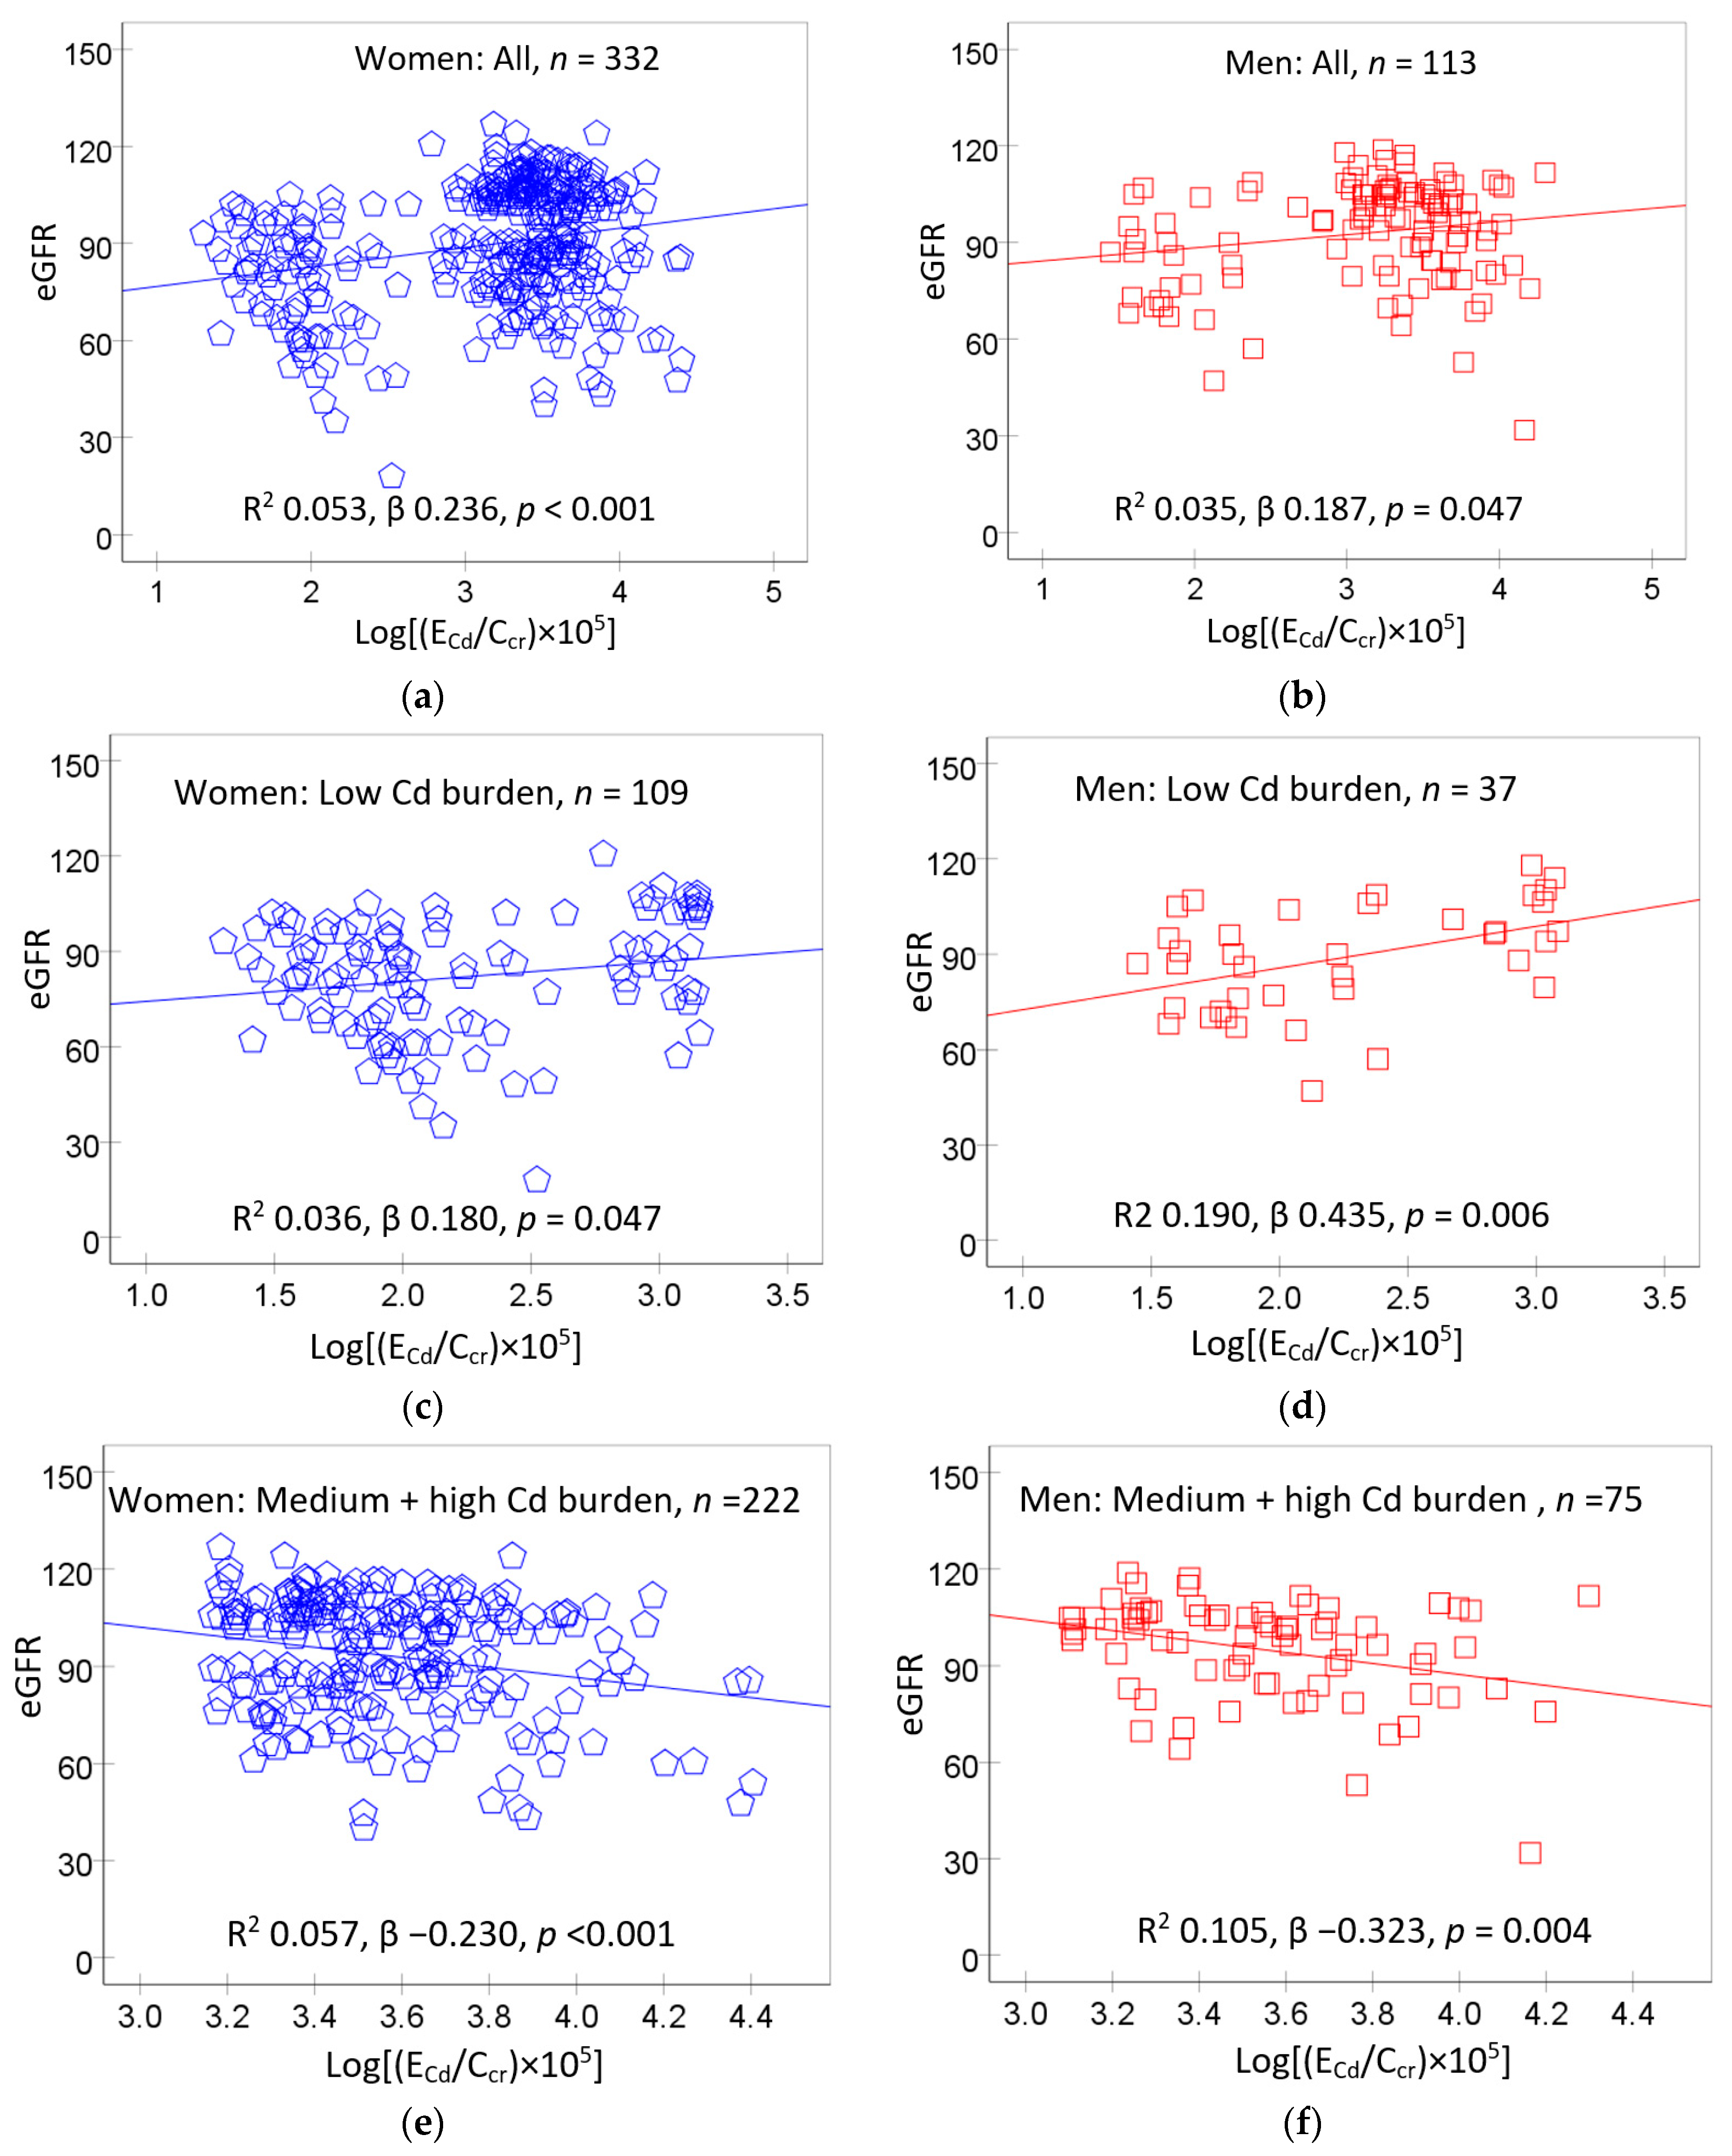
3.2. Predictors of eGFR

Table 2 provides the results of the multiple linear regression analysis to define the independent variables that contributed to differences in eGFR.
In an inclusive model, all eight independent variables explained 27.8% of the total variation in eGFR. Age, ECd/Ccr and diabetes were the three main influential independent variables. All other five independent variables did not show a significant association with eGFR. In a subgroup analysis, female eGFR was inversely associated with age (β = −0.511), ECd/Ccr (β = −0.126) and diabetes (β = −0.119). In comparison, male eGFR was associated with age only (β = −0.472).
In an analogous regression of eGFR with ECd normalized to creatinine excretion (ECd/Ecr) (Table S1), eGFR was inversely associated with age only (β = −0.442). No significant association was seen between eGFR and all other six variables, including ECd/Ecr.
To investigate the dose–response relationship of Cd exposure and changes in eGFR, we designated the low, middle and high ECd/Ccr tertiles to represent low, medium and high Cd burdens, respectively. In women, the cut-off values of (ECd/Ccr) × 100 for the low, medium and high Cd burdens were ≤1.44, 1.45–3.26, >3.26 µg/L filtrate, respectively. Corresponding cut-off values of (ECd/Ccr) × 100 in men were ≤1.25, 1.26–3.25, >3.25 µg/L filtrate.
Figure 1 provides scatterplots relating eGFR to Cd excretion rate in women and men and their subgroups according to Cd burden levels, described above.
In scatterplots including all women (Figure 1a) and all men (Figure 1b), a direct relationship between eGFR and ECd/Ccr was suggested. In subgroup analysis, a direct relationship of eGFR and ECd/Ccr was seen in women and men who had low Cd burden (Figure 1c,d). In contrast, eGFR was inversely related to ECd/Ccr in women and men of the medium plus high Cd burden groups (Figure 1e,f). These data indicate that an ECd/Ccr of 1.44 µg/L filtrate may be a threshold level of Cd accumulation, above which eGFR began to drop.
To confirm or dispute the contrasting eGFR responses below or above ECd/Ccr of 1.44 µg/L filtrate, multiple regression analyses of eGFR across Cd burden groups were undertaken. Results are provided in Table 3.
In distinction from a bivariate analysis (Figure 1c,d), the association between eGFR and ECd/Ccr was statistically insignificant in the low Cd burden group after adjustment for confounding variables (Table 3). In this low Cd burden group, eGFR was inversely associated with age only (β = −0.455), while its association with ECd/Ccr became statistically insignificant (Table 3).
Of interest, there was an inverse relationship between eGFR and ECd/Ccr in the medium and high Cd burden groups following a similar adjustment for confounders. All eight independent variables explained, respectively, 32.1% and 25.5% of total eGFR variation in the medium and high Cd burden groups. In the high Cd burden group, eGFR was more closely associated with ECd/Ccr (β = −0.349), compared with the medium Cd burden group (β = −0.284). Other predictors of eGFR in the medium Cd burden group were age (β = −0.505) and systolic blood pressure (β = −0.230). Age was the other predictor of eGFR (β = −0.410) in the high Cd burden group.

3.3. Logistic Regression Analysis of Low eGFR

Table 4 provides the results of the logistic regression analysis that evaluated the effects of Cd body burden and other six independent variables on the prevalence odds ratios (POR) for low eGFR. POR is defined in Section 2.5.
In all subjects, the POR values for low eGFR increased with age (POR 1.118) and in those with diabetes (POR 3.024), medium Cd burden (POR 8.265) and high Cd burden (POR 3.643). All other four independent variables did not significantly affect the POR for low eGFR.
Among women, the POR values for low eGFR increased with age (POR 1.114) and in the medium Cd burden group (POR 7.204). An increase in the POR for low eGFR in the high Cd burden group did not reach a statistically significant level (POR 3.218, p = 0.064).
An effect of Cd exposure on the POR for low eGFR in men could not be evaluated due a small number of men with low eGFR (n = 4). However, the POR for low eGFR among men was associated with hypertension (POR 2.478).

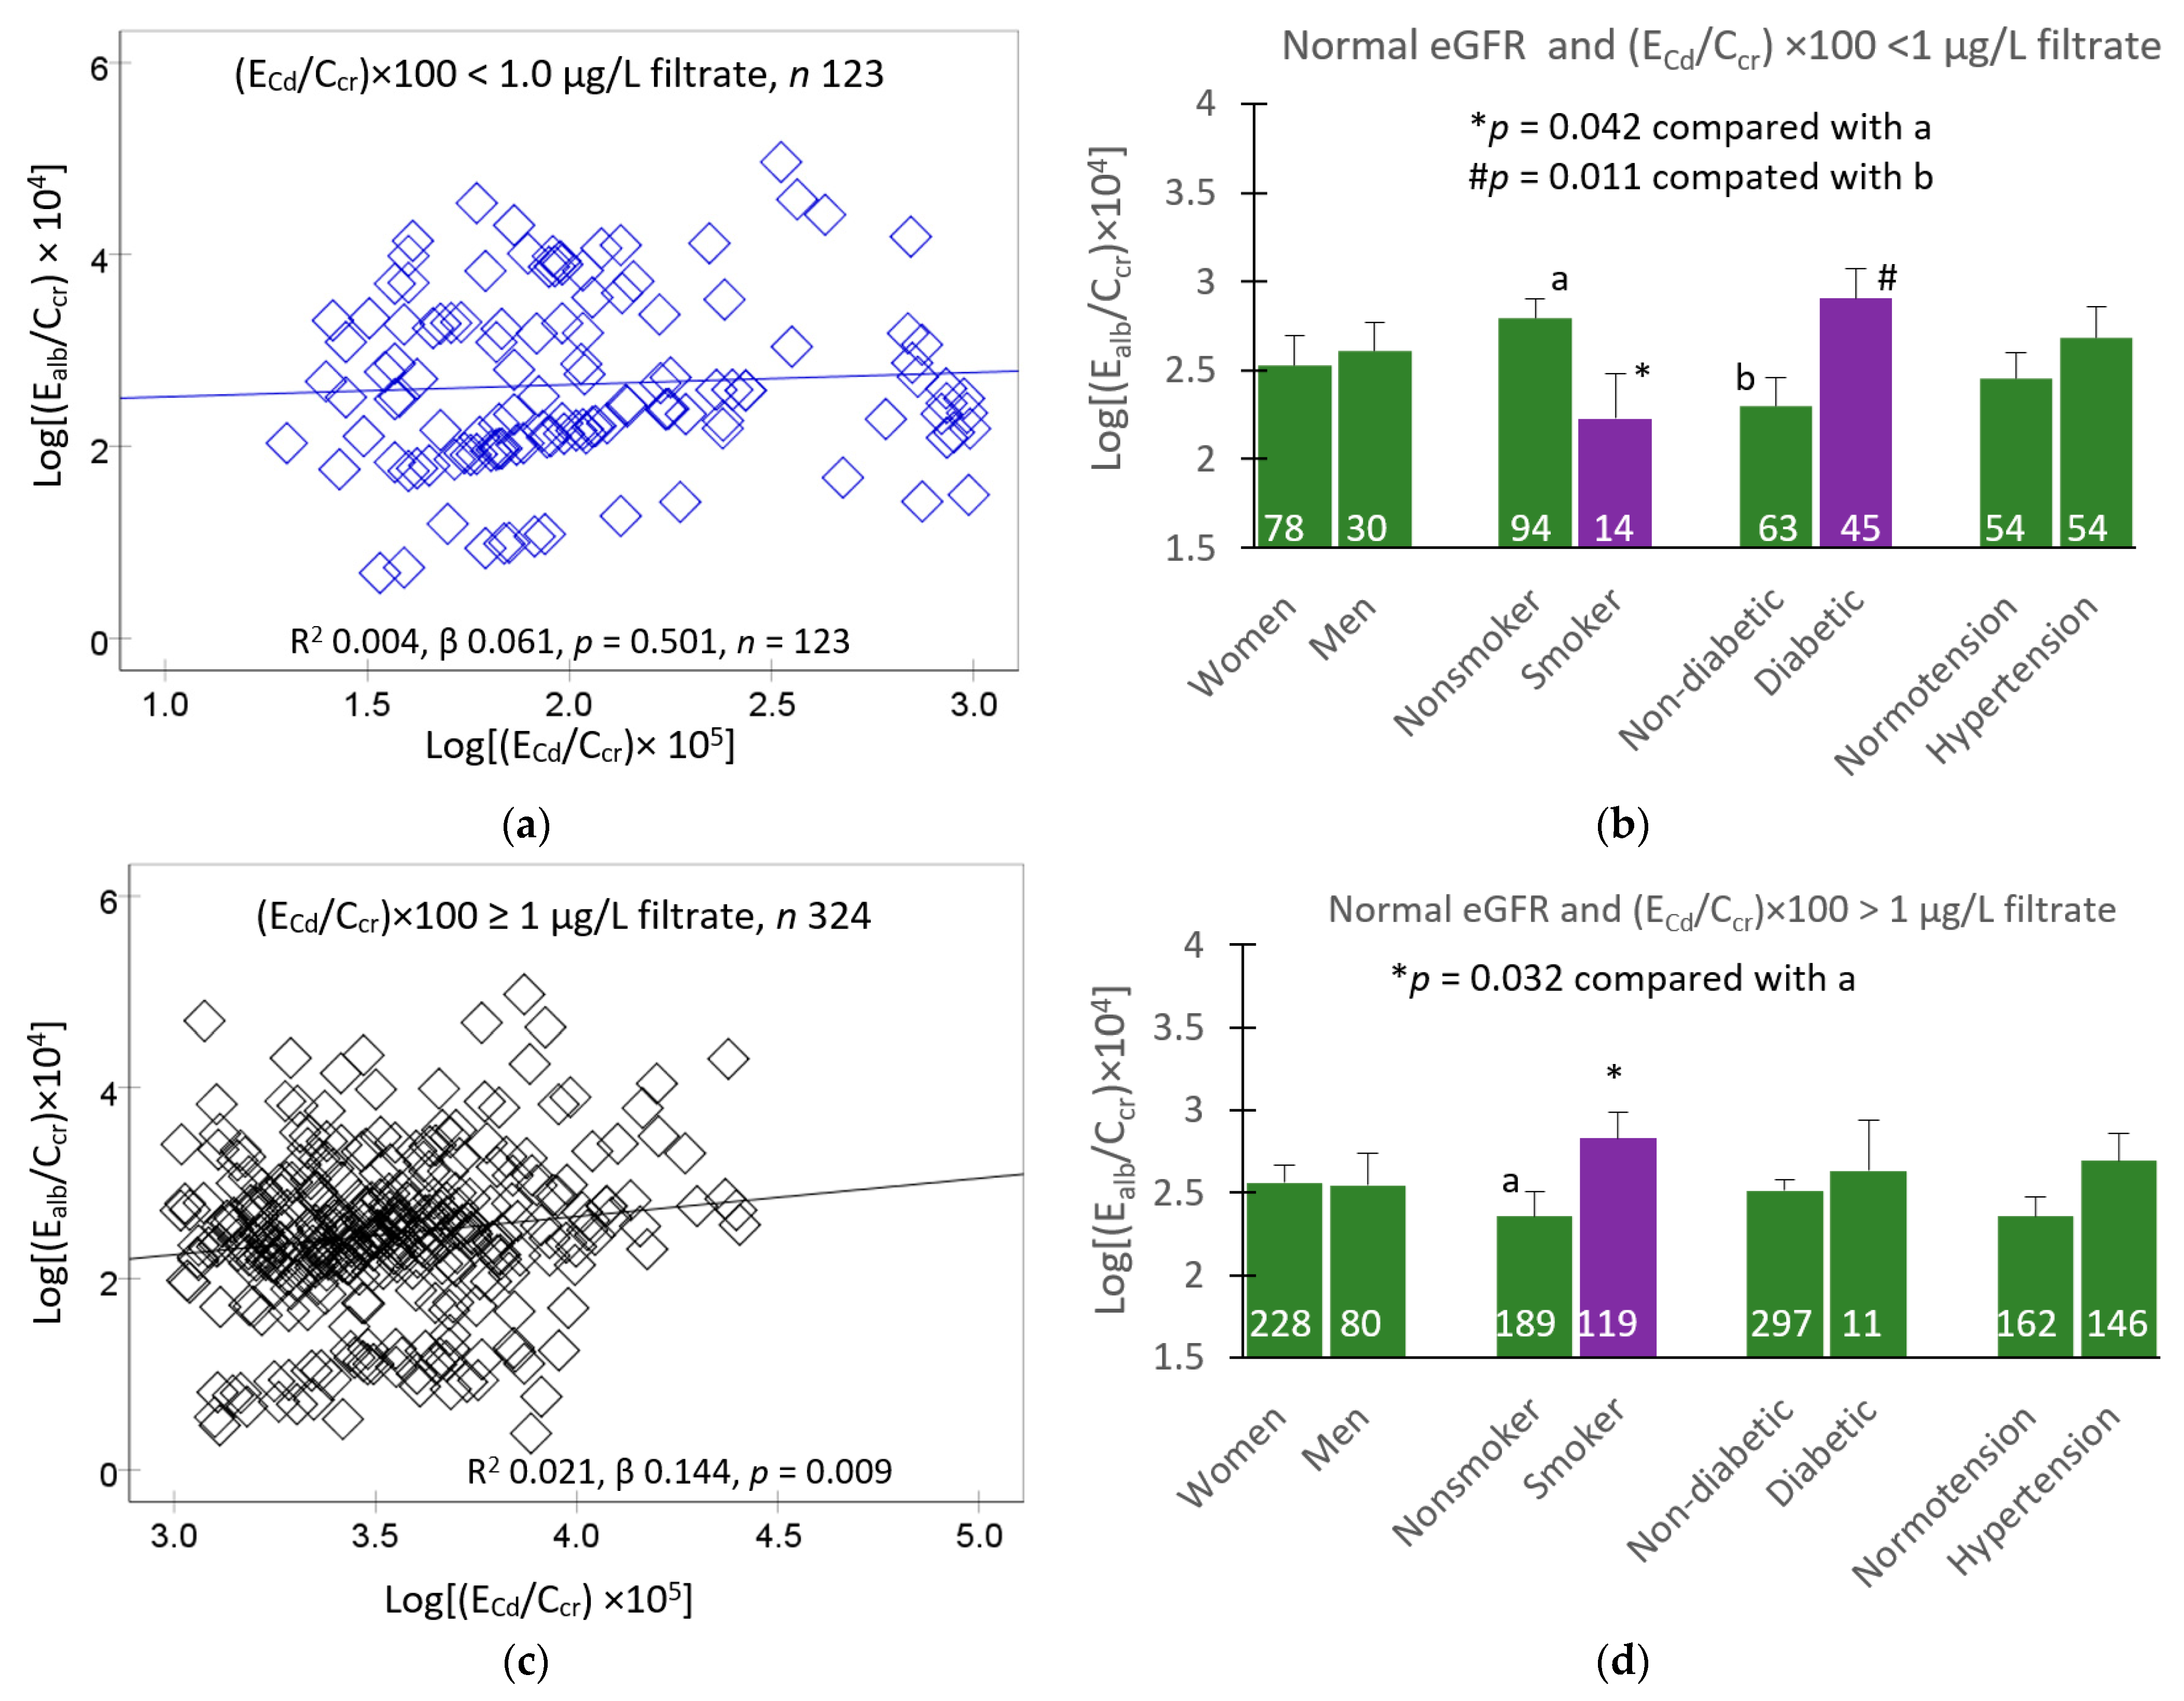
3.4. Multiple Regression Analysis of Albumin Excretion Rate

We used multiple regression analysis to identify if ECd/Ccr and other independent variables predicted rising Ealb/Ccr. We included eGFR in regression models to evaluate if functioning nephrons, indicated by eGFR values, had an independent effect on Ealb/Ccr. Results are provided in Table 5.
In the low and medium Cd burden groups, neither ECd/Ccr nor eGFR showed a significant association with Ealb/Ccr. However, diabetes and hypertension predicted Ealb/Ccr in the low Cd burden group, while BMI was a sole predictor of Ealb/Ccr in the medium Cd burden group.
In the high Cd burden group, ECd/Ccr and eGFR both were associated with Ealb/Ccr. There was an inverse association between eGFR and Ealb/Ccr (β = −0.214), while ECd/Ccr showed a direct relationship with Ealb/Ccr (β = 0.173). All other six independent variables did not have a significant effect on Ealb/Ccr.
Of note, the relationship between albumin excretion and eGFR was obscure, when Ealb was normalized to Ecr (Ealb/Ecr). As data in Table S2 indicate, Ealb/Ecr did not show a significant inverse association with eGFR (β = −0.092, p = 0.078).
We next conducted another multiple regression analysis to evaluate associations of ECd/Ccr. eGFR and other independent variables on Ealb/Ccr in participants with normal kidney function (eGFR > 60 mL/min/1.73 m2) and those with a sign of CKD (eGFR ≤ 60 mL/min/1.73 m2). Results are provided in Table 6.
Ealb/Ccr was inversely associated with eGFR (β = −0.188) when all subjects were included in an analysis. In a subgroup analysis, no association was observed between Ealb/Ccr and eGFR in those with normal kidney function; there was a very strong inverse association of these two variables in those with CKD (β = −0.637).
In a subsequent analysis, scatterplots were used together with a univariate analysis to quantify the independent effects of ECd/Ccr, eGFR, diabetes and hypertension on Ealb/Ccr. Covariate adjusted mean Ealb/Ccr values were obtained for various subgroups, as shown in Figure 2.
In the (ECd/Ccr) ×100 < 1 µg/L filtrate group (Figure 2a), a scatterplot indicated that the correlation of Ealb/Ccr and ECd/Ccr was statistically insignificant. However, in an analysis restricted to those with normal eGFR, differences in Ealb/Ccr were observed in smokers and those with diabetes after adjustment for covariates and interactions (Figure 2b).
In the (ECd/Ccr) × 100 ≥ 1 µg/L filtrate group (Figure 2c), a scatterplot indicated a statistically significant relationship between Ealb/Ccr and ECd/Ccr. An increment of Ealb/Ccr was observed in smokers in an analysis restricted to those with normal eGFR after adjustment for covariates and interactions (Figure 2d).

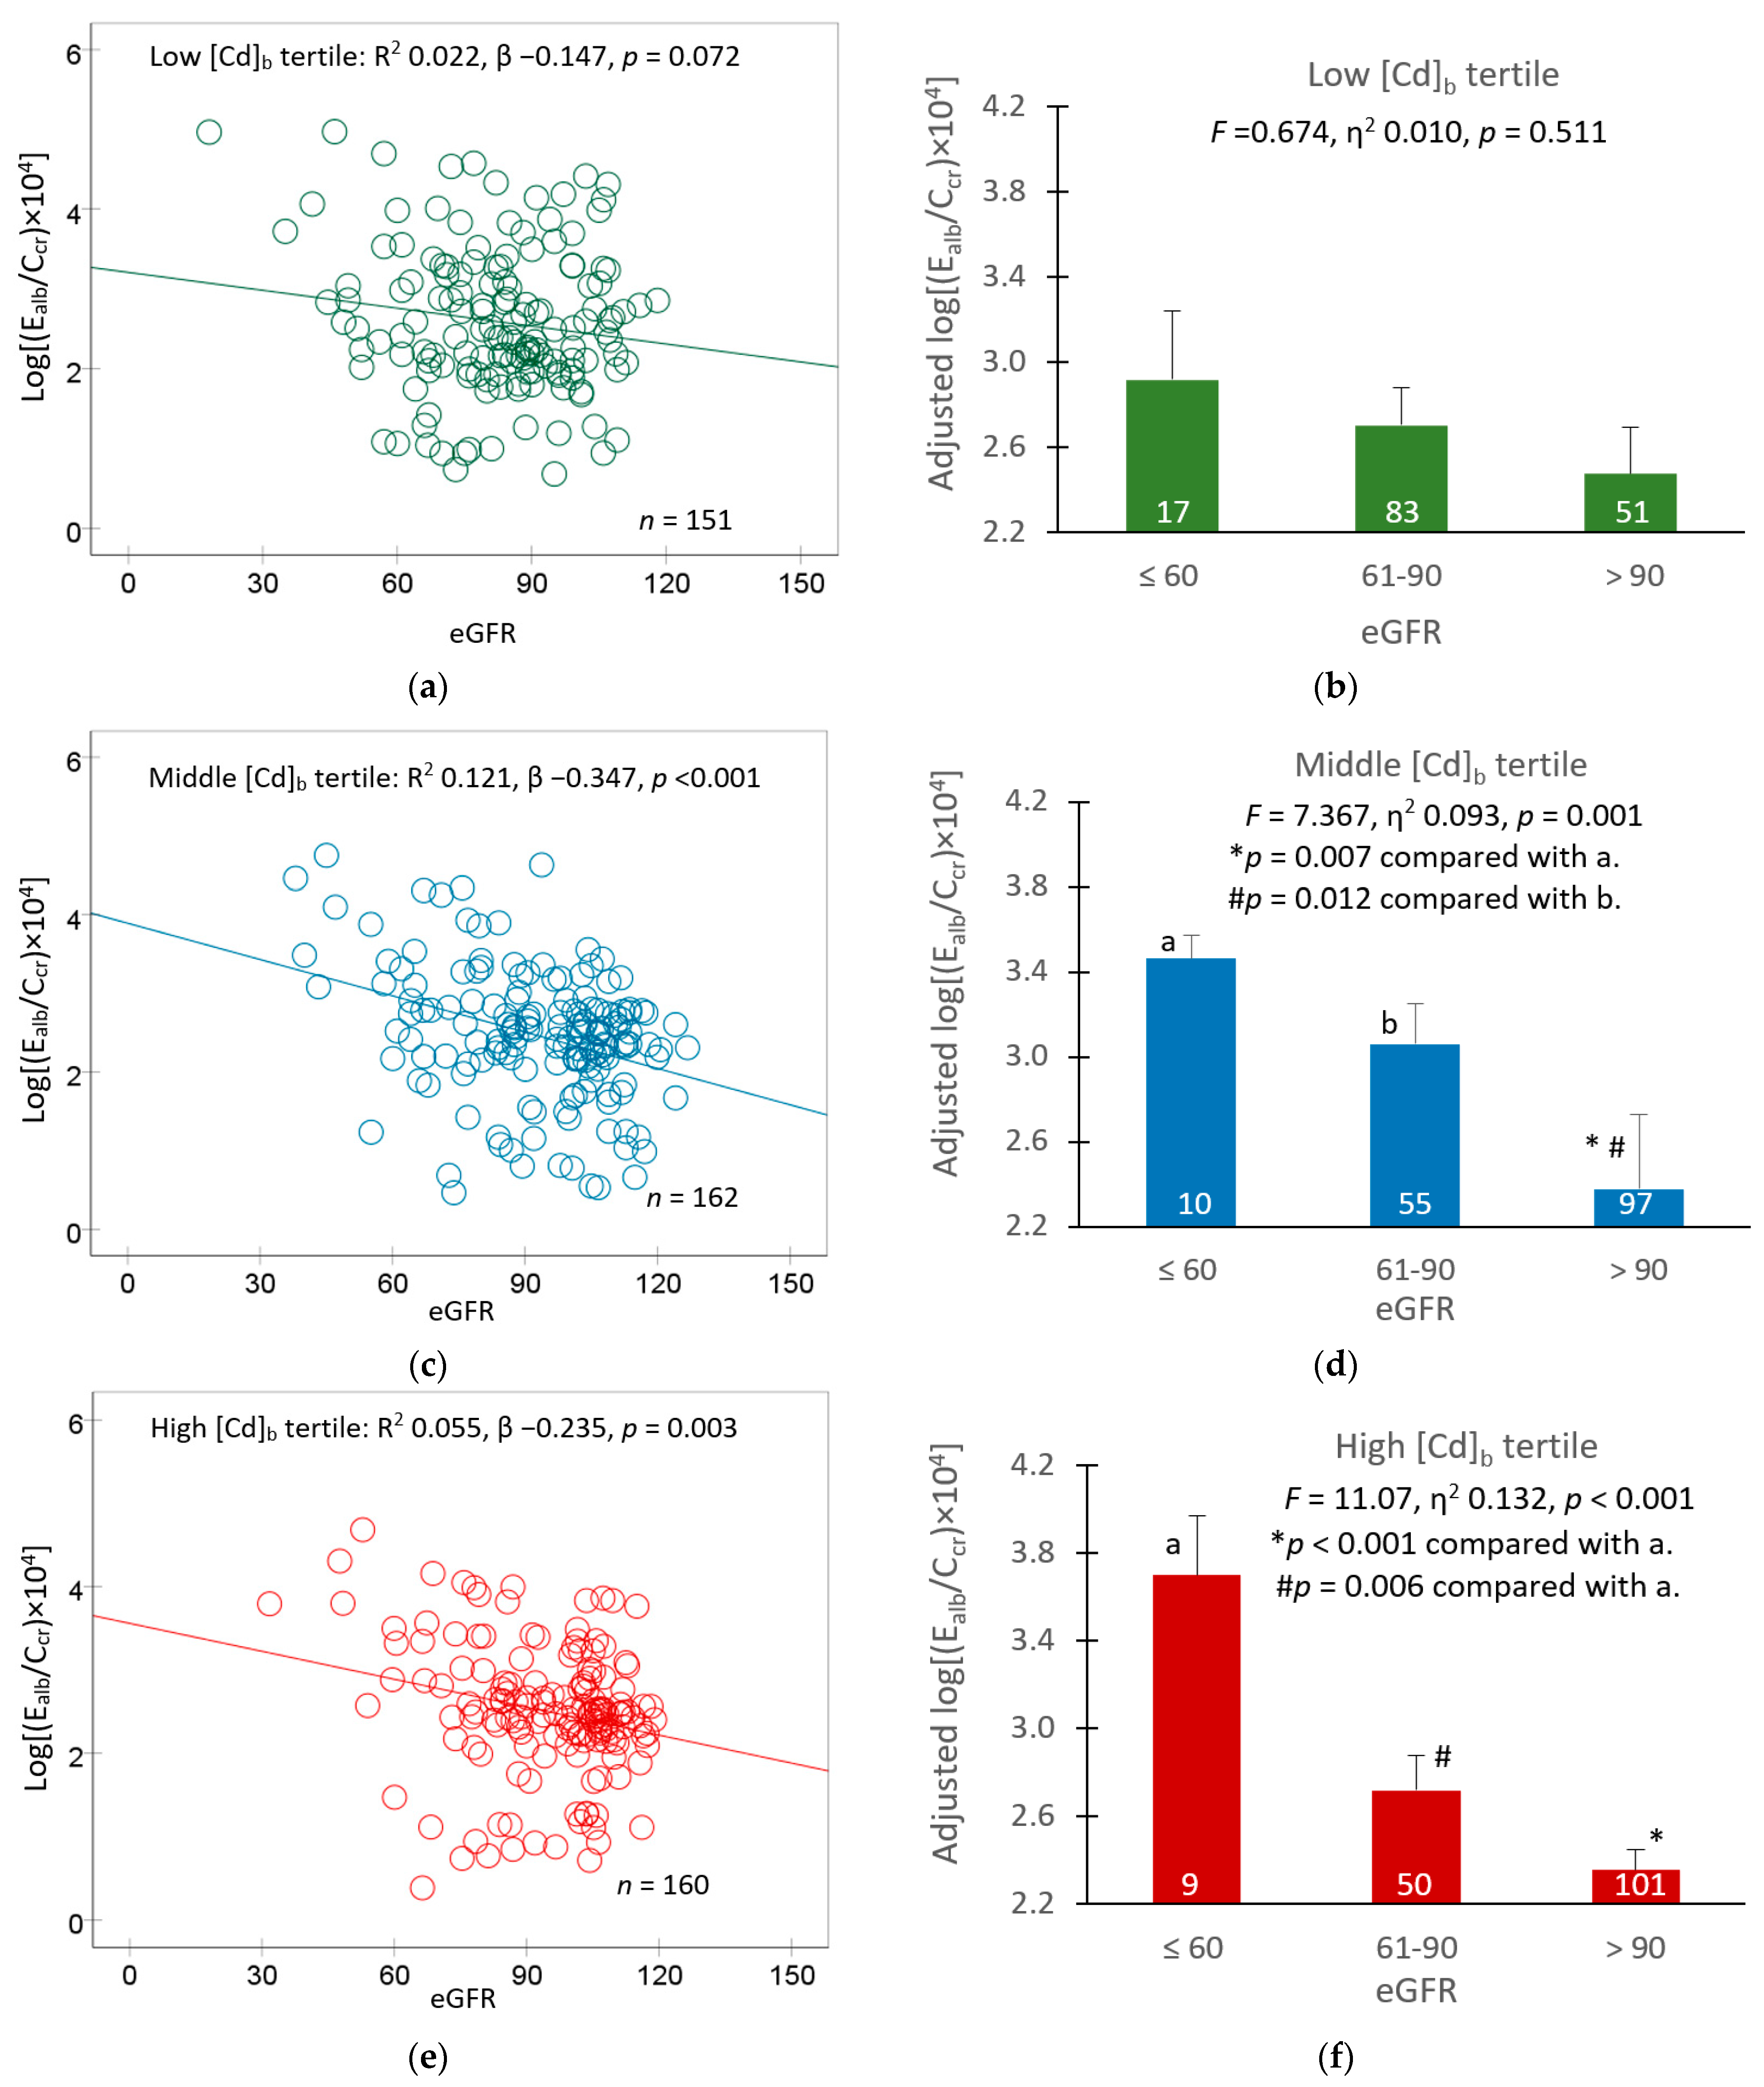
3.5. Blood Cadmium and eGFR as Predictors of Albuminuria

Table 7 provides the results of the logistic regression analysis that evaluated if [Cd]b, like ECd, predicted an increase in risk of abnormally high Ealb, defined as (Ealb/Ccr) × 100 ≥ 20 µg/L filtrate.
In all subjects, eGFR, diabetes, hypertension and [Cd]b were independent variables showing associations with the POR for albuminuria. Comparing those with [Cd]b < 0.82 µg/L, POR values for albuminuria were increased by 2.4-fold and 2.7-fold in those with [Cd]b of 0.83–2.63 and ≥2.64 µg/L, respectively. For every 1 mL/min/1.73 m2 loss of eGFR, the POR for albuminuria rose by 4.3%. There was no effect of Cd on albuminuria in an analysis with Ecr-normalized data (Table S3).
Among women, there was a [Cd]b-related increment of the POR for albuminuria. The POR values for high albuminuria were increased 3.4-fold and 3.8-fold in those with middle and high [Cd]b tertiles, respectively. In addition, eGFR, diabetes and hypertension were independent variables showing associations with the POR for albumin in women. For every 1 mL/min/1.73 m2 loss of eGFR, the POR for albuminuria rose by 4.5%.
Among men, [Cd]b did not show an association with POR for albuminuria, while eGFR did. For every 1 mL/min/1.73 m2 loss of eGFR, the POR for albuminuria rose by 4.5%, similar to the effect size found in women.
In a subsequent analysis, covariate adjusted mean Ealb/Ccr values were obtained for groups of participants with different eGFR levels (≤60, 61–90 and >90 mL/min/1.73 m2) to reveal an effect of GFR loss, reflected by a reduction in eGFR. Results are shown in Figure 3.
In the low [Cd]b tertile group, the relationship between Ealb/Ccr and eGFR was statistically insignificant (Figure 3a). Similarly, the covariate adjusted mean Ealb/Ccr values did not show a significant variation across three eGFR subgroups.
In the middle and high [Cd]b tertile groups, an inverse relationship was observed between Ealb/Ccr and eGFR (Figure 3c,e); an effect of GFR loss on Ealb/Ccr was apparent (Figure 3d,f). In these two [Cd]b tertile groups, the mean Ealb/Ccr value was highest, middle and lowest in those with eGFR ≤ 60, 60–90 and > 90 mL/min/1.73 m2, respectively.

4. Discussion

Herein, we used the eGFR decline as a primary endpoint in our attempt to define a toxic accumulation level of Cd in the kidney. We focused on this eGFR because attenuation of eGFR decline is employed in clinical trials to evaluate the effects of treatment of CKD [1,2]. Albuminuria was concurrently examined because it has often been associated with Cd exposure, along with low eGFR [4]. Previous studies show that the burden of Cd as µg/g kidney tissue weight increases with age [39,40,41]. They show also that sufficient tubular damage from the Cd accumulation reduces the GFR, leading to nephron atrophy and a decreasing GFR as a result [20,22,42,43]. We hypothesized that this eGFR effect of Cd occurs at a very low kidney burden, producing ECd/Ecr below 5.24 µg/g creatinine, which is the current World Health Organization health-based exposure limit, detailed in Section 4.3. It is noteworthy that ECd itself is indicative of tubular cell injury and death [3,20] and that ECd/Ecr of 5.24 µg/g creatinine signifies extensive tubular cell damage and death.
We analysed data from 482 Thai nationals, of which 8.1% had low eGFR and 15% had albuminuria (ACR criterion). Nearly half (48.3%) had hypertension, while 29.7% reported to be smokers and 18.3% had diabetes. There was a 1250-fold difference in ECd/Ccr values, ranging from 0.0002 to 0.25 µg/L filtrate (mean 0.0032 µg/L filtrate). There was a 667-fold difference in [Cd]b, ranging between 0.03 and 20 µg/L (mean 2.60 µg/L). The wide ranges of these Cd burden and exposure matrices together with sufficiently high numbers of smokers and those with diabetes and hypertension provide an ideal scenario to define with certainty a toxic threshold level of Cd.
Like ECd/Ccr, ECd/Ecr showed a large variation (1033-fold) and the mean ECd/Ecr (range) was 4.05 (0.03–31) µg/g creatinine (Table 1). However, in distinction from ECd/Ccr, there was no significant association between eGFR and ECd/Ecr (Table S1). Consequently, a dose–response analysis was not possibly determined. Also, when Ealb was adjusted to creatinine excretion (Ecr) as Ealb/Ecr or ACR, an inverse relationship of ACR and eGFR was obscure (Table S2) and there was no effect of Cd on POR for albuminuria (Table S3).

4.1. Effects of Cadmium on eGFR

A direct relationship between eGFR and ECd/Ccr was seen in women and men with a low-Cd burden (ECd/Ccr ≤ 0.014 µg/L filtrate in women and ≤0.012 µg/L filtrate in men) (Figure 1c,d). However, such eGFR/ECd/Ccr relationship was weak and became statistically insignificant when covariates were adjusted. In comparison, eGFR showed an inverse association with ECd/Ccr when ECd/Ccr values rose to levels > 0.014 µg/L filtrate in women and >0.012 µg/L filtrate in men (Figure 1e,f and Table 3). In reflecting a dose–response relationship, eGFR was more closely associated with ECd/Ccr in the high burden group (β = −0.349) compared to the medium Cd burden group (β = −0.284). An association of eGFR and ECd/Ccr was statistically insignificant in the low Cd burden group.
Cd burden, diabetes and age were three of seven variables that affected the POR for low eGFR (Table 4). In those with medium, high Cd burden and diabetes, the POR for low eGFR rose by 8.3-fold, 3.6-fold and 3.0-fold, respectively. Per every one year rise in age, there was an 11.8% (95% CI, 6.2, 17.6) increase in the POR for low eGFR.
In summary, no effect of Cd on eGFR was found in those with ECd/Ccr values < 0.012 µg/L filtrate. This ECd/Ccr value of 0.012 µg/L filtrate is in ranges with the no-observed-adverse-effect level (NOAEL) equivalent of ECd/Ccr at 0.010–0.024 µg/L filtrate, obtained by the benchmark dose method [44].

4.2. Effects of Cadmium on Prevalence of Albuminuria

Most albumin (~80%) in the glomerular ultrafiltrate is reabsorbed in the S1 sub-segment of the proximal tubule, where the receptor-mediated endocytosis involving the megalin/cubillin system is located [45,46,47]. Reabsorption of albumin also occurs in the distal tubule and collecting duct, where the process is mediated by the NGAL/lipocalin-2 receptor system [48,49,50]. Experimental studies show that albuminuria resulted from Cd selectively disabled albumin endocytosis which is mediated by the cubilin/megalin receptor system [51] and that Cd may diminish expression of megalin and ClC5 channels [52]. However, data in Table 1 indicate that albuminuria was more prevalent in the low eGFR compared to normal eGFR groups, thereby suggesting that low eGFR could be a risk factor for albuminuria. We examined this phenomenon further, as described below.
In multiple regressions (Table 5), both eGFR and ECd/Ccr appeared to have an effect on Ealb/Ccr. In logistic regression (Table 6), the POR for albuminuria rose by 4.3% (95% CI: 2.6, 6.1) for every 1 mL/min/1.73 m2 loss of eGFR and it was increased by 2.4-fold to 2.7-fold in those who had [Cd]b ≥ 0.83 µg/L. A similar effect size of Cd on eGFR was seen in women and men, although the causes of albuminuria differed (Table 6). Additional evidence that Cd may affect eGFR and albumin reuptake simultaneously comes from a covariance analysis, where 9.3% to 13.2% of Ealb/Ccr variation could be attributable to eGFR levels in those with [Cd]b > 0.83 µg/L (Figure 3d,f). eGFR levels did not explain the variability of Ealb/Ccr in the low [Cd]b tertile group (F = 0.674, η2 0.010, p = 0.511) (Figure 3b).
The results described above could be interpreted to suggest that albuminuria could be a consequence of the Cd-induced destruction of nephrons, together with a direct effect on the tubular reabsorption of albumin, possibly through the cubilin/megalin receptor system of endocytosis. These Cd effects were not found in those who had [Cd]b < 0.83 µg/L.

4.3. A Independent Effect of Smoking on Albuminuria

Smoking forms a significant Cd exposure source as cigarette smoke contains Cd in volatile metallic and oxide (CdO) forms, which have transmission rates 5 to 10 times higher than those that enter through the gut [53,54,55]. Adverse kidney outcomes associated with smoking have been noted in the general populations [56,57]. In the present study, evidence for an independent effect of smoking has emerged from analysis of covariance of albumin excretion data from those with normal kidney function. In Figure 2d, the mean Ealb/Ccr was higher in smokers compared to non-smokers of the same age, BMI and overall Cd burden [(ECd/Ccr) × 100 ≥ 1 µg/L filtrate]. This finding suggested that a possible Cd independent effect of smoking on albuminuria. Other constitutes of cigarette smoke are likely to have a role. In a Dutch prospective study involving 231 diabetic patients, Cd and active smoking were both found to be associated with progressive eGFR decline [19].
Of further note, the opposite effect was observed in the low Cd burden group [(ECd/Ccr) × 100 < 1 µg/L filtrate] (Figure 2b), where the covariate adjusted mean Ealb/Ccr was lower in smokers than nonsmokers of the same low Cd burden. Cd-induced albuminuria may be mitigated in smokers by substances that accompany Cd. Tin, for example, has blood pressure-lowering effects [58,59]. However, in our study, there was a high degree of statistical uncertainty due to a small number of smokers (n = 14) who had a low Cd burden (Figure 2b); hence, a further study is required to fully explore this.
An effect of diabetes on albumin excretion was also demonstratable in the present study; this effect was evident only in the low Cd burden group (Figure 2b). It is possible that we have underestimated the amount of albumin in urine samples from subjects with diabetes and high Cd burden (Figure 2d). The immunoturbidimetric method used has been reported to be unable to detect albumin molecules with altered conformation, which may be produced in people with CKD and diabetes [34].

4.4. Threshold-Based Exposure Guidelines

For most people, exposure to Cd is inevitable because the metal is present in nearly all food types. In Japan, for example, rice and its products, green vegetables and cereals and seeds plus potatoes constituted, respectively, to 38%, 17% and 11% of total dietary Cd exposure [60]. In response, health guidance such as a tolerable intake level of Cd and a reference dose (RfD) were determined [61,62,63,64]. The Joint FAO/WHO Expert Committee on Food Additives and Contaminants (JECFA) suggested a tolerable monthly intake (TMI) of Cd to be 25 μg per kg body weight per month, equivalent to 0.83 μg per kg body weight per day (58 µg/day for a 70 kg person), and ECd/Ecr of 5.24 μg/g creatinine was adopted as a nephrotoxicity threshold value [63]. Both figures were based on a risk assessment model based solely on a β2-microglobulin excretion rate (Eβ2M/Ecr) ≥ 300 μg/g creatinine, termed tubular proteinuria, as a toxic endpoint.
The European Food Safety Authority (EFSA) used also the β2M endpoint but with the inclusion of an uncertainty factor (safety margin). The EFSA suggested ECd/Ecr of 1 μg/g creatinine to be the toxicity threshold and 0.36 μg/kg body weight per day (25 µg/day for a 70 kg person) as the RfD [64]. The higher JECFA guidelines are adopted by most countries. These health guideline values exceed the nephrotoxicity threshold identified in the present study. In theory, exposure guidelines that provide sufficient health protection should only be determined from the most sensitive endpoint with consideration given to subpopulations with increased susceptibility [54] and the most recent scientific knowledge should be considered.
Of concern, eGFR decline due to Cd nephropathy has increasingly been observed in both children and adult populations. Lower eGFR values were found to be associated with higher Cd excretion rates in studies from Guatemala [65] and Myanmar [66]. In a prospective cohort study of Bangladeshi preschool children, an inverse relationship between ECd and kidney volume was seen in children at 5 years of age. This was in addition to a decrease in eGFR [67]. ECd was inversely associated with eGFR, especially in girls. In another prospective cohort study, the reported mean for Cd intake among Mexican children was 4.4 µg/d at the baseline and rose to 8.1 µg/d after nine years, when such Cd intake levels showed a marginally inverse association with eGFR [68].

5. Conclusions

Based on a dose–response relationship analysis of data from 482 non-occupationally exposed persons with a 1250-fold difference in Cd burden and a 667-fold difference in levels of blood Cd, environmental exposure to Cd was confirmed to be closely associated with a declining GFR and albuminuria. An independent effect of smoking on albuminuria has also been observed in smokers who had normal kidney function. The current World Health Organization Cd exposure limit of 5.24 µg/g creatinine (ECd/Ecr), which is solely based on an increment of excretion of β2-microglobulin above 300 µg/g creatinine, underestimates the level at which Cd induces kidney damage. Our results show that when a declining GFR is considered along with albuminuria, the no-observed-adverse-effect level (NOAEL) equivalent is 0.01–0.02 µg/g creatinine. Now is the time to acknowledge there is no safe level of Cd exposure.

Supplementary Materials

The following supporting information can be downloaded at: https://www.mdpi.com/article/10.3390/toxics11090755/s1, Table S1: Predictors of eGFR based on cadmium excretion rate normalized to creatinine excretion (ECd/Ecr); Table S2: Predictors of albumin excretion rate normalized to creatinine excretion (Ealb/Ecr); Table S3: Prevalence odds ratios for low eGFR and albuminuria in relation to cadmium excretion rate normalized to creatinine excretion (ECd/Ecr).

Author Contributions

Conceptualization, S.S.; methodology, S.S. and S.Y.; formal analysis, S.S.; investigation, S.Y., P.P., and T.K.; resources, G.C.G. and D.A.V.; writing—original draft preparation, S.S.; writing—review and editing, G.C.G. and D.A.V.; project administration, S.S. and S.Y. All authors have read and agreed to the published version of the manuscript.

Funding

This research received no external funding.

Institutional Review Board Statement

This is not applicable for the present study, which used archived data [24,25].

Informed Consent Statement

Informed consent was obtained from all participants in the study prior to their participation.

Data Availability Statement

All data are contained within this article.

Acknowledgments

This work was supported with resources from the Centre for Kidney Disease Research, Translational Research Institute, and the Department of Kidney and Transplant Services, Princess Alexandra Hospital.

Conflicts of Interest

The authors declare no conflict of interest.

References

  1. Levey, A.S.; Becker, C.; Inker, L.A. Glomerular filtration rate and albuminuria for detection and staging of acute and chronic kidney disease in adults: A systematic review. JAMA 2015, 313, 837–846. [Google Scholar] [CrossRef] [PubMed]
  2. Kalantar-Zadeh, K.; Jafar, T.H.; Nitsch, D.; Neuen, B.L.; Perkovic, V. Chronic kidney disease. Lancet 2021, 398, 786–802. [Google Scholar] [CrossRef] [PubMed]
  3. Satarug, S.; Vesey, D.A.; Gobe, G.C.; Phelps, K.R. Estimation of health risks associated with dietary cadmium exposure. Arch. Toxicol. 2023, 97, 329–358. [Google Scholar] [CrossRef] [PubMed]
  4. Madrigal, J.M.; Ricardo, A.C.; Persky, V.; Turyk, M. Associations between blood cadmium concentration and kidney function in the U.S. population: Impact of sex, diabetes and hypertension. Environ. Res. 2018, 169, 180–188. [Google Scholar] [CrossRef]
  5. Xiao, L.; Li, W.; Zhu, C.; Yang, S.; Zhou, M.; Wang, B.; Wang, X.; Wang, D.; Ma, J.; Zhou, Y.; et al. Cadmium exposure, fasting blood glucose changes, and type 2 diabetes mellitus: A longitudinal prospective study in China. Environ. Res. 2021, 192, 110259. [Google Scholar] [CrossRef]
  6. Schwartz, G.G.; Il’yasova, D.; Ivanova, A. Urinary cadmium, impaired fasting glucose, and diabetes in the NHANES III. Diabetes Care 2003, 26, 468–470. [Google Scholar] [CrossRef]
  7. Wallia, A.; Allen, N.B.; Badon, S.; El Muayed, M. Association between urinary cadmium levels and prediabetes in the NHANES 2005–2010 population. Int. J. Hyg. Environ. Health 2014, 217, 854–860. [Google Scholar] [CrossRef]
  8. Little, B.B.; Reilly, R.; Walsh, B.; Vu, G.T. Cadmium is associated with type 2 diabetes in a Superfund Site Lead Smelter Community in Dallas, Texas. Int. J. Environ. Res. Public Health 2020, 17, 4558. [Google Scholar] [CrossRef]
  9. Guo, F.F.; Hu, Z.Y.; Li, B.Y.; Qin, L.Q.; Fu, C.; Yu, H.; Zhang, Z.L. Evaluation of the association between urinary cadmium levels below threshold limits and the risk of diabetes mellitus: A dose-response meta-analysis. Environ. Sci. Pollut. Res. Int. 2019, 26, 19272–19281. [Google Scholar] [CrossRef]
  10. Filippini, T.; Wise, L.A.; Vinceti, M. Cadmium exposure and risk of diabetes and prediabetes: A systematic review and dose-response meta-analysis. Environ. Int. 2022, 158, 106920. [Google Scholar] [CrossRef]
  11. Satarug, S.; Nishijo, M.; Ujjin, P.; Vanavanitkun, Y.; Moore, M.R. Cadmium-induced nephropathy in the development of high blood pressure. Toxicol. Lett. 2005, 157, 57–68. [Google Scholar] [CrossRef] [PubMed]
  12. Franceschini, N.; Fry, R.C.; Balakrishnan, P.; Navas-Acien, A.; Oliver-Williams, C.; Howard, A.G.; Cole, S.A.; Haack, K.; Lange, E.M.; Howard, B.V.; et al. Cadmium body burden and increased blood pressure in middle-aged American Indians: The Strong Heart Study. J. Hum. Hypertens. 2017, 31, 225–230. [Google Scholar] [CrossRef] [PubMed]
  13. Kwon, J.A.; Park, E.; Kim, S.; Kim, B. Influence of serum ferritin combined with blood cadmium concentrations on blood pressure and hypertension: From the Korean National Health and Nutrition Examination Survey. Chemosphere 2022, 288, 132469. [Google Scholar] [CrossRef] [PubMed]
  14. Garner, R.E.; Levallois, P. Associations between cadmium levels in blood and urine, blood pressure and hypertension among Canadian adults. Environ. Res. 2017, 155, 64–72. [Google Scholar] [CrossRef]
  15. Kaneda, M.; Wai, K.M.; Kanda, A.; Ando, M.; Murashita, K.; Nakaji, S.; Ihara, K. Low Level of Serum Cadmium in Relation to Blood Pressures Among Japanese General Population. Biol. Trace Element Res. 2021, 200, 67–75. [Google Scholar] [CrossRef]
  16. Oliver-Williams, C.; Howard, A.G.; Navas-Acien, A.; Howard, B.V.; Tellez-Plaza, M.; Franceschini, N. Cadmium body burden, hypertension, and changes in blood pressure over time: Results from a prospective cohort study in American Indians. J. Am. Soc. Hypertens. 2018, 12, 426–437.e9. [Google Scholar] [CrossRef]
  17. Crowley, S.D.; Coffman, T.M. The inextricable role of the kidney in hypertension. J. Clin. Investig. 2014, 124, 2341–2347. [Google Scholar]
  18. Satarug, S.; Vesey, D.A.; Gobe, G.C. Kidney cadmium toxicity, diabetes and high blood pressure: The perfect storm. Tohoku J. Exp. Med. 2017, 241, 65–87. [Google Scholar] [CrossRef]
  19. Oosterwijk, M.M.; Hagedoorn, I.J.M.; Maatman, R.G.H.J.; Bakker, S.J.L.; Navis, G.; Laverman, G.D. Cadmium, active smoking and renal function deterioration in patients with type 2 diabetes. Nephrol. Dial. Transpl. 2023, 38, 876–883. [Google Scholar] [CrossRef]
  20. Satarug, S.; Vesey, D.A.; Ruangyuttikarn, W.; Nishijo, M.; Gobe, G.C.; Phelps, K.R. The source and pathophysiologic significance of excreted cadmium. Toxics 2019, 7, 55. [Google Scholar] [CrossRef]
  21. Wolf, C.; Strenziok, R.; Kyriakopoulos, A. Elevated metallothionein-bound cadmium concentrations in urine from bladder carcinoma patients, investigated by size exclusion chromatography-inductively coupled plasma mass spectrometry. Anal. Chim. Acta 2009, 631, 218–222. [Google Scholar] [CrossRef] [PubMed]
  22. Satarug, S.; Vesey, D.A.; Nishijo, M.; Ruangyuttikarn, W.; Gobe, G.C.; Phelps, K.R. The effect of cadmium on GFR is clarified by normalization of excretion rates to creatinine clearance. Int. J. Mol. Sci. 2021, 22, 1762. [Google Scholar] [CrossRef]
  23. Phelps, K.R.; Gosmanova, E.O. A generic method for analysis of plasma concentrations. Clin. Nephrol. 2020, 94, 43–49. [Google Scholar] [CrossRef]
  24. Satarug, S.; Swaddiwudhipong, W.; Ruangyuttikarn, W.; Nishijo, M.; Ruiz, P. Modeling cadmium exposures in low- and high-exposure areas in Thailand. Environ. Health Perspect. 2013, 121, 531–536. [Google Scholar] [CrossRef] [PubMed]
  25. Yimthiang, S.; Pouyfung, P.; Khamphaya, T.; Kuraeiad, S.; Wongrith, P.; Vesey, D.A.; Gobe, G.C.; Satarug, S. Effects of en-vironmental exposure to cadmium and lead on the risks of diabetes and kidney dysfunction. Int. J. Environ. Res. Public Health 2022, 19, 2259. [Google Scholar] [CrossRef]
  26. Nishijo, M.; Nogawa, K.; Suwazono, Y.; Kido, T.; Sakurai, M.; Nakagawa, H. Lifetime cadmium exposure and mortality for renal diseases in residents of the cadmium-polluted Kakehashi River Basin in Japan. Toxics 2020, 8, 81. [Google Scholar] [CrossRef] [PubMed]
  27. Zarcinas, B.A.; Pongsakul, P.; McLaughlin, M.J.; Cozens, G. Heavy metals in soils and crops in Southeast Asia. 2. Thailand. Environ. Geochem. Health 2004, 26, 359–371. [Google Scholar] [CrossRef]
  28. Suwatvitayakorn, P.; Ko, M.S.; Kim, K.W.; Chanpiwat, P. Human health risk assessment of cadmium exposure through rice consumption in cadmium-contaminated areas of the Mae Tao sub-district, Tak, Thailand. Environ. Geochem. Health 2020, 42, 2331–2344. [Google Scholar] [CrossRef]
  29. Swaddiwudhipong, W.; Nguntra, P.; Kaewnate, Y.; Mahasakpan, P.; Limpatanachote, P.; Aunjai, T.; Jeekeeree, W.; Punta, B.; Funkhiew, T.; Phopueng, I. Human health effects from cadmium exposure: Comparison between persons living in cad-mium-contaminated and non-contaminated areas in northwestern Thailand. Southeast Asian J. Trop. Med. Publ. Health 2015, 46, 133–142. [Google Scholar]
  30. Bloch, M.J.; Basile, J.N. Review of Recent Literature in Hypertension: Updated Clinical Practice Guidelines for Chronic Kidney Disease Now Include Albuminuria in the Classification System. J. Clin. Hypertens. 2013, 15, 865–867. [Google Scholar] [CrossRef]
  31. Hornung, R.W.; Reed, L.D. Estimation of average concentration in the presence of nondetectable values. Appl. Occup. Environ. Hyg. 1990, 5, 46–51. [Google Scholar] [CrossRef]
  32. Spencer, K. Analytical reviews in clinical biochemistry: The estimation of creatinine. Ann. Clin. Biochem. 1985, 23, 1–25. [Google Scholar] [CrossRef] [PubMed]
  33. Bargnoux, A.S.; Barrot, A.; Fesler, P.; Kuster, N.; Badiou, S.; Dupuy, A.M.; Ribstein, J.; Cristol, J.P. Evaluation of five immunoturbidimetric assays for urinary albumin quantification and their impact on albuminuria categorization. Clin. Biochem. 2014, 47, 250–253. [Google Scholar] [CrossRef] [PubMed]
  34. Kok, M.B.; Tegelaers, F.P.; van Dam, B.; van Rijn, J.L.; van Pelt, J. Carbamylation of albumin is a cause for discrepancies between albumin assays. Clin. Chim. Acta 2014, 434, 6–10. [Google Scholar] [CrossRef]
  35. Soveri, I.; Berg, U.B.; Björk, J.; Elinder, C.G.; Grubb, A.; Mejare, I.; Sterner, G.; Bäck, S.E.; SBU GFR Review Group. Measuring GFR: A systematic review. Am. J. Kidney Dis. 2014, 64, 411–424. [Google Scholar] [CrossRef]
  36. Sharma, S.; Smyth, B. From proteinuria to fibrosis: An update on pathophysiology and treatment options. Kidney Blood Press Res. 2021, 46, 411–420. [Google Scholar] [CrossRef]
  37. Levey, A.S.; Stevens, L.A.; Scmid, C.H.; Zhang, Y.; Castro, A.F., III; Feldman, H.I.; Kusek, J.W.; Eggers, P.; Van Lente, F.; Greene, T.; et al. A new equation to estimate glomerular filtration rate. Ann. Intern. Med. 2009, 150, 604–612. [Google Scholar] [CrossRef]
  38. White, C.A.; Allen, C.M.; Akbari, A.; Collier, C.P.; Holland, D.C.; Day, A.G.; Knoll, G.A. Comparison of the new and traditional CKD-EPI GFR estimation equations with urinary inulin clearance: A study of equation performance. Clin. Chim. Acta 2019, 488, 189–195. [Google Scholar] [CrossRef] [PubMed]
  39. Satarug, S.; Baker, J.R.; Reilly, P.E.; Moore, M.R.; Williams, D.J. Cadmium levels in the lung, liver, kidney cortex, and urine samples from Australians without occupational exposure to metals. Arch. Environ. Health 2002, 57, 69–77. [Google Scholar] [CrossRef]
  40. Elinder, C.G.; Lind, B.; Kjellström, T.; Linnman, L.; Friberg, L. Cadmium in kidney cortex, liver, and pancreas from Swedish autopsies. Estimation of biological half time in kidney cortex, considering calorie intake and smoking habits. Arch. Environ. Health 1976, 31, 292–302. [Google Scholar] [CrossRef]
  41. Barregard, L.; Sallsten, G.; Lundh, T.; Mölne, J. Low-level exposure to lead, cadmium and mercury, and histopathological findings in kidney biopsies. Environ. Res. 2022, 211, 113119. [Google Scholar] [CrossRef] [PubMed]
  42. Schnaper, H.W. The tubulointerstitial pathophysiology of progressive kidney disease. Adv. Chronic Kidney Dis. 2017, 24, 107–116. [Google Scholar] [CrossRef]
  43. Chevalier, R.L. The proximal tubule is the primary target of injury and progression of kidney disease: Role of the glomerulotubular junction. Am. J. Physiol. Ren. Physiol. 2016, 311, F145–F161. [Google Scholar] [CrossRef] [PubMed]
  44. Satarug, S.; Đorđević, A.B.; Yimthiang, S.; Vesey, D.A.; Gobe, G.C. The NOAEL equivalent of environmental cadmium exposure associated with GFR reduction and chronic kidney disease. Toxics 2022, 10, 614. [Google Scholar] [CrossRef] [PubMed]
  45. Gburek, J.; Konopska, B.; Gołąb, K. Renal handling of albumin-from early findings to current concepts. Int. J. Mol. Sci. 2021, 22, 5809. [Google Scholar] [CrossRef]
  46. Molitoris, B.A.; Sandoval, R.M.; Yadav, S.P.S.; Wagner, M.C. Albumin uptake and processing by the proximal tubule: Physiological, pathological, and therapeutic implications. Physiol. Rev. 2022, 102, 1625–1667. [Google Scholar] [CrossRef]
  47. Benzing, T.; Salant, D. Insights into glomerular filtration and albuminuria. N. Engl. J. Med. 2021, 384, 1437–1446. [Google Scholar] [CrossRef]
  48. Edwards, A.; Long, K.R.; Baty, C.J.; Shipman, K.E.; Weisz, O.A. Modelling normal and nephrotic axial uptake of albumin and other filtered proteins along the proximal tubule. J. Physiol. 2022, 600, 1933–1952. [Google Scholar] [CrossRef]
  49. Langelueddecke, C.; Roussa, E.; Fenton, R.A.; Wolff, N.A.; Lee, W.K.; Thévenod, F. Lipocalin-2 (24p3/neutrophil gelati-nase-associated lipocalin (NGAL) receptor is expressed in distal nephron and mediates protein endocytosis. J. Biol. Chem. 2012, 287, 159–169. [Google Scholar] [CrossRef]
  50. Dizi, E.; Hasler, U.; Nlandu-Khodo, S.; Fila, M.; Roth, I.; Ernandez, T.; Doucet, A.; Martin, P.Y.; Feraille, E.; de Seigneux, S. Albuminuria induces a proinflammatory and profibrotic response in cortical collecting ducts via the 24p3 receptor. Am. J. Physiol. Renal Physiol. 2013, 305, F1053–F1063. [Google Scholar] [CrossRef]
  51. Santoyo-Sánchez, M.P.; Pedraza-Chaverri, J.; Molina-Jijón, E.; Arreola-Mendoza, L.; Rodríguez-Muñoz, R.; Barbier, O.C. Impaired endocytosis in proximal tubule from subchronic exposure to cadmium involves angiotensin II type 1 and cubilin receptors. BMC Nephrol. 2013, 14, 211. [Google Scholar] [CrossRef] [PubMed]
  52. Gena, P.; Calamita, G.; Guggino, W.B. Cadmium impairs albumin reabsorption by down-regulating megalin and ClC5 channels in renal proximal tubule cells. Environ. Health Perspect. 2010, 118, 1551–1556. [Google Scholar] [CrossRef] [PubMed]
  53. Pappas, R.S.; Fresquez, M.R.; Watson, C.H. Cigarette smoke cadmium breakthrough from traditional filters: Implications for exposure. J. Anal. Toxicol. 2015, 39, 45–51. [Google Scholar] [CrossRef]
  54. Paschal, D.C.; Burt, V.; Caudill, S.P.; Gunter, E.W.; Pirkle, J.L.; Sampson, E.J.; Miller, D.T.; Jackson, R.J. Exposure of the U.S. population aged 6 years and older to cadmium: 1988–1994. Arch. Environ. Contam. Toxicol. 2000, 38, 377–383. [Google Scholar] [CrossRef] [PubMed]
  55. Mortensen, M.E.; Wong, L.Y.; Osterloh, J.D. Smoking status and urine cadmium above levels associated with subclinical renal effects in U.S. adults without chronic kidney disease. Int. J. Hyg. Environ. Health 2011, 214, 305–310. [Google Scholar] [CrossRef] [PubMed]
  56. Kelly, J.T.; Su, G.; Zhang, L.; Qin, X.; Marshall, S.; González-Ortiz, A.; Clase, C.M.; Campbell, K.L.; Xu, H.; Carrero, J.J. Modifiable lifestyle factors for primary prevention of CKD: A systematic review and meta-analysis. J. Am. Soc. Nephrol. 2021, 32, 239–253. [Google Scholar] [CrossRef]
  57. Jin, A.; Koh, W.P.; Chow, K.Y.; Yuan, J.M.; Jafar, T.H. Smoking and risk of kidney failure in the Singapore Chinese health study. PLoS ONE 2013, 8, e62962. [Google Scholar] [CrossRef]
  58. Sacerdoti, D.; Escalante, B.; Abraham, N.G.; McGiff, J.C.; Levere, R.D.; Schwartzman, M.L. Treatment with tin prevents the development of hypertension in spontaneously hypertensive rats. Science 1989, 243, 388–390. [Google Scholar] [CrossRef]
  59. Escalante, B.; Sacerdoti, D.; Davidian, M.M.; Laniado-Schwartzman, M.; McGiff, J.C. Chronic treatment with tin normalizes blood pressure in spontaneously hypertensive rats. Hypertens 1991, 17, 776–779. [Google Scholar] [CrossRef]
  60. Watanabe, T.; Kataoka, Y.; Hayashi, K.; Matsuda, R.; Uneyama, C. Dietary exposure of the Japanese general population to elements: Total diet study 2013–2018. Food Saf. 2022, 10, 83–101. [Google Scholar] [CrossRef]
  61. Wong, C.; Roberts, S.M.; Saab, I.N. Review of regulatory reference values and background levels for heavy metals in the human diet. Regul. Toxicol. Pharmacol. 2022, 130, 105122. [Google Scholar] [CrossRef]
  62. Moffett, D.B.; Mumtaz, M.M.; Sullivan, D.W., Jr.; Whittaker, M.H. Chapter 13, General Considerations of Dose-Effect and Dose-Response Relationships. In Handbook on the Toxicology of Metals, 5th ed.; Volume I: General Considerations; Nord-berg, G., Costa, M., Eds.; Academic Press: Cambridge, MA, USA, 2022; pp. 299–317. [Google Scholar]
  63. JECFA. In Summary and Conclusions. In Proceedings of the Joint FAO/WHO Expert Committee on Food Additives and Contaminants, Seventy-Third Meeting, Geneva, Switzerland, 8–17 June 2010; JECFA/73/SC; Food and Agriculture Organization of the United Nations/World Health Organization: Geneva, Switzerland, 2011; Available online: https://apps.who.int/iris/handle/10665/44521 (accessed on 12 August 2023).
  64. EFSA Scientific Committee. Update: Use of the benchmark dose approach in risk assessment. EFSA J. 2017, 15, 4658. [Google Scholar]
  65. Butler-Dawson, J.; James, K.A.; Krisher, L.; Jaramillo, D.; Dally, M.; Neumann, N.; Pilloni, D.; Cruz, A.; Asensio, C.; Johnson, R.J.; et al. Environmental metal exposures and kidney function of Guatemalan sugarcane workers. J. Expo. Sci. Environ. Epidemiol. 2022, 32, 461–471. [Google Scholar] [CrossRef] [PubMed]
  66. Win-Thu, M.; Myint-Thein, O.; Win-Shwe, T.-T.; Mar, O. Environmental cadmium exposure induces kidney tubular and glomerular dysfunction in the Myanmar adults. J. Toxicol. Sci. 2021, 46, 319–328. [Google Scholar] [CrossRef] [PubMed]
  67. Skröder, H.; Hawkesworth, S.; Kippler, M.; El Arifeen, S.; Wagatsuma, Y.; Moore, S.E.; Vahter, M. Kidney function and blood pressure in preschool-aged children exposed to cadmium and arsenic-potential alleviation by selenium. Environ. Res. 2015, 140, 205–213. [Google Scholar] [CrossRef] [PubMed]
  68. Rodríguez-López, E.; Tamayo-Ortiz, M.; Ariza, A.C.; Ortiz-Panozo, E.; Deierlein, A.L.; Pantic, I.; Tolentino, M.C.; Es-trada-Gutiérrez, G.; Parra-Hernández, S.; Espejel-Núñez, A.; et al. Early-life dietary cadmium exposure and kidney function in 9-year-old children from the PROGRESS cohort. Toxics 2020, 8, 83. [Google Scholar] [CrossRef]
Figure 1. The relationship between eGFR and cadmium excretion rate. Scatterplots relate eGFR to log[(ECd/Ccr) × 105) in women (a) and men (b), women (c) and men (d) with low Cd burden and women (e) and men (f) with medium plus high Cd burden. Coefficients of determination (R2) and p-values are provided for all scatterplots together with numbers of participants in all subgroups. The cut-off values of (ECd/Ccr) × 100 for low, medium and high Cd burden in women were ≤1.44, 1.45–3.26, >3.26 µg/L filtrate, respectively. Corresponding cut-off values of (ECd/Ccr) × 100 in men were ≤1.25, 1.26–3.25, >3.25 µg/L filtrate.
Toxics 11 00755 g001
Figure 2. Albumin excretion rates among participants grouped by kidney function, cadmium burden and other risk factors. Scatterplots relate log[(Ealb/Ccr) × 104] to log[ECd/Ccr) × 105] in participants with (ECd/Ccr) × 100 < 1 and ≥ 1 µg/L filtrate (a,c). Coefficients of determination (R2) and p-values and numbers of participants are provided. Bar graphs depict mean log[(Ealb/Ccr) × 104] in participants with normal eGFR and (ECd/Ccr) × 100 < 1 and ≥ 1 µg/L filtrate (b,d). Normal eGFR was defined as eGFR > 60 mL/min/1.73 m2. Numbers of subjects are provided for all subgroups. All means were obtained via univariate covariance analysis with adjustment for covariates (age and BMI) and (smoking × hypertension × diabetes) interactions.
Toxics 11 00755 g002
Figure 3. Albumin excretion rates in participants grouped by blood cadmium and eGFR levels. Scatterplots relate log[(Ealb/Ccr) × 104] to eGFR in participants with low (a), middle (c) and high [Cd]b tertiles (e). Coefficients of determination (R2), p-values and numbers of subjects are provided for all scatterplots. Bar graphs depict mean log[(Ealb/Ccr) ×104] in participants of low (b), middle (d) and high [Cd]b tertiles (f) who had eGFR ≤ 60, 61–90 and > 90 mL/min/1.73 m2. All means were obtained via univariate covariance analysis with adjustment for covariates and interactions. The cut-off values of [Cd]b for low, middle and high tertiles were < 0.82, 0.83–2.63 and ≥ 2.64 µg/L, respectively. Arithmetic means (SD) of [Cd]b in low, middle and high tertiles were 0.31 (0.29), 1.86 (1.98) and 5.58 (3.28), respectively. For all tests, p-values ≤ 0.05 indicate statistically significant levels.
Toxics 11 00755 g003
Table 1. Characteristics of participants according to eGFR levels and gender.
ParametersAll
n = 482
Normal eGFR aLow eGFR
Women
n = 329
Men
n = 114
Women
n = 35
Men
n = 4
Age (years)51.8 ± 9.251.2 ± 8.749.8 ± 7.563.1 ± 11.356.0 ± 6.4
BMI (kg/m2)24.8 ± 4.025.3 ± 4.023.5 ± 3.7 ***24.0 ± 3.626.7 ± 5.2
eGFR b, mL/min/1.73 m290 ± 1993 ± 1594 ± 1451 ± 947 ± 11
Smoking (%)29.717.668.4 ***11.475.0 ##
Diabetes (%)18.316.713.245.750.0
Hypertension (%)48.349.840.454.3100
Systolic blood pressure129 ± 17129 ± 16127 ± 113138 ± 18147 ± 5
Diastolic blood pressure81 ± 1081 ± 1081 ± 1179 ± 886 ± 4
Serum creatinine, mg/dL0.82 ± 0.220.74 ± 0.130.92 ± 0.14 ***1.19 ± 0.311.68 ± 0.43 ##
Urine creatinine, mg/dL113 ± 73110 ± 74134 ± 72 ***72 ± 3373 ± 24
Urine albumin, mg/L21 ± 5713 ± 3129 ± 7760 ± 11886 ± 106
Blood Cd, µg/L2.60 ± 3.132.43 ± 2.963.13 ± 3.32 *2.19 ± 3.675.03 ± 5.03
Urine Cd, µg/L4.21 ± 5.664.44 ± 6.153.84 ± 4.043.31 ± 5.712.26 ± 2.80
Normalized to Ecr (Ex/Ecr) c
ACR, mg/g creatinine24 ± 7115 ± 4127 ± 7093 ± 181112 ± 139
Albuminuria (%) d15.011.417.034.4100 #
ECd/Ecr, µg/g creatinine4.05 ± 4.434.27 ± 4.463.32 ± 3.71 *4.63 ± 6.312.62 ± 3.04
Normalized to Ccr, (Ex/Ccr) e
(Ealb/Ccr) × 100, mg/L24 ± 8512 ± 3226 ± 67125 ± 252174 ± 205
Abnormal Ealb/Ccr (%) f16.912.917.046.9100 #
(ECd/Ccr) × 100, µg/L3.20 ± 3.733.05 ± 3.253.05 ± 3.415.14 ± 7.445.20 ± 6.80
n, number of subjects; eGFR, estimated glomerular filtration rate; BMI, body mass index; ACR, albumin-to-creatinine ratio; alb, albumin. a The cutoff eGFR of 60 mL/min/1.73 m2 was used to define departure from normalcy. b eGFR was determined with equations of the Chronic Kidney Disease Epidemiology Collaboration (CKD−EPI) [35]. c Ex/Ecr = [x]u/[cr]u, where x = alb or Cd. d Albuminuria is defined as ACR ≥ 20 mg/g for men and ≥30 mg/g for women. e Ex/Ccr = [x]u[cr]p/[cr]u, where x = alb or Cd [23]. f Abnormal Ealb/Ccr was defined as [(Ealb/Ccr) × 100] ≥ 20 mg/L of filtrate. Data for all continuous variables are arithmetic mean ± standard deviation (SD). For all tests, p ≤ 0.05 identifies statistical significance, determined with the Pearson Chi-Square test for differences between percentages and the Mann–Whitney U test for differences of means. For the normal eGFR group, *** p < 0.001; * p = 0.016–0.021. For the low eGFR group, ## p = 0.002; # p = 0.012–0.045.
Table 2. Predictors of eGFR in women and men.
Independent
Variables/Factors
eGFR, mL/min/1.73 m2
All, n = 444Women, n = 332Men, n = 113
βpβpβp
Age, years−0.503<0.001−0.511<0.001−0.472<0.001
BMI, kg/m2−0.0660.129−0.0500.310−0.1340.149
Log[(ECd/Ccr) × 105], µg/L filtrate−0.1210.022−0.1260.043−0.0970.367
Systolic pressure, mmHg−0.0870.134−0.0670.320−0.1470.230
Diastolic pressure, mmHg−0.0110.836−0.0200.7450.0220.856
Gender−0.0060.898
Smoking0.0330.4920.0310.5330.0340.710
Diabetes−0.1010.038−0.1190.036−0.0330.741
Adjusted R20.278<0.0010.279<0.0010.216<0.001
eGFR, estimated glomerular filtration rate; β, standardized regression coefficient; adjusted R2, coefficient of determination. Coding: male, 1, female, 2; non-smoker, 1, smoker, 2; non-diabetic, 1, diabetic, 2. β indicates strength of association of eGFR with eight independent variables (first column). Adjusted R2 indicates the proportion of eGFR variance explained by all independent variables. For all tests, p-values ≤ 0.05 indicate a statistically significant effect of individual independent variables on eGFR.
Table 3. Comparing strength of association of eGFR with cadmium excretion rate across cadmium burden groups.
Independent
Variables/Factors
eGFR, mL/min/1.73 m2
Low Cd BurdenMedium BurdenHigh Burden
βpβpβp
Age, years−0.455<0.001−0.505<0.001−0.410<0.001
BMI, kg/m2−0.0220.777−0.1360.064−0.0940.221
Log[(ECd/Ccr) × 105], µg/L filtrate0.0070.934−0.2300.002−0.349<0.001
Systolic pressure, mmHg−0.0380.722−0.2840.004−0.0500.611
Diastolic pressure, mmHg0.0870.3720.1130.226−0.1700.078
Gender−0.0240.798−0.0640.4340.1060.194
Smoking0.0940.324−0.0810.3010.1320.108
Diabetes−0.1280.1040.0890.2600.0220.775
Adjusted R20.248<0.0010.321<0.0010.255<0.001
eGFR, estimated glomerular filtration rate; β, standardized regression coefficient; adjusted R2, coefficient of determination. Coding: male, 1, female, 2; non-smoker, 1, smoker, 2; non-diabetic, 1, diabetic, 2. β indicates strength of association of eGFR with eight independent variables (first column). Adjusted R2 indicates the proportion of eGFR variance explained by all independent variables. The cut-off values of (ECd/Ccr) × 100 for the low, medium and high Cd burdens in women were ≤1.44, 1.45–3.26, >3.26 µg/L filtrate, respectively. Corresponding cut-off values of (ECd/Ccr) × 100 in men were ≤1.25, 1.26–3.25, >3.25 µg/L filtrate. The numbers of subjects in low, moderate and high Cd burdens were 147, 148 and 147, respectively. For all tests, p-values ≤ 0.05 indicate a statistically significant effect of individual independent variables on eGFR.
Table 4. Prevalence odds ratios for low eGFR in relation to cadmium body burden and other independent variables.
Independent Variables/FactorsLow eGFR
All, n = 446Women, n = 332Men, n = 114
POR (95% CI)pPOR (95% CI)pPOR (95% CI)p
Age, years1.118 (1.062, 1.176)<0.0011.114 (1.057, 1.175)<0.0011.291 (0.935, 1.783)0.120
BMI, kg/m21.002 (0.908, 1.106)0.9671.029 (0.923, 1.147)0.6041.351 (0.876, 2.084)0.174
Gender0.482 (0.133, 1.742)0.265
Smoking1.388 (0.433, 4.450)0.5821.123 (0.300, 4.206)0.8630.495 (0.018, 13.92)0.679
Diabetes3.042 (1.126, 8.213)0.0282.709 (0.932, 7.878)0.0673.713 (0.110, 125.6)0.465
Hypertension1.175 (0.516, 2.679)0.7011.228 (0.505, 2.990)0.6512.478 (1.983, 3.098)0.030 a
Cd body burden
LowReferent Referent Referent
Medium8.265 (1.711, 39.92)0.0097.204 (1.438, 36.10)0.016n/an/a
High3.643 (1.150, 11.54)0.0283.218 (0.934, 11.09)0.064n/an/a
POR, prevalence odds ratio; CI, confidence interval; BMI, body mass index; eGFR, estimated glomerular filtration rate. Coding, male 1, female 2; non-smoker 1, smoker 2; non-diabetic 1, diabetic 2; code 1 is referent. Data were generated from logistic regression relating POR for low eGFR to seven independent variables (first column). a Effect of hypertension was assessed by Fisher’s exact test using data from 118 men. The cut-off values of (ECd/Ccr) × 100 for the low, medium and high Cd burdens in women were ≤1.44, 1.45–3.26, >3.26 µg/L filtrate, respectively. Corresponding cut-off values of (ECd/Ccr) × 100 in men were ≤1.25, 1.26–3.25, >3.25 µg/L filtrate. For all tests, p-values ≤ 0.05 indicate a statistically significant effect of individual independent variables to the POR for low eGFR.
Table 5. Comparing strength of association of albumin excretion rate with cadmium excretion rate across cadmium burden groups.
Independent
Variables/Factors
Log [(Ealb/Ccr) × 104], µg/L Filtrate
Low Cd BurdenMedium BurdenHigh Burden
βpβpβp
Age, years0.0490.609−0.0190.846−0.0820.381
BMI, kg/m2−0.0070.9320.2480.004−0.0210.803
Log[(ECd/Ccr) × 105], µg/L filtrate 0.1770.0500.1440.0980.1730.044
eGFR, mL/min/1.73 m2−0.1100.216−0.1470.130−0.2140.021
Gender−0.1500.122−0.1110.2330.1390.120
Smoking−0.1830.0640.0240.7880.1290.153
Diabetes0.2630.0010.0930.2800.1150.176
Hypertension0.278<0.0010.1210.1480.1040.204
Adjusted R20.174<0.0010.1030.0030.0820.009
eGFR, estimated glomerular filtration rate; β, standardized regression coefficient; adjusted R2, coefficient of determination. Coding: male, 1, female, 2; non-smoker, 1, smoker, 2; non-diabetic, 1, diabetic, 2. β indicates strength of association of eGFR with eight independent variables (first column). Adjusted R2 indicates the proportion of eGFR variance explained by all independent variables. The cut-off values of (ECd/Ccr) × 100 for the low, medium and high Cd burdens in women were ≤1.44, 1.45–3.26, >3.26 µg/L filtrate, respectively. Corresponding cut-off values of (ECd/Ccr) × 100 in men were ≤1.25, 1.26–3.25, >3.25 µg/L filtrate. The numbers of subjects in low, medium and high Cd burdens were 147, 148 and 149, respectively. For all tests, p-values ≤ 0.05 indicate a statistically significant effect of individual independent variables on eGFR.
Table 6. Comparing strength of association of albumin excretion rate with cadmium excretion rate and other variables in participants grouped by eGFR.
Independent
Variables/Factors
Log [(Ealb/Ccr) × 104], µg/L Filtrate
AllNormal eGFRLow eGFR
βpβpβp
Age, years−0.0230.710−0.0160.8030.1630.373
BMI, kg/m20.0530.2650.0330.5220.3630.040
Log[(ECd/Ccr) × 105], µg/L filtrate 0.1040.0780.0410.5110.6370.008
eGFR, mL/min/1.73 m2−0.188<0.001−0.0720.193−0.0990.505
Gender−0.0100.8510.0020.974−0.0840.590
Smoking0.0260.6240.0100.8630.0140.934
Diabetes0.219<0.0010.1730.0020.5610.006
Hypertension0.167<0.0010.1500.0020.2460.130
Adjusted R20.115<0.0010.0470.0020.5220.001
eGFR, estimated glomerular filtration rate; β, standardized regression coefficient; adjusted R2, coefficient of determination. Coding: male, 1, female, 2; non-smoker, 1, smoker, 2; non-diabetic, 1, diabetic, 2. β indicates strength of association of log[(Ealb/Ccr) × 104] with eight independent variables (first column). Adjusted R2 indicates the proportion of log[(Ealb/Ccr) × 104] variance explained by all independent variables. Normal and low eGFR groups were defined as eGFR > 60 and ≤60 mL/min/1.73 m2, respectively. Respective numbers of subjects with normal and low eGFR were 416 and 31. For all tests, p-values ≤ 0.05 indicate a statistically significant effect of individual independent variables on albumin excretion rate.
Table 7. Prevalence odds ratios for albuminuria in relation to blood Cd levels and other independent variables.
Independent
Variables/Factors
Albuminuria, (Ealb/Ccr) ×100 ≥ 20 mg/L Filtrate
All, n = 473Women, n = 357Men, n = 116
POR (95% CI)pPOR (95% CI)pPOR (95% CI)p
Age, years0.990 (0.955, 1.027)0.6091.007 (0.965, 1.051)0.7330.988 (0.904, 1.079)0.781
BMI, kg/m21.028 (0.957, 1.104)0.4481.033 (0.950, 1.123)0.4501.011 (0.877, 1.166)0.881
eGFR, mL/min/1.73 m21.043 (1.026, 1.061)<0.0011.045 (1.025, 1.065)<0.0011.045 (1.008, 1.084)0.017
Gender0.559 (0.273, 1.146)0.112
Smoking1.037 (0.494, 2.177)0.9241.258 (0.496, 3.192)0.6290.809 (0.254, 2.572)0.719
Diabetes6.021 (2.813, 12.89)<0.0015.996 (2.446, 14.69)<0.0018.324 (1.642, 42.21)0.011
Hypertension2.053 (1.167, 3.609)0.0132.785 (1.397, 5.552)0.0041.133 (0.371, 3.463)0.827
Tertile of [Cd]b, µg/L
Low: <0.82Referent Referent Referent
Middle: 0.83–2.632.360 (1.097, 5.076)0.0283.402 (1.324, 8.745)0.0110.925 (0.237, 3.604)0.911
High: ≥2.642.740 (1.174, 6.394)0.0203.783 (1.369, 10.46)0.0101.425 (0.263, 7.732)0.681
POR, prevalence odds ratio; CI, confidence interval; BMI, body mass index; eGFR, estimated glomerular filtration rate; [Cd]b, blood Cd concentration. Coding, male 1, female 2; non-smoker 1, smoker 2; non-diabetic 1, diabetic 2; code 1 is referent. Data were generated from logistic regression relating POR for albuminuria to seven independent variables (first column). Arithmetic means (SD) of blood Cd in low, middle and high tertiles were 0.31 (0.29), 1.86 (1.98), 5.58 (3.28), respectively. Corresponding numbers of subjects were 157, 164 and 161, respectively. For all tests, p-values ≤ 0.05 indicate a statistically significant effect of individual independent variables to the POR for albuminuria.
Disclaimer/Publisher’s Note: The statements, opinions and data contained in all publications are solely those of the individual author(s) and contributor(s) and not of MDPI and/or the editor(s). MDPI and/or the editor(s) disclaim responsibility for any injury to people or property resulting from any ideas, methods, instructions or products referred to in the content.

